Z-Stack Digital Scanning of Parasite Specimens: A Modern Framework for Research and Drug Development
This article explores the application of Z-stack whole-slide imaging (WSI) for digitizing parasite slide specimens, a critical advancement for morphological research and diagnostics.
Z-Stack Digital Scanning of Parasite Specimens: A Modern Framework for Research and Drug Development
Abstract
This article explores the application of Z-stack whole-slide imaging (WSI) for digitizing parasite slide specimens, a critical advancement for morphological research and diagnostics. As traditional microscopy skills decline and access to physical specimens becomes limited, Z-stack digital databases offer a powerful solution for preserving, sharing, and analyzing rare parasitological samples. We cover the foundational principles of Z-stacking, detailed methodologies for creating digital parasite databases, strategies for optimizing scan quality and managing large data files, and a comparative analysis of diagnostic accuracy and AI applications. This resource is tailored for researchers, scientists, and drug development professionals seeking to leverage digital pathology to overcome current challenges in parasitology.
The Urgent Need for Digital Parasitology: Overcoming the Morphology Gap with Z-Stacking
The Challenge of Declining Morphological Expertise and Scarce Specimens
The field of parasitology faces a critical juncture. In an era of advanced molecular diagnostics, traditional morphological expertise—the ability to identify parasites based on their physical characteristics—is in steep decline. Concurrently, the slide specimens essential for training and research have become increasingly scarce in many regions due to improved sanitation and reduced parasite prevalence [1]. This dual challenge threatens both accurate diagnosis of parasitic infections and future research into new therapeutic interventions. However, emerging digital technologies, particularly high-resolution slide scanning with Z-stack imaging and artificial intelligence (AI)-based analysis, offer promising solutions to preserve and enhance our morphological understanding of parasites [1] [2].
The decline in morphological expertise has significant implications for patient care, public health, and epidemiology. Despite advancements in non-morphological diagnostic methods, microscopy-based morphologic analysis remains the gold standard for diagnosing many parasitic infections [1]. This knowledge gap is particularly concerning for drug development professionals who rely on accurate parasite staging and characterization for evaluating potential antimalarial compounds [3].
The Scope of the Problem
Quantifying the Expertise Gap
The reduction in morphological expertise stems from multiple factors. Over the past two decades, educational institutions in developed countries have allocated significantly less time to parasitology education for medical technologists [1]. This trend is reflected globally in the decreasing number of hours devoted to parasitology lectures in medical education programs [1]. A crucial contributing factor is the difficulty in obtaining specimens for educational purposes due to reduced parasitic infections resulting from improved sanitary conditions [1]. Consequently, only limited parasite egg or body part specimens are available in training schools, and these specimens deteriorate over time owing to repeated use [1].
Implications for Drug Development Research
The decline in morphological expertise extends beyond clinical diagnosis to impact drug development research. For Plasmodium falciparum, the deadliest malaria parasite, enumeration of asexual blood stages is fundamental to determining the potency of antimalarial compounds [3]. Differentiation and quantification of these stages sheds light on what parasite processes these compounds target [3]. While light microscopy remains the mainstay for differentiating asexual stages, this process is time-consuming, requires extensive training, and can be variable between microscopists [3]. This variability introduces significant challenges in standardizing drug efficacy assessments across research laboratories.
Digital Solutions: Z-Stack Imaging and AI Analysis
Whole Slide Imaging with Z-Stack Technology
Whole-slide imaging (WSI) technology provides a powerful approach for digitizing glass specimens, creating permanent digital records that do not deteriorate over time [1]. For thicker specimens or those with uneven surfaces, Z-stack imaging is essential for capturing comprehensive morphological data. Z-stack imaging involves collecting images in multiple optical planes by varying the scan depth, accumulating layer-by-layer data to accommodate thicker samples [1].
The technical implementation of Z-stack imaging requires specific protocols:
- Setting Z-Parameters: Using "z-Wide" mode rather than "z-Galvo" mode on compatible systems [4]
- Defining Stack Limits: Finding the region of interest, clicking "Live" to scan, then adjusting gain and offset before turning the focus knob in one direction until the useful signal starts to disappear to set the "Begin" point, then turning the knob in the opposite direction past the sample to set the "End" point [4]
- Optimal Section Thickness: Using "System Optimized" settings that automatically select recommended optical section thickness based on the objective and laser line in use [4]
- Multi-channel Verification: Checking every channel when imaging multiple fluorophores, as Z-stack limits based on one channel might cut out signal from another [4]
After scanning, Z-stacks can be merged using "Maximum Projection" to create a detailed 3-dimensional representation of the sample, or edited using "Crop" functions to isolate specific regions of interest [4].
Database Development and Access
The creation of digital parasite specimen databases represents a significant advancement for both education and research. One preliminary database successfully digitized 50 slide specimens of parasites (eggs and adults) and arthropods from university collections, including specimens typically observed at both low magnification (40x) such as parasite eggs and adults, and high magnification (1000x) such as malarial parasites [1]. These virtual slides were compiled into a digital database with folders organized by taxon, accompanied by explanatory notes in multiple languages to facilitate learning [1].
Such databases offer several advantages:
- Prevention of deterioration: Virtual slides do not deteriorate over time
- Wide accessibility: Shared servers enable approximately 100 individuals to access data simultaneously via web browsers without specialized viewing software [1]
- Remote collaboration: Data can be shared over a wide area via the internet [1]
- Standardized reference materials: Consistent morphological examples available across institutions
Artificial Intelligence and Machine Learning Applications
Artificial intelligence-based digital pathology (AI-DP) is revolutionizing parasite identification and classification. These systems typically use convolutional neural networks to find ova, parasites, and other diagnostically significant objects in digitized slides [5]. The workflow generally involves slide preparation, scanning, AI analysis, and technologist review of the results [5].
For malaria research, high-content imaging paired with machine learning enables automated classification and clustering of cell populations. One approach can robustly differentiate and quantify P. falciparum asexual blood stages and even quantify schizont nuclei—a phenotype that previously had to be enumerated manually [3]. This technology allows researchers to monitor stage progression and quantify parasite phenotypes, enabling discernment of stage specificity of new compounds and providing insight into their mode of action [3].
More advanced implementations use deep learning for continuous single-cell imaging of dynamic processes. One workflow enables continuous, single-cell monitoring of live parasites throughout the 48-hour intraerythrocytic life cycle with high spatial and temporal resolution by integrating label-free, three-dimensional differential interference contrast and fluorescence imaging using an Airyscan microscope, automated cell segmentation through pre-trained deep-learning algorithms, and 3D rendering for visualization and time-resolved analyses [6].
Quantitative Assessment of Digital Methodologies
Table 1: Performance Metrics of Digital Parasitology Technologies
| Technology | Application | Accuracy/Performance | Reference |
|---|---|---|---|
| High-content imaging + ML | P. falciparum stage classification | Robust differentiation of asexual blood stages; nuclei enumeration | [3] |
| Cellpose Model (3D) | Infected erythrocyte segmentation | AP₀.₅: 0.54-0.95 (varies by model) | [6] |
| AI-DP for STH | Soil-transmitted helminth detection | Meets WHO TPP minimal requirements for M&E | [2] |
| Fusion Parasitology Suite | Ova and parasite screening | Sensitivity: 98.9%; Specificity: 98.1% (preliminary single-site) | [5] |
Table 2: Comparison of Parasite Preservation Methods for Morphological Studies
| Preservation Method | Advantages | Limitations | Optimal Use Cases |
|---|---|---|---|
| Fluid preservation (10% formalin → 70% ethanol) | Minimal reduction in parasite detectability; suitable for long-term storage | May alter tissue properties and coloration | Museum collections; historical ecology studies [7] |
| Ethanol (70-80%) | Best general killing/preserving agent; good for molecular studies | Can harden specimens; not ideal for all insect groups | Soft-bodied insects; field collections [8] |
| Ethanol (95-100%) | Prevents wing twisting/hair matting; ideal for DNA preservation | Can distort soft-bodied insects | Molecular studies; parasitic hymenoptera [8] |
| Dry preservation | Standard for many insects; space efficient | Soft-bodied insects may shrivel; mold risk with moisture | Lepidoptera, beetles, hard-bodied insects [8] |
Experimental Protocols
Protocol 1: Digital Slide Database Creation Using Z-Stack Scanning
Purpose: To create high-resolution digital representations of physical parasite specimens for education and research applications.
Materials and Equipment:
- Slide scanner with Z-stack capability (e.g., SLIDEVIEW VS200, Hamamatsu S360)
- Glass slide specimens
- Shared server infrastructure (Windows Server 2022 or equivalent)
- Image review workstation
Procedure:
- Select slide specimens representing diverse parasite taxa (eggs, adults, arthropods)
- Individually scan each slide using Z-stack function to accommodate varying specimen thickness
- Rescan slides with out-of-focus areas as needed, selecting clearest images
- Upload final images to shared server with folder organization based on taxonomic classification
- Review all digital images for focus and clarity before database incorporation
- Attach explanatory text to each specimen in multiple languages
- Implement access controls requiring user identification and password [1]
Quality Control:
- All digital images must be reviewed for focus and image clarity before incorporation
- Implement regular backup procedures to prevent data loss
- Establish metadata standards for specimen information
Protocol 2: High-Content Imaging and Machine Learning for Antimalarial Drug Assessment
Purpose: To automatically discern and enumerate P. falciparum asexual blood stages and subcellular organelles to determine stage-specific drug effects.
Materials and Reagents:
- Operetta CLS or similar high-content imaging system
- Harmony High-Content Imaging and Analysis software with PhenoLOGIC
- CellMask Orange plasma membrane stain
- Hoechst 33342 (DNA stain)
- MitoTracker Deep Red (mitochondrial membrane potential stain)
- SYTO RNASelect (RNA stain)
- 20× air objective and 40× water objective
Procedure:
- Prepare blood stage P. falciparum cultures with appropriate staining:
- For 20× imaging: Cells can be imaged live or fixed using aldehyde-based fixative
- For 40× imaging: Image live only (fixatives incompatible with MDR and SYTO)
- Use bright field for RBC quantification at 20× magnification
- Use CellMask Orange for RBC quantification at 40× magnification
- Image using appropriate channels for DNA, mitochondria, and RNA
- Apply machine learning classification to:
- Identify and enumerate infected RBCs
- Distinguish and quantify asexual blood stages (rings, trophozoites, schizonts)
- Enumerate nuclei within schizonts [3]
- Quantify stage-specific phenotypes and morphological changes in drug-treated parasites
Quality Control:
- Include control specimens with known parasite stages for algorithm validation
- Validate automated counts against manual enumeration for subset of samples
- Optimize staining protocols to ensure consistent signal-to-noise ratio
The Scientist's Toolkit: Essential Research Reagent Solutions
Table 3: Key Research Reagents for Digital Parasitology Studies
| Reagent/Resource | Function | Application Examples |
|---|---|---|
| CellMask Orange | Plasma membrane staining | RBC quantification at 40× magnification [3] |
| Hoechst 33342 | DNA staining | Identification of parasite nuclei and staging [3] |
| MitoTracker Deep Red | Mitochondrial membrane potential staining | Differentiation of live vs. dead parasites [3] |
| SYTO RNASelect | RNA staining | Visualization of parasite cytoplasm and morphology [3] |
| CellBrite Red | Membrane dye for annotation | Training data creation for segmentation algorithms [6] |
| Cellpose | Convolutional neural network for segmentation | 2D and 3D image analysis of infected erythrocytes [6] |
| Ilastik | Interactive machine learning tool | Volume segmentation based on boundary information [6] |
| Techcyte AI Algorithm | Convolutional neural network for O&P | Finding ova, parasites, and diagnostically significant objects [5] |
Workflow Integration and Implementation Strategies
The integration of digital pathology for parasitology requires careful planning of workflows and data management. The following diagram illustrates a comparative workflow between traditional microscopy and AI-enhanced digital pathology:
Diagram 1: Comparative Workflows for Traditional and Digital Parasitology
Successful implementation of digital parasitology platforms requires addressing several practical considerations:
Scanner Selection: Choose whole-slide scanners compatible with planned specimen types (e.g., Hamamatsu S360, Grundium Ocus 40, or Pramana M Pro for 40x scanning) [5]
Data Management: Implement electronic data capture systems to track specimens throughout the digital workflow, using labels with QR codes for sample tracking [2]
Validation Protocols: Establish rigorous validation procedures comparing digital results with manual microscopy, with particular attention to sensitivity and specificity requirements for intended applications [5] [2]
Training Requirements: Develop training programs for both technical staff operating scanning equipment and researchers interpreting AI-generated results
The decline in morphological expertise and scarcity of physical specimens represent significant challenges for parasitology research and drug development. However, digital technologies—particularly Z-stack imaging and AI-based analysis—offer robust solutions to preserve our morphological heritage while enhancing research capabilities. By creating comprehensive digital specimen databases, implementing automated analysis pipelines, and integrating these tools into both education and research workflows, the scientific community can not only preserve existing morphological knowledge but also extract new insights from parasite biology that accelerate drug development efforts.
These digital approaches enable more standardized, quantitative assessments of parasite morphology and drug effects while making specialized expertise more accessible across institutions and geographical boundaries. As these technologies continue to evolve, they hold the potential to transform how we study, diagnose, and develop treatments for parasitic diseases in the 21st century.
What is Z-Stacking? Principles of Multi-Focal Plane Imaging
Z-stacking is an advanced digital imaging technique that involves capturing multiple images of a specimen at different focal planes and combining them into a single composite image with an extended depth of field [9]. This method creates a three-dimensional (3D) representation of the specimen, allowing researchers to view the entire thickness of a sample in sharp focus, which is particularly valuable when analyzing thicker specimens where structures of interest reside at varying depths [9].
In the context of parasitic slide specimen research, Z-stacking overcomes the critical limitation of conventional microscopy where only a small part of a thick sample is in sharp focus at any given time due to the narrow depth of field of high-magnification objectives [9]. For drug development professionals, this technique provides a more accurate representation of parasite morphology, spatial distribution within host tissues, and structural responses to therapeutic interventions, thereby enhancing diagnostic accuracy and research precision.
Core Principles of Z-Stacking Technology
Fundamental Optical Principles
The principle of Z-stacking is founded on addressing the limited depth of field in microscopy. When observing a sample through a microscope, only a thin slice corresponding to the focal plane appears sharp, while areas above and below appear blurred [9]. Z-stacking systematically addresses this by capturing multiple images at different focal points from the top to the bottom of the sample [9]. Each captured image contains a different region in sharp focus, and computational algorithms then combine these images to produce a single composite image where the entire depth of the sample is displayed with clarity [9].
Technical Implementation in Whole Slide Imaging
In whole slide imaging (WSI) systems, Z-stacking is implemented through computer-controlled microscopes equipped with precision mechanical components [9]. Key components include:
- Microscope with objectives: High-precision lenses for image capture
- Brightfield or fluorescent light sources: For specimen illumination
- Robotic positioning systems: For accurate slide movement and repositioning
- Digital cameras: With advanced optical sensors for image acquisition
- Computer systems: For processing power and data management
- Specialized software: For processing, managing, and displaying digital slides
Some advanced WSI scanners employ dynamic refocusing systems that use one camera for focusing and another for scanning, significantly accelerating the scanning process [9]. The scanning speed typically ranges from 1 to 3 minutes per slide, depending on the magnification and the number of Z-stacks required [9].
Z-Stacking Applications in Parasitology Research
Enhanced Morphological Analysis
Z-stacking enables detailed visualization of parasite structures that extend through different focal planes. For drug development researchers, this capability is crucial for accurately assessing morphological changes in parasites following drug exposure. The technique allows for clear imaging of complex 3D structures such as:
- Protozoan invasion mechanisms and host cell penetration
- Helminth surface teguments and attachment organs
- Intracellular parasite forms within host tissues
- Parasite egg morphology and developmental stages
Machine Learning and Automated Classification
Advanced applications of Z-stacking in parasitology research involve machine learning classifiers that utilize the axial information from Z-stacks to identify and segment specific cellular structures [10]. This approach uses the unique intensity profile of each pixel along the z-axis (z-pixels) to classify image regions without relying solely on in-focus morphological features [10].
Research demonstrates that this method successfully identifies different cell morphologies with classification errors of less than 1% when Z-stacks contain at least seven images [10]. For parasitology, this enables automated identification and quantification of parasites within complex host tissues, significantly accelerating research workflows in drug screening applications.
3D Reconstruction and Spatial Analysis
Z-stacking facilitates digital reconstruction of 3D structures, allowing researchers to study the spatial organization of parasites within host tissues [9]. This is particularly valuable for understanding:
- Parasite migration pathways through host organs
- Colonization patterns in tissue layers
- Host-parasite interface at the subcellular level
- Drug distribution and penetration in infected tissues
Experimental Protocols for Parasite Slide Z-Stacking
Z-Stack Acquisition Protocol for Parasite Specimens
Materials Required:
- Parasite slide specimens (thin or thick blood smears, tissue sections)
- Motorized microscope with Z-axis control
- Image acquisition software with Z-stack functionality
- Immersion oil (for oil immersion objectives)
- Calibrated slide with micrometer for system validation
Step-by-Step Procedure:
Slide Preparation and Mounting
- Place parasite specimen slide on motorized stage
- Ensure secure mounting to prevent movement during acquisition
- Apply appropriate immersion medium if using high-NA objectives
System Initialization and Calibration
- Initialize microscope and camera system
- Perform flat-field correction for illumination uniformity
- Calbrate Z-axis step size using reference specimens
Focal Range Determination
- Manually identify top and bottom focal limits of the specimen
- Set Z-range to encompass entire specimen thickness with buffer
- For parasite specimens, typically 5-20μm range depending on specimen type
Acquisition Parameter Optimization
- Set optimal step size based on Nyquist sampling criteria (typically 0.2-0.5μm)
- Configure exposure settings for each channel (brightfield/fluorescence)
- Establish optimal overlap between optical sections
Automated Z-Stack Acquisition
- Initiate automated capture sequence through control software
- Monitor acquisition progress for any errors or stage drift
- Verify image quality at multiple focal planes during acquisition
Image Storage and Backup
- Save raw Z-stack data in appropriate file format
- Create backup copies of original data before processing
- Document acquisition parameters in laboratory notebook
Z-Stack Processing and Analysis Protocol
Image Processing Steps:
Stack Pre-processing
- Apply flat-field correction if not done during acquisition
- Correct for minor stage drift using registration algorithms
- Normalize intensity across slices
Stack Composition
- Select appropriate algorithm for composite image generation
- Choose method based on specimen characteristics:
- Maximum intensity projection: For fluorescence specimens
- Extended depth of focus: For brightfield specimens
- Weighted average: For mixed specimens
Quality Assessment
- Verify focus quality throughout composite image
- Check for artifacts or misalignments
- Compare with original slices for accuracy
Quantitative Analysis
- Perform measurements on composite images
- Conduct 3D analysis using original stack data
- Generate quantitative data for statistical analysis
Machine Learning Classification Protocol for Parasite Identification
Based on established methodology for Z-pixel classification [10]:
Training Set Construction
- Acquire Z-stacks of representative parasite specimens
- Manually label regions of interest using graphical interface
- Define classes: "parasite," "host cell," "background," etc.
Data Preprocessing
- Normalize images using standard histogram equalization
- Extract z-pixel intensity profiles for each labeled region
- Apply Principal Component Analysis to reduce dimensionality
Classifier Training
- Utilize Support Vector Machine or Random Forest algorithms
- Train classifier on reduced-dimension dataset
- Validate classifier performance with test dataset
Prediction and Segmentation
- Apply trained classifier to new Z-stacks
- Generate probability maps for each class
- Refine segmentation using confidence scores
Quantitative Analysis and Data Presentation
Comparison of 2D vs 3D Distance Measurements in Microscopy
Table 1: Comparative analysis of 2D and 3D distance measurement approaches for microscopic analysis of biological structures [11]
| Parameter | 2D Measurements | 3D Measurements |
|---|---|---|
| Accuracy | Moderate, especially for non-flat cells | Higher accuracy for volumetric samples |
| Precision | Good for comparative analyses | Superior for theoretical modeling |
| Susceptibility to Noise | Less prone to noise | More prone to noise and optical aberrations |
| Resolution Limitations | Limited by pixel size in x-y plane | Limited by axial resolution (typically lower than lateral) |
| Sampling Requirements | Single focal plane | Requires optimal z-sampling frequency |
| Computational Requirements | Lower | Higher processing and storage needs |
| Suitability for Parasite Research | Preferred for comparative analyses between cells | Preferred when comparing to theoretical models in large cell samples |
Z-Stack Sampling Optimization Parameters
Table 2: Optimal sampling parameters for Z-stack acquisition based on Nyquist criteria [12]
| Objective Lens | Theoretical Axial Resolution | Recommended Step Size | Minimum Number of Slices for 10μm Specimen |
|---|---|---|---|
| 10x Air (NA 0.3) | 4.2 μm | 2.0 μm | 5 |
| 20x Air (NA 0.7) | 1.2 μm | 0.6 μm | 17 |
| 40x Oil (NA 1.3) | 0.5 μm | 0.25 μm | 40 |
| 60x Oil (NA 1.4) | 0.4 μm | 0.2 μm | 50 |
| 100x Oil (NA 1.45) | 0.3 μm | 0.15 μm | 67 |
Performance Metrics of Z-Pixel Classification
Table 3: Classification accuracy for different biological structures using Z-stack machine learning approach [10]
| Cell Type | Classification Error | Minimum Z-Slices Required | Optimal Z-Spacing | Processing Time (per 1000x1000 stack) |
|---|---|---|---|---|
| E. coli | <1% | 7 | 100 nm | ~1 minute |
| S. cerevisiae | <1.5% | 10 | 200 nm | ~1.5 minutes |
| Mammalian cells | <2% | 15 | 150 nm | ~2 minutes |
| Mixed culture | <2.5% | 12 | 150 nm | ~2 minutes |
Research Reagent Solutions and Essential Materials
Table 4: Essential research reagents and materials for Z-stack imaging of parasite specimens
| Item | Function | Application Notes |
|---|---|---|
| Motorized Z-stage | Precision control of focal plane | Enables automated acquisition of multiple focal planes; requires sub-micrometer precision |
| High-NA Objective Lenses | Optimal resolution and light collection | Oil immersion objectives (NA 1.3-1.45) provide best axial resolution |
| Immersion Oil | Medium for high-NA objectives | Matches refractive index of glass; reduces spherical aberration |
| Microfluidic Chambers | Cell culture and immobilization | Maintains parasite viability during time-lapse Z-stack acquisition |
| Fluorescent Labels | Specific structure identification | Allows multiplexing of different parasite structures; requires appropriate filter sets |
| Antifading Reagents | Prevents photobleaching | Essential for fluorescence Z-stacks with multiple slices |
| Refractive Index Matching Solutions | Reduces spherical aberration | Improves image quality throughout Z-stack |
| Calibration Slides | System validation | Verifies XYZ resolution and alignment before specimen imaging |
Workflow Visualization
Z-Stack Acquisition and Analysis Workflow for Parasite Specimens
Principle of Multi-Focal Plane Imaging in Z-Stacking
Application Notes
The digital scanning of parasite slide specimens represents a significant advancement for parasitology education and research. This technology directly addresses two critical challenges: the degradation of rare physical specimens and limited access to specialized morphological knowledge. By creating high-fidelity virtual slides, institutions can preserve fragile biological materials indefinitely and distribute them simultaneously to a global audience of researchers and students [1].
The implementation of a digital database using whole-slide imaging (WSI) technology ensures that rare parasite specimens, which are becoming increasingly difficult to acquire in developed nations due to improved sanitation and declining infection rates, are conserved for future generations [1]. Simultaneously, this digital transformation facilitates widespread access, allowing approximately 100 users to observe specimen data concurrently via web browsers on various devices without specialized viewing software, thus breaking down geographical and institutional barriers [1].
Table 1: Performance and Outcome Metrics from a Digital Parasite Specimen Database Implementation
| Metric Category | Specific Outcome | Quantitative/Qualitative Result | Significance |
|---|---|---|---|
| Specimen Volume | Total Slides Digitized | 50 slides [1] | Represents a foundational collection of parasite eggs, adults, and arthropods. |
| Technical Performance | Successful Scanning Rate | 100% of slides [1] | All specimens, from low-magnification eggs to high-magnification malarial parasites, were successfully digitized. |
| Access Capacity | Simultaneous User Access | ~100 users [1] | Enables collaborative learning and large-scale educational sessions without physical specimen constraints. |
| Accessibility | Language Support | Bilingual (English & Japanese) explanatory texts [1] | Enhances utility for both domestic and international users and researchers. |
| Data Integrity | Specimen Preservation | Prevents deterioration from repeated use [1] | Ensures long-term availability of rare and fragile specimens for future study. |
Experimental Protocols
Protocol for the Construction of a Digital Parasite Specimen Database
This protocol outlines the methodology for digitizing a collection of parasite slide specimens to create an accessible digital database for education and research, based on a published study [1].
Research Reagent Solutions and Essential Materials
Table 2: Key Materials and Equipment for Slide Digitization
| Item Name | Function/Application | Specification/Note |
|---|---|---|
| Archived Slide Specimens | Source of morphological data for digitization. | 50 slides of parasite eggs, adults, and arthropods; devoid of personal information [1]. |
| SLIDEVIEW VS200 Slide Scanner | High-resolution digital acquisition of slide images. | Manufactured by EVIDENT Corporation; capable of Z-stack scanning [1]. |
| Z-stack Function | Image acquisition at varying focal depths. | Critical for capturing clear images of thicker smears [1]. |
| Shared Server (Windows Server 2022) | Hosting platform for the virtual slide database. | Allows secure, simultaneous multi-user access via web browsers [1]. |
Step-by-Step Procedure
- Specimen Selection and Preparation: Retrieve and compile existing slide specimens. Ensure slides are clean and free of personal identifying information. In the referenced study, specimens were provided by Kyoto University and Kyoto Prefectural University of Medicine [1].
- Digital Scanning: Employ a professional slide scanner. Engage the Z-stack function for specimens with thicker smears to accumulate layer-by-layer data and ensure overall image clarity [1].
- Image Quality Control: Review all digitized images for focus and clarity. Rescan any slides with out-of-focus areas as needed to select the clearest image for the final database [1].
- Database Structuring: Upload the final, approved digital images to a shared server. Organize the database folder structure according to the taxonomic classification of the organisms [1].
- Annotation and Access Setup: Attach simple explanatory notes to each specimen in relevant languages (e.g., English and Japanese) to facilitate learning. Implement a secure access system requiring an ID and password for authorized educational and research use [1].
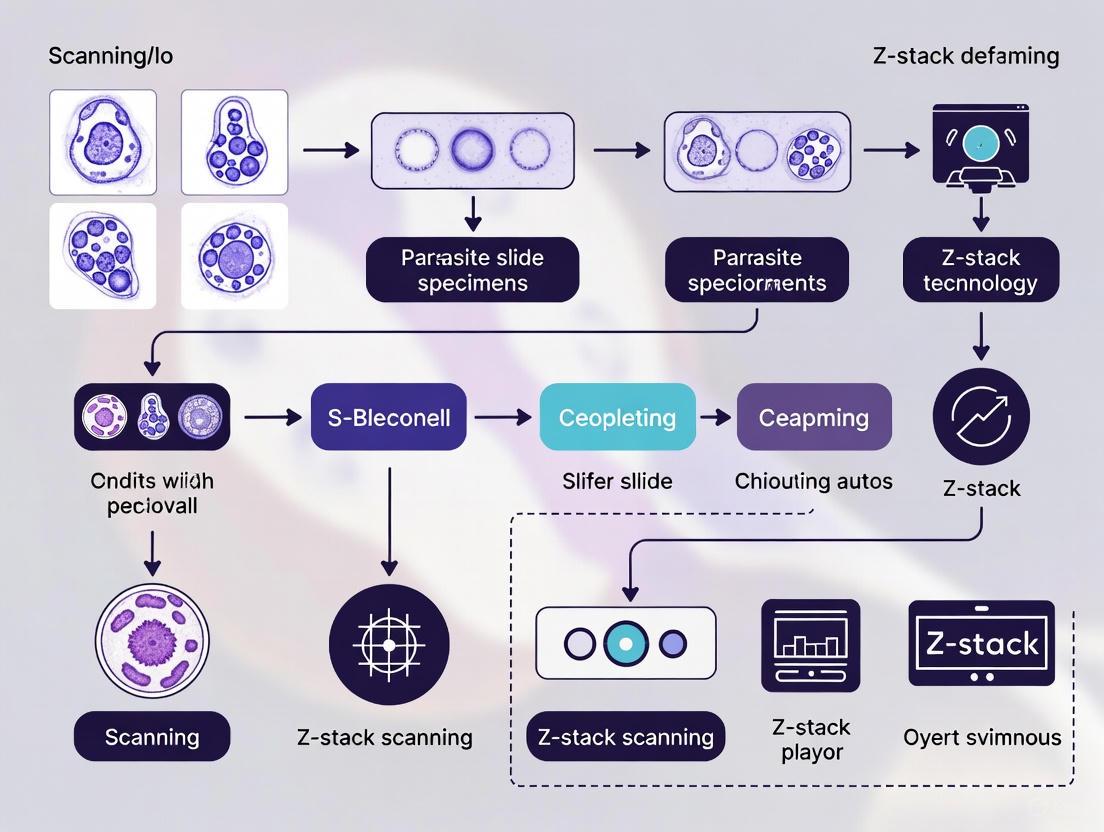
Database Construction Workflow: This diagram outlines the key stages in creating a digital parasite specimen database, from physical slides to a live, accessible resource.
Validation and Technical Considerations
Implementing a digital diagnostics system for cytology specimens involves specific technical considerations. A validation study of an AI-assisted cervical screening system reported that despite using archived slides with inherent quality issues, the total number of cases requiring rescanning was low [13].
Analysis of Technical Errors in Digital Slide Scanning
Table 3: Technical Error Profile During Digital Slide Scanning Validation
| Error Type | Frequency | Common Causes | Resolution Method |
|---|---|---|---|
| Slide Events | 21 cases (2.3%) [13] | Coverslip scratches from long-term storage, barcode issues, duplicate slides [13]. | Successful rescanning after correction for 8 cases; 13 cases (1.4%) excluded [13]. |
| Imager Errors | 43 events [13] | Motor movement failure, cancelled slide handling actions, failure to pick slides [13]. | System reboot, slide repositioning, vendor technical support [13]. |
The technical errors encountered during scanning, including slide events and imager errors, were resolved through systematic troubleshooting and did not compromise the interpretation of the test slides [13]. This supports the robustness of digitization protocols for valuable specimen collections.
Error Resolution Protocol: This flowchart details the decision-making process for addressing technical errors encountered during the slide digitization process.
Digital pathology is transforming the analysis of parasitic diseases, and Z-stack scanning is at the forefront of this technological revolution. In diagnostic parasitology, challenges such as focal precision and the three-dimensional nature of specimens have historically complicated digital analysis. Z-stack scanning addresses these limitations by capturing multiple images of a specimen at different focal planes along the z-axis, which are then combined to create a single composite image with an extended depth of field [9]. This process creates a three-dimensional representation of the specimen, enabling pathologists and researchers to examine the entire thickness of a sample in sharp focus, much like adjusting the fine focus on a conventional microscope but with digital precision [9] [14].
For parasite research and diagnostics, this capability is particularly valuable. Parasites often present with complex morphological features that may be distributed across different focal planes within a thick smear or tissue section. Traditional single-plane digital imaging can miss these critical diagnostic clues if they lie outside the narrow focal plane. The implementation of Z-stack scanning in whole slide imaging (WSI) systems allows for the creation of multiplanar images that mimic the precise focus control of conventional microscopy, providing an invaluable advantage for cytological and histological analysis of parasitic specimens [9]. This technology is paving the way for more reliable AI-assisted pathology workflows that can ultimately enhance diagnostic accuracy and patient management [15].
Key Applications and Performance Data
Z-stack technology offers diverse applications across parasitology, from educational initiatives to advanced research methodologies. The quantitative benefits of this approach are demonstrated through recent validation studies and research findings, which highlight its growing importance in the field.
Table 1: Performance Metrics of Z-Stack Whole Slide Imaging (z-WSI) in Cytopathology
| Metric | Glass Slides | z-WSI | Context |
|---|---|---|---|
| Screening-2-Category Accuracy | 91.2% | 87.1% | NILM (normal) vs. lesions (ASC-US+) [16] |
| Morpho-3-Category Accuracy | 86.5% | 81.0% | Classification by lesion severity [16] |
| Inter-observer Agreement (Screening) | 0.685 | 0.637 | Cohen's Kappa [16] |
| Inter-observer Agreement (Morpho) | 0.700 | 0.598 | Cohen's Kappa [16] |
| Average Screening Time | Baseline | +2-5 minutes | Per cytotechnologist [16] |
| AI Mitosis Detection Sensitivity | Baseline | +17.14% | In meningioma cases [15] |
The data indicates that while z-WSI currently shows slightly reduced agreement metrics compared to traditional glass slides, the technology demonstrates significant advantages in specific applications such as AI-assisted detection, where it substantially improves sensitivity [15]. With targeted training specifically designed for WSI interpretation, diagnostic accuracy and workflow efficiency are expected to improve significantly [16].
Table 2: Core Applications of Z-Stack Scanning in Parasitology
| Application Domain | Specific Use Cases | Key Benefits |
|---|---|---|
| Diagnostic Accuracy | Identification of parasite morphological features, staging of parasitic infections, differentiation of similar species | Enhanced depth information brings entire parasite structures into focus, reducing diagnostic uncertainty [15] [9] |
| Education & Training | Creation of focus-adjustable digital slides for teaching, development of comprehensive parasite image databases | Allows students to explore focal depths without physical microscopes; enables remote education [14] |
| High-Throughput Research | Drug efficacy studies, parasite behavior analysis, morphological changes under experimental conditions | Facilitates batch scanning and analysis; compatible with AI-based quantification [15] [17] |
| 3D Reconstruction | Visualization of parasite internal structures, host-parasite interface modeling, parasite movement studies | Enables digital reconstruction of 3D structures from serial z-plane images [9] |
Experimental Protocols
Protocol for Z-Stack Imaging of Parasite Specimens
This protocol provides a detailed methodology for acquiring Z-stack images of parasite specimens using motorized microscopy systems, adapted from established imaging procedures [14] and optimized for parasitology research.
Materials Required:
- Motorized microscope with Z-stack capability (e.g., Zeiss Axio Imager.M2 or equivalent)
- 100x oil immersion objective (1.4 NA recommended)
- Immersion oil
- Prepared parasite slides (e.g., blood smears, tissue sections, fecal concentrates)
- Z-stack compatible software (e.g., ZEN Blue, FIJI/ImageJ)
Procedure:
- System Initialization: Turn on the microscope and allow sufficient time for system initialization and communication with the control software. Launch the acquisition software (e.g., ZEN Blue) and select the appropriate professional version for advanced functionality.
Slide Preparation and Screening: Place the parasite slide onto the motorized stage. Begin screening under lower magnification (20x or 40x) to identify regions of interest containing parasite forms. Center the target area in the field of view.
Oil Immersion Application: For high-resolution imaging at 100x magnification, apply immersion oil directly to the slide area covering the region of interest. Switch to the 100x oil immersion objective, ensuring proper contact with the immersion oil.
Z-Stack Parameter Configuration:
- Access the "Acquisition" tab and select "Live" mode.
- Expand the "Z-Stack" configuration settings.
- Set the first focal plane by focusing above the parasite structure and clicking "Set First."
- Set the last focal plane by focusing below the parasite structure and clicking "Set Last."
- Adjust the slice interval to optimize for parasite features (typically 0.2-0.5µm for high-resolution imaging).
Image Acquisition: Click "Start Experiment" to initiate the Z-stack capture. Maintain environmental stability during capture by avoiding vibrations or disturbances to the microscope.
Post-processing and Export:
- Apply necessary scale bars using graphics tools.
- Adjust contrast and color levels using histogram functions in the "Display" tab.
- Export images as TIFF files with compression set to "None" to preserve image quality for subsequent analysis.
Protocol for Validation of Z-WSI in Parasitology Diagnostics
This protocol outlines a validation methodology for implementing Z-stack whole slide imaging in parasitology diagnostics, based on clinical validation studies [16] and adapted for parasite detection.
Materials Required:
- Whole slide scanner with Z-stack capability
- Reference set of parasite slides (e.g., malaria, leishmaniasis, trypanosomiasis)
- Traditional microscope setup for comparison
- Statistical analysis software
Procedure:
- Sample Collection and Preparation: Collect a representative set of parasite-positive samples (minimum n=90-100 recommended), encompassing various parasite loads and developmental stages. Include negative controls and challenging diagnostic cases.
Slide Digitization: Scan all slides using the Z-stack WSI system, optimizing the number of Z-planes based on specimen thickness. For thin blood smears, 5-10 planes may suffice, while thicker tissue sections may require 15-20 planes.
Reader Study Design: Engage multiple trained parasitologists (minimum n=4) to evaluate cases using both conventional microscopy and z-WSI separately, with a washout period between evaluations to prevent recall bias.
Data Collection and Analysis:
- Collect diagnostic classifications for both modalities using standardized reporting schemas.
- Record reading time for each case to evaluate workflow efficiency.
- Calculate inter- and intra-observer agreement using statistical measures (e.g., Cohen's Kappa).
- Compare diagnostic accuracy against reference standards.
Implementation Planning: Based on validation results, develop specialized training programs for z-WSI interpretation in parasitology, focusing on challenging diagnostic scenarios and optimal digital navigation techniques.
Workflow Visualization
The following diagrams illustrate key processes and applications of Z-stack technology in parasitology, created using Graphviz DOT language with specified color palette and contrast requirements.
Diagram 1: Z-Stack Workflow for Parasitology
Diagram 2: Traditional vs. Z-Stack Microscopy
Essential Research Tools and Reagents
Successful implementation of Z-stack imaging in parasitology requires specific instrumentation, software, and reagents. The following table details the essential components of a Z-stack imaging workflow for parasite research.
Table 3: Essential Research Tools for Z-Stack Parasitology Research
| Category | Specific Tool/Reagent | Function & Application |
|---|---|---|
| Imaging Hardware | Motorized microscope with Z-axis control | Enables precise capture of multiple focal planes; essential for Z-stack acquisition [14] |
| Image Analysis Software | FIJI/ImageJ, CellProfiler, ZEN lite | Processes Z-stack images; performs quantification, 3D reconstruction, and analysis [17] [18] |
| Sample Preparation | Specific stains for parasites (Giemsa, Trichrome, etc.) | Enhances contrast of parasite structures; facilitates identification across focal planes |
| Slide Scanning | Whole slide scanner with Z-stack capability | Digitizes entire slides at multiple focal planes; enables high-throughput analysis [9] |
| Data Management | .CZI file format compatible software | Maintains metadata integrity; enables cross-platform image data exchange [18] |
| AI-Assisted Analysis | Machine learning-based segmentation tools | Automates parasite identification and quantification in Z-stack images [15] [18] |
Z-stack scanning represents a transformative technology in parasitology, with demonstrated applications spanning diagnostic precision, educational enhancement, and high-throughput research. While current validation studies show slightly reduced performance metrics compared to traditional microscopy in some categorical classifications, the significant improvements in detection sensitivity—particularly when combined with AI analysis—highlight its potential to revolutionize parasite detection and characterization [15] [16]. The structured protocols and tools outlined in this application note provide a foundation for implementing Z-stack methodologies in parasitology workflows. As digital pathology continues to evolve, Z-stack scanning is poised to become an indispensable technology for advancing parasite research and improving diagnostic outcomes in clinical settings. With appropriate training and workflow optimization, this technology promises to enhance both the efficiency and accuracy of parasite detection, ultimately contributing to better patient management and expanded research capabilities.
Building a Digital Parasite Database: A Step-by-Step Z-Stack Protocol
The creation of a high-fidelity digital parasite specimen database hinges on the meticulous selection and preparation of physical samples. In the context of digital scanning for research, the quality of the original specimen directly determines the quality and scientific utility of the resulting digital asset. This document details the protocols for selecting and preparing parasite eggs, adults, and arthropods for whole-slide imaging (WSI), with a specific focus on methodologies that facilitate high-quality Z-stack imaging for three-dimensional analysis. These standardized procedures are designed to support the development of a reproducible digital repository for parasitology education and advanced research [1].
Specimen Selection Criteria
A foundational step in database construction is the careful curation of physical specimens. The selection must ensure morphological clarity, taxonomic diversity, and relevance to both diagnostic and research applications.
Table 1: Core Specimen Types for a Digital Parasitology Database
| Specimen Category | Key Specimen Examples | Primary Observation Magnification | Critical Morphological Features for Digitization |
|---|---|---|---|
| Parasite Eggs | Ascaris lumbricoides, Trichuris trichiura, hookworm species [1] | Low (e.g., 40x) [1] | Egg size, shape, wall thickness, opercular presence, embryonic content |
| Adult Parasites | Nematodes, trematodes, cestodes (whole mounts or sections) [1] | Low to Medium (e.g., 40x-100x) [1] | Overall body plan, digestive and reproductive structures, cuticular details, sensory organs |
| Arthropods | Ticks, fleas, mosquitoes (whole mounts or sections) [1] | Low (e.g., 40x) [1] | Body segmentation, mouthparts, leg morphology, wing venation, setae patterns |
| Intracellular Blood Parasites | Plasmodium spp. (malaria parasites) [1] [19] | High (e.g., 1000x) [1] | Parasite stage (ring, trophozoite, schizont, gametocyte) [19], host cell modifications |
The selection strategy should prioritize specimens that are well-preserved and morphologically intact. Specimens acquired from institutional collections, such as those from Kyoto University and Kyoto Prefectural University of Medicine used in a foundational study, provide a reliable starting point [1]. For arthropods, alternative high-throughput digitization methods using charge-coupled device (CCD) flatbed scanners have been validated, showing that scanned images can achieve a quality comparable to stereomicroscopy for machine learning applications [20].
Experimental Protocols for Specimen Preparation and Imaging
Protocol 1: Whole-Slide Imaging (WSI) with Z-Stack for Thick Specimens
This protocol is adapted from the methodology used to construct a preliminary digital parasite specimen database, which successfully digitized 50 slide specimens of parasites and arthropods [1].
1. Specimen Preparation and Mounting:
- Source: Obtain existing glass slide specimens from institutional collections or prepare new slides using standard parasitological histological techniques [1].
- Curation: Ensure slides are free of significant damage and the specimen is centrally located and properly stained for contrast.
- Note: Specimens do not require special preparation for Z-stack imaging at this stage; the technology accommodates existing slides.
2. Digital Scanning Configuration:
- Equipment: Use a high-precision slide scanner, such as the SLIDEVIEW VS200 by EVIDENT Corporation or equivalent [1].
- Z-Stack Function: For thicker specimens (e.g., adult parasites, arthropods), activate the Z-stack function. This technique varies the focal plane during the scan, accumulating layer-by-layer data to create a fully focused composite image and a 3D data set [1].
- Quality Control: Manually review scanned images for focus and clarity. Rescan any slides with out-of-focus areas as needed [1].
3. Data Management and Storage:
- Upload: Transfer the final, approved virtual slide files to a dedicated shared server (e.g., Windows Server 2022) [1].
- Organization: Structure the digital database with folders organized by taxonomic classification [1].
- Annotation: Attach explanatory notes in multiple languages (e.g., English and Japanese) to each specimen to facilitate learning and international collaboration [1].
The following workflow diagram summarizes the key steps from physical specimen to analyzable digital data:
Protocol 2: Continuous Single-Cell Live Imaging ofPlasmodium falciparum
For the study of dynamic processes in live parasites, such as the malaria parasite Plasmodium falciparum, a more advanced workflow integrating live imaging and deep learning is required [6].
1. Sample Preparation and Immobilization:
- Culture: Maintain P. falciparum-infected human erythrocytes under standard in vitro culture conditions.
- Mounting: Prepare samples for continuous imaging on appropriate glass-bottom dishes or chambers.
2. Multi-Dimensional Image Acquisition:
- Microscopy: Use a high-resolution system like an Airyscan microscope, capable of both differential interference contrast (DIC) and fluorescence imaging [6].
- Acquisition Parameters: Acquire 3D z-stacks over time (4D imaging) throughout the parasite's 48-hour intraerythrocytic life cycle. Use minimal laser power to mitigate the parasite's high photosensitivity [6].
3. Deep Learning-Enabled Image Analysis:
- Segmentation: Employ a pre-trained convolutional neural network (CNN) like Cellpose for automated segmentation of erythrocytes and intracellular parasites [6].
- Training: Re-train the network on a manually annotated dataset of uninfected erythrocytes and infected cells at different stages (ring, trophozoite, schizont) to optimize performance [6].
- Analysis: Use the segmented images for 3D rendering and time-resolved quantitative analysis of dynamic processes, such as protein export [6].
Table 2: Research Reagent Solutions for Parasite Imaging
| Reagent / Solution | Function / Application | Specific Example / Note |
|---|---|---|
| OPTIClear | A refractive index homogenization solution optimized for clearing fresh and archival human brain tissues, enabling 3D visualization of microstructure [21]. | Contains N-methylglucamine, 2,2'-thiodiethanol, and Iohexol; R.I. ~1.47 [21]. |
| Cellpose | A deep learning-based convolutional neural network (CNN) for automated 2D and 3D segmentation of cells and subcellular structures [6]. | Pre-trained model that can be re-trained with a few annotated examples for specific tasks like segmenting infected erythrocytes [6]. |
| CellBrite Dyes | Membrane-binding fluorescent dyes used to delineate cell boundaries for improved annotation and segmentation in complex samples [6]. | Used to stain the erythrocyte membrane for creating accurate training datasets for neural networks [6]. |
| Composite Loss Function | A custom training objective for machine learning models that combines multiple loss types to improve performance. | Hybrid CapNet uses a blend of margin, focal, reconstruction, and regression losses for robust parasite classification [19]. |
| Poly-D-Lysine (PDL) | A substrate coated on glass to promote neuronal adhesion and growth in patterned cultures for controlled experiments [22]. | Demonstrates the principle of using substrates to guide cellular organization for imaging [22]. |
Discussion and Technical Considerations
The transition from physical specimen to digital asset involves several critical technical considerations. For thick specimens, the Z-stack function is indispensable for capturing comprehensive morphological data, as it ensures all focal planes are recorded [1]. Furthermore, the inherent challenge of photobleaching during live, long-term imaging must be addressed. Recent research indicates that for quantitative analyses like mitochondrial volume measurement in C. elegans, global threshold-based image segmentation may not require prior correction for photobleaching, simplifying the analytical pipeline [23].
The integration of deep learning, as demonstrated by both the Cellpose model for segmentation [6] and the Hybrid CapNet for parasite classification [19], is revolutionizing the analysis of parasitological images. These tools not only automate tedious tasks but also extract quantitative data that are difficult to obtain manually, thereby enhancing the research value of digital specimens.
Robust protocols for the selection and preparation of parasite eggs, adults, and arthropods form the foundation of any high-quality digital specimen database. By leveraging modern imaging technologies like Z-stack scanning and combining them with advanced analytical methods such as deep learning, researchers can create enduring, accessible, and analytically powerful digital resources. These databases are crucial for preserving morphological knowledge, facilitating international collaboration in parasitology education, and accelerating future research and drug development efforts.
The digitization of parasitology slides via whole slide imaging (WSI) is transformative for education and research, particularly given the increasing scarcity of physical specimens in developed nations [1]. However, a significant technical challenge in this process is the limited depth of field of microscope objectives, which makes it difficult to image thicker specimens in sharp focus across their entire depth [9]. Z-stacking, a technique that captures multiple images at different focal planes and composites them into a single, fully focused image, directly addresses this issue [9]. This application note provides detailed protocols and data-driven recommendations for configuring Z-stack parameters—specifically, the number of layers, depth interval, and magnification—to optimize the digital capture of parasite specimens for subsequent AI analysis and morphological research.
Quantitative Comparison of Scanning Protocols
A 2025 study on automated HER2 analysis in breast cancer provides a directly applicable, quantitative framework for evaluating scanning parameters. The findings, summarized in the table below, underscore the critical impact of resolution and Z-stack configuration on the success of automated analysis [24].
Table 1: Performance of Different Scanning Protocols in Automated Image Analysis
| Scanner | Protocol ID | Resolution (µm/pixel) | Z-Stack / Focus Notes | Concordance with Manual Ground Truth |
|---|---|---|---|---|
| A | A1 | 0.12 | 0.95 NA (Dry lens) | Yes [24] |
| A | A2 | 0.12 | 1.2 NA (Water immersion lens) | Yes [24] |
| B | B1 | 0.08 | Single plane | Not Reported [24] |
| B | B2 | 0.17 | Single plane | Yes [24] |
| B | B3 | 0.17 | Extended Focus (1.4 µm step size, 3 layers) | Yes [24] |
| C | C1 | 0.26 | Single plane | No (Nuclei detection failure in 6/10 cases) [24] |
The study concluded that protocols with optimized resolutions (0.12 µm/pixel and 0.17 µm/pixel with extended focus) yielded the best performance for the AI application [24]. The failure of the lower-resolution protocol (C1) highlights that insufficient resolution can render images unusable for automated analysis, regardless of focus.
Experimental Protocols for Z-Stack Image Acquisition and Analysis
Protocol 1: Z-Stack Acquisition for Diverse Parasite Specimens
This protocol is adapted from methodologies used in creating a digital parasite database and in automated diagnostic systems [1] [25].
Sample Preparation:
- Prepare standard Giemsa-stained thick and thin blood smears or other parasite-specific stained slides [25].
- Ensure slides are clean and free of debris.
Scanner Pre-configuration:
Define Z-Stack Parameters:
- Determine Total Z-Depth: Use the scanner's software to identify the top and bottom surfaces of the specimen. The total Z-depth is the distance between these two points.
- Set Step Size: A step size of 1.4 µm has been successfully used in clinical-grade automated analysis [24]. For thicker or more complex specimens, a smaller step size (e.g., 0.5-1.0 µm) may be necessary to capture finer focal details.
- Calculate Number of Layers: The number of layers (Z-stack images) is determined by the formula: Number of Layers = (Total Z-Depth / Step Size) + 1.
Image Acquisition:
Protocol 2: AI-Assisted Parasite Detection in Thick Blood Smears
This protocol details the process for training and implementing a convolutional neural network (CNN) for automated parasite detection, based on the iMAGING system [25].
Image Dataset Creation:
CNN Model Training and Comparison:
- Split the annotated dataset into training, validation, and test sets (e.g., 80/10/10).
- Train multiple state-of-the-art object detection models (e.g., YOLOv5x, Faster R-CNN, SSD, RetinaNet) on the same dataset to compare performance [25].
- Evaluate models based on precision, recall, F-score, and mean Average Precision (mAP). The iMAGING system achieved an overall F-score of 92.79% and mAP of 94.40% [25].
System Integration and Automated Diagnosis:
- Integrate the best-performing predictive model into a smartphone-computer application [25].
- Couple the application with a robotized microscope system capable of automated slide tracking and auto-focusing [25].
- The integrated system can then perform a fully automated diagnosis, determining if a sample is positive/negative and quantifying parasite levels [25].
Workflow Visualization
The following diagram illustrates the critical decision points and workflow for optimizing scanner configuration for parasite specimen digitization.
The Scientist's Toolkit: Research Reagent Solutions
Table 2: Essential Materials for Parasitology Slide Digitization
| Item | Function / Application |
|---|---|
| Giemsa Stain | Standard staining for malaria parasites and other blood-borne pathogens; allows for visualization of nuclear and cytoplasmic details [25]. |
| VENTANA HER2 Dual ISH DNA Probe Cocktail | Example of a commercially available in-situ hybridization probe kit; analogous probes could be developed for specific parasite DNA targets [24]. |
| Formalin-Fixed Paraffin-Embedded (FFPE) Blocks | Standard method for long-term preservation of tissue specimens; allows for sectioning of thin slices for slide preparation [24]. |
| Microfluidic MPS Chips | Advanced platforms for creating 3D biological models (e.g., microvessels) to study host-parasite interactions in a controlled environment [26]. |
| Collagen Gel | A common 3D matrix used in microphysiological systems (MPS) to support the culture of complex tissue structures for imaging [27]. |
| NIS-Elements Imaging Software | Software equipped with Z Intensity Correction functionality to correct for light attenuation in thick samples during 3D confocal imaging [27]. |
The digital transformation of parasitology leverages whole-slide imaging (WSI) to preserve valuable specimens, enhance research capabilities, and facilitate global collaboration. This document details a standardized workflow for digitizing parasite slide specimens—including eggs, adults, and arthropods—and managing the resulting data on a shared server. This process is particularly critical for parasitology, where the decline in morphological expertise and the scarcity of specimens in developed regions pose significant challenges to education and diagnostics [1]. The implementation of a structured digital workflow ensures the long-term preservation of rare specimens and provides simultaneous, remote access for researchers and drug development professionals, thereby accelerating biomarker validation and clinical studies [28] [29].
Detailed Experimental Protocols
Protocol 1: Specimen Preparation and Slide Digitization
Objective: To convert glass slides of parasite specimens into high-quality, digitized whole-slide images (WSIs) suitable for quantitative analysis and archiving.
Materials:
- Glass slide specimens of parasites (e.g., eggs, adult worms, arthropods).
- SLIDEVIEW VS200 slide scanner (Evident Corporation) or equivalent [1].
- Computer workstation with scanner control software.
Methodology:
- Slide Preparation Verification: Visually inspect all glass slides to ensure the specimen is intact, coverslipped correctly, and free of significant debris or damage.
- Scanner Configuration:
- Power on the scanner and initialize the control software.
- Select the appropriate scanning mode based on the specimen type. For thicker specimens (e.g., adult parasites), enable the Z-stack function to capture multiple focal planes, accumulating layer-by-layer data to ensure a completely in-focus image [1].
- Set the scan resolution. For parasite eggs and adults typically observed at low magnification (40x), a lower resolution may suffice. For specimens requiring high magnification, such as malarial parasites (1000x), select the highest possible resolution [1].
- Slide Loading and Scanning:
- Load slides into the scanner's tray. For high-throughput labs, systems like the ZEISS Axioscan 7 can accommodate up to 100 slides per run for walk-away automation [29].
- Initiate the scanning process. For efficiency, high-capacity scanners can be used for overnight bulk scanning, while smaller scanners handle urgent daytime cases [28].
- Quality Control (QC):
- After scanning, review each WSI for focus, clarity, and color fidelity.
- Slides with out-of-focus areas must be rescanned. Select the clearest image for subsequent upload [1].
- Implement additional QC measures to ensure high-quality standards from block cutting to cover slipping, which may initially extend processing times [28].
Protocol 2: AI-Based Parasite Egg Detection and Model Validation
Objective: To train and evaluate a deep learning model for the automated detection of soil-transmitted helminth (STH) and Schistosoma mansoni eggs in digitized stool smear images, assessing performance in real-world conditions.
Materials:
- Dataset: AI4NTD KK2.0 P1.5 STH & SCHm Dataset V2 (or similar annotated dataset of STH and S. mansoni eggs) [30].
- Computing environment with GPU acceleration.
- YOLOv7 (You Only Look Once version 7) framework installed.
Methodology:
- Data Preparation and Augmentation:
- Refine the dataset by rectifying intrinsic annotation errors to create a high-quality training set [30].
- Employ a 2x3 montage data augmentation strategy to enhance the model's generalization to out-of-distribution (OOD) scenarios. This technique creates composite images from multiple source images, making the model more robust to variations in image capture devices and unseen egg types [30].
- Model Training:
- Train multiple variants of the YOLOv7 model (e.g., YOLOv7-E6E) on the refined and augmented dataset.
- Monitor standard object detection metrics, such as F1-score and mean Average Precision (mAP), during training.
- Model Evaluation:
- In-Distribution (ID) Testing: Evaluate the model on a test set that matches the training data. YOLOv7-E6E has been shown to achieve an F1-score of 97.47% in ID settings [30].
- Out-of-Distribution (OOD) Testing: Rigorously test the model under two challenging conditions to simulate real-world use:
- OOD Condition 1: A dataset shift caused by a change in the image capture device.
- OOD Condition 2: A combination of a device change and the introduction of two egg types not seen during training.
- Use the Toolkit for Identifying object Detection Errors (TIDE) to perform a comprehensive error analysis, highlighting specific causes for drops in Average Precision (e.g., localization vs. classification errors) [30].
- Apply Gradient-weighted Class Activation Mapping (Grad-CAM) to visualize the model's decision-making process and investigate instances of false positives and false negatives [30].
Protocol 3: Data Upload, Management, and Secure Access on a Shared Server
Objective: To transfer validated WSIs and associated analytical data to a centralized, secure shared server for collaboration, storage, and analysis.
Materials:
- Server: Windows Server 2022 or equivalent shared server infrastructure [1].
- Validated WSIs and analysis results.
- Client computers with web browser access.
Methodology:
- Database Structure Creation:
- On the shared server, create a folder structure organized by the taxonomic classification of the parasites (e.g., Nematoda, Platyhelminthes, Arthropods) [1].
- Data Upload and Annotation:
- Upload the finalized WSIs to their corresponding taxonomic folders on the server.
- Attach explanatory notes to each specimen in both English and Japanese (or other relevant languages) to facilitate international learning and use. Include the specimen name and a brief description of its morphological characteristics [1].
- Access Control and Security:
- Implement a secure login system. Users must input a unique identification code and password provided by the host organization to access the virtual slide database [1].
- For clinical trials or regulated research, employ a platform like HALO AP, which features bulk, automatic de-identification of Protected Health Information (PHI) to ensure compliance with HIPAA and GDPR [31].
- Collaboration and Analysis:
- The shared server should be configured to allow approximately 100 individuals to access and observe the data simultaneously via a web browser on various devices without specialized viewing software [1].
- For advanced analysis, integrate with AI-powered image analysis platforms located in high-performance cloud environments (e.g., Amazon Web Services) to access scalable processing power on demand [32].
Workflow Visualization
The following diagram illustrates the complete integrated workflow, from physical slide to collaborative analysis, incorporating key decision points and parallel processes.
Diagram Title: Comprehensive Digital Parasitology Workflow
Performance data for AI models and operational metrics for shared server access are critical for evaluating the effectiveness of the digital workflow.
Table 1: Performance Evaluation of YOLOv7 Models for Parasite Egg Detection
| Model Variant | Evaluation Scenario | Precision (%) | Recall (%) | mAP@IoU0.5 (%) | F1-Score (%) |
|---|---|---|---|---|---|
| YOLOv7-E6E | In-Distribution (ID) | Data Not Shown | Data Not Shown | Data Not Shown | 97.47 [30] |
| YOLOv7 (Various) | OOD (Device Change) | +8.0* [30] | +14.85* [30] | +21.36* [30] | Data Not Shown |
| YOLOv7 (Various) | OOD (Device Change + Unseen Eggs) | Challenged | Challenged | Challenged | Data Not Shown |
Note: mAP = mean Average Precision; IoU = Intersection over Union; OOD = Out-of-Distribution. *Indicates average performance gain with 2x3 montage augmentation.*
Table 2: Shared Server Capabilities and Access Metrics
| Parameter | Specification / Metric | Context / Implication |
|---|---|---|
| Simultaneous Users | ~100 individuals [1] | Facilitates large-scale collaborative research and education. |
| Access Requirement | ID Code & Password [1] | Ensures data security and controlled access for confidentiality. |
| Client Software | Web browser (no specialized software) [1] | Reduces barriers to access and simplifies user experience. |
| Device Compatibility | Laptops, tablets, smartphones [1] | Enables flexible, remote work and learning. |
The Scientist's Toolkit: Essential Research Reagents and Materials
A successful digital parasitology workflow relies on integrated hardware, software, and reagent solutions.
Table 3: Key Research Reagent Solutions and Essential Materials
| Item / Solution | Function / Application in the Workflow |
|---|---|
| SLIDEVIEW VS200 Slide Scanner [1] | The core hardware used for generating high-quality whole-slide images (WSIs), featuring Z-stack functionality for thick specimens. |
| InSituPlex, SignalStar, OPAL Dyes [29] | Leading multiplex immunofluorescence (mIF) and tyramide signal amplification (TSA) reagent chemistries for biomarker panel development on tissue samples. |
| ZEISS Axioscan 7 [29] | An automated slide scanner supporting both mIF and brightfield (IHC/H&E) imaging in a single run, enabling high-throughput, walk-away automation. |
| HALO AP / HALO AP Dx Platform [32] [31] | An AI-powered software platform for quantitative digital pathology analysis, including a Clinical Trials module for blind scoring and data management compliant with FDA 21 CFR Part 11 and GDPR. |
| YOLOv7 Framework [30] | A state-of-the-art deep learning model framework used for real-time object detection, such as identifying and classifying parasite eggs in stool smear images. |
| Windows Server 2022 [1] | The operating system for the shared server infrastructure that hosts the digital slide database, enabling secure storage and controlled access. |
Application Note
This application note details the methodology and implementation of a preliminary digital parasite specimen database, constructed to address the critical challenge of maintaining parasitology education and research capabilities in an era of declining physical specimen availability. The project leveraged whole-slide imaging (WSI) technology to create a bilingual, virtual slide database from 50 physical parasite specimens, facilitating international practical training and research within medical education programs [1].
The decline in morphological expertise, essential for diagnosing parasitic infections, is a growing concern in developed nations where improved sanitation has minimized parasitic infection rates and consequently, access to educational specimens [1]. This database serves as a vital resource to counteract this trend, preserving high-fidelity digital representations of parasite morphology that are accessible to a global audience of researchers, scientists, and drug development professionals. The platform supports simultaneous access for approximately 100 users, promoting collaborative international research and education without the risks of specimen deterioration or damage associated with traditional microscopy training [1] [33].
Experimental Protocols
Specimen Sourcing and Curation
Fifty existing slide specimens of parasitic eggs, adult parasites, and arthropods were procured from the collections of Kyoto University and Kyoto Prefectural University of Medicine [1]. The specimens represented a taxonomically diverse range, including specimens typically observed at both low magnification (40X), such as parasite eggs and ticks, and high magnification (1000X), such as malarial parasites [1]. These slides were carefully selected for their educational and research value, and none contained personal information, ensuring their ethical use for shared academic purposes [1].
Digital Slide Scanning and Image Processing
Digital scanning of all 50 slide specimens was performed by the Biopathology Institute Co., Ltd. using an SLIDEVIEW VS200 slide scanner (EVIDENT Corporation, Tokyo, Japan) [1]. The scanning protocol was tailored to accommodate the varying physical characteristics of the specimens:
- Z-stack scanning: For specimens with thicker smears, the Z-stack function was employed. This technique varies the scan depth to accumulate layer-by-layer data, ensuring all focal planes are captured for three-dimensional specimens [1].
- Quality control: Each slide was scanned individually. Initial scans with out-of-focus areas were rescanned as needed. The clearest image from each scanning session was selected by the authors after a thorough review for focus and image clarity before incorporation into the final database [1].
Database Architecture and Deployment
The digitized virtual slide data was compiled into a structured database hosted on a shared server (Windows Server 2022) [1]. The database architecture was designed for optimal usability and security:
- Taxonomic organization: A folder structure was created, organizing specimen data according to established taxonomic classification [1].
- Bilingual annotations: Each specimen was accompanied by explanatory notes in both English and Japanese to facilitate learning and use by domestic and international users [1].
- Controlled access: To ensure confidentiality, access to the database requires users to input an identification code and password provided by the host organization, restricting use to agreed-upon educational and research purposes [1].
Data Presentation
The following table summarizes the core quantitative outputs and specifications of the database construction project.
Table 1: Project Outputs and Technical Specifications
| Parameter | Specification |
|---|---|
| Total Slide Specimens Digitized | 50 [1] |
| Specimen Types | Parasite eggs, adult worms, arthropods [1] |
| Magnification Range | 40x (low) to 1000x (high) [1] |
| Scanning Technology | Whole-Slide Imaging (WSI) [1] |
| Key Technical Feature | Z-stack function for thick smears [1] |
| Scanner Model | SLIDEVIEW VS200 (EVIDENT Corp.) [1] |
| Simultaneous User Capacity | ~100 users [1] |
| Language Support | Bilingual (English, Japanese) [1] |
Database Accessibility and Usage Metrics
Table 2: User Accessibility and Interface Features
| Feature | Implementation |
|---|---|
| Access Method | Web browser on laptops, tablets, or smartphones [1] |
| Software Requirement | No specialized viewing software required [1] |
| Data Preservation | Prevents physical specimen deterioration and damage [1] |
| Server Environment | Shared server (Windows Server 2022) [1] |
| Folder Organization | By taxonomic classification [1] |
| Learning Support | Explanatory notes for each specimen [1] |
Workflow Diagram
The following diagram illustrates the logical workflow for constructing the bilingual digital parasite database, from specimen preparation to end-user access.
System Architecture Diagram
This diagram outlines the technical architecture of the deployed digital database system, showing the relationship between its core components.
The Scientist's Toolkit
Table 3: Essential Research Reagent Solutions and Materials
| Item | Function/Application |
|---|---|
| SLIDEVIEW VS200 Slide Scanner | High-resolution digital slide scanner used for creating whole-slide images (WSI) of parasite specimens, enabling high-magnification digital microscopy [1]. |
| Z-stack Function Software | Specialized scanning software capability that varies scan depth to accumulate layer-by-layer data, crucial for capturing focused images of three-dimensional or thick smear specimens [1]. |
| Existing Physical Slide Specimens | Curated collection of 50 parasite eggs, adult worms, and arthropods used as the source material for digitization, providing the morphological basis for education and diagnosis [1]. |
| Bilingual Annotation Framework | System for attaching explanatory notes in both English and Japanese to each digital specimen, facilitating international collaboration and learning [1]. |
| Shared Server Infrastructure | On-premises server environment (Windows Server 2022) hosting the virtual slide database, enabling secure, simultaneous multi-user access while maintaining data sovereignty [1]. |
| Taxonomic Classification System | Organizational structure for categorizing and storing digital specimens within the database, mirroring biological taxonomy to enhance searchability and educational utility [1]. |
Optimizing Z-Stack Scans: Balancing Data Quality, File Size, and Efficiency
Determining the Optimal Number of Z-Layers for Different Specimens
In digital pathology and microscopy, Z-stack scanning involves capturing multiple images of a specimen at different focal planes along the Z-axis (perpendicular to the slide surface). This technique is crucial for creating comprehensive three-dimensional representations of specimens, which is particularly valuable for analyzing thick samples or objects with significant topographic variation [34]. For parasite research, where morphological diagnosis remains the gold standard, determining the optimal number of Z-layers is essential for achieving accurate segmentation, identification, and quantification while managing practical constraints of file size and scanning time [1] [35].
This application note synthesizes current evidence to provide clear protocols and data-driven recommendations for Z-stack optimization across various specimen types, with special emphasis on parasitology applications.
Key Factors Influencing Z-Stack Optimization
Technical and Practical Considerations
The optimal number of Z-layers represents a balance between diagnostic utility and operational efficiency. Key factors influencing this balance include:
- Specimen thickness: Thicker specimens require more focal planes for complete representation [4]
- Research objectives: Detection of small patterns (e.g., mitosis) requires different optimization than general morphological assessment [36]
- Scanner capabilities: Varying interplane distances affect the total depth captured [36]
- Computational resources: Z-stacked whole slide images (WSIs) can be 3.81× larger than single-layer images [36]
- Scanning time: Multiplied approximately by the number of Z-layers acquired [35]
Impact on Analytical Performance
Evidence demonstrates that Z-stack scanning significantly enhances analytical capabilities:
- AI performance: Z-stack scanning improved sensitivity of mitosis detection in meningiomas by an average of 17.14% compared to single-layer scanning [36]
- Cell detection: In cytology preparations, Z-stacking enhanced AI-inferred detection of atypical cells [35]
- Classification accuracy: For bright-field microscopy, classification error dropped below 1% with at least seven Z-images [37]
Table 1: Quantitative Impact of Z-Stack Scanning on Diagnostic Performance
| Application | Performance Metric | Single-Layer | Z-Stack | Improvement |
|---|---|---|---|---|
| Mitosis Detection in Meningiomas [36] | Sensitivity | 0.601 | 0.704 | +17.14% |
| Mitosis Detection in Meningiomas [36] | Precision | 0.753 | 0.757 | +0.53% |
| E. coli Identification [37] | Classification Error | >1% | <1% | Significant |
| Atypical Cell Coverage [35] | Coverage Rate | <80% | >80% (with 9+ layers) | Significant |
Recommended Z-Stack Parameters by Specimen Type
Based on empirical studies, the following recommendations provide guidance for different specimen categories relevant to parasitology research.
Table 2: Optimal Z-Stack Parameters for Different Specimen Types
| Specimen Type | Recommended Z-Layers | Interplane Distance | Evidence Source |
|---|---|---|---|
| Cytology Preparations (Urine) | Minimum 9 layers | 1 μm | [35] |
| Histology Sections (Meningioma) | 5 layers | 0.6-0.75 μm | [36] |
| Monolayer Cells (E. coli, Yeast) | Minimum 7 layers | 100 nm | [37] |
| Parasite Eggs & Adult Worms | 5-9 layers (recommended starting point) | 0.5-1.0 μm | [1] [35] |
| Thick Specimens (35μm tissue) | 15-25+ layers (signal-dependent) | 1-2 μm | [38] |
Experimental Protocol for Z-Stack Optimization
Determining Optimal Z-Stack Parameters for Parasite Specimens
This protocol provides a systematic approach for establishing optimal Z-stack parameters for novel parasite specimens.
Materials and Equipment
- Microscope system: Motorized Z-stage capable of precise movement (e.g., Piezzo drive) [37]
- Image analysis software: Support for multi-layer images and analysis (e.g., ImageJ, Imaris) [39]
- Specimen slides: Representative samples of the parasite specimen under study
- Computational resources: Adequate storage for large datasets (Z-stacks can exceed 400 GB) [36]
Procedure
Initial Setup
- Mount specimen slide and bring into focus using the eyepieces or live view
- Engage the Z-stack scanning function on the microscope or scanner software [4]
Define Z-Range
- Rotate the focus knob downward until the useful signal begins to disappear; set this as the "Begin" point
- Rotate the focus knob upward until passing through the entire specimen and signal is lost; set this as the "End" point
- The system will calculate the total depth and number of possible optical sections [4]
Pilot Scanning
Image Analysis
Determine Optimal Parameters
- Identify the point where additional Z-layers no longer significantly improve analytical performance
- Balance performance gains against practical constraints (scanning time, file size) [35]
- Document the optimal parameters for future standardizations
Workflow Visualization
Research Reagent Solutions and Essential Materials
Table 3: Essential Research Reagents and Materials for Z-Stack Imaging
| Item | Function/Application | Specifications/Examples |
|---|---|---|
| Whole Slide Scanners | Digital slide scanning with Z-stack capability | Pannoramic 480DX, Aperio GT 450, AxioScan 7 [36] |
| Microscope Systems | High-resolution imaging with motorized Z-stage | IX71 Olympus with piezo drive (PIFOC) [37] |
| Image Analysis Software | Processing and analysis of Z-stack images | ImageJ, Imaris, NIS-Elements [39] |
| Classification Algorithms | Machine learning for cell identification | Support Vector Machine, Random Forest, Neural Networks [37] |
| Specimen Slides | Preparation of parasite specimens | Standard glass slides; thickness varies by specimen [1] |
| Staining Reagents | Enhanced contrast for morphological features | Hematoxylin and Eosin, antibody staining [39] [36] |
Implementation in Parasitology Research
For parasitology applications, Z-stack optimization must account for the diverse morphological characteristics of different parasite forms:
- Parasite eggs: Typically require fewer Z-layers due to relatively two-dimensional structure [1]
- Adult worms: May need more comprehensive Z-stacking to capture three-dimensional features [1]
- Intracellular parasites: Benefit from Z-stacking to visualize location within host cells [37]
The development of digital parasite specimen databases highlights the importance of optimized Z-stack parameters for creating high-quality educational and diagnostic resources [1]. When establishing a new parasitology digitization workflow, begin with 5-9 Z-layers at 0.5-1.0 μm intervals, then refine based on the specific morphological features of interest.
Determining the optimal number of Z-layers is specimen-dependent and application-specific. Evidence consistently demonstrates that Z-stack scanning significantly improves analytical performance for both human observers and AI algorithms. For most parasitology applications, 5-9 Z-layers provide substantial benefits over single-plane imaging while remaining operationally feasible. Following the systematic optimization protocol outlined in this document will help researchers establish validated, specimen-specific parameters that maximize diagnostic value while maintaining workflow efficiency.
Managing Large File Sizes and Storage Requirements
The digital scanning of parasite slide specimens using Z-stack technology generates exceptionally large image files, presenting significant data management challenges for research and drug development. Whole-slide imaging (WSI) combined with Z-stacking captures multiple focal planes of the same glass slide arranged in a Z-stack, producing files that commonly exceed 1 GB each [34]. For parasite research, where high-resolution imaging is essential for quantifying subtle morphological changes, these storage requirements become a critical operational consideration. The substantial file sizes result from the high-resolution capture needed to visualize detailed parasite structures, with most scanners supporting resolutions of 0.5 microns/pixel (20X equivalent magnification) or 0.25 microns/pixel (40X equivalent magnification) [34].
These technical demands create a fundamental tradeoff between image quality and storage capacity that researchers must strategically manage. Furthermore, the integration of artificial intelligence and machine learning algorithms for automated parasite quantification adds additional data processing and storage layers to the workflow [40] [41]. This application note provides detailed protocols and data management strategies to optimize storage infrastructure while maintaining the image quality necessary for robust parasite research and drug development.
Quantitative Analysis of File Size Determinants
Primary Factors Influencing Digital Pathology Storage Requirements
Table 1: Key factors affecting file sizes in Z-stack whole slide imaging
| Factor | Impact on File Size | Quantitative Range | Technical Considerations |
|---|---|---|---|
| Z-stack Planes | Linear increase with number of planes | 2-20+ planes typical | Each focal plane adds complete image data; collapsing Z-stacks computationally can reduce size [34] |
| Spatial Resolution | Exponential relationship | 0.25-0.5 microns/pixel [34] | Higher resolution (0.25 μm/px) quadruples storage versus lower resolution (0.5 μm/px) |
| Compression Type | 5-30x reduction factor | Lossless: 4x reduction; Lossy: 20-30x reduction [34] | Lossy compression may affect quantitative analysis of parasite morphology |
| Tissue Area | Direct proportional relationship | 15mm x 15mm to entire slide | Larger scan areas exponentially increase file size [34] |
| Fluorescence Imaging | Significant increase versus brightfield | 2-5x brightfield equivalent | Multiple channels and exposure times increase data [34] |
Table 2: Estimated file sizes for parasite specimen Z-stack imaging
| Scan Configuration | Estimated File Size (Uncompressed) | With Lossless Compression | With Lossy Compression | Recommended Use Cases |
|---|---|---|---|---|
| Single plane, 20X | 500 MB - 1 GB [34] | 125-250 MB [34] | 25-50 MB [34] | Initial parasite screening |
| Z-stack (5 planes), 20X | 2.5-5 GB | 625 MB - 1.25 GB | 125-250 MB | Standard parasite quantification |
| Z-stack (10 planes), 40X | 10-20 GB | 2.5-5 GB | 500 MB - 1 GB | High-detail subcellular analysis |
| Multi-channel fluorescence Z-stack | 15-30 GB | 3.75-7.5 GB | 750 MB - 1.5 GB | Multi-target parasite staining |
Experimental Protocols for Data Management
Optimized Z-Stack Acquisition Protocol for Parasite Specimens
This protocol establishes a standardized method for acquiring Z-stack images of parasite specimens while balancing image quality with file size considerations.
Materials and Reagents:
- Fixed and stained parasite slides (e.g., Plasmodium falciparum blood stages [40])
- Whole-slide scanner with Z-stack capability (e.g., Aperio AT2, NanoZoomer S360 [42])
- High-performance computing workstation with specialized image viewing software
- Network-attached storage (NAS) or cloud storage infrastructure
Procedure:
- Slide Preparation Optimization:
- Standardize specimen thickness and placement in the center of the slide
- Ensure coverslipping quality to minimize required Z-stack range
- Use liquid-based preparations for more consistent focal planes [41]
Z-stack Parameter Determination:
- Conduct preliminary scans to determine optimal Z-range for your parasite specimens
- Set the number of focal planes based on parasite thickness; 5-7 planes typically sufficient for blood-stage parasites
- Establish plane spacing to capture essential morphological details without redundancy
Resolution Configuration:
- Select 20X magnification (0.5 microns/pixel) for general parasite enumeration and staging
- Reserve 40X magnification (0.25 microns/pixel) for detailed subcellular analysis [34]
- Consider lower resolutions for initial screening workflows
Compression Strategy Implementation:
- Apply lossless compression for primary research data intended for quantitative analysis
- Utilize lossy compression for teaching archives or secondary reference collections
- Establish quality factor thresholds that maintain diagnostic and research integrity [34]
Metadata Tagging:
- Embed comprehensive metadata including scan parameters, staining protocols, and specimen information
- Utilize DICOM standards for interoperability and future AI applications [43]
Computational File Processing and Analysis Workflow
Data Management Workflow for Z-stack Parasite Imaging
Processing Steps:
- Z-stack Alignment and Pre-processing:
Segmentation and Analysis:
- Deploy machine learning-based segmentation for automated parasite identification and staging [40]
- Implement global threshold-based binarization for quantitative analysis, which remains effective despite moderate photobleaching [23]
- Conduct 3D rendering of parasites when subcellular detail is required [23]
Tiered Storage Implementation:
The Scientist's Toolkit: Essential Research Reagents and Solutions
Table 3: Key research reagents and computational tools for Z-stack parasite imaging
| Tool Category | Specific Solution | Function/Application | Storage Implications |
|---|---|---|---|
| Imaging Software | ZEN Blue [45], Fiji/ImageJ [23] | Z-stack processing, orthogonal projections, analysis | Enables file optimization and compression |
| Segmentation Tools | Labkit [45], QuPath [45], Ilastik [45] | Machine learning-based parasite identification | Reduces need to store intermediate analysis files |
| File Format Solutions | OME-TIFF [45], BigTIFF [45], HDF5 [45] | Handles large datasets, maintains metadata | Standardized formats with better compression |
| Visualization Platforms | BigDataViewer [45], Arivis Vision 4D [45] | Manages large Z-stack visualization | Enables working with subsampled data |
| Storage Infrastructure | Cloud SaaS [34], PACS with DICOM [43] | Scalable storage solutions | Reduces local storage burden |
Strategic Implementation Framework
Institutional Storage Infrastructure Planning
Strategic Implementation Pathway
Successful management of large Z-stack files requires coordinated planning across multiple domains:
Infrastructure Assessment:
- Evaluate existing IT infrastructure, including storage capacity, network bandwidth, and computational resources [42]
- Project storage needs based on anticipated scan volumes and retention requirements
- Consider cloud-based Storage as a Service (SaaS) options that can lower costs while maintaining HIPAA compliance [34]
Scanner Selection and Configuration:
Workflow Integration:
- Integrate with laboratory information systems (LIS) and hospital information systems (HIS) for seamless data flow [42] [46]
- Implement DICOM standards to ensure interoperability between systems and future-proofing [43]
- Develop automated routing of images to appropriate storage tiers based on project status
Validation and Quality Assurance:
Effective management of large file sizes in Z-stack digital pathology of parasite specimens requires a comprehensive approach spanning acquisition parameters, computational processing, and strategic storage infrastructure. By implementing the protocols and strategies outlined in this application note, research institutions can maintain the delicate balance between image quality essential for parasite quantification and practical storage constraints. The continuous evolution of compression algorithms, cloud storage solutions, and computational methods for image analysis promises enhanced capabilities for managing these large datasets while advancing parasite research and drug development.
In the field of parasitology, the digital transformation of traditional microscopy through whole-slide imaging (WSI) has opened new frontiers in education, research, and diagnostics. However, this transition presents significant technical challenges related to image clarity, particularly when dealing with specimens of varying thickness and complex morphological structures. The three-dimensional nature of many parasite specimens—from thick helminth eggs to delicate malaria-infected erythrocytes—creates inherent focus limitations that can compromise diagnostic accuracy and research validity. This application note explores established protocols and integrative approaches for overcoming these challenges, with particular emphasis on Z-stack imaging within the context of digital parasite specimen scanning research.
Technical Challenges in Parasite Imaging
Parasitological specimens present unique imaging difficulties due to their diverse morphological characteristics. Traditional two-dimensional imaging systems struggle to maintain uniform focus across entire slides containing specimens with different optical properties. Low-magnification targets such as parasite eggs, adult worms, and arthropods require extensive scanning areas, while high-magnification imaging of intracellular parasites like Plasmodium falciparum demands exceptional resolution to visualize subcellular details [1]. The refractive index mismatches between immersion media, coverslips, and specimen mounting media further complicate high-resolution imaging, particularly with inverted confocal microscopes used for deeper imaging [47].
The fundamental issue stems from the limited depth of field in high-resolution microscopy objectives, which prevents simultaneously capturing all relevant focal planes of a three-dimensional specimen in a single image. This challenge is particularly pronounced in cleared tissue samples, where spherical aberration caused by refractive index mismatches can significantly degrade fluorescence signal intensity and image resolution at depth [47].
Z-Stack Imaging: Core Principles and Methodologies
Fundamental Approach
Z-stack imaging, also known as optical sectioning, addresses focus challenges by systematically capturing multiple images at different focal planes through a specimen. These individual optical sections are then computationally processed to generate a fully focused composite image or a navigable three-dimensional representation. This technique is particularly valuable for thicker parasite specimens where critical diagnostic features may be distributed across different focal planes [1].
Experimental Protocol for Parasite Slide Digitization
The following protocol outlines a standardized approach for Z-stack acquisition of parasite specimens, synthesizing methodologies from recent research applications:
1. Specimen Preparation and Mounting
- Use standardized slide preparation protocols with controlled mounting medium viscosity [48]
- For cleared tissue specimens, employ refractive index-matched mounting media such as MACS-R2 solution (40% MXDA with 50% sorbitol in dH₂O) [47]
- Ensure consistent coverslip thickness (typically #1.5 for high-resolution objectives)
- For live Plasmodium falciparum-infected erythrocytes, use specialized mounting chambers that maintain parasite viability during extended imaging [6]
2. Scanner Configuration and Image Acquisition
- Utilize a motorized stage with precise Z-axis control (minimum step size ≤0.1 µm)
- Set optimal Z-step interval based on numerical aperture and magnification (typically 0.2-0.5 µm for 100× objectives, 1-2 µm for lower magnifications)
- Configure the number of Z-slices to encompass the entire specimen volume with buffer above and below
- Employ the Z-stack function during scanning to accumulate layer-by-layer data for thicker smears [1]
- For extended time-lapse imaging, use reduced light exposure settings to prevent phototoxicity in live parasites [6]
3. Image Processing and Reconstruction
- Apply flat-field correction to compensate for uneven illumination
- Implement computational fusion algorithms to generate a fully focused composite image
- For 3D analysis, use volume rendering techniques to visualize specimen morphology [6]
- Employ deconvolution algorithms to enhance resolution and contrast in the Z-dimension
Table 1: Z-Stack Configuration Parameters for Common Parasite Specimens
| Specimen Type | Recommended Magnification | Z-step Size (µm) | Typical Number of Slices | Primary Challenge |
|---|---|---|---|---|
| Malaria blood stages | 100× | 0.2-0.3 | 15-25 | High resolution at oil immersion |
| Helminth eggs | 40× | 0.5-1.0 | 10-20 | Variable orientation and thickness |
| Intestinal protozoa | 40× | 0.3-0.5 | 20-30 | Internal structural details |
| Arthropod sections | 20× | 1.0-2.0 | 30-50 | Extensive depth range |
| Cleared tissues | 20-40× | 1.0-3.0 | 50-200 | Refractive index matching |
Advanced Integration: Deep Learning for Image Analysis
The application of Z-stack imaging generates substantial datasets that require automated processing approaches. Recent research has successfully integrated three-dimensional imaging with deep learning algorithms to segment and analyze parasite structures automatically [6].
Protocol: Cellpose Integration for 3D Parasite Segmentation
Training Data Preparation
- Acquire Z-stacks of transmitted light images of infected erythrocytes
- For annotation purposes, stain parallel samples with membrane dyes (e.g., CellBrite Red)
- Import fluorescence image stacks into Ilastik software for carving workflow segmentation [6]
- Manually annotate parasites using surface rendering mode in Imaris software for training datasets
Model Training and Validation
- Utilize Cellpose, a convolutional neural network designed for cell segmentation
- Train separate models for different parasite developmental stages (rings, trophozoites, schizonts)
- Employ 10-fold cross-validation with average precision metric (AP) at different intersection-over-union thresholds for performance evaluation [6]
- Achieve AP₀.₅ values ranging from 0.54 to 0.95 depending on parasite stage and model specificity
Implementation for Automated Analysis
- Apply trained models to segment erythrocyte plasma membrane, erythrocyte cytosol, and parasite compartments
- Extract spatial and temporal information throughout developmental cycles
- Enable tracking of individual parasites over the entire intraerythrocytic cycle [6]
The following workflow diagram illustrates the integrated approach combining Z-stack imaging with deep learning analysis:
Integrated Workflow for 3D Parasite Analysis
Refractive Index Matching for Deep Imaging
A significant advancement in addressing depth-related focus challenges comes from the development of the Refractive Index Matching-Deep (RIM-Deep) system. This approach specifically tackles spherical aberration issues that limit imaging depth in inverted confocal microscopes [47].
Experimental Protocol: RIM-Deep System Implementation
System Configuration
- Design an immersion chamber around the optical components of the objective lens
- Integrate a specimen holder with a motorized x-y-z stage
- Implement a mechanism to stabilize refractive index between objective and sample media
Performance Validation
- Apply to cleared macaque prefrontal cortex tissue, demonstrating extended imaging depth from 2mm to 5mm
- Validate system with intact cleared Thy1-EGFP mouse brain, enabling clear axonal visualization at high imaging depth
- Conduct large-scale, deep 3D imaging of intact tissues [47]
Table 2: Quantitative Performance Comparison of Imaging Techniques
| Imaging Technique | Maximum Effective Depth | Lateral Resolution | Axial Resolution | Suitable Specimen Types |
|---|---|---|---|---|
| Conventional Brightfield | Shallow (limited by depth of field) | Moderate | Low | Thin blood smears, single cells |
| Standard Confocal | Moderate (100-200 µm) | High | High | Tissue sections, cultured cells |
| Two-Photon Microscopy | Deep (500 µm+) | Good | Moderate | Thick tissues, live specimens |
| RIM-Deep System | Very Deep (5 mm) | High | High | Cleared tissues, whole organs |
| Light Sheet Microscopy | Deep (mm range) | Good | Moderate | Large cleared specimens |
The Scientist's Toolkit: Essential Research Reagents and Materials
Table 3: Key Research Reagent Solutions for Parasite Imaging
| Item | Function | Application Notes |
|---|---|---|
| SLIDEVIEW VS200 slide scanner | High-resolution digital slide scanning | Capable of Z-stack acquisition; used for parasite specimen digitization [1] |
| Grundium Ocus 40 slide scanner | Portable digital microscopy | 20× 0.75 NA objective; effective for fecal wet mounts [48] |
| Cellpose | Deep-learning based segmentation | Pre-trained neural network for 3D cell segmentation; adaptable to parasite structures [6] |
| Techcyte Human Fecal Wet Mount Algorithm | AI-based parasite detection | Classifies image regions for parasite identification; version 1.0 achieves >97% agreement with light microscopy [48] |
| CUBIC Clearing Reagents | Tissue optical clearing | Enables deep imaging of thick specimens by reducing light scattering [47] |
| MACS-R2 Solution | Refractive index matching | 40% MXDA with 50% sorbitol in dH₂O; facilitates deep imaging [47] |
| Airyscan Microscope | High-resolution live imaging | Enables continuous monitoring of live parasites with reduced phototoxicity [6] |
| CellBrite Red | Membrane staining | Facilitates annotation for training datasets; not included in final analysis [6] |
Validation and Performance Metrics
Rigorous validation of digital imaging systems is essential before implementation in research or diagnostic settings. Recent studies have established comprehensive evaluation protocols:
Protocol: Validation of Digital Microscopy with CNN Analysis
Reference Sample Preparation
- Establish a panel of confirmed positive and negative stool sediment samples
- Include all relevant target parasite species with minimum three positive specimens per organism
- Account for rare species that may have limited availability [48]
Performance Assessment
- Evaluate positive slide-level agreement (achieving 97.6% in validation studies)
- Determine negative agreement (96.0% compared with light microscopy)
- Assess analytical sensitivity through dilution series
- Conduct intra- and inter-run precision studies to demonstrate reproducibility [48]
Clinical Implementation
- Perform prospective testing on routine clinical samples
- Measure overall agreement with light microscopy (98.1% reported)
- Calculate Cohen's Kappa coefficient for diagnostic concordance (κ = 0.915) [48]
- Optimize confidence thresholds for specific classifiers based on validation results
The integration of Z-stack imaging methodologies with computational approaches represents a paradigm shift in parasitology research and diagnostics. By systematically addressing focus and thickness challenges through optical sectioning, refractive index matching, and automated image analysis, researchers can overcome traditional limitations of conventional microscopy. The protocols and applications detailed in this document provide a framework for implementing these advanced techniques, enabling more accurate morphological analysis, enhanced educational resources, and accelerated drug development efforts. As these technologies continue to evolve, their implementation promises to deepen our understanding of parasite biology and expand diagnostic capabilities in both resource-rich and limited settings.
The digitization of parasitology specimens through whole-slide imaging (WSI) represents a significant advancement for education, research, and diagnostics. However, the adoption of Z-stack scanning, which captures multiple focal planes to accommodate varying specimen thickness, introduces challenges related to increased scan times and data storage. These challenges can impede workflow efficiency in research and clinical settings. This application note details protocols and data demonstrating how strategic approaches, including intelligent Z-stack acquisition and hardware integration, can significantly reduce scan times while preserving, and sometimes even enhancing, the diagnostic quality essential for parasite morphology studies [1] [49].
Quantitative Evidence: Z-Stack Impact on Analysis
Research consistently shows that Z-stack scanning provides more comprehensive specimen data, which directly benefits downstream analysis, particularly for Artificial Intelligence (AI) models. The following table summarizes key findings from a recent study on AI-powered mitosis detection, a task analogous to identifying small parasitic structures [36].
Table 1: Quantitative Impact of Z-Stack Scanning on AI Detection Performance
| Metric | Single-Layer Scanning | Z-Stack Scanning | Relative Change | p-value |
|---|---|---|---|---|
| AI Detection Sensitivity | 0.601 | 0.704 | +17.14% | < 0.001 |
| AI Detection Precision | 0.753 | 0.757 | +0.53% | Not Significant |
| Average WSI File Size | 87.02 GB | 418.92 GB | ~3.81x increase | - |
The data confirms that Z-stack scanning provides a substantial boost in detection sensitivity for critical microscopic features. This is achieved without a statistically significant loss in precision, meaning the AI finds more true positives without a corresponding increase in false positives. The trade-off is a significant increase in data volume, which directly impacts storage costs and potential data transfer times [36].
Protocols for Efficient Z-Stack Scanning in Parasitology
Protocol 1: Traditional Multi-Plane Z-Stack Digitization
This protocol outlines the established method for creating a comprehensive digital parasite database, as used in foundational research [1] [50].
Experimental Workflow:
The following diagram illustrates the sequential steps for traditional specimen digitization.
Methodology Details:
- Specimen Collection: Utilize existing slide specimens of parasitic eggs, adults, and arthropods. Specimens should be intended for education and research only, with no associated personal information [1] [50].
- Digital Scanning: Employ a slide scanner (e.g., SLIDEVIEW VS200) with a Z-stack function. This function varies the scan depth to accumulate layer-by-layer data, which is crucial for capturing thicker smears in focus. All specimens, from low-magnification eggs to high-magnification malarial parasites, can be successfully digitized using this method [1] [50].
- Image Review and Curation: All digital images must be manually reviewed for focus and image clarity by researchers before incorporation into the database. Slides with out-of-focus areas should be rescanned as needed [1].
- Database Construction: Upload the final, approved virtual slide data to a shared server. Organize the database with a folder structure based on taxonomic classification. Attach explanatory notes in multiple languages (e.g., English and Japanese) to each specimen to facilitate learning and international collaboration [1] [50].
Protocol 2: Smart Inline Volumetric Scanning with Edge AI
This advanced protocol leverages real-time AI analysis during the scanning process to dramatically improve efficiency, representing a cutting-edge innovation in the field [49].
Experimental Workflow:
The following diagram illustrates the integrated, AI-driven workflow for smart scanning.
Methodology Details:
- Real-Time Volumetric Capture: Use a scanner (e.g., Pramana Spectral series) with sophisticated software and a powerful GPU to perform real-time volumetric scanning. The system captures Z-stacks and fuses the best pixels to produce a high-quality composite image [49].
- Inline AI Compute: Deploy AI algorithms (e.g., Techcyte AI for research use) directly on the scanner's hardware. This "edge AI" capability allows the analysis to occur during the scanning process, not afterward. The AI analyzes each field of view to flag relevant objects (e.g., specific parasites), mimicking a microscopist's fine-focus function but with automation [49].
- Selective Z-Stack Storage: This is the core efficiency gain. Instead of saving the entire, massive Z-stack for the whole slide, the system retains the full multi-plane image data only in the areas immediately surrounding the AI-flagged objects. This targeted approach drastically reduces the final data footprint without losing critical diagnostic information [49].
- Automated Quality Control: The scanning software should include onboard quality control to automatically detect and correct for issues like poor focus, artifacts, and image stitching errors, all without requiring user intervention [49].
The Scientist's Toolkit: Essential Research Reagents & Materials
Successful implementation of efficient digital parasitology workflows requires specific tools and technologies. The following table details key solutions and their functions.
Table 2: Key Research Reagent Solutions for Digital Parasitology
| Item Name | Function/Application | Specific Example / Vendor |
|---|---|---|
| High-Throughput Slide Scanner | Digitizes glass slides into whole-slide images (WSIs); requires Z-stack capability for thick specimens. | SLIDEVIEW VS200 (Evident); Pramana Spectral series [1] [49]. |
| Edge AI Computing Platform | Enables real-time AI analysis during scanning, allowing for intelligent data acquisition and filtering. | Pramana scanners with integrated Techcyte AI algorithms [49]. |
| Specialized Staining Kits | Provides contrast for specific parasites or structures under microscopy (e.g., for protozoa). | Trichrome staining, Kinyoun’s acid-fast staining, Giemsa staining [50]. |
| Cell Segmentation Software | Automated identification and delineation of cells/parasites in complex images using deep learning. | Cellpose (pretrained convolutional neural network) [6]. |
| Interactive Image Analysis Tool | Machine learning-based tool for segmenting and annotating images, useful for creating training data. | Ilastik software package [6]. |
| Shared Server Database | Centralized platform for storing, organizing, and sharing virtual slide data with access control. | Windows Server with web browser access for ~100 simultaneous users [1]. |
The pursuit of workflow efficiency in the digital scanning of parasite specimens does not necessitate a compromise on diagnostic quality. Evidence shows that a strategic approach to Z-stack scanning is key. While traditional comprehensive Z-stacking reliably produces high-quality digital archives for broad educational and research purposes, the emergence of smart inline volumetric scanning with edge AI represents a paradigm shift. This advanced protocol directly addresses the major bottlenecks of scan time and data storage by acquiring volumetric data intelligently and selectively. For researchers and drug development professionals building the future of digital parasitology, adopting these efficient and targeted scanning protocols is essential for scalable, high-quality research outcomes.
Validation and Impact: Z-Stack vs. Conventional Microscopy in Practice
The transition from traditional glass slide microscopy to whole slide imaging (WSI) represents a paradigm shift in pathological diagnosis and research. For researchers working with parasite slide specimens, which often contain complex three-dimensional structures, Z-stack scanning technology that captures multiple focal planes along the z-axis is of particular importance [51]. This technical note examines the diagnostic concordance between digital and glass slide analysis, with special emphasis on methodologies relevant to parasitology research. We present quantitative concordance data, detailed experimental protocols for Z-stack imaging, and implementation guidelines to ensure reliable digital analysis of parasitic organisms.
Quantitative Diagnostic Concordance Evidence
Multiple controlled studies have demonstrated high diagnostic concordance between digital and glass slide analysis, though specific variations exist across tissue types and diagnostic categories.
Table 1: Intraobserver Concordance for Microscopic Feature Detection in Dermatitis Cases [52]
| Histologic Feature | Average Kappa (κ) Concordance | Concordance Level |
|---|---|---|
| Fungal Bodies | κ = 0.47–0.76 | Good |
| Sebocytes | κ = 0.51–1.00 | Good |
| Civatte Bodies | κ = 0.21–0.71 | Moderate |
| Mast Cells | κ = 0.29–0.78 | Moderate |
| Eosinophils | κ = 0.31–0.79 | Moderate |
| Pigment-Laden Macrophages | κ = 0.34–0.66 | Moderate |
| Parakeratosis | κ = 0.21–0.61 | Moderate |
| Plasma Cells | κ = 0.15–0.49 | Poor to Fair |
| Neutrophils | κ = 0.12–0.48 | Poor to Fair |
| Melanin in Epidermis | κ = 0.15–0.58 | Poor to Fair |
This study also found that assessment of digital slides required significantly more time (mean 176.77 seconds vs. 137.61 seconds, P < 0.001) and higher objective magnification (mean 18.28 vs. 14.07, P < 0.001) compared to glass slides [52].
Table 2: Diagnostic Accuracy for Breast Biopsy Interpretation by Diagnostic Category [53]
| Diagnostic Category | Glass Slides Accuracy (%) | Digital Slides Accuracy (%) | P-value |
|---|---|---|---|
| Invasive Carcinoma | 96 | 93 | 0.04 |
| Ductal Carcinoma In Situ (DCIS) | 84 | 79 | <0.01 |
| Atypia | 48 | 43 | 0.08 |
| Benign Without Atypia | 87 | 82 | <0.01 |
The slightly lower accuracy for digital format in intermediate diagnostic categories (DCIS and atypia) suggests that cases in the "middle of the diagnostic spectrum" may present more challenges in digital format [53].
Z-Stack Scanning for Enhanced Detection of Microscopic Structures
Z-stack scanning captures multiple focal planes along the z-axis (perpendicular to the slide surface), creating a three-dimensional digital representation of the specimen. This technology is particularly valuable for analyzing thick specimens or small-scale structures where critical diagnostic features may reside at different focal planes [51].
Impact on Artificial Intelligence Detection Performance
A recent systematic evaluation demonstrated the significant value of Z-stack scanning for AI-based detection of challenging histological structures:
Table 3: Z-Stack Impact on AI Mitosis Detection Performance in Meningiomas [36]
| Scanner | Segmentation Model | Single-Layer Sensitivity | Z-Stack Sensitivity | Improvement |
|---|---|---|---|---|
| P480DX | PSPNet | 0.633 | 0.726 | +14.74% |
| P480DX | Segformer | 0.664 | 0.726 | +9.32% |
| P480DX | DeepLabV3+ | 0.675 | 0.717 | +6.23% |
| GT 450 | PSPNet | 0.636 | 0.739 | +16.33% |
| GT 450 | Segformer | 0.616 | 0.740 | +20.09% |
| GT 450 | DeepLabV3+ | 0.681 | 0.773 | +13.52% |
| AxioScan 7 | PSPNet | 0.523 | 0.634 | +21.22% |
| AxioScan 7 | Segformer | 0.528 | 0.641 | +21.33% |
| AxioScan 7 | DeepLabV3+ | 0.554 | 0.649 | +17.15% |
Across all scanner and AI model combinations, Z-stack scanning significantly improved sensitivity for mitosis detection (average improvement: +17.14%) with only marginal impact on precision [36]. This demonstrates that for detecting small-scale features like mitotic figures (approximately 10μm) - similar in scale to many parasitic organisms - Z-stack scanning provides more comprehensive morphological information that enhances detection performance.
Z-Stack Scanning Protocol for Parasite Specimens
Based on published methodologies for cytology specimens and histopathology samples, the following protocol is recommended for parasite slide digitization:
Equipment and Software Setup
- Select a digital pathology scanner with Z-stack capability (e.g., Pannoramic series [3DHISTECH], Aperio GT 450 [Leica], AxioScan 7 [Zeiss], or NanoZoomer S210 [Hamamatsu]) [51] [36]
- Ensure compatible slide viewing software (e.g., Pannoramic Viewer, Slim DICOM viewer) [52] [54]
- Verify monitor specifications: minimum liquid crystal display with 100 pixels per inch [52]
Z-Stack Parameter Configuration
- Set objective magnification to 40x or higher for parasite identification [36]
- Configure Z-stack to capture a minimum of 5 focal planes [36]
- Set interplane distance to 0.6-0.75μm based on specimen thickness [36]
- For thicker parasite specimens (e.g., helminth sections), increase to 7-9 focal planes with appropriate interplane distance
- Enable "extended focusing" or "maximum projection" functions if available [51]
Image Acquisition and Processing
- Scan slides using established whole slide imaging protocols [55]
- Apply JPEG compression (90% quality) for file size management without significant quality loss [36]
- Export images in standard formats (e.g., bigTIFF) compatible with downstream analysis tools [36]
- Validate image quality by checking multiple Z-planes for critical focus of target parasitic structures
Quality Control
- Verify that all Z-planes are in focus throughout the entire specimen area
- Check for stitching artifacts or missing fields of view
- Confirm adequate color balance and contrast for parasite morphology identification
Visualization and Annotation Tools for Digital Analysis
Standardized Annotation Approaches
Implementing standardized annotation practices ensures consistency and reusability of digital slide markings:
- Develop a standardized annotation dictionary specifying shapes, colors, and coding for common parasitic structures [56]
- Assign unique SNOMED CT codes to each annotated entity for cross-system compatibility [56]
- Use consistent colors and shapes for specific parasite morphological features across all research annotations
- Store annotations in DICOM format for interoperability with medical imaging systems [54]
Web-Based Slide Viewing Implementation
The Slim viewer application provides an open-source, web-based solution for viewing Z-stack digital slides:
Z-Stack Visualization Workflow: Imaging data flow from scanning through web-based visualization.
The visualization workflow illustrates how Z-stack images are stored on DICOMweb servers and accessed by web-based viewers that dynamically retrieve relevant focal planes and resolution levels based on researcher interaction [54].
Research Reagent Solutions for Parasite Slide Preparation
Table 4: Essential Research Reagents for Parasite Slide Digitization
| Reagent/Material | Function | Application Notes |
|---|---|---|
| Hematoxylin and Eosin (H&E) | General histological staining for tissue structure | Standard for morphological assessment [52] [36] |
| Periodic Acid-Schiff (PAS) | Staining for polysaccharides in parasite walls | Identifies fungal elements and some parasitic structures [52] |
| Cell Blocks | Matrix for cytological specimen stabilization | Enables sectioning of liquid-based specimens [51] |
| Liquid-Based Cytology (LBC) Media | Preservative and preparation medium | Improves cell distribution and morphology [51] |
| Proteinase K | Enzyme for DNA extraction from microdissected samples | Molecular analysis of specific parasitic structures [51] |
| Maxwell 16 AS2000 System | Automated nucleic acid extraction | Downstream molecular characterization [51] |
Implementation Considerations for Research Laboratories
Technical and Workflow Factors
- Storage Requirements: Z-stack WSIs require approximately 3.81× more storage space than single-layer images (418.92 GB vs. 87.02 GB for 22 slides) [36]
- Scanning Time: Z-stack scanning increases capture time proportionally to the number of focal planes [51]
- Computational Resources: AI analysis of Z-stack images requires processing multiple planes, increasing computational demands [36]
Color Accessibility in Visualization
When implementing digital annotation systems for collaborative research:
- Ensure sufficient color contrast (minimum 4.5:1 ratio) for all visual elements [57]
- Avoid red-green color combinations that are problematic for color vision deficiency [58]
- Implement colorblind-friendly palettes using blue and red as primary hues [58]
- Provide alternative differentiation methods (shapes, patterns, labels) beyond color coding [58]
Digital pathology with Z-stack scanning demonstrates high diagnostic concordance with traditional glass slide microscopy while providing significant advantages for specialized applications like parasite identification. The technology enables improved detection of small morphological structures through multi-planar imaging and enhances AI-assisted analysis. Successful implementation requires careful attention to scanning protocols, annotation standardization, and appropriate visualization tools. For parasite research specifically, Z-stack technology offers the potential to improve detection sensitivity and enable more detailed morphological analysis of complex three-dimensional structures that may be missed in single-plane digital imaging.
Digital scanning of parasite slide specimens with Z-stack imaging introduces significant methodological changes in pathological workflow. This application note provides a standardized protocol for quantifying its impact on two critical metrics: slide screening time and inter-observer agreement. We detail methodologies for conducting time-motion studies and reliability assessments, providing structured frameworks for data collection and analysis to ensure consistent, comparable, and valid results for the scientific and drug development community.
The adoption of digital scanning and Z-stack imaging in parasitology research necessitates rigorous quantification of its impact on laboratory workflow. Inter-observer agreement is a cornerstone of analytical validity, ensuring that findings are consistent across different researchers [59]. Similarly, understanding changes in screening time is crucial for assessing efficiency gains or bottlenecks introduced by new digital methodologies. This document establishes detailed protocols for evaluating these key performance indicators within the context of a broader thesis on digital parasitology.
IORA Methods and Reporting in Clinical Workflow Studies
The table below summarizes methods for Inter-Observer Reliability Assessment (IORA) based on a review of clinical workflow studies, which can be adapted for parasitology slide screening [59].
Table 1: Inter-Observer Reliability Assessment (IORA) Methods and Reporting Practices
| IORA Method | Frequency of Use | Typical Reported Values | Reporting Notes |
|---|---|---|---|
| Not Specified | 27% of studies | ~85% (range: 73%-98%) | Vague reporting limits reproducibility [59]. |
| Kappa Coefficient | 12% of studies | 0.66 to 0.97 | Values sometimes reported as a single point, a range, or a lower bound [59]. |
| Intraclass Correlation (ICC) | 4% of studies | 0.96 to 0.99 | Used in combination with other metrics [59]. |
| Percentage Agreement | 2% of studies | ≥85% | A simple but potentially overestimating measure [59]. |
| Bland-Altman | 2% of studies | -0.06 (95% CI: -0.284, 0.164) | Less common in workflow timing studies [59]. |
| Pearson/Spearman Correlation | 4% of studies | 0.84 to 0.96 | Measures association, not strictly agreement [59]. |
Workflow Time-Motion Data Schema
Time-motion studies should capture task-level detail. The following table outlines a proposed data schema for recording workflow timing during slide screening.
Table 2: Workflow Time-Motion Data Schema for Slide Screening
| Variable Name | Data Type | Description | Example Value |
|---|---|---|---|
| Slide_ID | Categorical | Unique specimen identifier | SP-2023-001 |
| Technician_ID | Categorical | Unique observer identifier | T-01 |
| TaskStartTime | DateTime | Start time of a discrete task (HH:MM:SS) | 10:05:23 |
| TaskEndTime | DateTime | End time of a discrete task (HH:MM:SS) | 10:07:45 |
| Task_Duration | Numerical | Duration in seconds | 142 |
| Task_Category | Categorical | High-level activity (e.g., Slide_Prep, Digital_Scan, Microscopy_Review) |
Digital_Scan |
| Specific_Activity | Categorical | Detailed description (e.g., Load_Slide_Scanner, Set_Z-Stack_Parameters, Focus_Check) |
Set_Z-Stack_Parameters |
| Interruption | Boolean | Flag for occurrence of interruption | TRUE |
| Interruption_Type | Categorical | Categorization of interruption (e.g., Technical_Error, Procedural_Query) |
Technical_Error |
Experimental Protocols
Protocol for Time-Motion Study of Screening Time
This protocol is designed to capture accurate and quantitative data on the time required for slide screening using both traditional and digital Z-stack methods.
Objective
To quantify and compare the total screening time and task distribution for parasite slide analysis using conventional microscopy versus digital scanning with Z-stack reconstruction.
Materials and Equipment
- Parasite Slide Specimens: A batch of pre-prepared, stained slides of consistent specimen type (e.g., blood smears for malaria).
- Traditional Microscopy Setup: Standard compound microscope.
- Digital Scanning System: A whole-slide scanner capable of automated Z-stacking.
- Time-Motion Data Capture Tool: Electronic data capture tool (e.g., customized spreadsheet or dedicated app) to record time-stamped tasks [59].
Procedure
- Observer Training: Train all observers on both the traditional and digital workflows. Standardize the procedural definition of all task categories (e.g.,
Slide_Loading,Initial_Focus,System_Scan,Digital_Review) to ensure consistent recording. - Session Setup: For each session, assign a batch of 10 slides to a single observer for screening via one method (traditional or digital).
- Data Recording: The observer, or a dedicated data recorder, will use the data capture tool to continuously record the
Task_Category,Specific_Activity, and timestamps (Start_Time/End_Time) as defined in Table 2. - Task Completion: The observer will proceed with the screening until all slides in the batch are completed, recording any deviations or interruptions.
- Replication: Repeat steps 2-4 for a minimum of 5 sessions per observer per method. Counterbalance the order of method presentation to control for learning effects.
Data Analysis
- Calculate mean and standard deviation for total screening time per slide for each method.
- Perform a paired t-test to compare total screening times between the two methods.
- Analyze the proportion of time spent on different task categories (e.g., preparation, active scanning/review, data handling) to identify workflow differences.
Protocol for Assessing Inter-Observer Agreement
This protocol assesses the consistency of findings between different observers examining the same digital Z-stack slide specimens.
Objective
To determine the inter-observer reliability of parasite identification and quantification in digitally scanned Z-stack images.
Materials and Equipment
- Digital Slide Set: A curated set of 20 digital Z-stack slide images, encompassing a range of parasite species and densities, including some negative specimens.
- Standardized Reporting Form: A digital form for recording findings (e.g., parasite species, count, stage, and confidence level).
Procedure
- Observer Selection and Blinding: Select at least three trained observers. Each must analyze the digital slide set independently and in a blinded fashion, with no knowledge of other observers' results or the "true" diagnosis.
- Image Analysis: Each observer reviews the Z-stack images using the designated software and completes the standardized reporting form for each slide.
- Data Collection: Collect all completed forms. Key data points for analysis include:
- Categorical Data: Presence/Absence of parasites, Species Identification.
- Numerical Data: Parasite Counts.
Data Analysis
- For Categorical Data (e.g., Species ID): Calculate the Fleiss' Kappa (κ) statistic to measure agreement among multiple observers beyond chance. Interpret κ values as follows: <0.20 (Poor), 0.21-0.40 (Fair), 0.41-0.60 (Moderate), 0.61-0.80 (Substantial), 0.81-1.00 (Almost Perfect) [59].
- For Numerical Data (e.g., Parasite Counts): Calculate the Intraclass Correlation Coefficient (ICC). A two-way random-effects model for absolute agreement is recommended to assess the reliability of quantitative measurements [59].
- Reporting: Report the chosen statistic, its value, confidence interval, and the sample size used for the calculation. Avoid non-specific reporting like "agreement was >85%" [59].
Workflow and Pathway Visualization
Experimental Workflow for Z-Stack Slide Analysis
The following diagram outlines the logical workflow for a study comparing traditional and digital methods, incorporating time-motion and reliability assessments.
Z-Stack Analysis Workflow
Inter-Observer Agreement Assessment Pathway
This diagram details the logical sequence for conducting and analyzing an inter-observer agreement study.
IORA Assessment Pathway
The Scientist's Toolkit: Research Reagent Solutions
The following table details key materials and their functions for experiments in digital parasitology and workflow analysis.
Table 3: Essential Research Reagents and Materials
| Item Name | Function/Application | Technical Notes |
|---|---|---|
| Standardized Parasite Smears | Provides consistent, biologically relevant specimens for method comparison. | Use pre-validated, stained blood smears (e.g., Giemsa). Batch consistency is critical. |
| Whole-Slide Scanner with Z-Stack | Digitizes physical slides by capturing multiple focal planes. | Ensure software compatibility with downstream analysis tools and adequate Z-resolution. |
| Electronic Data Capture Tool | Enables real-time, time-stamped recording of workflow tasks [59]. | Customizable spreadsheet or mobile app to minimize observer burden. |
| Statistical Analysis Software | Calculates Inter-Observer Reliability metrics (Kappa, ICC) and performs t-tests. | R, SPSS, or Python with appropriate statistical libraries. |
| Standardized Reporting Form (Digital) | Ensures consistent data collection from all observers for reliability analysis. | Should include fields for species, count, stage, and confidence level. |
The digital scanning of biological specimens, particularly parasite slide samples, has been revolutionized by the adoption of Z-stack imaging. This technique involves capturing multiple focal planes along the Z-axis, creating a three-dimensional image stack from a single specimen. For researchers investigating parasites like Plasmodium falciparum, the causative agent of malaria, this approach provides critical depth information that is lost in conventional single-plane imaging. The inherent challenges in analyzing parasites—including their small size, complex intracellular structures, and the low contrast and transparency of their host erythrocytes—make Z-stack imaging an indispensable tool for modern parasitology research. When combined with artificial intelligence (AI) and quantitative analysis, Z-stack imaging enables unprecedented detection capabilities, driving advances in both basic science and drug development.
Recent studies have demonstrated that this technological synergy directly enhances analytical outcomes. For instance, research on meningiomas has shown that Z-stack scanning significantly improves AI-based detection of cellular events, increasing sensitivity by over 17% compared to single-layer imaging while maintaining precision [15]. This principle translates directly to parasitology, where the enhanced depth information allows AI algorithms to more accurately identify and quantify parasite structures, leading to more reliable morphological analyses and higher-throughput screening of potential therapeutic compounds.
Quantitative Analysis of Enhanced Detection Performance
The integration of Z-stack imaging with AI analysis produces measurable improvements in detection and quantification capabilities. The following table summarizes key performance metrics demonstrated across recent studies:
Table 1: Performance Metrics of Z-Stack Enhanced AI Detection in Biological Imaging
| Application Context | Detection Target | Key Metric | Single-Layer Performance | Z-Stack Enhanced Performance | Reference |
|---|---|---|---|---|---|
| Meningioma Analysis | Mitosis Detection | Sensitivity | Baseline | +17.14% improvement | [15] |
| P. falciparum Imaging | Infected Erythrocyte Segmentation | Average Precision (AP@0.5) | Not Reported | 0.54-0.95 (depending on model) | [6] |
| C. elegans Mitochondria | 3D Reconstruction Accuracy | Qualitative Assessment | Limited by photobleaching | Enabled despite photobleaching | [23] |
| General Cellular Imaging | Small-Structure Resolution | Spatial Resolution | Diffraction-limited | ~2x improvement in XY and Z planes | [6] |
The performance benefits extend beyond simple detection accuracy. Z-stack imaging enables more robust quantitative analysis by providing comprehensive three-dimensional data, which is particularly valuable for tracking dynamic biological processes. In parasite research, this capability allows scientists to monitor the complete intraerythrocytic development of Plasmodium falciparum throughout its 48-hour life cycle with single-cell resolution [6]. The temporal dimension added by time-series Z-stack acquisition further enhances the ability to study dynamic processes such as protein export and organelle reorganization, which are critical targets for therapeutic intervention.
Table 2: Impact of Z-Stack Imaging on Quantitative Analysis Capabilities
| Analysis Type | Single-Layer Limitation | Z-Stack Enhancement | Research Implication |
|---|---|---|---|
| Volume Measurements | Inaccurate due to partial volume effects | Precise 3D volumetric quantification | Accurate assessment of organelle changes during parasite development |
| Protein Localization | Limited to 2D projection | Subcellular spatial mapping in 3D | Detailed study of export mechanisms in malaria parasites |
| Morphological Analysis | Subject to orientation artifacts | Comprehensive structural characterization | Better classification of parasite stages and phenotypes |
| Dynamic Process Tracking | Inferred from multiple cells | Continuous single-cell monitoring | Direct observation of drug effects on parasite life cycle |
Experimental Protocols for Z-Stack-Based Parasite Imaging
Parasite Culture and Preparation
Successful Z-stack imaging begins with proper specimen preparation. For Plasmodium falciparum studies, maintain parasite cultures in human O+ erythrocytes at 5% hematocrit in complete parasite culture media supplemented with 10% pooled human serum to promote optimal surface expression of cytoadhesion ligands [60]. Gas the cultures with a microaerophilic atmosphere (5% O₂, 5% CO₂, 90% N₂) using non-vented flasks. Monitor parasitemia daily through thin blood smears stained with Giemsa or Hemacolor, maintaining parasitemia below 5% to prevent culture collapse from nutrient depletion [60]. For imaging experiments, select parasite lines with defined var gene expression patterns, such as the IT4var19 line selected for brain endothelial binding, and verify predominant var transcript expression via quantitative RT-PCR [60].
Z-Stack Image Acquisition Protocol
The following protocol details optimal Z-stack acquisition for parasite imaging:
Specimen Mounting: Transfer parasites to imaging chambers using pipetting rather than worm picking to minimize mechanical stress that can induce abnormal morphologies [23]. For live imaging, consider immobilization strategies such as polystyrene nanobeads for motile specimens [23].
Microscope Configuration: Utilize a confocal laser scanning microscope equipped with Airyscan detection, such as the Zeiss LSM980 with Airyscan2 in SR mode [6] [23]. Employ an oil-immersion objective (e.g., 63×/1.4 NA) with high numerical aperture for optimal resolution.
Z-Stack Parameters: Set the Z-step size to 120-360 nm, achieving oversampling beyond the software recommendations to maximize 3D information [23]. Capture additional sections above and below the target area to accommodate sample drift during time-lapse experiments.
Image Acquisition: For live imaging, use higher laser power with short dwell times per pixel (e.g., 1.03 µs) to obtain high-contrast images with minimal motion blur [23]. Acquire dual-color z-stacks sequentially to monitor both parasite and host cell components.
Temporal Resolution: For time-series experiments, set acquisition intervals to capture key biological processes (e.g., 1-minute intervals for cell division events) [23]. Manually recenter the field of view between acquisitions if specimen drift occurs.
AI-Assisted Image Analysis Workflow
Once Z-stacks are acquired, implement the following analysis workflow:
Image Preprocessing: Perform Z-stack alignment to correct for sample movement during acquisition using registration algorithms [23]. Apply image subtraction to enhance contrast and crop regions of interest to reduce computational load.
Cell Segmentation: Employ deep learning-based segmentation tools such as Cellpose, a convolutional neural network pretrained on diverse biological images [6]. For parasite-specific segmentation, retrain Cellpose on annotated datasets of infected erythrocytes, including ring stages and trophozoites/schizonts. Implement 10-fold cross-validation to evaluate model performance, using average precision (AP) at different intersection-over-union (IoU) thresholds as validation metrics [6].
Feature Extraction: Quantify morphological parameters (volume, sphericity, intensity) from segmented 3D objects. For dynamic processes, track these features over time to capture temporal patterns.
Data Visualization: Generate 3D renderings of segmented structures for qualitative assessment and illustration using software such as Imaris [6].
Research Reagent Solutions for Parasite Imaging
Successful implementation of Z-stack imaging and AI analysis requires specific research reagents and tools. The following table details essential materials and their applications:
Table 3: Essential Research Reagents for Z-Stack Imaging of Parasites
| Reagent/Tool | Specification | Application in Protocol | Research Function |
|---|---|---|---|
| Primary HBMECs | Passage 6 or lower, maintained at 80-90% confluency | Microvessel modeling for cytoadhesion studies | Provides human-relevant cellular context for parasite-host interactions [60] |
| Cellpose | Convolutional neural network with 3D extension | Automated segmentation of infected erythrocytes | Enables high-throughput analysis of 3D image stacks [6] |
| Airyscan Microscope | Zeiss LSM980 with Airyscan2 detection | High-resolution Z-stack acquisition | Provides superior spatial resolution (120nm XY, 360nm Z) with reduced photodamage [6] [23] |
| mtGFP Reporter | Mitochondrial matrix targeting sequence | Live-cell imaging of organelles | Enables visualization of mitochondrial dynamics during parasite development [23] |
| CellBrite Red | Membrane dye | Annotation for training datasets | Facilitates discernment of cell boundaries for AI training [6] |
| Ilastik Software | Interactive machine learning tool | Volume segmentation based on boundary information | Supports annotation and segmentation of complex cellular structures [6] |
| Polystyrene Nanobeads | ~1µm diameter | Mechanical immobilization of specimens | Enables live imaging without drug-induced artifacts [23] |
Advanced Analytical Considerations
Addressing Photobleaching in Quantitative Analysis
A significant advantage of Z-stack enhanced AI analysis is its robustness to photobleaching, a fundamental challenge in fluorescence microscopy. Conventional intensity-based measurements become unreliable over extended time-lapse experiments due to irreversible fluorophore loss. However, research on C. elegans mitochondria has demonstrated that global threshold-based binarization prior to image segmentation remains effective despite moderate photobleaching [23]. This approach enables accurate morphological analyses and object counting independent of intensity decay, expanding the temporal window for quantitative live-cell imaging of parasitic processes.
3D Rendering for Spatial Analysis
The 3D data from Z-stacks enables sophisticated spatial analyses of parasite organization and host-pathogen interactions. For Toxoplasma gondii, 3D rendering has revealed extensive F-actin networks connecting parasites within the parasitophorous vacuole, facilitating material exchange and synchronized replication [61]. Similar approaches applied to Plasmodium falciparum have illuminated the spatial dynamics of knob-associated histidine-rich protein (KAHRP) export and assembly beneath the erythrocyte membrane [6]. These structural insights are crucial for understanding pathogenesis and identifying vulnerabilities in parasite organization.
The integration of Z-stack imaging with AI-powered analytical tools represents a transformative advancement in parasitology research. This synergistic approach enables researchers to overcome long-standing challenges in parasite visualization and quantification, particularly the limitations of conventional 2D imaging for analyzing complex 3D biological systems. The enhanced detection capabilities, robust quantitative analyses, and sophisticated 3D renderings afforded by this methodology provide unprecedented insights into parasite biology, host-pathogen interactions, and the mechanisms of disease pathogenesis. As these technologies continue to evolve and become more accessible, they will undoubtedly accelerate drug discovery and development efforts, ultimately contributing to improved control strategies for parasitic diseases that remain major global health challenges.
Z-stacking is an advanced digital imaging technique that involves capturing multiple images of a specimen at different focal planes and combining them into a single composite image with an extended depth of field [9]. This process creates a three-dimensional (3D) representation of the specimen, allowing researchers to observe and analyze samples in their entire thickness with sharp focus throughout [9]. In modern digital pathology, this technique overcomes the inherent limitation of conventional microscopy where only a small part of a thick specimen is in sharp focus at any given time due to the limited depth of field of microscope objectives [9].
The principle of Z-stacking is based on addressing the depth of field challenge. By systematically capturing images from the top to the bottom of a sample and combining these focal planes, Z-stacking produces a "stacking" image where the entire depth of the sample is in sharp focus [9]. This technique is particularly valuable for pathology specimens with unusual thicknesses or when structures of interest are located at different tissue depths [9].
When applied to parasitology research, Z-stacking enables detailed visualization of parasite morphology, structural relationships, and host-parasite interactions that would be difficult to observe with conventional 2D microscopy. The creation of comprehensive Z-stack databases provides a rich resource for training artificial intelligence (AI) algorithms and advancing both diagnostic capabilities and drug discovery efforts.
Z-Stack Applications in Parasitic Disease Research
Enhanced Diagnostic Accuracy
Z-stacking technology has demonstrated significant value in diagnostic applications for parasitic diseases, particularly for soil-transmitted helminth (STH) infections. Research conducted in primary healthcare settings in Kenya has shown that deep-learning systems (DLS) analyzing digitally scanned stool samples can achieve high diagnostic accuracy for detecting STH infections [62]. In a study involving 1,180 samples, the DLS demonstrated sensitivity of 80% for Ascaris lumbricoides, 92% for Tricuris trichiura, and 76% for hookworm infections, with specificities of 98%, 90%, and 95% respectively [62].
Importantly, the DLS detected a substantial number of light intensity infections that were missed by manual microscopy, with 79 samples (10%) classified as negative by manual microscopy found to contain STH eggs upon digital reassessment [62]. This enhanced detection capability is particularly valuable for monitoring and evaluation of control programs, where accurate identification of low-intensity infections is crucial for assessing intervention effectiveness.
Cytology and Complex Specimen Analysis
Cytology samples present particular challenges for digital pathology due to their dispersed cells across multiple focal planes. Z-stacking addresses this limitation by enabling pathologists to navigate seamlessly through depth, replicating the essential functionality of traditional microscopes in digital environments [63]. Commercial digital pathology platforms have incorporated Z-stack navigation specifically designed for cytology, allowing pathologists to step forward or backward through focal planes or utilize auto-play mode to scroll smoothly through depth [63].
This capability is especially valuable for analyzing parasitic infections where cytological specimens are common, such as in fine needle aspirations of tissue cysts or fluid-based cytology preparations. The integration of annotation tools, measurement capabilities, and image management within these platforms further enhances research efficiency and collaboration potential [63].
Integration with Artificial Intelligence and Machine Learning
AI-Based Digital Pathology Workflows
The combination of Z-stack imaging with artificial intelligence represents a transformative approach to parasitic disease diagnosis and research. AI-based digital pathology (AI-DP) creates an integrated workflow that digitalizes the entire diagnostic process, from sample preparation to result reporting [2]. This workflow typically includes electronic data capture tools, a whole slide imaging (WSI) scanner, an AI model for analysis, and a data reporting system [2].
Compared to traditional microscopy, the AI-DP workflow offers significant advantages in standardization, reproducibility, and efficiency. While traditional microscopy relies heavily on individual technician expertise and is prone to inter-observer variability, AI-DP provides consistent analysis and automated data capture, reducing operational costs through increased throughput and reduced labor demands [2].
The following diagram illustrates the comparative workflows of traditional microscopy versus AI-based digital pathology:
Machine Learning for Drug Discovery
Beyond diagnostic applications, Z-stack databases are proving valuable for drug discovery efforts targeting parasitic diseases. Machine learning approaches are being leveraged to predict anti-inflammatory small molecules (AISMs) with potential applications for managing pathology associated with parasitic infections [64]. The AISMPred computational method utilizes multiple ML classifiers including Random Forest (RF), ExtraTree (ET), K-Nearest Neighbor (KNN), Logistic Regression (LR), and Ensemble methods, achieving up to 92% accuracy in classifying bioactive compounds [64].
Advanced deep learning frameworks are further enhancing drug discovery capabilities. The optSAE + HSAPSO framework integrates stacked autoencoders with hierarchically self-adaptive particle swarm optimization, demonstrating 95.52% accuracy in drug classification and target identification tasks [65]. This approach significantly reduces computational complexity (0.010 s per sample) while maintaining exceptional stability (± 0.003), making it suitable for large-scale pharmaceutical applications [65].
Z-Stack Protocol for Parasite Slide Analysis
Sample Preparation and Imaging
Materials Required:
- Parasite specimen slides (fresh or archived)
- Whole slide imaging scanner with Z-stack capability
- Image analysis software (e.g., Concentriq LS [66])
- Cloud storage or local server for data management
Procedure:
- Slide Preparation: Prepare specimen slides according to standard protocols (e.g., Kato-Katz method for STH eggs [62]). Ensure uniform thickness and optimal staining for contrast.
Scanner Configuration: Set Z-stack parameters based on specimen characteristics:
- Focal Planes: Determine optimal number of focal planes (typically 5-20 depending on specimen thickness)
- Step Size: Set appropriate vertical step size between focal planes (typically 0.2-1.0 μm)
- Resolution: Select scanning resolution appropriate for target parasites (typically 20x-40x magnification)
Quality Control: Verify image quality across all focal planes, checking for consistent illumination and focus.
Image Acquisition: Execute scanning procedure, generating multiple focal plane images for each specimen.
Composite Generation: Utilize software algorithms to combine focal planes into a single extended depth-of-field image.
Image Analysis and Data Management
Digital Analysis Workflow:
- Preprocessing: Apply normalization and background correction algorithms to standardize image quality.
Feature Extraction: Utilize deep learning systems to identify and quantify parasitic structures across the Z-stack dataset.
Validation: Compare AI-generated results with manual microscopy findings to ensure accuracy [62].
Data Archiving: Store complete Z-stack datasets in searchable databases with appropriate metadata for future reference.
Troubleshooting:
- For poor focus consistency: Adjust Z-step size and increase number of focal planes
- For large file sizes: Implement compression algorithms while preserving diagnostic quality
- For analysis errors: Retrain AI models with expanded dataset including challenging cases
Performance Metrics and Experimental Data
Diagnostic Accuracy of Z-Stack Enhanced AI Analysis
Table 1: Comparison of diagnostic performance for soil-transmitted helminth detection using manual microscopy versus Z-stack enhanced deep learning system (DLS) [62]
| Parasite Species | Method | Sensitivity (%) | Specificity (%) | Accuracy (%) | Remarks |
|---|---|---|---|---|---|
| Ascaris lumbricoides | Manual Microscopy | 100.0 | 100.0 | 100.0 | Reference standard |
| DLS with Z-stack | 80.0 | 98.0 | 97.5 | Detected additional light infections | |
| Trichuris trichiura | Manual Microscopy | 100.0 | 100.0 | 100.0 | Reference standard |
| DLS with Z-stack | 92.0 | 90.0 | 90.5 | Superior for low-intensity infections | |
| Hookworm species | Manual Microscopy | 100.0 | 100.0 | 100.0 | Reference standard |
| DLS with Z-stack | 76.0 | 95.0 | 92.5 | Improved detection in challenging specimens |
Computational Performance of AI Models for Drug Discovery
Table 2: Performance metrics of machine learning models for pharmaceutical classification tasks relevant to parasitology research [65] [64]
| Model/Algorithm | Accuracy (%) | AUC | Computational Time (s/sample) | Stability (±) | Application |
|---|---|---|---|---|---|
| ET with Hybrid Features [64] | 92.0 | 0.97 | N/A | N/A | Anti-inflammatory small molecule prediction |
| optSAE + HSAPSO [65] | 95.5 | N/A | 0.010 | 0.003 | Drug classification and target identification |
| Random Forest [64] | 87.0-90.0 | 0.95-0.96 | N/A | N/A | Compound classification |
| Ensemble Methods [64] | 89.0 | 0.97 | N/A | N/A | Multi-algorithm prediction |
Implementation Considerations and Research Reagents
Essential Research Reagent Solutions
Table 3: Key reagents and materials for Z-stack based parasitology research
| Reagent/Material | Function | Application Example | Technical Notes |
|---|---|---|---|
| Kato-Katz Reagents [62] | Stool sample preparation for microscopic analysis | Soil-transmitted helminth egg detection | Standardized for quantitative parasitology |
| Digital Whole Slide Scanners [66] [63] | High-resolution digitization of microscope slides | Z-stack image acquisition for AI analysis | Compatible with brightfield and fluorescence imaging |
| AI-Assisted Cytology Software [63] | Automated analysis of cytology samples | Parasite detection in fine needle aspirations | Reduces manual review burden by 40-60% |
| Cloud Data Management Platforms [66] | Centralized storage and analysis of Z-stack data | Multi-site collaborative research | Enables real-time sharing and collaboration |
| Deep Learning Development Tools [65] | Training and validation of AI models for parasite detection | Automated quantification of infection intensity | Reduces AI development time by 13x |
Integration Framework for Z-Stack Databases
The effective implementation of Z-stack databases in parasitology research requires a coordinated approach integrating imaging technology, data management, and analytical tools. The following diagram illustrates the core components and their relationships in a comprehensive Z-stack research platform:
Z-stack databases represent a transformative technology for parasitology research, drug discovery, and diagnostic applications. The integration of multi-focal imaging with advanced artificial intelligence creates powerful tools for analyzing complex parasitic structures and identifying potential therapeutic targets. Research demonstrates that Z-stack enhanced deep learning systems can achieve diagnostic accuracies of 90-97.5% for soil-transmitted helminths, with particular value in detecting light-intensity infections that are frequently missed by conventional microscopy [62].
The scalability of Z-stack databases enables their application across multiple domains, from high-throughput drug screening to individual patient diagnostics. Commercial digital pathology platforms now support enterprise-scale deployment of Z-stack technologies, allowing unified management of both histology and cytology samples [66] [63]. These platforms provide the foundation for collaborative research networks, where shared Z-stack databases can accelerate discovery and validation of novel antiparasitic compounds.
Future developments in computational power, AI algorithms, and imaging technology will further enhance the value of Z-stack databases. As these databases expand with standardized annotations and metadata, they will become increasingly powerful resources for training next-generation AI models and discovering new insights into host-parasite interactions. The ongoing integration of Z-stack technology with multi-omics data and clinical outcomes will create comprehensive research ecosystems that significantly advance our ability to diagnose, treat, and ultimately control parasitic diseases worldwide.
Conclusion
Z-stack digital scanning represents a transformative technology for parasitology, effectively addressing the critical challenges of specimen scarcity and declining morphological expertise. By creating durable, widely accessible digital databases, researchers can preserve invaluable specimens for future generations and facilitate simultaneous global collaboration. While considerations around workflow integration, file management, and validation remain, the proven potential for enhancing education, enabling powerful AI-driven analysis, and supporting drug development is clear. Future efforts should focus on expanding digital specimen libraries, developing standardized scanning protocols, and further integrating AI tools to unlock quantitative, data-rich insights from parasitic organisms, ultimately accelerating progress in biomedical research and clinical diagnostics.
References
- 1. Construction of a preliminary digital parasite specimen ... [https://www.nature.com/articles/s41598-025-07673-4]
- 2. The development of an artificial intelligence-based digital ... [https://www.frontiersin.org/journals/tropical-diseases/articles/10.3389/fitd.2022.990304/full]
- 3. High-content imaging as a tool to quantify and characterize ... [https://pmc.ncbi.nlm.nih.gov/articles/PMC10391350/]
- 4. Leica Z stacks - Biology & Biochemistry Imaging Core (BBIC) [https://bbic.nsm.uh.edu/protocols/leica-z-stacks]
- 5. Fusion Parasitology Suite [https://techcyte.com/products/fusion-parasitology-suite/]
- 6. Deep learning image analysis for continuous single-cell ... [https://www.nature.com/articles/s42003-025-07894-3]
- 7. Fluid preservation causes minimal reduction of parasite ... [https://pmc.ncbi.nlm.nih.gov/articles/PMC7381554/]
- 8. Preserving insects and related arthropods [https://extension.oregonstate.edu/catalog/preserving-insects-related-arthropods]
- 9. What Is Z-stacking Technique in Digital Pathology? [https://precipoint.com/en/digital-microscopy/what-is-z-stacking-technique-in-digital-pathology]
- 10. Identification of individual cells from z-stacks of bright-field ... [https://pmc.ncbi.nlm.nih.gov/articles/PMC6065389/]
- 11. Comparative analysis of 2D and 3D distance measurements ... [https://pmc.ncbi.nlm.nih.gov/articles/PMC5522766/]
- 12. What is a Z-stack? - LFM [https://myscope.training/LFM_What_is_a_Z_stack]
- 13. Technical considerations during validation of the Genius® ... [https://www.sciencedirect.com/science/article/pii/S215335392500118X]
- 14. Z-Stack Imaging | Center for Applied Biogeography | Florida Tech [https://research.fit.edu/applied-biogeography/z-stack-imaging/]
- 15. Z-Stack Scanning can Improve AI Detection of Mitosis [https://arxiv.org/abs/2501.15743]
- 16. Cytology Screening Using Z-Stack Digital Slides [https://pubmed.ncbi.nlm.nih.gov/40880435/]
- 17. 7 Free Image Analysis Software Tools for Microscopy [https://www.stressmarq.com/blog/5-free-image-analysis-software-tools-for-microscopy/?srsltid=AfmBOoq2WPbMw5xeVp4LXS15ptF8J4hikymvIv78Z3xrq1Y6tDPcgBG3]
- 18. ZEN Microscopy Software [https://www.zeiss.com/microscopy/us/products/software/zeiss-zen.html]
- 19. Hybrid Capsule Network for precise and interpretable ... [https://pmc.ncbi.nlm.nih.gov/articles/PMC12370641/]
- 20. ScannerVision: Scanner-based image acquisition of ... [https://pmc.ncbi.nlm.nih.gov/articles/PMC12141936/]
- 21. Next generation histology methods for three-dimensional ... [https://www.nature.com/articles/s41467-018-03359-w]
- 22. BINA 2025 Light Microscopy Image Contest [https://www.bioimagingnorthamerica.org/image-contest-2025/]
- 23. Impact of photobleaching on quantitative, spatio-temporal ... [https://pmc.ncbi.nlm.nih.gov/articles/PMC11541191/]
- 24. Optimization of Scanning Protocol for AI-Integrated ... [https://pmc.ncbi.nlm.nih.gov/articles/PMC12190017/]
- 25. iMAGING: a novel automated system for malaria diagnosis ... [https://pmc.ncbi.nlm.nih.gov/articles/PMC10704928/]
- 26. Protocol for studying dynamics of parasite-host-mediated ... [https://www.sciencedirect.com/science/article/pii/S2666166725005660]
- 27. 3D Confocal Imaging of Thick Samples Using Z Intensity ... [https://www.microscope.healthcare.nikon.com/resources/application-notes/3d-confocal-imaging-of-thick-samples-using-z-intensity-correction]
- 28. Implementing digital pathology: qualitative and financial ... [https://pmc.ncbi.nlm.nih.gov/articles/PMC12546502/]
- 29. Leading multiplex immunofluorescence chemistries for ... [https://www.zeiss.com/microscopy/en/about-us/newsroom/press-releases/2025/multiplex-immunofluorescence-chemistries.html]
- 30. Detecting soil-transmitted helminth and Schistosoma ... [https://pmc.ncbi.nlm.nih.gov/articles/PMC12251349/]
- 31. Digital Pathology in Clinical Trials: Driving Faster Drug ... [https://indicalab.com/news/digital-pathology-in-clinical-trials-driving-faster-drug-development/]
- 32. Generating Quantitative Digital Pathology Data from ... [https://oraclebio.com/digital-pathology-data-generation-clinical-rd-studies-regulatory-standard/]
- 33. Construction of a preliminary digital parasite specimen ... [https://ui.adsabs.harvard.edu/abs/2025NatSR..1520711K/abstract]
- 34. FAQs [https://digitalpathologyassociation.org/faq]
- 35. Comparative evaluation of slide scanners, scan settings ... [https://www.sciencedirect.com/science/article/pii/S2153353923001608]
- 36. Z-Stack Scanning can Improve AI Detection of Mitosis [https://arxiv.org/html/2501.15743v1]
- 37. Identification of individual cells from z-stacks of bright-field ... [https://www.nature.com/articles/s41598-018-29647-5]
- 38. Z Stack Analysis [https://forum.image.sc/t/z-stack-analysis/23952]
- 39. Protocol for three-dimensional whole-mount imaging of the ... [https://pmc.ncbi.nlm.nih.gov/articles/PMC11269289/]
- 40. High-content imaging as a tool to quantify and characterize ... [https://www.sciencedirect.com/science/article/pii/S2667237523001455]
- 41. Whole Slide Imaging (WSI) in Pathology - PubMed Central - NIH [https://pmc.ncbi.nlm.nih.gov/articles/PMC7522141/]
- 42. Unique Opportunities and Challenges in Digital Pathology ... [https://pmc.ncbi.nlm.nih.gov/articles/PMC12386070/]
- 43. Enabling the future of digital pathology with DICOM at ... [https://www.merative.com/blog/enabling-the-future-of-digital-pathology-with-dicom-at-pathology-visions-2025]
- 44. Digital Pathology Implementation: Overcoming the Biggest ... [https://www.grundium.com/blog/digital-pathology-implementation-overcoming-the-biggest-challenges/]
- 45. Quantification of whole slide Z-stacked image (.czi) to be ... [https://forum.image.sc/t/quantification-of-whole-slide-z-stacked-image-czi-to-be-opened-via-segmentation-of-as-whole-tiled-image/56780]
- 46. Lessons from HNL Lab Medicine's COO [https://proscia.com/digital-pathology-as-a-business-imperative-lessons-from-hnl-lab-medicines-coo/]
- 47. A novel method (RIM-Deep) for enhancing imaging depth ... [https://elifesciences.org/reviewed-preprints/101143]
- 48. Validation of Digital Slide Scanning and a Convolutional ... [https://www.mdpi.com/2075-4418/15/23/2974]
- 49. Techcyte And Pramana Unveil Smart, Inline, Volumetric ... [https://techcyte.com/techcyte-and-pramana-unveil-smart-inline-volumetric-digital-microbiology-scanning/]
- 50. Construction of a preliminary digital parasite specimen ... [https://pmc.ncbi.nlm.nih.gov/articles/PMC12215916/]
- 51. /Computational Technology for Molecular Cytology Testing... Digital [https://pmc.ncbi.nlm.nih.gov/articles/PMC8491512/]
- 52. Comparing whole slide digital images versus traditional ... [https://pmc.ncbi.nlm.nih.gov/articles/PMC4977977/]
- 53. A Randomized Study Comparing Digital Imaging to ... [https://www.sciencedirect.com/science/article/pii/S2153353922004163]
- 54. Interoperable slide microscopy viewer and annotation tool ... [https://www.nature.com/articles/s41467-023-37224-2]
- 55. Microscope Slide Scanner vs. Traditional Microscopy [https://www.grundium.com/blog/microscope-slide-scanner-vs-traditional-microscopy-which-delivers-better-results/]
- 56. Standardized Clinical Annotation of Digital Histopathology ... [https://www.sciencedirect.com/science/article/pii/S0893395223002028]
- 57. Accessible Color Palette Generator | WCAG Compliant [https://venngage.com/tools/accessible-color-palette-generator]
- 58. The best charts for color blind viewers | Blog [https://www.datylon.com/blog/data-visualization-for-colorblind-readers]
- 59. Inter-Observer Reliability Assessments in Time Motion Studies [https://pmc.ncbi.nlm.nih.gov/articles/PMC3900222/]
- 60. Protocol for studying dynamics of parasite-host-mediated ... [https://pmc.ncbi.nlm.nih.gov/articles/PMC12615742/]
- 61. Toxoplasma gondii F-actin forms an extensive filamentous ... [https://elifesciences.org/articles/24119]
- 62. Diagnosis of soil-transmitted helminth infections with digital ... [https://pmc.ncbi.nlm.nih.gov/articles/PMC11008773/]
- 63. Breaking the Cytology Barrier: Unified Digital Pathology at ... [https://proscia.com/breaking-the-cytology-barrier-unified-digital-pathology-at-enterprise-scale/]
- 64. AISMPred: A Machine Learning Approach for Predicting Anti ... [https://pmc.ncbi.nlm.nih.gov/articles/PMC11676721/]
- 65. Automated drug design for druggable target identification ... [https://www.nature.com/articles/s41598-025-18091-x]
- 66. Modern Digital Pathology Software to Accelerate R&D [https://proscia.com/concentriq-ls/]