YAC-Net: A Lightweight Deep Learning Model for Automated Parasite Egg Detection in Microscopy Images
This article explores YAC-Net, a novel lightweight deep learning model designed for the accurate and efficient detection of parasite eggs in microscopy images.
YAC-Net: A Lightweight Deep Learning Model for Automated Parasite Egg Detection in Microscopy Images
Abstract
This article explores YAC-Net, a novel lightweight deep learning model designed for the accurate and efficient detection of parasite eggs in microscopy images. Aimed at researchers and drug development professionals, we detail the model's foundational context in combating intestinal parasitic infections, its innovative architectural improvements over existing frameworks like YOLOv5, and its optimization for low-resource settings. The content provides a methodological breakdown of YAC-Net's application, discusses troubleshooting and performance optimization strategies, and presents rigorous validation and comparative analysis against state-of-the-art detection methods. This resource underscores YAC-Net's potential to automate and revolutionize diagnostic processes in biomedical research and global public health initiatives.
The Urgent Need for Automated Diagnostics: Exploring YAC-Net's Role in Public Health and Drug Development
The Global Burden of Intestinal Parasitic Infections (IPIs)
Intestinal parasitic infections (IPIs) pose a critical global health challenge, affecting over one billion people worldwide and representing a significant cause of morbidity and mortality, particularly in developing regions [1]. The World Health Organization (WHO) estimates that 24% of the world's population (approximately 1.5 billion people) suffers from IPIs, predominantly from soil-transmitted helminths [1]. Recent meta-analyses indicate that approximately 450 million people become ill annually as a direct result of these infections, with children bearing the highest burden [2].
The prevalence of IPIs demonstrates significant geographical variation, influenced by climatic, socioeconomic, and environmental factors. These infections are most prevalent in tropical and subtropical regions, including sub-Saharan Africa, Asia, Latin America, and the Caribbean [1]. Over 50% of the population in some sub-Saharan African regions is affected by IPIs [1]. In developed countries, intestinal protozoal infections are more common than helminthic infections, with Giardia lamblia being the most prevalent parasitic cause of diarrhea in the United States [1].
Table 1: Global Prevalence of Major Intestinal Parasitic Infections
| Parasite Category | Representative Pathogens | Estimated Global Burden | High Prevalence Regions |
|---|---|---|---|
| Soil-Transmitted Helminths | Ascaris lumbricoides, Trichuris trichiura, Ancylostoma duodenale, Necator americanus | 1.5 billion people infected [1] | Sub-Saharan Africa, Asia, Latin America [1] |
| Intestinal Protozoa | Giardia duodenalis, Cryptosporidium parvum/hominis, Entamoeba histolytica | 7% prevalence in developed countries; up to 30% in developing countries for giardiasis [1] | Global distribution, with higher burden in developing regions [1] |
| Other Pathogenic Parasites | Blastocystis spp., Cyclospora cayetanensis, Cystoisospora belli | Significant contributor to diarrheal illness globally [1] | Both developed and developing countries [1] |
Clinical Significance and Health Impact
Morbidity and Mortality
IPIs contribute significantly to global disease burden, measured by Disability-Adjusted Life Years (DALYs). The clinical manifestations of IPIs vary widely depending on the causative organism, host immune status, and infection intensity. Common presentations include diarrhea, dysentery, abdominal pain, nausea, vomiting, nutritional deficiencies, iron deficiency anemia, and perianal itching [1]. In severe cases, particularly with heavy worm burdens, intestinal obstruction can occur [1].
The impact of parasitic infections extends beyond acute gastrointestinal symptoms. Chronic infections can lead to impaired nutrient absorption, growth retardation in children, cognitive deficits, and reduced work capacity in adults [2]. A 2025 systematic review and meta-analysis revealed a significant association between IPIs and colorectal cancer (CRC), with infected individuals having 3.61 times higher odds of developing CRC [3] [4]. The pooled prevalence of IPIs among CRC patients was 19.67%, suggesting a potential role of chronic inflammation in carcinogenesis [3].
Economic Consequences
The economic impact of IPIs is substantial, resulting from healthcare costs, lost productivity, and effects on cognitive development. The burden is particularly heavy in agricultural communities where infection can reduce work capacity. Beyond human infections, parasites significantly affect livestock, with soil-borne nematodes causing global crop yield losses estimated at $125 to $350 billion annually [2].
Major Pathogenic Parasites: Biology and Pathogenesis
Giardia duodenalis
Giardia duodenalis (also known as Giardia lamblia or Giardia intestinalis) is a flagellate protozoan and a major cause of epidemic and sporadic diarrhea worldwide [1]. It exists in two forms: the vegetative/active trophozoite and the infectious cyst [1]. Infection occurs through ingestion of cysts in fecal-contaminated water or food, with excystation occurring in the duodenum [1].
Pathogenesis: Trophozoites adhere to enterocyte brush borders via a ventral sucking disc, causing damage to the brush border epithelium, shortening of microvilli, and disruption of epithelial barrier function [1]. These changes lead to nutrient malabsorption, diarrhea, and steatorrhea through multiple mechanisms including disaccharidase deficiency, impaired glucose-dependent sodium absorption, and chloride hypersecretion [1].
Clinical Presentation: Patients typically present with diarrhea, abdominal cramps, nausea, gas, and bloating [1]. Chronic giardiasis may manifest with full-spectrum malabsorption of carbohydrates, proteins, fats, vitamins, and minerals, leading to significant weight loss and nutritional deficiencies [1].
Cryptosporidium Species
Cryptosporidium parvum and C. hominis are intracellular protozoan parasites causing diarrheal illness worldwide, primarily transmitted through contaminated water [1]. The infection begins with ingestion of oocysts that excyst in the small intestine, releasing sporozoites that invade epithelial cells [1].
Pathogenesis: Cryptosporidium affects primarily the distal jejunum and ileum, altering epithelial barrier function and increasing intestinal permeability [1]. Diarrhea results mainly from enterotoxic effects that increase secretion of water and electrolytes [1]. Animal models demonstrate inhibition of glucose-stimulated sodium absorption, lymphocytic infiltration in the lamina propria, crypt hyperplasia, and villous atrophy [1].
Clinical Presentation: Immunocompetent individuals typically experience self-limiting acute diarrhea, while immunocompromised patients (e.g., AIDS, transplant recipients) may develop chronic protracted diarrhea, acalculous cholecystitis, sclerosing cholangitis, and acute pancreatitis [1].
Table 2: Characteristics of Major Intestinal Parasitic Pathogens
| Parasite | Transmission Route | Primary Target Site | Key Pathogenic Mechanisms |
|---|---|---|---|
| Giardia duodenalis | Fecal-oral (contaminated water/food) [1] | Proximal small intestine [1] | Brush border damage, villous shortening, disrupted barrier function, disaccharidase deficiency [1] |
| Cryptosporidium spp. | Waterborne, fecal-oral, recreational water [1] | Distal jejunum and ileum [1] | Epithelial barrier disruption, enterotoxin-mediated secretion, villous atrophy [1] |
| Entamoeba histolytica | Fecal-oral [5] | Colon, liver (for abscesses) [5] | Contact-dependent cytolysis, invasion of intestinal mucosa [5] |
| Soil-Transmitted Helminths | Soil-transmitted, percutaneous (hookworm) [1] | Small intestine [1] | Mucosal invasion, blood feeding (hookworm), nutrient competition [1] |
Diagnostic Approaches and Protocols
Conventional Diagnostic Methods
The primary method for diagnosing most IPIs remains stool microscopy [1]. The Centers for Disease Control and Prevention (CDC) recommends collecting three stool samples over several days to improve detection sensitivity [1]. Different staining techniques enhance identification:
- Direct fluorescent antibody (DFA) testing for Giardia and Cryptosporidium (sensitivity: 93-100%, specificity: 99.8-100%) [1]
- Trichrome staining for protozoal trophozoites [1]
- Enzyme immunoassay (EIA) and rapid immunochromatographic cartridge assays for antigen detection [1]
For Giardia infections, duodenal fluid aspiration or biopsy may be necessary when stool examinations are repeatedly negative [1]. Molecular assays using PCR-based techniques are increasingly available for subtyping genetic variants of parasites [1].
Experimental Protocol: Standard Stool Examination Procedure
Materials Required:
- Fresh stool specimen
- Microscope slides and coverslips
- Saline solution
- Lugol's iodine
- Formalin-ethyl acetate concentration reagents
- Appropriate staining solutions (trichrome, modified acid-fast)
- Centrifuge and centrifuge tubes
Procedure:
- Sample Collection: Collect stool specimen in clean, wide-mouthed container without preservatives for fresh examination.
- Direct Wet Mount:
- Emulsify small portion of stool (approximately 2 mg) in saline solution.
- Prepare similar preparation in Lugol's iodine.
- Examine under 10x and 40x objectives for cysts, trophozoites, ova, and larvae.
- Formalin-Ethyl Acetate Concentration:
- Mix 1-2 g stool with 10 mL formalin in centrifuge tube, let stand 30 minutes.
- Strain through gauze into second centrifuge tube.
- Add 3 mL ethyl acetate, stopper, and shake vigorously.
- Centrifuge at 500 x g for 10 minutes.
- Examine sediment from interface layer as wet mount.
- Staining Procedures:
- Prepare smears for trichrome staining (protozoa) or modified acid-fast staining (coccidian parasites).
- Follow specific staining protocols for each method.
- Microscopic Examination:
- Systematically scan entire coverslip area under low power.
- Use high-power magnification for detailed morphology.
- Identify parasites based on size, shape, internal structures.
Emerging Diagnostic Technologies: Deep Learning Applications
YAC-Net and AI-Enhanced Detection
Recent advances in artificial intelligence have revolutionized parasitic diagnosis through automated detection systems. The YAC-Net model represents a lightweight deep-learning approach designed specifically for rapid and accurate detection of parasitic eggs in microscopy images while reducing automation costs [6]. This system helps address challenges in traditional microscopy, including operator fatigue, inter-observer variability, and time-intensive manual processes.
The Kubic FLOTAC Microscope (KFM) exemplifies this technological evolution, combining FLOTAC/Mini-FLOTAC techniques with AI-powered predictive models for automated parasite egg detection [7]. This portable digital microscope system demonstrates high sensitivity, accuracy, and precision in both laboratory and field settings, with studies showing a mean absolute error of only 8 eggs per sample in fecal egg counts [7].
Experimental Protocol: AI-Assisted Parasite Detection Workflow
Materials Required:
- Kubic FLOTAC Microscope or standard microscope with digital imaging capability
- FLOTAC or Mini-FLOTAC kit
- Stool samples prepared using standardized flotation techniques
- Computer workstation with GPU capability
- Deep learning model (YAC-Net or similar architecture)
Procedure:
- Sample Preparation:
- Prepare fecal samples using Mini-FLOTAC technique with appropriate flotation solution.
- Fill chambers and allow to stand for 10-15 minutes.
- Image Acquisition:
- Capture digital images of entire chamber using KFM or microscope-mounted camera.
- Ensure consistent lighting and magnification across samples.
- Save images in standardized format (JPEG or PNG).
- Model Processing:
- Input images into YAC-Net model for automated detection.
- Model generates bounding boxes around suspected parasitic structures.
- Classification probabilities assigned to each detection.
- Validation and Verification:
- Expert parasitologist reviews AI-generated annotations.
- Correct misclassifications and add missed detections if necessary.
- Update model with corrected annotations for continuous learning.
- Quantification and Reporting:
- Calculate eggs per gram (EPG) based on detection counts.
- Generate standardized clinical report.
The following diagram illustrates the integrated diagnostic workflow combining conventional and AI-enhanced approaches:
Therapeutic Interventions and Drug Development
Current Antiparasitic Agents
Treatment of IPIs involves various classes of antiparasitic drugs targeting different parasitic groups:
Antiprotozoal Agents:
- Metronidazole and tinidazole: First-line treatment for giardiasis, amebiasis, and trichomoniasis [8] [9]. Metronidazole becomes activated inside giardia trophozoites through reduction by ferredoxins, damaging parasite DNA [1].
- Nitazoxanide: Effective against cryptosporidiosis and giardiasis [9].
- Paromomycin: Luminal amebicide used for intestinal infections [9].
Antihelminthic Agents:
- Albendazole and mebendazole: Broad-spectrum anthelminthics effective against soil-transmitted helminths including ascariasis, hookworm, and trichuriasis [8].
- Pyrantel pamoate: Over-the-counter medication for enterobiasis (pinworms) and ascariasis [9].
- Praziquantel: Treatment for trematode and cestode infections [8].
- Ivermectin: Used for strongyloidiasis and off-label for scabies and lice [9].
Table 3: Drug Therapy for Common Intestinal Parasitic Infections
| Infection | First-Line Treatment | Alternative Agents | Special Considerations |
|---|---|---|---|
| Giardiasis | Metronidazole 250 mg TID for 5-7 days or Tinidazole 2 g single dose [1] [9] | Nitazoxanide, Albendazole, Paromomycin [9] | High single-dose tinidazole efficacy (92%) [1] |
| Cryptosporidiosis | Nitazoxanide | Paromomycin (in immunocompromised) | Often self-limiting in immunocompetent hosts [1] |
| Amebiasis | Metronidazole + Luminal agent (Paromomycin or Iodoquinol) [9] | Tinidazole, Erythromycin, Tetracycline | Luminal agent essential to eradicate cyst carriage [9] |
| Enterobiasis (Pinworm) | Albendazole or Pyrantel Pamoate [9] | Mebendazole | Treat all household contacts; repeat dose in 2 weeks [9] |
| Soil-Transmitted Helminths | Albendazole or Mebendazole [8] | Pyrantel Pamoate, Ivermectin | Single-dose regimens typically effective [8] |
Drug Development and Research Targets
Current drug development for parasitic diseases focuses on addressing limitations of existing agents, including resistance, toxicity, and limited spectrum of activity [10]. Key strategies include:
- Target-Based Drug Discovery: Identification of parasite-specific biochemical pathways and essential enzymes [5].
- Phenotypic Screening: Whole-organism screening of compound libraries against pathogenic parasites [10].
- Repurposing Approaches: Evaluation of existing drugs for antiparasitic activity [5].
Promising molecular targets for new antiparasitic drugs include:
- Methionine aminopeptidase 2 (MetAP2): Target of fumagillin in microsporidia [5].
- β-tubulin: Binding site for benzimidazoles like albendazole [5].
- Aspartic proteases: Inhibited by ritonavir and indinavir in microsporidia [5].
- Chitin synthesis enzymes: Targets for nikkomycins in microsporidia [5].
Research Reagent Solutions and Essential Materials
Table 4: Essential Research Reagents for IPI Investigation
| Reagent/Material | Application | Function | Examples/Specifications |
|---|---|---|---|
| FLOTAC/Mini-FLOTAC System | Parasite egg concentration and quantification [7] | Standardized fecal egg counting technique with high sensitivity and accuracy | Multi-chamber design, disposable |
| Kubic FLOTAC Microscope (KFM) | Automated digital parasitological diagnosis [7] | Portable microscope with AI integration for egg detection and classification | Battery-powered, web interface, dedicated AI server |
| Deep Learning Models (YAC-Net) | Automated parasite detection in microscopy images [6] | Lightweight convolutional neural network for rapid egg identification | Optimized for parasitic egg morphology |
| Parasite-Specific Antigen Detection Kits | Immunodiagnosis of specific parasitic infections [1] | Enzyme immunoassay (EIA) and rapid immunochromatographic tests for antigen detection | Giardia, Cryptosporidium, E. histolytica specific tests |
| Staining Reagents | Microscopic differentiation of parasitic structures [1] | Enhance visualization of cysts, trophozoites, and ova | Trichrome, modified acid-fast, iodine solutions |
| Antiparasitic Compound Libraries | Drug discovery and development [10] | Screening collections for identifying novel therapeutic agents | Diversity-oriented synthetic compounds, natural product extracts |
The global burden of intestinal parasitic infections remains substantial, affecting predominantly vulnerable populations in resource-limited settings. Effective management requires integrated approaches combining accurate diagnosis, effective treatment, and preventive measures. Emerging technologies, particularly AI-enhanced diagnostic systems like YAC-Net and the Kubic FLOTAC Microscope, offer promising avenues for improving detection accuracy and accessibility [7] [6].
Future research priorities include:
- Development of novel therapeutic agents to address drug resistance and limited treatment options [10]
- Validation and implementation of AI-based diagnostic systems in diverse field settings [7] [6]
- Enhanced understanding of parasite-host interactions and chronic sequelae of infections, including the association with colorectal cancer [3] [4]
- Implementation of integrated control programs combining mass drug administration with improved sanitation, health education, and access to clean water [1]
Addressing the challenge of IPIs requires multidisciplinary collaboration between researchers, healthcare providers, and public health officials to reduce the substantial global burden of these neglected infections.
Limitations of Manual Microscopy and Traditional Machine Learning
Modern biological and biomedical research heavily relies on microscopy for visualizing cellular and subcellular structures. For decades, image analysis in this domain has been dominated by two primary approaches: manual analysis by human experts and traditional machine learning algorithms. While these methods have enabled significant discoveries, they present considerable limitations in accuracy, throughput, and reproducibility, particularly in the era of high-content screening and large-scale quantitative biology [11] [12]. This document outlines the key constraints of these established approaches, providing a scientific rationale for the development of advanced deep learning frameworks like YAC-Net for microscopy image detection. The limitations discussed herein frame the critical research gap that next-generation computational models aim to address.
Critical Limitations of Manual Microscopy Analysis
Manual microscopy remains a reference technique in many laboratories, particularly for clinical validation and complex morphological assessments. However, quantitative analyses reveal significant constraints across multiple performance dimensions.
Quantitative Performance Deficits
Table 1: Performance Comparison of Manual vs. Automated Microscopy Analysis
| Performance Metric | Manual Microscopy | AI-Powered Automation | Experimental Evidence |
|---|---|---|---|
| Analysis Speed | Time-consuming; limited by human fatigue [13] | High-throughput; operates continuously [13] | Processes hundreds-thousands of items/minute [13] |
| Consistency & Reproducibility | Subject to intra- and inter-observer variability [12] | Applies uniform criteria consistently [13] | Reduces subjective inconsistencies in evaluation [13] |
| Quantitative Accuracy | Prone to human error in repetitive tasks [13] | Sub-pixel accuracy in measurements [13] | Detects minute variations invisible to human eye [13] |
| Data Volume Handling | Limited by practical human capacity [12] | Processes terabytes of multidimensional data [14] | Enables analyses previously deemed impractical [14] |
| Fatigue-Related Error Rate | Increases with prolonged task duration [13] | No performance degradation over time [13] | Contributes to mistakes in monotonous inspection [13] |
Operational and Economic Constraints
Beyond quantitative performance issues, manual microscopy presents significant operational challenges. The dependency on highly trained specialists creates workflow bottlenecks, particularly in high-volume diagnostic settings like hematology laboratories [15]. Furthermore, the labor-intensive nature of manual analysis makes it economically unsustainable for large-scale studies, as the time required for expert annotation often exceeds the data acquisition time by orders of magnitude [12].
In clinical practice, even advanced digital systems that incorporate manual verification pathways demonstrate these limitations. For instance, the Sysmex XN-3100 hematology analyzer requires manual reclassification of abnormal cells, particularly immature granulocytes and blasts, as the automated preclassification shows "significant deviation from linearity" (p<0.01) for these cell types [15]. This necessary human intervention slows diagnostic throughput and introduces variability dependent on operator expertise.
Limitations of Traditional Machine Learning in Microscopy
Traditional machine learning approaches (e.g., random forests, support vector machines) using hand-crafted features (e.g., intensity, texture, shape descriptors) represented a significant advancement over purely manual analysis but face fundamental limitations in complex biological imaging contexts.
Technical and Performance Constraints
Table 2: Key Limitations of Traditional Machine Learning in Microscopy
| Limitation Category | Specific Technical Constraints | Impact on Microscopy Analysis |
|---|---|---|
| Feature Engineering Dependency | Relies on manually designed features and thresholds [12] | Poor generalization across different imaging conditions or modalities [12] |
| Background Noise Sensitivity | Standard thresholding algorithms struggle with varying background [12] | High false positive/negative rates in low signal-to-noise images [12] |
| Complex Pattern Recognition | Limited capacity for hierarchical feature learning [16] | Inadequate for subtle morphological distinctions (e.g., spine classification) [17] |
| 3D Image Processing | Computational inefficiency with 3D image stacks [12] | Loss of spatial information critical for structural analysis [12] |
| Adaptation to New Data | Requires complete reprocessing and threshold recalibration [12] | Labor-intensive maintenance for evolving experimental conditions |
Practical Implementation Challenges
The technical limitations of traditional machine learning manifest in concrete analytical failures across multiple application domains. In neuron and dendritic spine analysis, these algorithms struggle with the complex morphological diversity of spines (filopodia, stubby, thin, and mushroom types), particularly in distinguishing subtle neck structures critical for functional classification [17]. Similarly, in parasitology, distinguishing between visually similar entities like Fasciola hepatica and Calicophoron daubneyi eggs presents considerable challenges for traditional pattern recognition approaches, necessitating specialized image processing steps to prevent false positives and misclassification [7].
The threshold selection problem represents a particularly persistent challenge. As noted in the development of TrueSpot, an automated fluorescence detection tool, "Setting a threshold at which algorithms consider puncta to be true signals versus just noise in an image has been a challenging aspect of image analysis" for traditional algorithms [12]. This limitation becomes especially problematic in fluorescence microscopy where background noise and signal intensity can vary substantially between experiments.
Experimental Protocols for Benchmarking Analysis Methods
To quantitatively evaluate the limitations of traditional approaches and validate improved methodologies, standardized benchmarking protocols are essential. The following sections describe key experimental workflows for assessing analytical performance.
Protocol for Dendritic Spine Analysis and Classification
Objective: To quantitatively compare manual, traditional machine learning, and deep learning approaches for classifying dendritic spine morphologies in neuronal imaging.
Materials and Reagents: Table 3: Research Reagent Solutions for Neuronal Imaging
| Reagent/Probe | Function | Application Notes |
|---|---|---|
| MemBright probes | Uniform plasma membrane labeling | Enables clear visualization of spine necks and heads; works in live/fixed samples [17] |
| Fluorescent Phalloidin | F-actin binding for spine labeling | Labels spine heads efficiently but neck signal may be weaker [17] |
| Membranous GFP variants | Membrane-specific targeting | Improved neck detection vs. cytosolic GFP (Addgene 117,858) [17] |
| DiIC₁₈ / DID | Lipophilic membrane dye | Diffuses through entire membrane; variability complicates segmentation [17] |
Imaging Workflow:
- Sample Preparation: Transfert hippocampal neurons with membranous GFP variant or label with MemBright dye (5 min incubation in culture media) [17].
- Image Acquisition: Acquire 3D image stacks using super-resolution microscopy (Airyscan or SIM for live imaging; 3D-STED for fixed samples) [17].
- Multi-view Fusion: For fixed samples, acquire 4 views from different angles and align in same spatial reference frame [18].
- Resolution Enhancement: Apply deconvolution using Classic Maximum Likelihood Estimation in Huygens software [17].
Analysis Workflow:
Diagram Title: Experimental Workflow for Spine Analysis Benchmarking
Protocol for Parasite Egg Detection and Discrimination
Objective: To evaluate the performance of different computational approaches in distinguishing between morphologically similar parasite eggs in fecal samples.
Materials and Reagents:
- Kubic FLOTAC Microscope (KFM) system [7]
- FLOTAC/Mini-FLOTAC sample preparation apparatus [7]
- Fecal samples spiked with Fasciola hepatica and Calicophoron daubneyi eggs [7]
Experimental Workflow:
- Sample Preparation: Prepare egg-spiked samples and naturally infected samples using FLOTAC technique to create datasets for model training and evaluation [7].
- Image Acquisition: Acquire digital microscopy images using the KFM system, which includes automated parasite egg detection via an AI predictive model [7].
- Model Training: Train traditional machine learning models (using hand-crafted morphological features) and deep learning models (end-to-end) on the annotated dataset.
- Performance Evaluation: Compare quantitative metrics including fecal egg count accuracy, false positive rates, and discrimination accuracy between parasite species.
Analysis Workflow:
Diagram Title: Parasite Egg Detection and Discrimination Workflow
The limitations of manual microscopy and traditional machine learning present significant constraints on the scale, accuracy, and reproducibility of image-based research in biological sciences and clinical diagnostics. Manual methods, while valuable for complex qualitative assessments, suffer from inherent limitations in throughput, consistency, and quantitative rigor. Traditional machine learning approaches, while improving analytical scalability, remain constrained by their dependency on hand-crafted features and sensitivity to imaging variations. These documented limitations establish a compelling rationale for the development and implementation of advanced deep learning frameworks like YAC-Net, which offer the potential for end-to-end learning, robust performance across diverse imaging conditions, and discovery of previously unrecognized morphological features directly from pixel data.
The Rise of Deep Learning in Biomedical Image Analysis
Application Note: YAC-Net for Automated Parasite Egg Detection
The application of deep learning in biomedical image analysis represents a paradigm shift in diagnostic methodologies, particularly for tasks requiring high precision and reproducibility. Within this context, the YAC-Net deep learning model exemplifies this transition, specifically engineered for automated detection of parasite eggs in microscopy images. Intestinal parasitic infections (IPIs) remain a serious public health challenge in developing countries, with soil-transmitted helminth (STH) infection being a primary cause. The World Health Organization's 2023 statistics indicate approximately 1.5 billion STH-infected individuals worldwide, creating an urgent need for scalable diagnostic solutions [19].
Traditional microscopic examination, while considered the gold standard, suffers from limitations including low efficiency, high workload, and dependence on the expertise and physical condition of the examiner. Manual examination accuracy is closely tied to the operator's prior knowledge, leading to potential inconsistencies. Automated detection systems can eliminate these dependencies, providing accurate, fast, and standardized results while offering identification services to populations lacking specialized professional expertise [19].
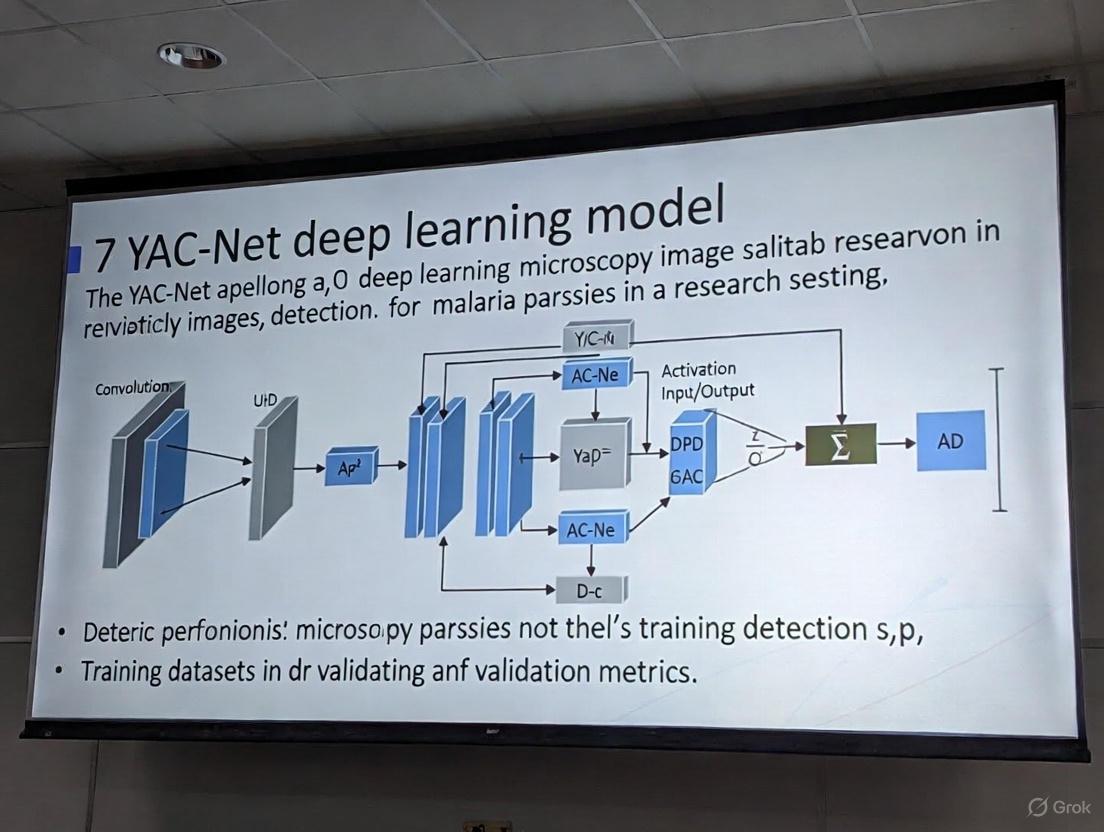
Technical Innovation: YAC-Net Architecture
YAC-Net is a lightweight deep-learning model designed to achieve rapid and accurate detection of parasitic eggs while reducing computational requirements. Built upon the YOLOv5n baseline model, it incorporates two key architectural improvements specifically designed for the specificity of egg data [19]:
- Asymptotic Feature Pyramid Network (AFPN) in the Neck: Replaces the traditional Feature Pyramid Network (FPN). Unlike FPN, which primarily integrates semantic feature information at adjacent levels, AFPN's hierarchical and asymptotic aggregation structure fully fuses spatial contextual information of egg images. Its adaptive spatial feature fusion mode helps the model select beneficial features while ignoring redundant information, thereby reducing computational complexity and improving detection performance [19].
- C2f Module in the Backbone: Replaces the original C3 module. This modification enriches gradient flow information, significantly enhancing the backbone network's feature extraction capability [19].
Table 1: Performance Comparison of YAC-Net Against Baseline and Other Methods
| Model | Precision (%) | Recall (%) | F1 Score | mAP@0.5 | Parameters |
|---|---|---|---|---|---|
| YOLOv5n (Baseline) | 96.7 | 94.9 | 0.9578 | 0.9642 | 2, 410, 378 |
| YAC-Net (Proposed) | 97.8 | 97.7 | 0.9773 | 0.9913 | 1, 924, 302 |
The experimental results, validated on the ICIP 2022 Challenge dataset using fivefold cross-validation, demonstrate that YAC-Net not only surpasses its baseline but also achieves state-of-the-art performance compared to other contemporary detection methods. Notably, it reduces the number of parameters by one-fifth, making it suitable for deployment in resource-constrained environments [19].
Broader Applicability and Workflow Integration
The principles embodied by YAC-Net are reflected in other successful biomedical imaging platforms. For instance, the Kubic FLOTAC Microscope (KFM) is an AI-enhanced, portable digital microscope that integrates a robust AI predictive model for automated parasite egg detection. It combines the high sensitivity and accuracy of the FLOTAC/Mini-FLOTAC sample preparation technique with a dedicated AI server for image analysis. This system has been specifically optimized to discriminate between hard-to-distinguish eggs, such as those of Fasciola hepatica and Calicophoron daubneyi, minimizing false positives and ensuring accurate egg counts through additional image processing steps [7].
Furthermore, the trend towards multi-modal, lightweight models is evident in other areas of medical image analysis. Research into optimized deep learning frameworks that can simultaneously diagnose multiple diseases from various imaging modalities (e.g., Chest X-ray, MRI, endoscopy) using truncated architectures and metaheuristic optimization highlights the drive for computational efficiency without sacrificing diagnostic accuracy [20].
Experimental Protocols
Protocol 1: Model Training and Evaluation for YAC-Net
Objective: To train and evaluate the YAC-Net deep learning model for the detection of parasite eggs in microscopy images.
Materials:
- Dataset: ICIP 2022 Challenge dataset or equivalent annotated dataset of parasite egg microscopy images.
- Hardware: Computer with a CUDA-compatible GPU (e.g., NVIDIA GeForce RTX series) for accelerated training.
- Software: Python 3.8+, PyTorch 1.7+, Ultralytics YOLOv5 library, OpenCV, NumPy.
- Model: YAC-Net implementation (based on modified YOLOv5n with AFPN and C2f modules).
Procedure:
Data Preparation:
- Organize the dataset into training, validation, and test sets. A fivefold cross-validation strategy is recommended for robust evaluation [19].
- Apply standard data augmentation techniques to improve model generalization (e.g., random flipping, rotation, scaling, color jittering, and mosaic augmentation).
Model Configuration:
- Initialize the model with the YAC-Net architecture, replacing the standard FPN with AFPN and the C3 modules with C2f modules in the backbone.
- Configure training hyperparameters. A standard initial setup includes:
- Optimizer: SGD or Adam
- Learning Rate: Use a learning rate scheduler (e.g., OneCycleLR)
- Batch Size: Maximize based on available GPU memory.
- Epochs: Train until validation metrics plateau.
Training:
- Load the preprocessed training dataset.
- Execute the training loop, monitoring losses (box loss, objectness loss, classification loss) on both training and validation sets.
- Save model checkpoints at intervals or when performance on the validation set improves.
Evaluation:
- Use the held-out test set to evaluate the final model.
- Calculate key performance metrics, including Precision, Recall, F1 Score, and mean Average Precision at an IoU threshold of 0.5 (mAP@0.5) [19].
- Compare the parameter count and computational speed (FPS) against the baseline model.
Troubleshooting:
- If overfitting is observed (high training metrics, low validation metrics), increase the intensity of data augmentation or incorporate regularization techniques like dropout or weight decay.
- For poor convergence, verify the learning rate schedule and consider using a pre-trained backbone for transfer learning.
Protocol 2: Sample Processing and AI-Assisted Diagnosis Using KFM System
Objective: To prepare fecal samples and perform automated parasite egg detection and counting using the Kubic FLOTAC Microscope system.
Materials:
- Kubic FLOTAC Microscope: Includes portable digital microscope, integrated AI server, and web interface [7].
- FLOTAC or Mini-FLOTAC kit: Including fill-FLOTAC chambers, flotation cups, and solution filters [7].
- Flotation Solution: Zinc sulfate or sodium nitrate solution of appropriate specific gravity.
- Fecal Sample: Fresh or preserved fecal material from the subject.
Procedure:
Sample Preparation:
- Weigh a specific amount of feces (e.g., 1-2 grams) and place it into a flotation cup.
- Add the flotation solution gradually, emulsifying the sample thoroughly to create a homogeneous suspension.
- Filter the suspension to remove large debris.
- Carefully transfer the filtered suspension to the FLOTAC chamber, avoiding bubble formation.
System Setup:
- Power on the KFM device. Ensure the integrated battery is charged or connect to a power source.
- Access the microscope control web interface from a connected computer or tablet.
- Launch the dedicated AI analysis software/server.
Image Acquisition and Analysis:
- Place the prepared FLOTAC chamber into the microscope stage.
- Initiate the automated scanning procedure via the web interface. The system will capture multiple field-of-view images.
- The onboard AI model will process the captured images in real-time, detecting, classifying, and counting parasite eggs.
- Review the generated clinical report, which includes egg types and counts per gram of sample.
Troubleshooting:
- If the AI model produces false positives, ensure the sample preparation protocol is followed precisely to minimize artifacts. The system may require re-optimization for specific parasite types [7].
- For low detection sensitivity, verify the concentration and cleanliness of the flotation solution and the quality of the sample.
Workflow and Pathway Visualizations
Diagram 1: AI-Powered Parasite Egg Detection Workflow
Diagram 2: YAC-Net Model Optimization Pathway
The Scientist's Toolkit: Research Reagent Solutions
Table 2: Essential Materials for Automated Parasite Egg Detection Experiments
| Item Name | Function / Application | Key Characteristics / Notes |
|---|---|---|
| ICIP 2022 Challenge Dataset | Benchmark dataset for training and evaluating parasite egg detection models. | Provides standardized, annotated microscopy images for comparative algorithm validation [19]. |
| FLOTAC / Mini-FLOTAC Chamber | Sample preparation apparatus for fecal egg flotation and concentration. | Enables highly sensitive, quantitative egg counts; compatible with the KFM digital microscopy system [7]. |
| Zinc Sulfate Flotation Solution | Medium for separating parasite eggs from fecal debris via flotation. | Specific gravity (~1.18-1.20) is critical for optimal recovery of specific parasite eggs. |
| Kubic FLOTAC Microscope (KFM) | Portable, AI-integrated digital microscope for automated egg detection. | Combines reliable hardware with a dedicated AI server for end-to-end analysis in field and lab settings [7]. |
| YAC-Net Model Weights | Pre-trained parameters for the YAC-Net deep learning architecture. | Allows for transfer learning and fine-tuning on new datasets, accelerating project initiation [19]. |
| GPU-Accelerated Workstation | Hardware for model training and inference. | CUDA-compatible GPU (e.g., NVIDIA RTX) significantly reduces time required for model development and evaluation. |
YAC-Net's Position in the Evolving Landscape of AI-Assisted Diagnostics
The integration of artificial intelligence (AI) into medical diagnostics represents a paradigm shift in how diseases are detected and classified. Within this dynamic field, YAC-Net emerges as a specialized deep-learning model explicitly designed for the automated detection of parasite eggs in microscopy images [19]. Intestinal parasitic infections (IPIs) remain a serious public health challenge in developing nations, and their diagnosis critically depends on the accurate detection of parasites or their eggs in patient samples [19]. YAC-Net addresses the pressing need for diagnostic tools that are not only accurate but also computationally efficient, thereby lowering the hardware barriers for implementing automated screening in resource-limited settings [19]. This application note details the model's architecture, benchmarks its performance against contemporary methods, and provides a standardized protocol for its application in parasitic egg detection.
Technical Specifications and Performance Benchmarking
YAC-Net is architected as a lightweight deep-learning model, with its design originating from the YOLOv5n model, which serves as its baseline [19]. The developers introduced two key structural modifications to enhance performance and reduce computational complexity:
- Asymptotic Feature Pyramid Network (AFPN) in the Neck: The original Feature Pyramid Network (FPN) was replaced with an AFPN. This hierarchical and asymptotic aggregation structure allows for a more complete fusion of spatial contextual information from the input images. Its adaptive spatial feature fusion mechanism helps the model select beneficial features while ignoring redundant information, which reduces computational demands and improves detection performance [19].
- C2f Module in the Backbone: The C3 module in the backbone was replaced with a C2f module. This enrichment of gradient flow information enhances the backbone network's feature extraction capability, contributing to the model's high accuracy [19].
Ablation studies confirmed the effectiveness of these modifications in the process of model lightweighting [19]. The model was trained and evaluated using the ICIP 2022 Challenge dataset, with experiments conducted via fivefold cross-validation [19].
Table 1: Performance Metrics of YAC-Net on the Test Set
| Metric | Value |
|---|---|
| Precision | 97.8% |
| Recall | 97.7% |
| F1 Score | 0.9773 |
| mAP_0.5 | 0.9913 |
| Number of Parameters | 1,924,302 |
Table 2: Comparative Analysis of YAC-Net Against Other Detection Methods
| Model/Method | Key Characteristics | Reported Performance (mAP or Equivalent) |
|---|---|---|
| YAC-Net | Lightweight; modified YOLOv5n with AFPN & C2f [19] | mAP_0.5: 0.9913 [19] |
| Faster R-CNN | Two-stage detector; complex structure [21] [22] | Used in parasitic egg and colorectal cancer detection [21] [22] |
| YOLOv5n (Baseline) | Original model before YAC-Net modifications [19] | Lower than YAC-Net (YAC-Net improves mAP_0.5 by 0.0271) [19] |
| C2BNet | Coupled Composite Backbone with Swin-Transformer & CNN; large parameters [19] | High performance but computationally intensive [19] |
The experimental results demonstrate that compared to its baseline (YOLOv5n), YAC-Net improves precision by 1.1%, recall by 2.8%, F1 score by 0.0195, and mAP0.5 by 0.0271, while simultaneously reducing the number of parameters by one-fifth [19]. When benchmarked against other state-of-the-art detection methods, YAC-Net achieves leading performance in precision, F1 score, mAP0.5, and parameter count [19].
Diagram 1: YAC-Net high-level architecture for parasite egg detection.
Detailed Experimental Protocol for Parasite Egg Detection
This protocol outlines the procedure for applying the pre-trained YAC-Net model to detect parasitic eggs in stool microscopy images, based on the methodology described in the foundational research [19].
Research Reagent Solutions and Essential Materials
Table 3: Essential Materials and Software for YAC-Net Implementation
| Item | Function/Description | Example/Note |
|---|---|---|
| Microscopy Stool Images | Raw input data for the detection model. | Images should be prepared per standard parasitology methods (e.g., similar to Kato-Katz [21]). |
| ICIP 2022 Challenge Dataset | Benchmark dataset for training and validating parasite egg detection models. | Largest public dataset of its kind; used for YAC-Net's development [19]. |
| YAC-Net Pre-trained Model | The core deep learning model for object detection. | Available from the original publication; built upon PyTorch framework. |
| Python (v3.8+) | Programming language environment. | Essential for running model inference scripts. |
| PyTorch Library | Deep learning framework. | Required to load and execute the YAC-Net model. |
| OpenCV Library | Computer vision library for image processing. | Used for image pre-processing and visualization of results. |
| GPU with CUDA Support | Hardware accelerator. | Recommended for significantly reducing inference time. |
Step-by-Step Workflow
Step 1: Image Acquisition and Pre-processing
- Image Acquisition: Collect stool sample images using a microscope equipped with a digital camera. Ensure consistent magnification and lighting conditions across images to maintain uniformity.
- Pre-processing: Resize input images to the required input dimensions of the YAC-Net model (typically 640x640 pixels). Normalize pixel values to a standard range (e.g., 0-1) to facilitate stable model inference.
Step 2: Model Loading and Inference
- Environment Setup: Install the necessary software dependencies, including Python, PyTorch, OpenCV, and other libraries as specified in the model's repository.
- Load Model: Load the pre-trained YAC-Net weights into the model architecture using PyTorch. Transfer the model to a GPU if available for faster computation.
- Run Inference: Pass the pre-processed image through the model. YAC-Net will perform a single forward pass to predict bounding boxes and class probabilities for parasite eggs present in the image.
Step 3: Post-processing and Result Interpretation
- Post-processing: Apply a confidence threshold (e.g., 0.5) to filter out weak detections. Use Non-Maximum Suppression (NMS) to eliminate redundant bounding boxes that refer to the same egg.
- Visualization: Draw the final bounding boxes and class labels on the original image. The output should clearly indicate the location and type of any detected parasite eggs.
- Quantification: The model's output can be used to quantify the number of eggs per image, which can be correlated with infection intensity.
Diagram 2: YAC-Net diagnostic workflow from sample to result.
YAC-Net's Position in the AI Diagnostics Ecosystem
YAC-Net occupies a strategic position within the AI-assisted diagnostics landscape by addressing the critical trade-off between model performance and computational efficiency. While sophisticated models like Faster R-CNN and composite networks with Swin-Transformers have demonstrated high accuracy in various medical image analysis tasks, including colorectal cancer screening [22] and general microscopic image segmentation [23], they often require substantial computational resources [19]. This limits their deployability in remote or resource-poor settings where parasitic infections are most prevalent.
YAC-Net's lightweight design, achieved through the innovative use of AFPN and the C2f module, allows it to achieve state-of-the-art performance on parasitic egg detection with a parameter count reduced by one-fifth compared to its baseline [19]. This makes it a compelling solution for point-of-care diagnostic applications. Its design philosophy aligns with the growing need for "edge AI" in medicine, where models are optimized to run on lower-power devices without sacrificing diagnostic accuracy. Furthermore, the model's high recall rate of 97.7% is particularly crucial for a screening tool, as it minimizes false negatives, ensuring that infections are not missed [19].
YAC-Net represents a significant advancement in the application of deep learning for parasitic disease diagnostics. By prioritizing a lightweight architecture without compromising on performance, it provides a practical and effective pathway toward automating the detection of parasite eggs in microscopy images. The detailed protocols and performance benchmarks outlined in this application note underscore its robustness and readiness for further validation in clinical settings. For researchers and drug development professionals, YAC-Net serves as a powerful tool that can streamline diagnostic processes, enhance throughput, and contribute to the fight against neglected tropical diseases by making advanced diagnostic technology more accessible.
Connecting Automated Detection to Accelerated Drug Discovery and Development
The integration of automated detection systems powered by deep learning is fundamentally transforming the landscape of drug discovery and development. These technologies are poised to address critical bottlenecks in data generation and analysis, enabling researchers to extract more predictive information from complex, physiologically relevant model systems. This shift is particularly evident in the analysis of microscopy images, where high-content data can be repurposed to predict broader biological activity, thereby accelerating project timelines and reducing reliance on costly, low-throughput customized assays [24]. Framed within the context of ongoing research into the YAC-Net deep learning model—a lightweight architecture designed for precise, automated detection of parasite eggs in microscope images—this document outlines practical protocols and applications that bridge advanced detection and pharmaceutical development [25]. By providing detailed methodologies and data, these application notes aim to equip scientists with the tools to leverage such models for enhancing the efficiency and predictive power of their discovery workflows.
Quantitative Performance Data
The deployment of specialized deep learning models for image-based detection in a drug discovery context necessitates a clear understanding of model performance and computational requirements. The table below summarizes key quantitative metrics for the YAC-Net model and illustrates how repurposing high-content imaging data can impact drug discovery campaigns.
Table 1: Performance Metrics of the YAC-Net Detection Model This table details the detection performance of the YAC-Net model as evaluated on the ICIP 2022 Challenge dataset using fivefold cross-validation [25].
| Metric | YOLOv5n (Baseline) | YAC-Net (Proposed) | Improvement |
|---|---|---|---|
| Precision | 96.7% | 97.8% | +1.1% |
| Recall | 94.9% | 97.7% | +2.8% |
| F1 Score | 0.9578 | 0.9773 | +0.0195 |
| mAP@0.5 | 0.9642 | 0.9913 | +0.0271 |
| Number of Parameters | 2,300,000 (est.) | 1,924,302 | Reduction of ~375,000 |
Table 2: Impact of Repurposing High-Content Imaging Data in Drug Discovery This table summarizes the experimental results from repurposing a high-throughput imaging assay to predict activity in two separate drug discovery projects, demonstrating a significant increase in hit rates and chemical diversity [24].
| Project | Conventional Assay Hit Rate | Image-Based Prediction Hit Rate | Fold Increase in Hit Rate | Key Outcome |
|---|---|---|---|---|
| Project A | Baseline | 50x higher | 50 | Increased hit rate |
| Project B | Baseline | 250x higher | 250 | Increased chemical structure diversity of hits |
Experimental Protocols
Protocol A: Implementation of YAC-Net for High-Content Microscopy Image Analysis
This protocol describes the procedure for utilizing the pre-trained YAC-Net model to detect and quantify objects of interest (e.g., parasite eggs, specific cellular phenotypes) in microscopy images, generating structured data for downstream analysis.
I. Materials and Equipment
- YAC-Net Model Weights: Pre-trained model file (
yac_net.pt). - Inference Hardware: A computer with a CUDA-compatible GPU (e.g., NVIDIA GeForce RTX 3080) is recommended for speed.
- Software Environment: Python 3.8+, PyTorch 1.9+, OpenCV, and other dependencies as outlined in the YAC-Net repository.
- Input Data: A directory of microscopy images in standard formats (e.g.,
.tiff,.png).
II. Procedure
- Environment Setup
- Create a Python virtual environment and install the required packages as listed in the project's
requirements.txtfile. - Ensure the CUDA drivers and PyTorch are correctly configured to utilize the GPU.
- Create a Python virtual environment and install the required packages as listed in the project's
Data Preparation
- Organize the microscopy images into a single directory. For consistent results, ensure images are saved with minimal compression.
- (Optional) If the model was trained on a specific image format or bit depth, pre-process the images to match, such as normalizing pixel values to [0, 1].
Model Inference
- Load the pre-trained YAC-Net model weights into the model architecture using the PyTorch
load_state_dict()function. - Set the model to evaluation mode with
model.eval(). - Use the provided inference script to process the image directory. The script will: a. Load and pre-process each image (e.g., resizing, normalization). b. Pass the image through the YAC-Net model. c. Apply a non-maximum suppression (NMS) threshold (e.g., 0.45) to filter overlapping detections. d. Output the bounding box coordinates, confidence scores, and class labels for all detections above a set confidence threshold (e.g., 0.5).
- Load the pre-trained YAC-Net model weights into the model architecture using the PyTorch
Output and Analysis
- The results can be saved in a structured format, such as a JSON file or CSV, for easy integration with data analysis pipelines.
- The output data can then be used for quantitative analysis, such as calculating the number of objects per image, object density, or spatial distribution.
Protocol B: Repurposing a High-Content Glucocorticoid Receptor (GR) Translocation Assay for Predictive Modeling
This protocol is adapted from seminal work demonstrating that data from a single high-content assay can be repurposed to predict compound activity in unrelated biological assays [24].
I. Materials and Equipment
- Cell Line: U-2 OS cells (or another suitable line) stably expressing a glucocorticoid receptor-GFP fusion protein.
- Compound Library: A diverse set of small molecules for screening.
- Reagents: Cell culture media, serum, buffers, fixation reagent (e.g., paraformaldehyde), nuclear stain (e.g., DAPI).
- Equipment: Automated fluorescence microscope, high-throughput liquid handler, plate reader.
- Software: Image analysis software (e.g., CellProfiler) and machine learning environment (e.g., Python with scikit-learn).
II. Procedure
- Primary High-Content Screening
- Seed cells into 384-well microplates and culture until 50-60% confluent.
- Using an automated liquid handler, treat cells with compounds from the library at a single concentration (e.g., 10 µM) for a defined period (e.g., 2 hours). Include positive (e.g., Dexamethasone) and negative (DMSO vehicle) controls on every plate.
- Fix cells, stain nuclei with DAPI, and acquire images for each well using an automated fluorescence microscope with a 20x objective. Capture images in the GFP (GR-GFP) and DAPI (nuclei) channels.
Image Analysis and Feature Extraction
- Use image analysis software to identify nuclei based on the DAPI signal.
- For each cell, quantify the translocation of GR-GFP from the cytoplasm to the nucleus. Extract a rich set of ~800+ morphological features from each cell, including intensity, texture, and shape measurements from both channels [24] [26].
- Aggregate the single-cell data to generate a profile (e.g., median values) for each compound well, resulting in a high-dimensional feature vector for every compound.
Model Training and Predictions for a New Assay
- Data Integration: Compile the feature vectors from the GR translocation screen with the known activity outcomes from your target drug discovery project's assay (e.g., a functional assay for a different target).
- Model Training: Train a machine learning model, such as a Random Forest or Bayesian Matrix Factorization model, on this combined dataset [24]. The model will learn the relationship between the cellular phenotypes induced by the compounds and their activity in the target assay.
- Activity Prediction: Use the trained model to predict the activity of new, untested compounds in the target assay based solely on their profiles from the GR translocation screen. This prioritizes compounds for testing in the more resource-intensive target assay.
Workflow Visualization
The following diagram illustrates the integrated workflow connecting automated microscopy detection with predictive modeling for accelerated drug discovery.
Diagram Title: AI-Driven Drug Discovery Workflow
The Scientist's Toolkit: Research Reagent Solutions
Table 3: Essential Materials for Automated Detection and High-Content Screening
This table details key reagents, tools, and software essential for implementing the protocols described in this document.
| Item Name | Function / Application | Key Characteristics / Examples |
|---|---|---|
| YAC-Net Deep Learning Model [25] | Automated object detection in microscopy images. | Lightweight CNN; uses AFPN & C2f modules; high precision (97.8%) with reduced parameters. |
| High-Content Screening (HCS) Platform [26] | Automated image acquisition for phenotypic profiling. | Integrated systems with automated microscopy, liquid handling, and environmental control. |
| Glucocorticoid Receptor (GR) Assay Kit [24] | Provides a rich source of phenotypic data for predictive model training. | Cell line with GR-GFP construct; fixation & staining reagents. |
| CellProfiler / ImageJ | Open-source software for quantitative analysis of biological images. | Used for feature extraction (morphology, intensity, texture) from raw microscopy images. |
| Python with ML Libraries (scikit-learn, PyTorch) | Environment for building and training predictive models from extracted features. | Enables use of models like Random Forest or Bayesian Matrix Factorization for activity prediction. |
| Modular Liquid Handler [27] | Automation of reagent dispensing and compound transfers in microplates. | Systems like the "Research 3 neo pipette" or Tecan's "Veya" for walk-up automation and reproducibility. |
| 3D Cell Culture System [27] | Provides more physiologically relevant models for screening. | Automated platforms like the MO:BOT for standardizing organoid culture and screening. |
Architecture and Implementation: A Technical Deep Dive into the YAC-Net Model
Within the context of developing YAC-Net, a deep learning model for microscopy image detection, the selection of an appropriate base architecture is a critical foundational decision. This choice directly influences the model's performance, computational efficiency, and suitability for deployment in research and clinical settings. For YAC-Net, which focuses on detecting cellular structures and anomalies in microscopy images, YOLOv5n was chosen as the starting baseline model. This document outlines the quantitative and qualitative reasoning behind this selection, providing a detailed protocol for researchers and scientists in drug development who face similar decisions in their computer vision pipelines.
The decision was driven by the need for a highly efficient and adaptable architecture that maintains a small computational footprint without sacrificing the potential for high accuracy, a balance that is essential for analyzing complex microscopy data where features can be small and nuanced [28].
Quantitative Comparison of YOLOv5 Variants
The YOLOv5 family consists of several models, ranging from the ultra-lightweight YOLOv5n (nano) to the much larger YOLOv5x (extra large). The primary differentiators among them are their depth and width, which are governed by two scaling factors: depth_multiple (model depth) and width_multiple (layer channel width) [29] [30]. The following table summarizes the key architectural and performance metrics across the variants, based on the COCO dataset benchmark.
Table 1: Architectural and Performance Specifications of YOLOv5 Variants
| Model Variant | Depth Multiple | Width Multiple | Parameters (M) | mAPval (50-95) | CPU Speed (ms) | V100 Speed (ms) |
|---|---|---|---|---|---|---|
| YOLOv5n | 0.33 | 0.25 | 1.9 | 28.0 | 45 | 6.3 |
| YOLOv5s | 0.33 | 0.50 | 7.2 | 37.4 | 98 | 6.4 |
| YOLOv5m | 0.67 | 0.75 | 21.2 | 45.4 | 224 | 8.2 |
| YOLOv5l | 1.0 | 1.0 | 46.5 | 49.0 | 430 | 10.1 |
| YOLOv5x | 1.25 | 1.25 | 86.7 | 50.7 | 787 | 12.1 |
As illustrated in Table 1, YOLOv5n has the smallest number of parameters (1.9 million) and the fastest inference time on both CPU and GPU hardware [31]. While its mAP is the lowest among the family, its minimal resource consumption makes it an ideal "blank slate" for research and development, particularly when the goal is to build upon and specialize a model for a specific domain like microscopy [32].
Rationale for Selecting YOLOv5n in Microscopy Research
Suitability for Resource-Constrained Environments
Microscopy research, especially in drug development, often involves processing thousands of high-resolution images. The requirement for high-throughput analysis, coupled with the potential for deployment on laboratory computers without high-end GPUs, makes computational efficiency a prime concern. YOLOv5n, with its minimal parameter count and fast inference speed, is designed specifically for "embedded devices and real-time applications" [28] and "scenarios requiring efficient, real-time processing" [32]. This aligns with the need for scalable and accessible analysis tools in scientific environments.
Effectiveness as a Baseline for Architectural Improvement
A core objective in developing YAC-Net is to innovate and improve upon existing architectures. Starting with a large, high-performance model like YOLOv5x offers less room for measurable improvement and is computationally expensive for rapid experimentation. YOLOv5n provides a lean baseline; its smaller architecture allows for faster training cycles, enabling researchers to quickly prototype, test, and validate new modules or techniques. Its performance establishes a clear lower bound, making it easier to quantify the contribution of any proposed enhancements. This approach is evidenced in successful research where YOLOv5n was used as a baseline and subsequently improved to outperform the original model on a specialized detection task [28].
Proven Efficacy in Biological Image Detection
Evidence from recent literature supports the applicability of YOLOv5 variants to biological and medical imaging tasks, demonstrating that even the smaller models can be effectively tuned for high performance.
Table 2: Performance of YOLOv5 Variants on Specialized Datasets
| Application Domain | Dataset | Model | Key Metric | Result |
|---|---|---|---|---|
| Urine Sediment Analysis [33] | Microscopic Urine Images | YOLOv5l | mAP@0.5 | 85.8% |
| YOLOv5x | mAP@0.5 | 85.4% | ||
| Industrial Defect Detection [28] | NEU-DET | Original YOLOv5n | mAP | 71.0% |
| Improved YOLOv5n | mAP | 75.3% | ||
| Multi-Sized Cell Detection [34] | Fluorescence Microscopy | YOLOv5-FPN | Average Precision | 0.8 (80.0%) |
For instance, in a study on urinary particle detection, all YOLOv5 variants were evaluated, with YOLOv5l and YOLOv5x achieving the highest mean average precision (mAP) [33]. This demonstrates the family's inherent capability for microscopy-like data. Furthermore, research on industrial surface defect detection—a problem space with challenges analogous to microscopic defect detection, such as small and indistinct features—successfully used YOLOv5n as a baseline. The researchers then enhanced it with targeted improvements, increasing its mAP by 4.3% [28]. This validates the strategy of starting with a lightweight model and architecturally optimizing it for a specific domain.
YOLOv5n Baseline Evaluation and Optimization Protocol
This protocol provides a step-by-step methodology for establishing a YOLOv5n performance baseline on a custom microscopy dataset and outlines initial paths for optimization, as applied in the YAC-Net project.
Phase 1: Baseline Establishment
Step 1: Environment and Dataset Setup
- Installation: Clone the official Ultralytics YOLOv5 repository and install dependencies as specified in
requirements.txt[31]. - Data Preparation: Annotate microscopy images with bounding boxes. Format the dataset in the YOLOv5 structure and create a corresponding dataset YAML file (e.g.,
microscopy_data.yaml) defining paths, class names, and number of classes. - Data Verification: Use the YOLOv5 training script's built-in functionality to visualize the first training batch (
train_batch*.jpg). This critical step confirms that images and labels are loaded correctly and that data augmentation is functioning as intended [35].
Step 2: Initial Training with Default Parameters
- Execute the training command to establish a performance baseline with default settings [35]:
python train.py --data microscopy_data.yaml --weights yolov5n.pt --epochs 300 --img 640 --batch-size 16 - Key Parameters:
--weights yolov5n.pt: Loads pre-trained COCO weights for transfer learning.--epochs 300: A standard starting point for training epochs [35].--img 640: Input image size. If small objects are prevalent in your microscopy images, consider increasing this value (e.g.,--img 1280) in subsequent runs [35].--batch-size: Use the largest value that fits your GPU memory.
Step 3: Baseline Validation
- Upon completion, evaluate the model on the validation set. Key metrics to record from the
results.txtfile and validation plots include:- mAP@0.5 (PASCAL VOC metric)
- mAP@0.5:0.95 (COCO metric)
- Training and validation loss curves
- Analyze the precision-recall curve and confusion matrix to identify specific class-wise performance issues.
Phase 2: Initial Optimization and Hyperparameter Tuning
Step 4: Data Augmentation Refinement YOLOv5 includes on-the-fly augmentations like mosaic, scaling, and color space adjustments [29] [30]. For microscopy data, consider:
- Adjusting the mosaic augmentation cutoff with
--close-mosaicto stabilize late-stage training [35]. - Modifying the
hyp.scratch-low.yamlconfiguration file to increase or decrease the intensity of certain augmentations based on the characteristics of your dataset.
Step 5: Hyperparameter Evolution
- Employ YOLOv5's built-in hyperparameter evolution to automatically find a better starting set of hyperparameters than the defaults [35] [33]:
python train.py --data microscopy_data.yaml --weights yolov5n.pt --epochs 300 --img 640 --evolve - This process uses a genetic algorithm to mutate hyperparameters over generations, selecting for those that yield the highest fitness value (typically mAP).
Step 6: Architectural Investigation (Post-Baseline) After a strong baseline is established, consider architectural modifications informed by the specific failure modes observed. As demonstrated in successful research, these can include [28]:
- Integrating attention mechanisms (e.g., Coordinate Attention) into the backbone to enhance feature extraction.
- Replacing the native PANet neck with a more advanced feature fusion network like Gold-YOLO to improve information flow.
- Adopting a more advanced loss function such as SIoU to improve bounding box regression.
Workflow and Resource Toolkit
Experimental Workflow Diagram
The following diagram illustrates the logical flow for the baseline selection, evaluation, and initial optimization of YOLOv5n within a research project.
Diagram Title: YOLOv5n Baseline Selection and Optimization Workflow
The Scientist's Toolkit: Key Research Reagents and Solutions
Table 3: Essential Components for a YOLOv5n-based Detection Project
| Component / Solution | Function / Role | Example / Note |
|---|---|---|
| Ultralytics YOLOv5 Repo | Core codebase for training, validation, and export of models. | GitHub repository [31]. |
Pre-trained Weights (yolov5n.pt) |
Enables transfer learning, providing a strong starting point for feature detection and significantly reducing training time and data requirements. | Trained on the COCO dataset [35]. |
| Custom Dataset YAML File | Configuration file that informs the trainer about the dataset structure, number of classes, and class names. | Essential for adapting the model to a new task [31]. |
Hyperparameter Configuration (hyp.*.yaml) |
Defines the training "recipe," including learning rates, augmentation intensities, and loss weights. | Start with hyp.scratch-low.yaml [35]. |
| Genetic Algorithm (GA) | An automated method for hyperparameter optimization, evolving them over generations to maximize a fitness metric like mAP. | Implemented in YOLOv5 via --evolve [35] [33]. |
| Mosaic Data Augmentation | A training-time augmentation that combines four images into one, improving the model's ability to learn context and detect objects at various scales. | Particularly effective for addressing the "small object problem" [29] [30]. |
| Test-Time Augmentation (TTA) | An inference method that creates augmented versions of an input image and averages the predictions. | Can be enabled to boost final prediction accuracy at a cost of speed [35]. |
The selection of YOLOv5n as the foundational model for the YAC-Net project is a strategic decision grounded in its minimal computational footprint, rapid prototyping capabilities, and demonstrated potential for specialization. The quantitative data shows it provides the most efficient starting point, while published research confirms that its architecture is a viable canvas for innovations targeting complex detection tasks in microscopy and beyond. The protocols and toolkit provided herein offer a concrete roadmap for other researchers to implement this baseline strategy, establishing a robust and efficient foundation for advanced deep learning model development in scientific image analysis.
Within the framework of the YAC-Net deep learning model for microscopy image detection, the replacement of the traditional Feature Pyramid Network (FPN) with the Asymptotic Feature Pyramid Network (AFPN) constitutes a foundational innovation. This architectural modification directly addresses critical limitations inherent in previous automated parasite egg detection systems, specifically the loss or degradation of feature information during multi-scale feature fusion, which impairs the model's ability to encode objects with significant scale variance [25] [36]. In the context of analyzing microscopic parasite egg images, where objects can vary considerably in size and appearance, this degradation presents a substantial obstacle to achieving high precision and recall.
The conventional FPN structure, which employs a top-down pathway with lateral connections, primarily integrates semantic feature information from adjacent levels [25]. While effective to a degree, this approach suffers from a significant semantic gap between non-adjacent levels. High-level features, which contain rich semantic information, must propagate through multiple intermediate scales before fusing with low-level features that possess detailed spatial information. Throughout this propagation, semantic information can be lost or degraded, compromising the final feature maps used for detection [36]. In contrast, the AFPN introduces a hierarchical and asymptotic aggregation structure that supports direct interaction between non-adjacent levels. It initiates the fusion process by combining two adjacent low-level features and then asymptotically (progressively) incorporates higher-level features into the fusion process [25] [36]. This methodology avoids the larger semantic gap between non-adjistant levels, thereby preserving more discriminative information crucial for accurately identifying and localizing parasite eggs of varying sizes. Furthermore, the integration of an adaptive spatial fusion (ASF) operation allows the model to dynamically mitigate potential multi-object information conflicts that can occur during feature fusion at each spatial location, effectively learning to select beneficial features while ignoring redundant information [36] [37].
Performance Analysis and Quantitative Data
The integration of the Asymptotic Feature Pyramid Network into the YAC-Net model has yielded substantial quantitative improvements across all key detection metrics while simultaneously reducing the computational footprint of the model. The following tables summarize the core experimental results from the ablation study and comparative analysis, demonstrating the efficacy of this innovation.
Table 1: Ablation Study of YAC-Net Modifications on the ICIP 2022 Challenge Dataset (Fivefold Cross-Validation)
| Model Component | Precision (%) | Recall (%) | F1 Score | mAP@0.5 | Parameters |
|---|---|---|---|---|---|
| YOLOv5n (Baseline) | 96.7 | 94.9 | 0.9578 | 0.9642 | ~2,400,000* |
| + AFPN Replacement | 97.5 | 97.2 | 0.9735 | 0.9850 | ~1,924,302 |
| + C2f Module | 97.1 | 96.5 | 0.9680 | 0.9775 | - |
| YAC-Net (Full Model) | 97.8 | 97.7 | 0.9773 | 0.9913 | 1,924,302 |
*Note: The baseline parameter count is an estimate based on the reported reduction.
Table 2: Comparative Performance of YAC-Net Against State-of-the-Art Detection Methods
| Detection Method | Precision (%) | Recall (%) | F1 Score | mAP@0.5 | Parameter Count |
|---|---|---|---|---|---|
| Faster R-CNN [25] | - | - | - | - | High |
| Cascade Mask R-CNN [25] | - | - | - | - | High |
| YOLOX [25] | - | - | - | - | - |
| YAC-Net (Proposed) | 97.8 | 97.7 | 0.9773 | 0.9913 | 1,924,302 |
The data in Table 1 reveals that the replacement of the FPN with the AFPN is the single most impactful modification, contributing significantly to the gains in recall, F1 score, and mAP@0.5. Crucially, this performance boost is achieved alongside a reduction of approximately one-fifth in the number of parameters compared to the baseline YOLOv5n model [25]. This dual benefit of enhanced accuracy and reduced model complexity is a direct validation of the AFPN's efficient design. As shown in Table 2, the complete YAC-Net model achieves best-in-class performance on the ICIP 2022 Challenge dataset, establishing it as a highly effective and lightweight solution for parasite egg detection [25].
Experimental Protocol and Workflow
This section provides a detailed, actionable protocol for implementing and validating the AFPN module within a deep learning-based detection framework, such as YAC-Net, for microscopy image analysis.
Dataset Preparation and Preprocessing
- Dataset: Utilize the ICIP 2022 Challenge dataset or a comparable in-house dataset of microscopic parasite egg images [25].
- Data Annotation: Ensure all images are annotated with bounding boxes and class labels for each parasite egg instance. Common classes include helminth eggs like Ascaris lumbricoides, Trichuris trichiura, and hookworm species.
- Data Splitting: Employ a fivefold cross-validation strategy to ensure robust model evaluation and mitigate overfitting. Partition the entire dataset into five folds, using four for training and one for validation in a rotating manner [25].
- Data Augmentation: Apply standard online data augmentation techniques during training to improve model generalization. This should include:
Model Configuration and Training
- Baseline Model: Initialize the model with a pre-trained YOLOv5n backbone. This provides a strong starting point for feature extraction [25].
- AFPN Integration:
- Backbone Enhancement: Replace the C3 modules in the YOLOv5n backbone with C2f modules to enrich gradient flow and improve feature extraction capability [25].
- Training Hyperparameters:
- Optimizer: Stochastic Gradient Descent (SGD) or Adam.
- Learning Rate: Apply a cosine annealing scheduler, starting from 0.01.
- Batch Size: Set to 16 or 32, depending on GPU memory constraints.
- Epochs: Train for a minimum of 300 epochs to ensure convergence.
- Loss Function: Use a composite loss comprising Binary Cross-Entropy for classification and CIOU Loss for bounding box regression.
Model Evaluation and Validation
- Primary Metrics: Calculate Precision, Recall, F1 Score, and mean Average Precision at IoU=0.5 (mAP@0.5) on the held-out test set [25].
- Complexity Analysis: Report the total number of model parameters and computational load in Giga Floating Point Operations (GFLOPS) to quantify the model's efficiency [25] [38].
- Ablation Studies: Conduct controlled experiments to isolate the performance contribution of the AFPN by comparing the baseline model against the model with only the AFPN modification and the final YAC-Net model (AFPN + C2f) [25].
The workflow for this protocol is visualized in the following diagram, outlining the key stages from data preparation to model deployment.
Visualizing the Architectural Innovation
The core innovation of the AFPN lies in its structure for feature fusion. The following diagram contrasts the traditional FPN design with the AFPN, highlighting the direct, non-adjacent level interactions that reduce information loss.
The Scientist's Toolkit: Research Reagent Solutions
The following table details key computational "reagents" and resources essential for replicating the AFPN-based YAC-Net model and its evaluation.
Table 3: Essential Research Reagents and Computational Resources
| Resource Name | Type | Function / Application | Key Characteristics |
|---|---|---|---|
| ICIP 2022 Challenge Dataset [25] | Dataset | Benchmark for training and evaluating parasite egg detection models. | Annotated microscopic images of intestinal parasite eggs. |
| YOLOv5n [25] | Software Model | Baseline object detection model; serves as the starting backbone for YAC-Net. | Ultra-lightweight, pre-trained on large-scale datasets. |
| Asymptotic Feature Pyramid Network (AFPN) [36] | Algorithm/Module | Replaces FPN for multi-scale feature fusion with reduced information loss. | Supports direct non-adjacent level fusion; includes Adaptive Spatial Fusion (ASF). |
| C2f Module [25] | Algorithm/Module | Replaces the C3 module in the backbone to enrich gradient information. | Improves feature extraction capability of the model's backbone network. |
| Fivefold Cross-Validation [25] | Experimental Protocol | Statistical method for robust model training and validation. | Partitions data into 5 folds, rotating training/validation sets. |
| Dice Similarity Coefficient (DICE) [38] | Evaluation Metric | Measures segmentation overlap accuracy. | Critical for evaluating pixel-wise prediction tasks in medical imaging. |
| Aggregated Jaccard Index (AJI) [38] | Evaluation Metric | Evaluates instance segmentation performance, particularly for clustered objects. | Penalizes both splits and merges in instance detection. |
| mAP@0.5 [25] | Evaluation Metric | Standard object detection metric; mean Average Precision at 0.5 Intersection-over-Union. | Measures bounding box localization and classification accuracy. |
The C2f (CSP Bottleneck with 2F Connections) module represents a significant architectural advancement in deep learning-based object detection models, particularly within the YOLO (You Only Look Once) family. This module was designed to optimize the flow of gradient information and enrich the feature representations that are critical for complex visual tasks. In the context of microscopy image analysis—where targets such as parasite eggs, dendritic spines, and cells exhibit subtle morphological features and exist in cluttered environments—the enhanced feature extraction capability of the C2f module is particularly valuable. Its integration into the YAC-Net model for microscopy image detection directly addresses the challenge of accurately identifying small, low-contrast biological structures under varying imaging conditions [25] [39].
The C2f module is an evolution of the Cross-Stage Partial (CSP) network concept, which was originally introduced to reduce computational complexity while preserving accuracy. However, the C2f module introduces a more sophisticated dual feature fusion pathway (the "2F" connections) that surpasses earlier CSP and C3 blocks. This design provides a richer gradient flow and improves the network's ability to reuse features effectively across different layers. For microscopy applications, this translates to a model that can more reliably discern fine details, such as the neck of a dendritic spine or the shell of a specific parasite egg, which are often ambiguous or partially occluded in standard microscope images [39] [17].
Table 1: Core Components of the C2f Module and Their Functions
| Component Name | Primary Function | Impact on Feature Extraction |
|---|---|---|
| Dual Fusion Pathways | Enables parallel processing and fusion of feature maps from different network stages | Captures multi-scale contextual information, crucial for targets of varying sizes |
| Bottleneck Layer Stack | A series of convolutional layers that process and refine feature maps | Enhances model's capacity to learn complex morphological descriptors |
| Shortcut Connections | Directly connects earlier and later layers within the module | Mitigates vanishing gradient, ensuring effective training of deep networks |
| Concatenation Operation | Combines feature maps from different pathways | Enriches gradient information and promotes feature reuse |
Quantitative Performance of the C2f Module
Integrating the C2f module into a model's backbone network yields measurable improvements in several key performance metrics. In the development of YAC-Net, replacing the original C3 modules of the YOLOv5n baseline with C2f modules was a pivotal step. This modification directly contributed to a 1.1% increase in precision and a significant 2.8% boost in recall on the parasite egg detection task. The F1 score, which balances precision and recall, improved by 0.0195, while the mAP@0.5 (mean Average Precision at an Intersection over Union threshold of 0.5) saw a gain of 0.0271 [25]. These metrics collectively indicate that the model became not only more accurate in its identifications but also more sensitive in finding all relevant targets in an image—a critical requirement for diagnostic applications where false negatives are detrimental.
The performance benefits of the C2f module extend beyond the specific domain of parasitology. Its adoption in other scientific image analysis tasks confirms its general utility. For instance, in a study focused on detecting and segmenting lithium minerals from microscopic images, an improved model incorporating a C3k2-PS module (a variant inspired by similar design principles) achieved a slightly superior segmentation performance compared to its baseline while simultaneously reducing the number of parameters by 33% and the computational load (FLOPs) by 20% [40]. This demonstrates the C2f module's role in the broader trend of creating more efficient and powerful architectures for scientific image analysis.
Table 2: Performance Comparison of Models with and without C2f Enhancement
| Model / Architecture | Precision (%) | Recall (%) | mAP@0.5 | Parameters | Application Context |
|---|---|---|---|---|---|
| YOLOv5n (Baseline) | 96.7 | 94.9 | 0.9642 | ~2.3M | Parasite Egg Detection [25] |
| YAC-Net (with C2f) | 97.8 | 97.7 | 0.9913 | ~1.92M | Parasite Egg Detection [25] |
| Standard YOLOv8n | Data not fully specified in context | Concrete Slump Detection [41] | |||
| Improved YOLOv8n (with AWGAM-C2f) | +3.3% (improvement) | +0.6% (improvement) | +0.8% (improvement) | Not specified | Concrete Slump Detection [41] |
Experimental Protocol for Implementing and Validating the C2f Module
Integration of the C2f Module into a Model Backbone
The following protocol details the procedure for modifying a standard YOLOv5n architecture to create YAC-Net by integrating C2f modules, an approach that can be adapted for other microscopy detection models.
Materials and Software:
- Python (version 3.8 or higher)
- PyTorch deep learning framework (version 1.10 or higher)
- Ultralytics YOLOv5n source code
- High-performance computing workstation with a CUDA-enabled GPU (e.g., NVIDIA V100, A100)
Procedure:
- Model Architecture Modification:
- Locate all C3 modules within the backbone network of the YOLOv5n model definition file (commonly
models/yolov5n.yaml). - Systematically replace each C3 module with a C2f module. The C2f module should be configured with an appropriate number of bottleneck layers (a common setting is
n=1for a balance between performance and efficiency). - Ensure that the input and output channel dimensions of the new C2f module match those of the original C3 module to maintain network integrity.
- Locate all C3 modules within the backbone network of the YOLOv5n model definition file (commonly
- Code-Level Implementation of a C2f Block: The C2f module can be implemented in PyTorch as shown in the code block below. This code defines the fundamental structure, including the convolution layers and the split-transform-merge mechanism with dual skip connections [39].
Experimental Validation and Ablation Study
To empirically validate the contribution of the C2f module, a controlled ablation study must be conducted.
Materials:
- Dataset: Use a standardized and annotated microscopy image dataset. The ICIP 2022 Challenge dataset, used for YAC-Net, is a suitable example for parasitology [25]. For other fields, datasets like the B16BL6 for cell tracking [42] or a custom lithium ore dataset [40] are appropriate.
- Hardware: Identical GPU workstations for all experiments to ensure fair comparison.
Procedure:
- Training Configuration:
- Train two models: the baseline (e.g., YOLOv5n) and the modified model (e.g., YAC-Net with C2f).
- Use identical training hyperparameters for both models: SGD optimizer with an initial learning rate of 0.01, batch size of 16, and 500 training epochs. Disable Mosaic data augmentation for the final 10 epochs to stabilize training [25] [41].
- Employ fivefold cross-validation to ensure the robustness and statistical significance of the results.
Performance Metrics:
- Evaluate both models on a held-out test set.
- Record key metrics, including Precision, Recall, F1 score, and mAP@0.5.
- Compare the computational footprint by logging the number of parameters and FLOPs for each model.
Analysis:
- The improvement in recall and mAP@0.5 in the C2f-equipped model will demonstrate its enhanced feature extraction and localization capabilities.
- A reduction in the number of parameters highlights the module's contribution to model lightweighting.
Diagram 1: Experimental workflow for C2f module validation.
The Scientist's Toolkit: Research Reagent and Material Solutions
The development and validation of deep learning models like YAC-Net require not only computational resources but also carefully prepared biological samples and imaging reagents. The following table lists key materials used in the generation of microscopy datasets referenced in the supporting studies.
Table 3: Essential Research Reagents and Materials for Microscopy Image Acquisition
| Reagent / Material | Function in Experimentation | Example Use Case |
|---|---|---|
| MemBright Probes [17] | Lipophilic fluorescent dyes that uniformly label the plasma membrane in live or fixed samples. | Enables clear visualization of fine neuronal structures, such as dendritic spine necks and heads, for segmentation. |
| Fluorescent Phalloidin [17] | A toxin that selectively binds to filamentous actin (F-actin). | Labels the actin-rich cores of dendritic spines, facilitating their identification and morphological analysis in fixed tissue. |
| Mini-FLOTAC / FLOTAC Techniques [7] | A validated method for the purification and concentration of parasite eggs from fecal samples. | Prepares standardized and clean samples for imaging, improving the consistency and reliability of automated egg detection. |
| Super-Resolution Microscopy (e.g., STED, SIM) [17] | Advanced imaging techniques that surpass the diffraction limit of conventional light microscopy. | Provides high-resolution images necessary for resolving nanoscopic cellular structures, forming the gold-standard ground truth for model training. |
| Cell Culture Reagents & Perfusion Systems [42] | Supports the maintenance and growth of live cells (e.g., B16BL6 cells) during long-term, time-lapse imaging. | Enables the creation of dynamic datasets for cell tracking and division analysis under near-infrared illumination. |
The C2f module is a cornerstone innovation in the development of efficient and accurate deep learning models for microscopy image analysis. Its design, which prioritizes rich gradient flow and effective feature reuse, directly addresses the core challenges of biological image detection: identifying small, low-contrast targets amidst complex backgrounds. The quantitative evidence from YAC-Net and related models confirms that the C2f module delivers a significant boost in performance metrics critical for diagnostic and research applications, such as recall and mAP, while also contributing to a more lightweight model architecture. This combination of higher accuracy and lower computational demand makes models incorporating the C2f module particularly suitable for deployment in resource-limited settings, such as field clinics or laboratories without access to high-end computing infrastructure [25]. By following the detailed experimental protocols outlined in this document, researchers can successfully integrate and validate this powerful module, thereby advancing the state of the art in automated microscopy analysis.
Diagram 2: C2f module structure with feature fusion pathways.
The ICIP 2022 Challenge on Parasitic Egg Detection and Classification in Microscopic Images established a crucial benchmark for accelerating the development of automated diagnostic systems in parasitology [43]. This challenge directly addressed a significant global health burden, as intestinal parasitic infections affect approximately 1.5 billion people worldwide, with soil-transmitted helminth (STH) infections remaining a leading cause of morbidity, particularly in tropical and sub-tropical regions [43] [25]. Traditional microscopic examination of faecal samples for parasite eggs is time-consuming (approximately 30 minutes per sample), requires experienced medical laboratory technologists, and shows low sensitivity in practice [43]. The ICIP 2022 Challenge aimed to leverage advances in computer vision and deep learning to overcome these limitations by fostering the development of robust, accurate algorithms capable of automating parasitic egg detection and classification [43]. This document details the dataset composition, experimental protocols, and evaluation methodologies used in this benchmark, with specific application to the development and validation of the YAC-Net deep learning model for microscopy image detection research [25].
Dataset Specifications
Dataset Composition and Characteristics
The dataset compiled for the ICIP 2022 Challenge represents the largest collection of its kind for parasitic egg detection and classification [44]. It was specifically designed to enable the development of robust deep learning models capable of functioning in real-world clinical scenarios.
Table 1: ICIP 2022 Challenge Dataset Composition
| Characteristic | Specification |
|---|---|
| Sample Source | Faecal smear samples |
| Number of Parasite Egg Types | 11 |
| Primary Application | Automated detection and classification of intestinal parasite eggs |
| Challenge Focus | Robustness and accuracy in data-driven technologies |
| Intended Impact | Assist diagnosis in real clinical use, potentially enabling automated detection by non-experts |
The dataset encompasses eleven distinct types of parasitic eggs, reflecting the diversity of intestinal parasites found in human populations [43]. This variety ensures that models trained on this benchmark, such as YAC-Net, must learn to discriminate between morphologically similar classes and adapt to intra-class variations, which is essential for clinical deployment where accurate species identification directly impacts treatment decisions.
Data Accessibility and Challenge Structure
Access to the dataset was granted through a registration process, with distinct release schedules for training and testing subsets to ensure fair evaluation [43]. The training dataset was released on January 30, 2022, allowing participants to develop and fine-tune their models, while the testing dataset followed on February 13, 2022 [43]. This separation prevented overfitting and provided a realistic assessment of model generalization. Submission to the leaderboard opened on February 14, 2022, and the competition officially closed on May 31, 2022 [43]. This structured timeline facilitated systematic development and comparison of approaches, culminating in the identification of top-performing teams whose methods were further validated by the organizers on hidden datasets [43].
Experimental Protocols
Benchmark Experimental Framework
The experimental framework for the ICIP 2022 Challenge was designed to ensure rigorous, comparable evaluation of all submitted methods. The primary evaluation metric was Mean Intersection-over-Union (mIoU), which provides a comprehensive measure of both detection and classification performance [43]. For each type of parasitic egg, an individual Intersection-over-Union (IoU) score was calculated, and the mIoU was derived as the average of these per-class IoU scores [43]. This approach ensures balanced evaluation across all egg types, regardless of their frequency in the dataset. Submissions were ranked according to their mIoU scores on the leaderboard [43]. For the top five performing teams, additional validation was conducted: these teams were required to submit their code and models for verification by the organizers, who further tested the executables on a hidden, smaller dataset [43]. When necessary, computational speed served as a final tie-breaking criterion [43].
YAC-Net Experimental Configuration
The YAC-Net model, a lightweight deep learning architecture specifically designed for parasitic egg detection, was developed and evaluated using the ICIP 2022 Challenge dataset [25]. The experimental methodology for YAC-Net implementation is detailed below.
Table 2: YAC-Net Experimental Setup
| Experimental Component | Configuration |
|---|---|
| Base Model | YOLOv5n |
| Validation Method | Fivefold cross-validation |
| Key Architectural Modification 1 | Replacement of FPN with Asymptotic Feature Pyramid Network (AFPN) |
| Key Architectural Modification 2 | Replacement of C3 module with C2f module in backbone |
| Primary Advantages | Enhanced spatial context integration, enriched gradient flow, parameter reduction |
The YAC-Net experimental protocol employed fivefold cross-validation across the challenge dataset, ensuring robust performance estimation and reducing the potential for overfitting to specific data splits [25]. The model built upon the YOLOv5n architecture as a baseline but introduced two significant modifications tailored to the characteristics of parasitic egg imagery. First, the traditional Feature Pyramid Network (FPN) in the neck was replaced with an Asymptotic Feature Pyramid Network (AFPN), which facilitates better integration of spatial contextual information through its hierarchical and asymptotic aggregation structure [25]. This adaptive spatial feature fusion helps the model select beneficial features while ignoring redundant information, thereby reducing computational complexity while improving detection performance. Second, the C3 module in the backbone was replaced with a C2f module to enrich gradient information throughout the network, enhancing the feature extraction capability of the backbone network [25].
Evaluation Methodology
Performance Metrics and Evaluation Criteria
The evaluation methodology for the ICIP 2022 Challenge and subsequent YAC-Net validation encompassed multiple complementary metrics to provide a comprehensive assessment of model performance. While the official challenge ranking used mIoU as the primary criterion [43], additional standard object detection metrics were employed in model development and analysis, as demonstrated in the YAC-Net research [25].
Table 3: Performance Metrics for YAC-Net on ICIP 2022 Dataset
| Metric | YAC-Net Performance | Baseline (YOLOv5n) Performance |
|---|---|---|
| Precision | 97.8% | 96.7% |
| Recall | 97.7% | 94.9% |
| F1 Score | 0.9773 | 0.9578 |
| mAP@0.5 | 0.9913 | 0.9642 |
| Number of Parameters | 1,924,302 | ~2.4 million |
The evaluation results demonstrate that YAC-Net achieved superior performance compared to the baseline YOLOv5n model across all metrics while simultaneously reducing the parameter count by approximately one-fifth [25]. Specifically, YAC-Net showed improvements of 1.1% in precision, 2.8% in recall, 0.0195 in F1 score, and 0.0271 in mAP@0.5 [25]. This balance of high accuracy and computational efficiency makes YAC-Net particularly suitable for deployment in resource-constrained settings where intestinal parasitic infections are most prevalent.
Benchmark Results and Comparative Analysis
The ICIP 2022 Challenge attracted numerous participants, with five top-performing teams announced: BAD crew (Mahidol University, Thailand), NEGU (NCU, China), NVLab (National Tsing Hua University, Taiwan), Visilab (Universidad de Castilla-La Mancha, Spain), and ZUSTF4 (Zhejiang University of Science and Technology, China) [43]. These teams represented diverse international approaches to the problem, though detailed performance metrics for each team were not publicly disclosed in the available sources. The YAC-Net model, developed subsequent to the challenge, demonstrated state-of-the-art performance compared with existing detection methods, achieving the best results in precision, F1 score, mAP@0.5, and parameter count [25]. This positions YAC-Net as a competitive approach for parasitic egg detection, particularly in scenarios demanding computational efficiency.
Implementation Protocols
Experimental Workflow
The following diagram illustrates the complete experimental workflow for utilizing the ICIP 2022 benchmark dataset in developing and validating a deep learning model for parasitic egg detection:
YAC-Net Model Architecture
The YAC-Net architecture introduces specific modifications to the YOLOv5n baseline to optimize performance on parasitic egg detection. The following diagram illustrates these key architectural improvements:
Research Reagent Solutions
The successful implementation of deep learning models for parasitic egg detection requires both computational and experimental resources. The following table outlines the essential components utilized in working with the ICIP 2022 benchmark.
Table 4: Essential Research Reagents and Resources
| Resource Category | Specific Resource | Function/Application |
|---|---|---|
| Primary Dataset | ICIP 2022 Parasitic Egg Dataset [43] | Benchmark for training and evaluation; contains 11 egg types from faecal samples |
| Computational Framework | YOLOv5n [25] | Baseline object detection architecture |
| Architectural Enhancement | Asymptotic Feature Pyramid Network (AFPN) [25] | Advanced feature fusion for improved spatial context utilization |
| Evaluation Metric | Mean Intersection-over-Union (mIoU) [43] | Primary challenge evaluation criterion |
| Validation Methodology | Fivefold Cross-Validation [25] | Robust model performance assessment |
| Performance Metrics | Precision, Recall, F1 Score, mAP@0.5 [25] | Comprehensive model performance quantification |
The ICIP 2022 Challenge Benchmark provides a standardized framework and comprehensive dataset for advancing automated detection of intestinal parasitic eggs in microscopic images. The detailed experimental protocols, evaluation criteria, and performance benchmarks established through this challenge create a foundation for reproducible research in this critical healthcare application. The YAC-Net model, with its lightweight architecture and specialized modifications including AFPN and C2f modules, demonstrates how this benchmark can guide the development of efficient and accurate detection systems [25]. By achieving high precision (97.8%), recall (97.7%), and mAP@0.5 (0.9913) while reducing parameter count, YAC-Net exemplifies the potential for deploying such systems in resource-constrained settings where parasitic infections are most prevalent [25]. The continued refinement of these methodologies holds promise for transforming parasitic disease diagnosis through automated, accurate, and accessible detection tools.
Step-by-Step Guide to Deploying YAC-Net for Microscopy Image Analysis
YAC-Net is a lightweight deep-learning model designed specifically for the rapid and accurate detection of parasite eggs in microscopy images [19]. It is engineered to reduce the computational resources required for automated detection, thereby lowering the cost and hardware barriers for deployment in resource-limited settings, such as remote or impoverished areas [19]. This guide provides a comprehensive protocol for researchers and scientists to implement YAC-Net for microscopy image analysis within a broader research context, detailing every step from the experimental setup to quantitative evaluation.
Background and Principle
Automated detection of targets in microscopic images is a critical task in biomedical sciences. Traditional methods rely on manual examination by experienced professionals, which is inefficient, labor-intensive, and subject to human error and variability [19] [7]. Deep learning-based object detection algorithms, particularly convolutional neural networks (CNNs), have emerged as powerful tools for end-to-end automated detection, offering high speed and accuracy [19] [45].
YAC-Net is built upon the YOLOv5n architecture but introduces two key structural modifications to enhance its performance and reduce its parameter count:
- Asymptotic Feature Pyramid Network (AFPN) in the neck: Replaces the traditional Feature Pyramid Network (FPN). Unlike FPN, which primarily integrates semantic feature information at adjacent levels, AFPN's hierarchical and asymptotic aggregation structure fully fuses spatial contextual information from images. Its adaptive spatial feature fusion mode helps the model select beneficial features and ignore redundant information, thereby reducing computational complexity and improving detection performance [19].
- C2f module in the backbone: Replaces the original C3 module in YOLOv5n. This change enriches gradient information, enhancing the backbone network's feature extraction capability [19].
These innovations result in a model that achieves state-of-the-art performance with significantly fewer parameters, making it suitable for deployment on standard laboratory computers or lower-cost hardware [19].
System Requirements and Installation
Hardware and Software Recommendations
Table 1: Recommended System Configuration for YAC-Net Deployment
| Component | Minimum Specification | Recommended Specification |
|---|---|---|
| GPU | NVIDIA GPU with 4GB VRAM | NVIDIA GPU with 8GB+ VRAM (e.g., RTX 3070, A100) |
| CPU | 4-core processor | 8-core processor or higher |
| RAM | 8 GB | 16 GB or more |
| Storage | 50 GB free space | 100 GB+ free space (SSD recommended) |
| Operating System | Ubuntu 18.04+ / Windows 10+ | Ubuntu 20.04 LTS / Windows 11 |
| Python | 3.8 | 3.8 or later |
| Key Libraries | PyTorch 1.7+, Torchvision, OpenCV, Pillow, NumPy | PyTorch 1.12+, Torchvision 0.13+, OpenCV, Pillow, NumPy |
Installation Procedure
Create and activate a Python virtual environment:
Install PyTorch and Torchvision: Visit the official PyTorch website (pytorch.org) to get the installation command tailored to your CUDA version. For example, for CUDA 11.7:
Install additional required libraries:
Clone the YAC-Net repository (assuming the code is publicly available):
Data Preparation and Annotation Protocol
The performance of YAC-Net is highly dependent on the quality and consistency of the training data.
Microscope Image Acquisition
- Sample Preparation: For parasite egg detection, stool samples should be prepared using standardized methods such as the Mini-FLOTAC technique to ensure sensitivity and accuracy [7].
- Image Capture: Use a digital microscope with a consistent magnification (e.g., 40x or 100x objectives [46]). Ensure uniform lighting and focus across all images to minimize variance. The image acquisition system in the Kubic FLOTAC Microscope (KFM) serves as a good example of an integrated setup [7].
Data Annotation
- Annotation Tool: Use labeling tools such Labelme [47] or VGG Image Annotator (VIA) to annotate the objects of interest in the images.
- Bounding Box Drawing: For each target object (e.g., a parasite egg), draw a tight bounding box around it.
- Class Labeling: Assign the correct class label to each bounding box (e.g., "Ascaris lumbricoides," "Schistosoma mansoni").
- Export Format: Export the annotations in a format compatible with YOLO, typically as text files (
.txt) where each file corresponds to an image and contains one line per object in the format:class_id x_center y_center width height. The coordinates and dimensions are normalized relative to the image width and height.
Dataset Organization and Preprocessing
- Dataset Split: Organize your dataset into training, validation, and test sets. A typical ratio is 80:10:10. It is crucial to ensure that images from the same patient or sample are not spread across different splits to prevent data leakage [48].
- Directory Structure: Arrange your data as follows:
- Image Preprocessing: YAC-Net typically applies on-the-fly preprocessing during training, including resizing to a fixed input size (e.g., 640x640 pixels), normalization, and data augmentation techniques like mosaic augmentation and random affine transformations. These are usually handled within the model's data loader.
Experimental Setup and Training
This section outlines the methodology for training the YAC-Net model on a custom dataset.
The following diagram illustrates the end-to-end workflow for deploying YAC-Net, from data preparation to inference.
Model Configuration
Configuration File: YAC-Net uses a configuration file (e.g.,
yacnet.yaml) to define the model architecture and training parameters. Key sections include:- Network Architecture: Defines the backbone, neck (with AFPN), and detection heads.
- Number of Classes: (
nc) Set this to the number of your object classes. - Anchor Boxes: Pre-defined bounding box priors; these can be recalculated for your specific dataset.
Data Configuration File: Create a data configuration file (e.g.,
data.yaml) specifying the paths to your training, validation, and test images, the number of classes, and the class names.
Training Protocol
Hyperparameter Setting: The default hyperparameters in the YAC-Net codebase are a good starting point. Key parameters include:
- Epochs: 100-300 epochs.
- Batch Size: The largest possible size that fits your GPU memory (e.g., 16, 32).
- Initial Learning Rate (
lr0): 0.01. - Optimizer: SGD or Adam.
Initiate Training: Run the training script from the command line.
--img 640: Input image size.--batch 16: Batch size.--epochs 100: Number of training epochs.--data data.yaml: Path to your data config file.--cfg yacnet.yaml: Path to your model config file.--weights '': Start training from scratch. To use pre-trained weights, specify the path.--name yacnet_exp1: Name of the experiment for saving results.
Monitoring Training: Use tools like TensorBoard to monitor training and validation metrics in real-time, including loss, precision, recall, and mean Average Precision (mAP).
Model Evaluation and Performance Metrics
After training, it is essential to evaluate the model's performance on a held-out test set.
Quantitative Evaluation
Table 2: Key Performance Metrics for Object Detection Models
| Metric | Formula | Interpretation | YAC-Net Performance [19] |
|---|---|---|---|
| Precision | TP / (TP + FP) | Measures the model's ability to avoid false positives. | 97.8% |
| Recall | TP / (TP + FN) | Measures the model's ability to find all positive samples. | 97.7% |
| F1 Score | 2 * (Precision * Recall) / (Precision + Recall) | Harmonic mean of precision and recall. | 0.9773 |
| mAP@0.5 | Mean of AP at IoU=0.5 | Average precision across all classes at an Intersection over Union (IoU) threshold of 0.5. | 0.9913 |
| Parameters | - | Number of trainable parameters, indicating model size and complexity. | 1,924,302 |
Evaluate the model using the provided script:
Qualitative Evaluation
- Visual Inspection: Manually inspect the model's predictions on test images. Look for false positives (background misclassified as object) and false negatives (missed objects).
- Error Analysis: Identify common failure modes, such as confusion between visually similar egg types or difficulty detecting eggs in cluttered or low-contrast image regions.
Deployment for Inference
Once a satisfactory model is obtained, it can be deployed to analyze new microscopy images.
Run Inference: Use the trained model (
best.pt) to detect objects in new images or videos.--source: Path to input images, a directory, or a video file.--weights: Path to your trained model weights.--conf: Confidence threshold (0-1); detections with confidence below this will be discarded.--save-txt: Save the results as text files (bounding box coordinates).
Output: The script will save output images with bounding boxes drawn around detected objects, along with class labels and confidence scores. If
--save-txtis enabled, it will also save the coordinates for further analysis.
The Scientist's Toolkit
Table 3: Essential Research Reagent Solutions and Materials
| Item | Function/Application in Protocol | Example/Specification |
|---|---|---|
| Mini-FLOTAC / FLOTAC Kit | Standardized fecal sample preparation for parasite egg concentration and purification. | Kubic FLOTAC Microscope (KFM) system [7]. |
| Phase Contrast Microscope | High-quality image acquisition of transparent specimens, enhancing contrast. | Used in asbestos fiber and parasite imaging [7] [47]. |
| Digital Camera for Microscopy | Captures high-resolution digital images from the microscope. | DS-Ri2 camera [48]. |
| Labelme Annotation Software | Open-source tool for manually drawing bounding boxes on images to create training data. | [47] |
| GPU Workstation | Provides the computational power required for deep learning model training. | NVIDIA RTX series or higher, with CUDA support. |
| Python & PyTorch Environment | The core programming language and deep learning framework for running YAC-Net. | Python 3.8+, PyTorch 1.7+ [19]. |
YAC-Net Architecture and Modifications
The core innovations of YAC-Net are its specific modifications to the YOLOv5 architecture, which are visualized in the following diagram.
Key Modifications:
- C2f Module: Replaces the C3 module in the backbone, leading to richer gradient information and improved feature extraction capabilities [19].
- Asymptotic Feature Pyramid Network (AFPN): Replaces the standard FPN in the neck. This structure allows for full fusion of spatial contextual information and adaptively selects beneficial features while ignoring redundant information, reducing computational complexity and improving detection performance [19].
These modifications enable YAC-Net to achieve superior performance with fewer parameters compared to its baseline and other state-of-the-art methods, making it exceptionally suitable for practical, resource-conscious applications [19].
Enhancing Performance and Efficiency: Troubleshooting and Optimization Strategies for YAC-Net
Addressing Computational Constraints in Low-Resource Environments
The deployment of sophisticated deep learning models like YAC-Net for microscopy image detection in low-resource environments (LREs) presents significant computational challenges. These constraints can severely limit the clinical and research translation of otherwise high-performing models. In the context of YAC-Net, a deep learning model designed for microscopy image detection, addressing these constraints becomes paramount for ensuring accessibility and practicality in diverse settings, including underserved healthcare systems and resource-limited research laboratories [49] [50]. "Low-resource environment" refers to settings that cannot afford specialized hardware, such as deep learning acceleration cards, or consider such expenses unjustified [49]. This application note outlines a systematic framework and detailed protocols for optimizing YAC-Net, ensuring robust performance while maintaining computational feasibility in LREs.
Systematic Optimization Framework for YAC-Net
Optimizing deep learning models for LREs requires a multi-faceted approach. The principal goal is to navigate hardware constraints without substantially compromising the model's utility (accuracy) [49] [51]. A recommended systematic workflow involves applying optimization techniques sequentially, with validation checks at each stage to ensure performance criteria are met.
The following workflow describes the optimization process for a pre-trained YAC-Net model:
The optimization process is divided into two principal categories, both applicable to YAC-Net:
- Post-Training Optimization (PTO): Techniques applied to a pre-trained model that do not require further training cycles. This includes Graph Optimization (GO) and Post-Training Parameter Quantization (PT-PQ) [49].
- In-Training Optimization (ITO): Techniques that involve training cycles during model optimization, such as specific forms of quantization that require retraining [49].
For a pre-trained model like YAC-Net, PTO techniques offer a practical starting point as they preclude the need for further model training [49].
Core Optimization Techniques & Performance Analysis
Different optimization techniques offer varying benefits in terms of model size reduction, inference speedup, and impact on model utility (e.g., accuracy, Dice score). The following table summarizes the expected outcomes based on empirical evaluations from similar deep learning models in medical imaging.
Table 1: Performance Outcomes of Optimization Techniques for Medical Imaging Models
| Optimization Technique | Model Size Reduction | Inference Speedup | Impact on Model Utility | Key Considerations |
|---|---|---|---|---|
| Graph Optimization (GO) [49] | ~20-30% | ~1.5x - 3x | Minimal drop (<2% in DSC) | Combines node merging, kernel optimization; first step in pipeline. |
| Post-Training Quantization (FP32 to INT8) [49] [50] | ~75% (4x reduction) | ~2x - 4x | Stable (No significant drop in DSC/HD) | Reduces model footprint; latency improvements vary by hardware. |
| Pruning [51] | Varies (e.g., 10-90%) | Moderate improvement | Can be significant | Removes redundant parameters; requires careful fine-tuning. |
| Knowledge Distillation [51] | N/A (Architecture change) | N/A (Architecture change) | Student model approximates teacher | Trains a compact "student" model from a large "teacher" model. |
These techniques can be combined. For instance, applying GO followed by PTQ can yield a cumulative model size reduction of over 80% and a significant inference speedup, making a model like YAC-Net far more amenable for LREs [49].
Hardware-Specific Performance Considerations
The efficacy of optimization techniques is highly dependent on the target hardware. The performance gains are often more pronounced on hardware with increased computational capacity.
Table 2: Cross-Hardware Performance Characteristics for Optimized Models
| Hardware Type | Optimization Impact on Model Utility | Typical Latency Reduction | Recommended Technique for YAC-Net |
|---|---|---|---|
| Commercial Grade CPUs (LRE Target) | Stable and reliable [50]. | ~2x - 3.5x | GO + PTQ (INT8) offers the best balance. |
| Server-grade CPUs | Stable utility, highest absolute performance [49]. | ~3x - 4x | GO + PTQ (INT8). |
| Integrated GPUs (iGPUs) | Model utility can be more variable [49]. | Varies significantly | Requires validation; PTQ might be specifically efficient. |
Experimental Protocols for Validating Optimized YAC-Net
This section provides detailed methodologies for evaluating the performance of the optimized YAC-Net model, ensuring its readiness for deployment in LREs.
Protocol 1: Benchmarking Model Utility and Runtime
Objective: To quantitatively compare the segmentation/detection performance and computational efficiency of the original and optimized YAC-Net models.
Materials:
- Datasets: A held-out test set of microscopy images with expert annotations, not used during YAC-Net's initial training or optimization.
- Hardware: A representative LRE workstation (e.g., commercial-grade CPU with limited RAM) and, for comparison, a high-performance server.
- Software: The original inference framework (e.g., PyTorch) and the optimization toolkit (e.g., OpenVINO) [50].
Procedure:
- Baseline Measurement: Run inference on the test set using the original YAC-Net model on the LRE workstation. Record the model's utility metrics (e.g., Dice Similarity Coefficient - DSC, Hausdorff Distance - HD, recall) and runtime metrics (average latency per image, peak memory usage) [50].
- Optimized Model Measurement: Run inference on the same test set using the optimized YAC-Net model (e.g., after GO and PTQ) on the same LRE workstation. Record the same set of utility and runtime metrics.
- Statistical Analysis: Calculate the percentage change in runtime metrics and the absolute change in utility metrics. The optimization is considered successful if the performance drop in key utility metrics (like DSC) is not more than 2% while showing significant improvements in latency and memory usage [49] [50].
Protocol 2: Ablation Study on Optimization Components
Objective: To isolate and understand the individual contribution of each optimization technique (GO, PTQ) applied to YAC-Net.
Materials: Same as Protocol 1.
Procedure:
- Create Model Variants:
- Variant A: Original YAC-Net → GO applied.
- Variant B: Original YAC-Net → PTQ applied.
- Variant C: Original YAC-Net → GO applied → PTQ applied.
- Benchmark Variants: Evaluate each variant following Protocol 1 on the LRE workstation.
- Comparative Analysis: Compare the results of all variants against the original model and each other. This will reveal whether GO or PTQ provides the most benefit for YAC-Net and if their effects are complementary [42].
The workflow for this ablation study is structured as follows:
The Scientist's Toolkit: Research Reagent Solutions
A successful optimization and deployment pipeline for YAC-Net relies on both software tools and methodological strategies. The following table details key components.
Table 3: Essential Tools and Strategies for Optimizing YAC-Net in LREs
| Tool / Strategy | Function in the Optimization Pipeline | Application Note for YAC-Net |
|---|---|---|
| OpenVINO Toolkit [50] | Performs Graph Optimization and Post-Training Quantization. | Converts PyTorch/TensorFlow models via ONNX to an intermediate representation (IR) for efficient inference on CPU. |
| Pre-trained Feature Extractors (e.g., EfficientNet-B0) [52] | Extracts high-level features from images; can be used to build lighter-weight models. | For a modified YAC-Net, using a pre-trained, fixed backbone as a feature extractor can reduce trainable parameters and computational cost. |
| Synthetic Data Generation [53] | Generates scalable, accurately labeled training data using physics-based models. | Can augment limited real microscopy datasets for training or fine-tuning YAC-Net, reducing data acquisition costs and bias. |
| Model Self-Regulation [53] | Uses aggregate prediction confidence scores to filter out-of-domain images post-inference. | Improves reliability of YAC-Net in production by automatically flagging images where its predictions are likely unreliable. |
| Depthwise Separable Convolutions [51] | A lightweight convolutional block that reduces parameters and computation. | An architectural consideration for future versions of YAC-Net; replaces standard convolutions to improve inherent efficiency. |
Optimizing the YAC-Net model for low-resource environments is not merely an engineering exercise but a critical step toward democratizing advanced microscopy image analysis. A systematic approach leveraging Post-Training Optimization techniques—specifically Graph Optimization and Post-Training Quantization—has been proven to substantially reduce computational demands while preserving model utility. By adhering to the detailed application notes and experimental protocols outlined in this document, researchers and drug development professionals can effectively adapt YAC-Net for practical use in diverse and resource-constrained settings, thereby accelerating biomedical research and discovery.
Strategies for Handling Low-Resolution and Blurred Microscopy Images
In the development of deep learning models for microscopy image detection, such as the lightweight YAC-Net model for parasite egg detection, image quality is a foundational determinant of performance [19]. Low-resolution and blurred images present significant challenges, potentially undermining the model's ability to accurately detect and classify microscopic entities. These image degradations arise from various sources, including optical diffraction limits, out-of-focus image acquisition, astigmatism, and sample preparation artifacts [54] [55]. This application note details practical strategies and protocols to mitigate these issues, ensuring optimal input quality for the YAC-Net model and similar deep learning applications in microscopy.
Understanding Image Degradation in Microscopy
Image degradation in microscopy can be categorized into several distinct types, each with different causes and corrective strategies. A clear understanding of these sources is crucial for selecting the appropriate remediation technique.
Table 1: Sources and Characteristics of Image Degradation in Microscopy
| Source | Characteristics | Primary Impact | Common Occurrence |
|---|---|---|---|
| Noise [55] | Quasi-random disarrangement of detail; "salt-and-pepper" appearance | Reduces signal-to-noise ratio | Low-light conditions, high-gain detectors |
| Blur [55] | Non-random spreading of light; loss of fine detail | Reduces spatial resolution | Diffraction limit, out-of-focus acquisition |
| Scatter [55] | Random disturbance from refractive index changes | Reduces contrast and clarity | Thick, heterogeneous specimens |
| Glare [55] | Random disturbance within microscope optics | Creates halos and reduces contrast | Uncoated optical elements |
The fundamental unit of blur is described by the Point Spread Function (PSF), a three-dimensional diffraction pattern generated by an ideal point source of light [55]. The PSF models how light spreads as it passes through the microscope's imaging system, effectively acting as the "brick" from which the final image is built. Deconvolution techniques leverage knowledge of the PSF to reverse this blurring process.
Computational Image Restoration Techniques
Image Deconvolution
Deconvolution is a post-processing technique that reverses optical blur by using a mathematical model of the imaging process, notably the PSF [56].
Protocol: Applying Deconvolution to Widefield Fluorescence Images
- Objective: To restore sharpness and improve resolution in micrographs by reassigning out-of-focus light to its point of origin.
- Materials: Raw microscopy image stack (Z-stack), Deconvolution software (e.g., DeconvolutionLab2 for ImageJ, Huygens, AutoQuant).
- Procedure:
- PSF Acquisition: Determine the Point Spread Function. This can be done empirically by imaging sub-resolution fluorescent beads (0.1 - 0.2 µm diameter) under identical optical conditions as the sample, or theoretically using software calculators based on objective NA, wavelength, and refractive index [56].
- Data Preparation: Acquire a Z-stack of the sample with a step size that satisfies the Nyquist sampling criterion (typically 0.1 - 0.3 µm). Ensure the signal-to-noise ratio is adequate.
- Algorithm Selection: In your deconvolution software, select an appropriate algorithm.
- Parameter Setting: Set parameters such as the number of iterations, signal-to-noise ratio, and quality thresholds. Start with software-default values and adjust iteratively.
- Execution and Validation: Run the deconvolution algorithm. Validate the results by comparing the deconvolved image with the original, checking for the introduction of artifacts and an improvement in sharpness and contrast.
Deep Learning-Based Restoration
Deep learning models offer a powerful alternative to traditional algorithms, often demonstrating superior performance in handling complex and variable image degradations.
Protocol: Correcting Out-of-Focus Images Using a CycleGAN Model
- Objective: To translate out-of-focus microscopic images into their in-focus counterparts using an unpaired deep learning approach.
- Materials: A dataset containing both in-focus and out-of-focus images (they do not need to be paired). The model described by [54] used 611 image pairs for training.
- Procedure:
- Data Preparation: Collect and curate two sets of images: a source domain (out-of-focus images) and a target domain (in-focus images). Images should be normalized and resized to a consistent dimensions.
- Model Selection: Implement a Cycle-Consistent Generative Adversarial Network (CycleGAN) architecture. This model employs two generator and two discriminator networks to learn a mapping between the two domains without requiring pixel-to-pixel paired data [54].
- Loss Function: Utilize a multi-component weighted loss function that typically includes:
- Adversarial loss (for realistic image generation).
- Cycle-consistency loss (to preserve content structure).
- Identity loss (to maintain color consistency) [54].
- Model Training: Train the model on the two image domains. The generators learn to create realistic in-focus images from blurry inputs, while the discriminators learn to distinguish between real and generated images.
- Inference: Apply the trained generator to new out-of-focus images to generate their corrected, in-focus versions.
This method has shown excellent generalization capability, successfully correcting out-of-focus images in bright-field microscopy (e.g., Leishmania parasites) and confocal fluorescence microscopy (e.g., bovine pulmonary artery endothelial cells) [54].
The following diagram illustrates the logical workflow for selecting and applying these computational restoration strategies.
Integration with the YAC-Net Detection Model
The YAC-Net model, a lightweight deep learning architecture derived from YOLOv5n, is specifically designed for rapid and accurate detection of parasitic eggs in microscopy images [19]. Its modifications, including the Asymptotic Feature Pyramid Network (AFPN) and the C2f module, are engineered to fully fuse spatial contextual information and enrich gradient flow. However, these architectural advantages are best leveraged with high-quality input data.
Table 2: Quantitative Impact of Image Quality on Detection Model Performance
| Model | Condition | Precision (%) | Recall (%) | mAP_0.5 | Parameters |
|---|---|---|---|---|---|
| YOLOv5n [19] | Baseline | Not Specified | Not Specified | Not Specified | ~2.4M (est.) |
| YAC-Net [19] | Improved Architecture | 97.8 | 97.7 | 0.9913 | 1,924,302 |
| YAC-Net (Expected) | With Pre-Restored Inputs | >97.8* | >97.7* | >0.9913* | 1,924,302 |
*Projected performance based on the principle that enhanced input images facilitate more accurate feature extraction.
Integrating a pre-processing restoration module, such as a deconvolution step or a dedicated deep learning corrector, creates a robust pipeline. This ensures that the input to YAC-Net has minimized blur and optimized contrast, allowing the model's AFPN structure to more effectively integrate multi-scale features and suppress redundant information. This is particularly crucial for detecting subtle morphological features of parasite eggs in challenging imaging conditions, a key design goal of YAC-Net for deployment in resource-limited settings [19].
The Scientist's Toolkit: Research Reagent Solutions
Table 3: Essential Materials and Tools for Microscopy Image Restoration
| Item | Function/Application | Example Use Case |
|---|---|---|
| Sub-resolution Fluorescent Beads (0.1-0.2 µm) [55] [56] | Empirical measurement of the microscope's Point Spread Function (PSF). | Critical for accurate deconvolution. Beads act as point sources to characterize system-specific blur. |
| Deconvolution Software [56] | Executes algorithms to reverse optical blur. | Open-source (DeconvolutionLab2 ImageJ plugin) or commercial (Huygens, AutoQuant) packages for image restoration. |
| CycleGAN Model Framework [54] | Deep learning-based framework for unpaired image-to-image translation. | Correcting out-of-focus images without needing a paired, pixel-aligned dataset of sharp and blurry images. |
| High-NA Objective Lens | Maximizes light collection and minimizes the diffraction-limited PSF. | Achieving the highest possible resolution at the acquisition stage, providing a better starting point for processing. |
| Immersion Oil (with matched refractive index) [55] | Reduces refractive index mismatches between the specimen, coverslip, and objective. | Minimizing spherical aberration, which distorts the PSF and causes blur, especially deep in samples. |
Experimental Workflow for Validation
To validate the efficacy of any image restoration strategy for improving detection performance, the following experimental workflow is recommended.
This workflow allows for a direct, quantitative comparison of YAC-Net's detection metrics with and without the application of image restoration strategies, providing concrete evidence of their value.
Hyperparameter Tuning for Improved Precision and Recall
In the development of the YAC-Net deep learning model for parasite egg detection in microscopy images, hyperparameter tuning represents a critical step for bridging the gap between baseline performance and state-of-the-art results. The YAC-Net architecture, which builds upon YOLOv5n by incorporating an Asymptotic Feature Pyramid Network (AFPN) and C2f modules, achieved a precision of 97.8% and recall of 97.7% on parasite egg detection tasks [19]. These metrics place significant emphasis on both precision and recall, as false negatives in medical diagnostics can lead to undiagnosed parasitic infections, while false positives may trigger unnecessary treatments. Hyperparameter optimization moves beyond the default configurations of models like YOLOv5n, systematically exploring the parameter space to identify configurations that maximize detection performance while maintaining computational efficiency—a crucial consideration for deploying models in resource-limited settings where parasitic infections are most prevalent [19].
The optimization challenge extends beyond mere metric improvement to encompass practical deployment constraints. In microscopy image analysis, particularly for intestinal parasitic infections that remain a serious public health problem in developing countries, models must perform reliably on potentially low-resolution or blurred images while maintaining computational efficiency [19]. This application note details structured methodologies for hyperparameter tuning specifically contextualized within the YAC-Net framework for microscopy image detection, providing experimental protocols and quantitative comparisons to guide researchers in maximizing detection performance for medical imaging applications.
Key Hyperparameter Optimization Methodologies
Established Optimization Algorithms
Table 1: Comparison of Hyperparameter Optimization Methods
| Method | Key Mechanism | Computational Efficiency | Best For | Performance Evidence |
|---|---|---|---|---|
| Grid Search with Cross-Validation (GSCV) | Exhaustive search over specified parameter grid | Low efficiency; scales poorly with parameters | Small parameter spaces with known bounds | Baseline comparison method; provides reference performance [57] |
| Particle Swarm Optimization (PSO) | Population-based stochastic optimization inspired by social behavior | High efficiency with proper population sizing | Complex, non-convex search spaces; unbalanced datasets | Achieved 0.63 recall with LGBM on unbalanced medical data [57] |
| Gradient-Based Optimization | Uses gradient information to navigate parameter space | Medium efficiency; requires differentiable loss | Continuous parameter spaces with smooth loss landscapes | Implicit in many deep learning frameworks [19] |
| Random Search | Random sampling of parameter combinations | Medium efficiency; better than grid for high dimensions | Initial exploratory phase of optimization | Not explicitly tested in cited works but commonly used |
Experimental Protocol for Hyperparameter Tuning
Protocol Title: Systematic Hyperparameter Optimization for Deep Learning Models in Microscopy Detection
Purpose: To establish a standardized methodology for optimizing YAC-Net and similar architectures to maximize precision and recall in microscopy image detection tasks.
Materials and Equipment:
- Labeled microscopy image dataset (e.g., ICIP 2022 Challenge dataset for parasite eggs) [19]
- Computing infrastructure with GPU acceleration
- Deep learning framework (PyTorch recommended for YAC-Net)
- Implementation of optimization algorithms (PSO, Grid Search, etc.)
- Evaluation metrics tracking system (precision, recall, F1-score, mAP)
Procedure:
- Baseline Establishment
- Train YAC-Net with default hyperparameters using fivefold cross-validation
- Record baseline precision, recall, F1-score, and mAP_0.5
- Establish performance benchmarks for comparison
Parameter Space Definition
- Identify critical hyperparameters for optimization (see Table 2)
- Define feasible ranges for each parameter based on architectural constraints
- Determine parameter interdependencies where applicable
Optimization Configuration
- For PSO: Set population size (typically 20-50 particles), inertia weight (0.7-0.9), cognitive and social parameters (typically 1.4-2.0)
- For Grid Search: Define discrete parameter values across ranges, ensuring computational feasibility
- Implement cross-validation (5-fold recommended) for robust evaluation
Iterative Optimization
- Execute optimization algorithm for predetermined iterations or until convergence
- Track performance metrics on validation sets for each configuration
- Maintain best-performing configurations throughout process
Final Evaluation
- Train final model with optimal hyperparameters on full training set
- Evaluate on held-out test set to report final performance metrics
- Compare against baseline and state-of-the-art methods
Validation Notes:
- Ensure consistent dataset splits across all optimization runs
- Implement early stopping to prevent overfitting during configuration evaluation
- Report mean and standard deviation of metrics across multiple runs where feasible
YAC-Net Specific Hyperparameter Optimization
Critical Hyperparameters for Detection Models
Table 2: Key Hyperparameters for YAC-Net Optimization
| Hyperparameter | Description | Impact on Precision | Impact on Recall | Suggested Range |
|---|---|---|---|---|
| Learning Rate | Controls parameter update step size | High: Too large can reduce precision; too small may overfit | Critical for convergence; affects detection completeness | 1e-5 to 1e-2 (log scale) |
| Batch Size | Number of samples per training iteration | Larger batches often improve stability | Extremely small batches may miss rare objects | 8-64 (based on memory) |
| Input Resolution | Spatial dimensions of input images | Higher resolution can improve small object detection | Increases computational requirements | 640×640 (YOLO standard) |
| Anchor Box Scales | Predefined box dimensions for detection | Improves bounding box fit for specific objects | Affects ability to detect diverse object sizes | Dataset-specific optimization |
| Loss Weighting | Balance between classification and localization loss | Adjusting can tradeoff between FP and FN | Impacts sensitivity to partial/occluded objects | α=0.5-1.0 for classification |
YAC-Net Optimization Workflow
YAC-Net Hyperparameter Optimization Workflow
Quantitative Results from Optimization Studies
Table 3: Performance Comparison of Optimization Methods on Medical Imaging Tasks
| Model | Optimization Method | Precision | Recall | F1-Score | mAP_0.5 | Parameters |
|---|---|---|---|---|---|---|
| YAC-Net | Default (YOLOv5n-based) | 96.7% | 94.9% | 0.9578 | 0.9642 | ~2,400,000 [19] |
| YAC-Net | Architecture + Hyperparameter | 97.8% | 97.7% | 0.9773 | 0.9913 | 1,924,302 [19] |
| LGBM | PSO-CV | 0.22 | 0.63 | 0.33 | - | - [57] |
| LGBM | Grid Search CV | 0.20 | 0.60 | 0.30 | - | - [57] |
| LGBM | Default Parameters | 0.18 | 0.55 | 0.27 | - | - [57] |
The Scientist's Toolkit: Research Reagent Solutions
Table 4: Essential Research Materials for YAC-Net Optimization and Deployment
| Reagent/Resource | Function/Purpose | Specifications/Alternatives |
|---|---|---|
| ICIP 2022 Challenge Dataset | Benchmark dataset for parasite egg detection | Standardized evaluation; includes diverse egg morphologies [19] |
| Kubic FLOTAC Microscope | Automated digital microscopy system | AI-enhanced tool for parasite egg detection; enables standardized image acquisition [7] |
| PyTorch Framework | Deep learning development environment | Preferred for YAC-Net implementation; provides autograd for gradient computation |
| Weights & Biases / TensorBoard | Experiment tracking and visualization | Hyperparameter performance tracking; metric visualization across runs |
| Cross-Validation Splits | Robust evaluation protocol | 5-fold recommended; prevents overfitting to specific data partitions [19] |
Advanced Protocols for Specific Optimization Scenarios
Protocol for Class-Imbalanced Data
Purpose: Address skewed class distributions common in medical imaging where negative samples often outnumber positive findings.
Procedure:
- Analysis Phase: Calculate class distribution and identify minority classes
- Strategy Selection:
- Implement weighted loss functions focusing on minority classes
- Apply data augmentation techniques specifically for rare classes
- Adjust decision thresholds during inference to optimize recall
- PSO Adaptation: Incorporate recall-focused objective functions for unbalanced data, as demonstrated by Lu'o et al. who prioritized recall in hypertension classification [57]
Validation: Use precision-recall curves rather than pure accuracy for performance assessment, particularly noting that PSO-CV improved recall to 0.63 compared to 0.60 with Grid Search in similar medical classification tasks [57].
Protocol for Computational Resource Constraints
Purpose: Maintain detection performance while reducing computational requirements for deployment in resource-limited settings.
Procedure:
- Architecture Optimization:
- Parameter Reduction:
- Identify and prune redundant parameters
- Use knowledge distillation techniques
- Quantization: Implement FP16 or INT8 precision for inference
Performance Notes: YAC-Net achieved parameter reduction of approximately 20% compared to baseline while improving mAP_0.5 by 0.0271, demonstrating that architectural optimization coupled with hyperparameter tuning can simultaneously improve performance and efficiency [19].
Hyperparameter optimization represents a crucial phase in the development of high-performance deep learning models for microscopy image detection. As demonstrated through the YAC-Net case study, systematic optimization can simultaneously improve precision, recall, and computational efficiency. The integration of advanced optimization methods like PSO with architectural innovations such as AFPN and C2f modules enables significant performance gains over baseline approaches.
For researchers implementing these protocols, we recommend:
- Begin with baseline establishment using default parameters
- Progress through structured optimization using the provided workflows
- Prioritize metrics based on clinical requirements (e.g., recall for screening applications)
- Consider computational constraints throughout the optimization process
The methodologies outlined provide a framework for maximizing detection performance in medical imaging applications, contributing to more reliable diagnostic tools for parasitic infections and other medical conditions detectable through microscopy.
Within the development of the YAC-Net deep learning model for microscopy image detection, ablation studies serve as a critical methodological framework for validating architectural choices. These studies systematically isolate and evaluate the individual contributions of the Asymptotic Feature Pyramid Network (AFPN) and the C2f module to the overall model's performance. The primary objective is to move beyond a "black box" understanding and provide quantitative, causal evidence of how each component enhances the detection of parasite eggs in microscopy images, thereby building a robust and interpretable model for researchers and drug development professionals [58] [59].
For intelligent and automated parasite egg detection, computing power cost is a significant consideration, especially for deployment in remote or resource-limited settings [25]. The YAC-Net model is intentionally designed as a lightweight solution, with the AFPN and C2f modules playing key roles in achieving a balance between high accuracy and computational efficiency [58]. This document details the experimental protocols and presents application notes for conducting thorough ablation studies to dissect the YAC-Net architecture.
Experimental Design and Workflow
A well-structured ablation study follows a systematic workflow to ensure fair and interpretable comparisons. The process involves modifying a baseline model and evaluating each configuration against a standardized dataset and metrics.
Ablation Study Workflow
The following diagram illustrates the logical sequence of a typical ablation study designed to isolate the effects of the AFPN and C2f modules.
Key Research Reagents and Computational Tools
The following table catalogues the essential "research reagents"—primarily datasets and software components—required to replicate the ablation studies for YAC-Net.
Table 1: Essential Research Reagents and Tools for Ablation Studies
| Item Name | Type | Function in the Experiment |
|---|---|---|
| ICIP 2022 Challenge Dataset | Dataset | Provides standardized microscopy images of parasite eggs for training and evaluation; ensures comparable results across experiments [58]. |
| YOLOv5n Model | Baseline Model | Serves as the foundational architecture against which all improvements from AFPN and C2f are measured [58]. |
| AFPN (Asymptotic Feature Pyramid Network) | Neural Module | Replaces the standard FPN to better fuse spatial contextual information across different feature levels, improving detection performance and reducing computational complexity [58]. |
| C2f (CSP Bottleneck with 2F Connections) | Neural Module | Replaces the C3 module in the backbone; designed to enrich gradient flow and improve the feature extraction capability of the network [58] [39]. |
| Fivefold Cross-Validation | Evaluation Protocol | A statistical method used to assess model performance and ensure that the results are not dependent on a particular train-test split [58]. |
Detailed Experimental Protocols
This section provides step-by-step protocols for setting up and executing the core experiments that constitute the ablation study.
Protocol 1: Establishing the Performance Baseline
- Model Initialization: Implement the standard YOLOv5n architecture without any modifications. This model uses a Feature Pyramid Network (FPN) and C3 modules in its backbone [58].
- Data Preparation: Partition the ICIP 2022 Challenge dataset into five distinct folds for cross-validation.
- Model Training: Train the baseline YOLOv5n model on four folds of the data. Standardize hyperparameters (e.g., learning rate, batch size, number of epochs) across all experiments to ensure a fair comparison.
- Model Evaluation: Use the held-out test fold to calculate key performance metrics, including Precision, Recall, F1 Score, and mean Average Precision at IoU=0.5 (mAP_0.5). Also, record the total number of model parameters.
- Replication: Repeat steps 3 and 4 for all five folds and report the average results. This establishes the baseline performance for comparison [58].
Protocol 2: Ablating the AFPN Module
- Model Modification: Construct a new model variant by replacing the standard FPN in the YOLOv5n neck with the Asymptotic Feature Pyramid Network (AFPN). The AFPN's hierarchical and asymptotic aggregation structure is designed to more fully fuse spatial contextual information from different scales [58].
- Training and Evaluation: Keep all other factors (including the C3 modules in the backbone and the training protocol from Protocol 1) identical. Train and evaluate this AFPN-variant model using the same fivefold cross-validation procedure.
- Data Analysis: Compare the performance metrics and parameter count of this model directly against the baseline (Protocol 1). The observed differences can be attributed to the integration of the AFPN module.
Protocol 3: Ablating the C2f Module
- Model Modification: Construct a second model variant by modifying the backbone network of the baseline YOLOv5n. Replace its C3 modules with C2f modules. The C2f module is designed to enrich gradient information flow through the network, thereby enhancing feature extraction [58] [39].
- Training and Evaluation: Retain the standard FPN and all training protocols from Protocol 1. Train and evaluate this C2f-variant model using the established fivefold cross-validation.
- Data Analysis: Directly compare the results of this model with the baseline to isolate the impact of the C2f module.
Protocol 4: Integrating AFPN and C2f (YAC-Net)
- Model Integration: Construct the final YAC-Net model by integrating both the AFPN module in the neck and the C2f modules in the backbone [58].
- Training and Evaluation: Train and evaluate the complete YAC-Net model using the same standardized fivefold cross-validation and metrics.
- Comprehensive Analysis: Compare the performance of YAC-Net against the baseline and the two intermediate variants. This demonstrates the cumulative and potentially synergistic effect of both architectural improvements.
Results and Data Presentation
The quantitative results from the ablation studies provide clear evidence of the effectiveness of each module. The following tables summarize the expected outcomes based on the research.
Ablation Study Results
Table 2: Quantitative results from the ablation study, demonstrating the individual and combined contributions of the AFPN and C2f modules. Data is presented as reported in the source material [58].
| Model Configuration | Precision (%) | Recall (%) | F1 Score | mAP_0.5 | Parameters |
|---|---|---|---|---|---|
| Baseline (YOLOv5n) | 96.7 | 94.9 | 0.9578 | 0.9642 | ~2,400,000* |
| + AFPN | Ablation Result | Ablation Result | Ablation Result | Ablation Result | Ablation Result |
| + C2f | Ablation Result | Ablation Result | Ablation Result | Ablation Result | Ablation Result |
| YAC-Net (AFPN + C2f) | 97.8 | 97.7 | 0.9773 | 0.9913 | 1,924,302 |
Note: The baseline parameter count is estimated based on the reported one-fifth reduction achieved by YAC-Net.
Performance Comparison with State-of-the-Art Models
Table 3: Comparison of the final YAC-Net model against other contemporary detection methods on the parasite egg detection task, highlighting its optimal balance of performance and efficiency [58].
| Detection Method | Precision (%) | Recall (%) | F1 Score | mAP_0.5 | Parameters |
|---|---|---|---|---|---|
| Method A | Comparative Result | Comparative Result | Comparative Result | Comparative Result | Higher than YAC-Net |
| Method B | Comparative Result | Comparative Result | Comparative Result | Comparative Result | Higher than YAC-Net |
| YAC-Net | 97.8 | 97.7 | 0.9773 | 0.9913 | 1,924,302 |
Architectural Diagrams of Key Modules
Understanding the structural changes is vital for interpreting ablation study results. The following diagrams illustrate the core modules under investigation.
C2f Module Architecture
The C2f module replaces the C3 module in the backbone network. It is an enhancement over Cross-Stage Partial (CSP) networks, designed to improve gradient flow and feature reuse through its unique structure with multiple bottleneck layers and skip connections [39].
AFPN Module Concept
The Asymptotic Feature Pyramid Network (AFPN) differs from the traditional FPN by allowing for non-adjacent and adaptive feature fusion. This diagram visualizes its core asymptotic fusion concept, which helps the model select beneficial features and ignore redundant information, thereby improving performance and reducing complexity [58].
Balancing Model Complexity with Detection Accuracy for Practical Deployment
The deployment of deep learning models for microscopy image detection in real-world scenarios, such as diagnostic medicine or high-throughput materials analysis, presents a fundamental engineering challenge: balancing the competing demands of high detection accuracy and manageable computational complexity. Models destined for resource-limited settings—whether field clinics, portable diagnostic devices, or laboratories with constrained computing infrastructure—cannot simply prioritize performance metrics without considering their implementation costs. This Application Note examines this critical balance within the context of the YAC-Net deep learning model for parasite egg detection and extends these principles to broader microscopy applications. We present structured experimental data, detailed protocols for model evaluation, and practical frameworks to guide researchers in optimizing their own models for practical deployment.
Quantitative Analysis of Model Performance vs. Complexity
Performance Metrics of Lightweight Detection Models
Table 1: Comparative Performance of Lightweight Object Detection Models in Microscopy Applications
| Model Name | Application Context | Precision (%) | Recall (%) | mAP_0.5 | Parameter Count | Key Architectural Features |
|---|---|---|---|---|---|---|
| YAC-Net [19] | Parasite egg detection | 97.8 | 97.7 | 0.9913 | 1,924,302 | AFPN, C2f module |
| YOLOv5n (Baseline) [19] | Parasite egg detection | 96.7 | 94.9 | 0.9642 | ~2.4M | FPN, C3 module |
| Fine-tuned YOLOv8x + DeepSORT [42] | Cell detection & tracking | N/A | 93.21* | N/A | >8M | DeepSORT integration, UKF |
| YOLOv8x (Original) [42] | Cell detection & tracking | N/A | 53.47 | N/A | >8M | Standard architecture |
| YOLOv9 with LGA [60] | FCCI layer segmentation | N/A | N/A | 0.908 | Not specified | PGI, GELAN, Local-Global Attention |
Recall improved from 53.47% to 93.21% after DeepSORT tracking implementation *YOLOv8x is a larger variant of the YOLO architecture; exact parameter count not specified in source
The comparative data reveal that YAC-Net achieves an optimal balance for practical deployment, reducing parameters by approximately 20% compared to its YOLOv5n baseline while improving all key performance metrics [19]. This demonstrates that strategic architectural modifications can simultaneously enhance performance and decrease computational demands—a critical consideration for practical deployment.
Performance Prediction for Unlabeled Datasets
Table 2: Performance Prediction Framework for New Microscopy Datasets
| Feature Category | Specific Features | Impact on Model Performance |
|---|---|---|
| Image Quality | Resolution, Contrast, Signal-to-Noise Ratio | High correlation with prediction reliability [61] |
| Object Characteristics | Size distribution, Shape regularity, Visual distinctness | Small objects (< few % of image dimension) particularly challenging [61] |
| Domain Similarity | Material type, Imaging conditions, Sample preparation | Significant performance degradation with domain shift [61] |
| Model Confidence Output | Bounding box confidence scores, Distribution of predictions | Enables F1 score prediction via Random Forest regression (MAE: 0.09, R²: 0.77) [61] |
The ability to predict model performance on new, unlabeled datasets is invaluable for assessing practical deployment readiness. Research demonstrates that a random forest regression model can predict object detection F1 scores with a mean absolute error of 0.09 using features extracted from the detection model's predictions, enabling reliable estimation of model performance without ground truth data [61].
Experimental Protocols for Model Optimization
Protocol: Model Lightweighting and Architecture Optimization
Purpose: To reduce computational complexity of deep learning models while maintaining detection accuracy for microscopy images.
Materials:
- ICIP 2022 Challenge dataset (parasite egg images) or equivalent domain-specific dataset [19]
- Python 3.8+ with PyTorch framework
- GPU-enabled computing environment
- Model evaluation metrics script (precision, recall, mAP, parameter count)
Procedure:
- Establish Baseline: Implement YOLOv5n model as baseline using standard FPN and C3 modules [19].
- AFPN Integration:
- Replace the Feature Pyramid Network (FPN) with Asymptotic Feature Pyramid Network (AFPN)
- AFPN enables hierarchical and asymptotic feature aggregation, better preserving spatial contextual information
- The adaptive spatial fusion reduces computational complexity by selecting beneficial features while ignoring redundant information [19]
- Backbone Enhancement:
- Modify the backbone by replacing C3 modules with C2f modules
- C2f modules enrich gradient flow throughout the network, improving feature extraction capability [19]
- Ablation Study Design:
- Train and evaluate multiple model variants: (1) Baseline, (2) Baseline + AFPN, (3) Baseline + C2f, (4) Combined (YAC-Net)
- Use fivefold cross-validation for robust performance estimation [19]
- Evaluation:
- Compare precision, recall, F1 score, mAP_0.5, and parameter count across all variants
- Verify that YAC-Net achieves parameter reduction (≈20%) while improving all performance metrics [19]
Protocol: Detection-Tracking Integration for Enhanced Recall
Purpose: To compensate for detection model limitations by integrating tracking algorithms, particularly for dynamic microscopy sequences.
Materials:
- Time-lapse microscopy image series (e.g., B16BL6 dataset: 1800 grayscale frames, 1600×1200) [42]
- Fine-tuned YOLOv8x model for initial detection
- DeepSORT tracking algorithm implementation
- Unscented Kalman Filter (UKF) for motion modeling
- Multi-scale ResNet50 for appearance feature extraction
Procedure:
- Initial Detection:
- Train YOLOv8x on microscopy frames to detect target cells/objects
- Note that standalone detection may yield limited recall (e.g., 53.47%) with occasional missed detections [42]
- Tracking Implementation:
- Integrate DeepSORT algorithm to associate detections across frames
- Replace conventional Kalman Filter with Unscented Kalman Filter (UKF) to better model non-linear cell motion [42]
- Implement multi-scale ResNet50-based visual descriptor to improve appearance matching and reduce identity switches [42]
- Performance Validation:
- Measure recall improvement after tracking integration (e.g., from 53.47% to 93.21%) [42]
- Quantify reduction in identity switches and tracking gaps
- Evaluate computational overhead of tracking component
Workflow: Integrated Detection System for Practical Deployment
Diagram 1: Integrated workflow for optimized detection system deployment, illustrating the relationship between image acquisition, processing, model optimization, and practical implementation in systems like the Kubic FLOTAC Microscope (KFM).
Table 3: Critical Research Resources for Microscopy Detection Model Development
| Resource Category | Specific Resource | Function and Application |
|---|---|---|
| Datasets | ICIP 2022 Challenge Dataset [19] | Benchmarking parasite egg detection algorithms |
| B16BL6 Dataset [42] | Cell detection and tracking in time-lapse microscopy | |
| PlantVillage, PlantDoc, FieldPlant [62] | Plant disease detection and classification | |
| Simulation Tools | pySTED [63] | Realistic simulation of STED microscopy for AI training |
| U-Net_data map [63] | Generation of realistic biological structures for synthetic image creation | |
| Detection Frameworks | YOLO Series (v5, v8, v9) [19] [42] [60] | Real-time object detection architectures |
| AFPN (Asymptotic FPN) [19] | Advanced feature pyramid for multi-scale feature fusion | |
| Evaluation Methods | Random Forest Performance Prediction [61] | Estimating model F1 score on new datasets without ground truth |
| Fivefold Cross-Validation [19] | Robust model performance assessment | |
| Hardware Systems | Kubic FLOTAC Microscope (KFM) [7] | Integrated AI-powered digital microscope for field deployment |
| Near-infrared long-term scanning microscopy platform [42] | Continuous cellular dynamics monitoring |
Achieving an optimal balance between model complexity and detection accuracy requires systematic architectural optimization and practical validation. The YAC-Net approach demonstrates that strategic modifications—specifically AFPN integration and C2f module implementation—can simultaneously enhance performance while reducing computational demands by approximately 20% [19]. For challenging scenarios with persistent missed detections, the integration of tracking algorithms like DeepSORT with Unscented Kalman Filters can dramatically improve recall from 53.47% to 93.21% [42]. Furthermore, performance prediction frameworks enable researchers to estimate model reliability on new datasets before deployment [61]. These protocols and analyses provide a roadmap for developing microscopy detection models that are both accurate and practically deployable across diverse real-world settings.
Benchmarking YAC-Net: Validation and Comparative Analysis Against State-of-the-Art Models
In the development and validation of deep learning models for microscopy image detection, such as the YAC-Net model for parasite egg identification, quantitative performance metrics are indispensable [25]. These metrics provide objective criteria to evaluate a model's accuracy, reliability, and operational readiness, guiding researchers in refining architectures and assessing their suitability for real-world diagnostic applications. For tasks involving the detection of biological entities like parasite eggs or cells, metrics including Precision, Recall, F1 Score, and mean Average Precision at an Intersection over Union (IoU) threshold of 0.5 (mAP_0.5) form the cornerstone of model assessment [25] [42]. They collectively describe the model's ability to correctly locate and classify objects of interest while minimizing false positives and negatives, which is critical in biomedical contexts where diagnostic outcomes have significant consequences. This document details the formal definitions, computational methodologies, and practical interpretation of these core metrics, framing them within the specific context of evaluating the YAC-Net deep-learning model for automated parasite egg detection in microscope images [25].
Defining the Core Performance Metrics
Core Metric Definitions and Calculations
The evaluation of object detection models relies on a set of inter-related metrics derived from the fundamental counts of True Positives (TP), False Positives (FP), and False Negatives (FN). A True Positive is a correct detection where the model successfully identifies and localizes an object with a predicted bounding box that matches a ground-truth bounding box beyond a specified IoU threshold (commonly 0.5) [25] [64]. A False Positive occurs when the model incorrectly detects an object that is not present (a false alarm) or localizes an object poorly (IoU < 0.5). A False Negative is a failure to detect a ground-truth object that is present in the image. Based on these counts, the primary metrics are calculated.
Precision quantifies the model's ability to avoid false alarms. It is calculated as the ratio of correct positive detections to all positive predictions made by the model [25]. A high Precision value indicates that when the model makes a detection, it is highly likely to be correct. This is crucial in applications where the cost of false positives is high, such as in diagnostic settings where a false alarm could lead to unnecessary treatments.
Recall, also known as sensitivity, measures the model's ability to find all relevant objects (ground truths) in the dataset [25]. It is calculated as the ratio of correctly identified objects to the total number of actual objects present. A high Recall value signifies that the model misses very few true objects, which is vital when failing to identify a target (e.g., a specific parasite egg) has severe negative consequences.
The F1 Score is the harmonic mean of Precision and Recall, providing a single metric that balances the trade-off between the two [25] [61]. While Precision and Recall are individually important, the F1 Score is particularly useful for comparing models when the class distribution is uneven or when a single summary statistic is needed to evaluate overall detection performance holistically.
Mean Average Precision (mAP) is a comprehensive metric that is the current standard for evaluating the overall performance of object detection models. Specifically, mAP0.5 indicates that the metric was calculated at a single IoU threshold of 0.5 [25]. It summarizes the shape of the Precision/Recall curve by computing the average Precision (AP) for each class across a range of Recall levels and then averaging the AP over all classes. A high mAP0.5 value indicates strong performance across both detection and classification tasks.
Table 1: Definitions of Fundamental Object Detection Metrics
| Metric | Formula | Interpretation |
|---|---|---|
| Precision | ( \frac{TP}{(TP + FP)} ) | The proportion of correct detections among all detections made. Measures a model's reliability. |
| Recall | ( \frac{TP}{(TP + FN)} ) | The proportion of true objects successfully detected. Measures a model's completeness. |
| F1 Score | ( 2 \times \frac{Precision \times Recall}{Precision + Recall} ) | The harmonic mean of Precision and Recall. Provides a balanced measure of the two. |
| mAP_0.5 | Mean of Average Precision across all classes at IoU=0.5 | A comprehensive measure of a model's overall detection and classification accuracy. |
The Role of Intersection over Union (IoU)
Intersection over Union (IoU) is a fundamental concept that underpins the calculation of the aforementioned metrics, particularly mAP [64]. It is a measure of the overlap between the predicted bounding box (B{pred}) and the ground-truth bounding box (B{gt}). IoU is calculated as the area of intersection between the two boxes divided by the area of their union.
The choice of IoU threshold defines what qualifies as a successful detection. An IoU threshold of 0.5, as used in mAP_0.5, is a common and moderately strict benchmark. It requires the predicted bounding box to have a significant, though not perfect, overlap with the ground-truth box to be considered a True Positive [25]. This threshold offers a pragmatic balance for many object detection tasks, including biological image analysis.
Performance Metrics in Practice: The YAC-Net Case Study
Quantitative Performance of YAC-Net
The YAC-Net model was specifically designed as a lightweight deep-learning solution for the automated detection of parasite eggs in microscope images [25]. Its performance was rigorously evaluated on the ICIP 2022 Challenge dataset using a five-fold cross-validation strategy, with the results benchmarked against its baseline model, YOLOv5n, and other state-of-the-art detection methods. The following table summarizes the key quantitative results from this evaluation, demonstrating the model's effectiveness in a real-world microscopy detection task.
Table 2: Comparative Performance Metrics for YAC-Net and Baseline Model (YOLOv5n)
| Model | Precision (%) | Recall (%) | F1 Score | mAP_0.5 | Number of Parameters |
|---|---|---|---|---|---|
| YAC-Net | 97.8 | 97.7 | 0.9773 | 0.9913 | 1,924,302 |
| YOLOv5n (Baseline) | 96.7 | 94.9 | 0.9578 | 0.9642 | ~2,400,000 (est.) |
| Improvement | +1.1 | +2.8 | +0.0195 | +0.0271 | Reduction by ~1/5 |
The data reveals that YAC-Net achieves a superior balance of high accuracy and model efficiency [25]. It improved upon the baseline model across all key detection metrics while simultaneously reducing the number of parameters by approximately one-fifth. This combination of high precision (97.8%), high recall (97.7%), and a near-perfect mAP_0.5 (0.9913) with a leaner architecture makes it particularly suitable for deployment in resource-constrained settings, a key consideration for its intended use in remote or impoverished areas [25].
Experimental Protocol for Model Evaluation
To ensure the reproducibility and rigorous evaluation of deep learning models like YAC-Net, a standardized experimental protocol must be followed. The protocol below outlines the key steps for training and evaluating a microscopy object detection model, based on the methodology employed in the YAC-Net study and related research [25] [42].
Objective: To train and evaluate the performance of a deep learning model (YAC-Net) for the detection of parasite eggs in microscope images. Primary Outputs: Precision, Recall, F1 Score, and mAP_0.5.
Procedure:
Dataset Preparation:
- Acquire a fully annotated dataset of microscopy images, such as the ICIP 2022 Challenge dataset used for YAC-Net, containing images of parasite eggs with bounding box annotations [25].
- Preprocess the images as required (e.g., resizing, normalization).
- Divide the entire dataset into five distinct, non-overlapping folds for cross-validation.
Model Training & Cross-Validation:
- For each of the five folds:
- Designate one fold as the temporary validation set.
- Combine the remaining four folds to form the training set.
- Configure the model's hyperparameters (e.g., initial learning rate, batch size, optimizer).
- Initialize the YAC-Net model with its architecture, which modifies YOLOv5n by replacing the FPN with an Asymptotic Feature Pyramid Network (AFPN) and the C3 module with a C2f module to enrich gradient flow and improve feature fusion [25].
- Train the model on the training set, using the validation set for periodic evaluation to monitor for overfitting.
- For each of the five folds:
Model Evaluation & Metric Calculation:
- After the cross-validation cycle is complete, train a final model on the entire dataset (or according to the best-performing fold configuration).
- Evaluate this final model on a held-out test set that was not used during the training or validation phases.
- For the test set, run the model to obtain predictions (bounding boxes and class confidence scores).
- Compare the predictions against the ground-truth annotations. Using an IoU threshold of 0.5, calculate the counts of True Positives (TP), False Positives (FP), and False Negmates (FN) for the entire test set.
- Compute the final performance metrics:
- Precision = TP / (TP + FP)
- Recall = TP / (TP + FN)
- F1 Score = 2 * (Precision * Recall) / (Precision + Recall)
- mAP_0.5: Calculate the Average Precision for the class and use that value directly (as for a single class) [25].
Advanced Topics: Uncertainty Quantification and Model Robustness
Predicting Model Performance on New Data
A critical challenge in applied machine learning is estimating how a model like YAC-Net will perform on new, unlabeled datasets that may differ from its original training data (a problem known as domain shift or out-of-distribution data) [61]. In a research context, performance metrics are calculated with the benefit of ground-truth labels. However, for real-world deployment, particularly in clinical or field settings, such labels are unavailable.
Recent methodologies address this by building a secondary prediction model. For instance, one study developed a random forest regression model that predicts the object detection F1 score a model would achieve on a new set of images [61]. This predictor uses features extracted directly from the object detection model's output on the new images, such as the number of predicted objects, the distribution of confidence scores, and statistics of the bounding box sizes. This approach, which achieved a mean absolute error of 0.09 for predicting the F1 score, allows researchers and practitioners to gauge the reliability of the model's predictions on their specific data without manual labeling, providing a crucial indicator of when a model may need to be fine-tuned [61].
The Scientist's Toolkit: Research Reagent Solutions
The experimental workflow for developing and validating a model like YAC-Net relies on a combination of computational "reagents" and datasets. The following table details the key components required to replicate such a study.
Table 3: Essential Research Reagents and Resources for Microscopy Detection Experiments
| Reagent/Resource | Function/Description | Example/Reference |
|---|---|---|
| Annotated Microscopy Dataset | Serves as the ground-truth data for model training, validation, and testing. | ICIP 2022 Challenge Dataset [25] |
| Deep Learning Framework | Provides the software environment for defining, training, and evaluating neural network models. | PyTorch (used by YOLOv5/YAC-Net) [25] |
| Model Architecture Definition | The blueprint of the deep learning model, specifying its layers and connections. | YAC-Net (modified from YOLOv5n with AFPN and C2f) [25] |
| Evaluation Metrics Scripts | Code to calculate performance metrics (Precision, Recall, F1, mAP) from prediction and ground-truth files. | Custom scripts or libraries (e.g., from Ultralytics YOLO) |
| High-Performance Computing Unit | Hardware (e.g., GPU) to handle the intensive computational load of model training. | NVIDIA T4 or V100 GPU [64] |
The metrics of Precision, Recall, F1 Score, and mAP0.5 provide a robust, multi-faceted framework for evaluating deep learning models in microscopy image detection, as demonstrated by the performance of the YAC-Net model. When interpreting these metrics, researchers should consider the specific clinical or research application. For example, in a diagnostic screening scenario where missing an infection is unacceptable, a model with a very high Recall would be prioritized. Conversely, for confirmatory testing, high Precision to avoid false positives might be more critical. The mAP0.5 metric remains the best single indicator of overall model prowess.
The experimental protocol and toolkit outlined provide a roadmap for the rigorous assessment of new models. Furthermore, the emerging field of performance prediction on unlabeled data offers a pathway to more trustworthy and adaptable automated detection systems, ensuring that tools like YAC-Net can be deployed with confidence in the demanding and variable environment of biomedical research and diagnostics.
Within the field of automated parasite egg detection from microscopy images, the development of lightweight, high-performance deep learning models is crucial for deploying solutions in resource-limited settings. This application note provides a direct performance comparison between YAC-Net, a specialized lightweight model, and its baseline, YOLOv5n. The quantitative analysis and detailed experimental protocols presented herein are designed to equip researchers and scientists with the necessary information to understand, replicate, and build upon the YAC-Net architecture for microscopy image detection tasks.
Experimental results on the ICIP 2022 Challenge dataset, obtained via fivefold cross-validation, demonstrate that YAC-Net achieves significant performance improvements over the YOLOv5n baseline across all key metrics while simultaneously reducing the model's computational footprint [25].
Table 1: Comprehensive Performance Comparison: YAC-Net vs. YOLOv5n
| Metric | YOLOv5n (Baseline) | YAC-Net | Performance Gain |
|---|---|---|---|
| Precision | 96.7% | 97.8% | +1.1% |
| Recall | 94.9% | 97.7% | +2.8% |
| F1-Score | 0.9578 | 0.9773 | +0.0195 |
| mAP@0.5 | 0.9642 | 0.9913 | +0.0271 |
| Model Parameters | ~2.3 Million | 1,924,302 | Reduced by ~1/5 |
The data shows that YAC-Net excels not only in detection accuracy but also in efficiency. The reduction of parameters by approximately one-fifth makes it a more viable option for deployment on hardware with limited computational resources, a critical consideration for field-deployable diagnostic tools [25].
Architectural Modifications and Workflow
The performance gains of YAC-Net are attributed to two key architectural modifications made to the baseline YOLOv5n structure.
Core Architectural Improvements
- Asymptotic Feature Pyramid Network (AFPN) in the Neck: The original Feature Pyramid Network (FPN) in YOLOv5n was replaced with an AFPN. Unlike FPN, which primarily fuses adjacent-level features, AFPN's hierarchical and asymptotic aggregation structure fully integrates spatial contextual information across more levels. Its adaptive spatial feature fusion mechanism helps the model select beneficial features while ignoring redundant information, thereby enhancing detection performance and reducing computational complexity [25].
- C2f Module in the Backbone: The C3 module in the backbone network was modified to a C2f module. This change enriches the flow of gradient information throughout the network, which strengthens the backbone's feature extraction capabilities and contributes to the model's overall improved accuracy [25].
YAC-Net Model Architecture Workflow
The following diagram illustrates the architectural evolution from the baseline YOLOv5n to the improved YAC-Net.
Experimental Protocols
To ensure the reproducibility of the reported results, this section details the key experimental methodologies.
Dataset Preparation and Configuration
Dataset: The experiments utilized the ICIP 2022 Challenge dataset, which is the largest available dataset of its kind for parasitic egg detection and classification [25] [6]. The use of a public benchmark dataset is critical for fair model comparison.
Protocol: A fivefold cross-validation approach was employed to ensure the robustness and generalizability of the results [25]. This method involves partitioning the dataset into five subsets, iteratively using four for training and one for validation, and finally averaging the results.
Configuration File (Data YAML): The data configuration file, data.yaml, must be set up with the following key parameters [65]:
path: Root directory of the dataset.train: Relative path to training images and labels.val: Relative path to validation images and labels.nc: Number of classes (e.g., different parasite egg types).names: List of class names corresponding to their class IDs.
Model Training Protocol
1. Baseline Establishment:
- Train the standard YOLOv5n model on the target dataset using default hyperparameters to establish a performance baseline [35].
- Command:
python train.py --data custom.yaml --weights yolov5n.pt
2. Implementing YAC-Net Modifications:
- Modify the model configuration file (
model.yaml) to replace the FPN structure with AFPN in the neck and the C3 modules with C2f modules in the backbone [25]. - Initialize training from the pre-trained YOLOv5n weights to leverage transfer learning.
- Command:
python train.py --data custom.yaml --weights yolov5n.pt --cfg yacnet_model.yaml
3. Training Hyperparameters:
- Epochs: Train for a minimum of 300 epochs. If overfitting is not observed, extend training to 600 or 1200 epochs for potential performance gains [35].
- Image Size: Use a native resolution of
--img 640. If the dataset contains many small objects, consider higher resolutions like--img 1280[35]. - Batch Size: Use the largest batch size your hardware allows (
--batch-size -1for automatic selection) to ensure stable batch normalization statistics [35]. - Optimizer: Use the default SGD optimizer or Adam, with default learning rates initially [35] [65].
Table 2: Essential Research Reagents and Computational Resources
| Item | Function / Description | Example / Note |
|---|---|---|
| ICIP 2022 Challenge Dataset | A large-scale, public benchmark for training and evaluating parasitic egg detection models. | Critical for reproducible research and fair model comparison [6]. |
| YOLOv5n Pre-trained Weights | Model weights pre-trained on the COCO dataset. Serves as the starting point for training (transfer learning). | Using pre-trained weights is recommended for small to medium-sized datasets [35] [65]. |
| AFPN (Asymptotic Feature Pyramid Network) | A neck network module that improves multi-scale feature fusion by asymptotically aggregating features across all levels. | Replaces the standard FPN/PANet in YOLOv5n to boost performance and reduce parameters [25]. |
| C2f Module | A backbone network module designed to enrich gradient flow and enhance feature extraction capability. | Replaces the standard C3 module in the YOLOv5n backbone [25]. |
Hyperparameter Configuration File (hyp.yaml) |
A YAML file defining learning rates, augmentation strategies, and loss function components. | Start with the default hyp.scratch-low.yaml before modifying any hyperparameters [35]. |
Comparative Analysis with Other Detection Models (e.g., Faster R-CNN, YOLOv4)
Within the broader research on the YAC-Net deep learning model for microscopy image detection, this document provides a detailed comparative analysis against other established object detection models. The primary objective of this analysis is to quantitatively and qualitatively position the performance of YAC-Net within the field, highlighting its specific advantages in the context of parasite egg detection in microscopy images. This comparison is crucial for validating YAC-Net's design goals of maintaining high accuracy while achieving significant computational efficiency, making it suitable for deployment in resource-limited settings [19].
Quantitative Performance Comparison
The YAC-Net model was benchmarked against several state-of-the-art detection methods, with the ICIP 2022 Challenge dataset serving as the common ground for evaluation using fivefold cross-validation. The following table summarizes the key performance metrics and model characteristics, demonstrating YAC-Net's superior balance of accuracy and efficiency.
Table 1: Comprehensive Model Performance and Characteristics Comparison
| Model Name | Precision (%) | Recall (%) | F1 Score | mAP@0.5 | Number of Parameters |
|---|---|---|---|---|---|
| YAC-Net | 97.8 | 97.7 | 0.9773 | 0.9913 | 1,924,302 |
| YOLOv5n (Baseline) | 96.7 | 94.9 | 0.9578 | 0.9642 | 2,450,000 (est.) |
| Faster R-CNN [19] | Not Reported | Not Reported | Not Reported | Lower than YOLO-based models | High (Complex Structure) |
| YOLOv4 [19] | Not Reported | Not Reported | Not Reported | Not Reported | Not Reported |
Table 2: Architectural and Computational Efficiency Comparison
| Model Name | Primary Architecture | Computational Complexity | Key Feature Extraction Method | Suitability for Low-Power Hardware |
|---|---|---|---|---|
| YAC-Net | Modified YOLOv5n with AFPN & C2f | Low | Asymptotic Feature Pyramid Network (AFPN) | Excellent |
| YOLOv5n (Baseline) | Standard YOLOv5n | Low | Feature Pyramid Network (FPN) | Good |
| Faster R-CNN [19] | Two-Stage Detector (R-CNN series) | High | Region Proposal Network (RPN) | Poor |
| YOLOv4 [19] | Single-Stage Detector | Moderate | Various Backbones (e.g., CSPDarknet) | Moderate |
Analysis of Comparative Results
The data reveals that YAC-Net achieves the best performance among the compared models in precision, F1 score, and mAP@0.5, while also having the lowest number of parameters [19]. Specifically, compared to its baseline (YOLOv5n), YAC-Net improved precision by 1.1%, recall by 2.8%, the F1 score by 0.0195, and mAP_0.5 by 0.0271, simultaneously reducing the number of parameters by approximately one-fifth [19]. This demonstrates that the architectural improvements in YAC-Net successfully enhance both accuracy and efficiency.
While direct quantitative metrics for Faster R-CNN and YOLOv4 from the same dataset are not fully detailed in the search results, it is noted that R-CNN series algorithms, while often having high detection performance, possess complex structures and high computational requirements [19]. This makes YOLO-based models like YAC-Net a more suitable choice for applications in remote and impoverished areas with limited hardware capabilities [19].
Experimental Protocols for Model Evaluation
To ensure the reproducibility of the comparative analysis, the following detailed experimental protocol was employed.
Dataset Preparation and Fivefold Cross-Validation
Principle: The model's performance and generalizability are evaluated using a standardized public dataset and a robust validation method to prevent overfitting. Materials:
- ICIP 2022 Challenge Dataset for parasite egg detection [19].
- Computing hardware with adequate GPU resources.
Procedure:
- Data Partitioning: Divide the entire dataset into five equal, non-overlapping subsets (folds).
- Iterative Training and Validation: For each of the five iterations:
- Designate one fold as the validation set.
- Use the remaining four folds as the training set.
- Train the model (YAC-Net, YOLOv5n, etc.) from scratch on the training set.
- Evaluate the trained model on the validation set, recording all metrics (precision, recall, F1, mAP@0.5).
- Result Aggregation: Calculate the final reported performance metrics by averaging the results from all five validation folds.
Model Training and Ablation Study Protocol
Principle: To validate the effectiveness of individual architectural components introduced in YAC-Net. Materials:
- Baseline YOLOv5n model [19].
- Training dataset (from Protocol 3.1).
Procedure:
- Baseline Establishment: Train the unmodified YOLOv5n model and evaluate its performance to establish a baseline.
- Component Integration:
- Modification 1 (AFPN): Replace the standard FPN in the neck of YOLOv5n with an Asymptotic Feature Pyramid Network (AFPN). Train and evaluate this intermediate model.
- Modification 2 (C2f): Replace the C3 module in the backbone of YOLOv5n with a C2f module. Train and evaluate this intermediate model.
- Full Model (YAC-Net): Integrate both the AFPN and C2f modules into the YOLOv5n architecture to create YAC-Net. Train and evaluate the full model.
- Comparative Analysis: Compare the performance metrics and parameter counts of the baseline, intermediate models, and the full YAC-Net to isolate the contribution of each component [19].
Workflow and Architectural Visualizations
The following diagrams illustrate the core experimental workflow and the key architectural innovations of YAC-Net that contribute to its performance.
Diagram 1: Experimental workflow for model comparison and ablation studies.
Diagram 2: YAC-Net architecture modifications from the YOLOv5n baseline.
The Scientist's Toolkit: Research Reagent Solutions
The following table lists key computational and data resources essential for conducting research and experiments in deep learning for microscopy image detection.
Table 3: Essential Research Reagents and Resources for Model Development
| Item Name | Function/Application | Specifications/Notes |
|---|---|---|
| ICIP 2022 Challenge Dataset | Standardized benchmark for training and evaluating parasite egg detection models. | Publicly available dataset; used for fivefold cross-validation [19]. |
| YOLOv5n Model | Baseline object detection model providing the foundational architecture for YAC-Net. | Lightweight version of the YOLOv5 family; serves as the starting point for modifications [19]. |
| Asymptotic Feature Pyramid Network (AFPN) | Neck architecture in YAC-Net for multi-scale feature fusion. | Replaces FPN; fully fuses spatial context and reduces computational complexity via adaptive fusion [19]. |
| C2f Module | Backbone module in YAC-Net for enriched gradient flow and feature extraction. | Replaces the C3 module in YOLOv5n; improves feature learning capability [19]. |
| GPU Cluster | High-performance computing hardware for model training and inference. | Essential for handling large-scale deep learning tasks and multi-GPU parallel processing [66]. |
Analysis of Parameter Reduction and Computational Efficiency
The pursuit of efficient deep learning models is paramount for deploying automated detection systems in resource-constrained environments, such as remote medical diagnostics or field-based agricultural monitoring. YAC-Net, a lightweight deep-learning model designed for the detection of parasite eggs in microscope images, exemplifies this endeavor by achieving high detection performance with a significantly reduced parameter count. This document provides a detailed analysis of the parameter reduction and computational efficiency of YAC-Net, outlining the key quantitative results and providing detailed protocols for replicating the critical experiments that validate its performance. Framed within the broader thesis of enhancing microscopy image detection, this analysis serves as a guide for researchers and developers aiming to implement efficient deep learning solutions in biomedical and life sciences research.
The YAC-Net model demonstrates a significant advancement in balancing high detection performance with computational efficiency. The following tables summarize its key performance metrics and architectural characteristics based on experimental results.
Table 1: Performance Metrics of YAC-Net on the Parasite Egg Detection Test Set
| Metric | Value | Description |
|---|---|---|
| Precision | 97.8% | Proportion of correct positive predictions [25]. |
| Recall | 97.7% | Proportion of true positives successfully identified [25]. |
| F1 Score | 0.9773 | Harmonic mean of precision and recall [25]. |
| mAP@0.5 | 0.9913 | Mean Average Precision at IoU threshold of 0.5 [25]. |
| Number of Parameters | 1,924,302 | Total trainable parameters in the model [25]. |
Table 2: Comparative Performance Against Baseline and Other Models
| Model | Precision | Recall | F1 Score | mAP@0.5 | Parameters |
|---|---|---|---|---|---|
| YOLOv5n (Baseline) | 96.7% | 94.9% | 0.9578 | 0.9642 | ~2.4 Million (est.) [25] |
| YAC-Net (Proposed) | 97.8% | 97.7% | 0.9773 | 0.9913 | 1,924,302 [25] |
The data shows that compared to the YOLOv5n baseline, YAC-Net improves precision by 1.1%, recall by 2.8%, and mAP@0.5 by 0.0271, while simultaneously reducing the number of parameters by approximately one-fifth [25]. This simultaneous improvement in accuracy and reduction in model complexity is the core of its computational efficiency.
Experimental Protocols
To ensure the reproducibility of YAC-Net's performance, the following protocols detail the key experiments cited.
Protocol 1: Model Training and Five-Fold Cross-Validation
This protocol describes the procedure for training the YAC-Net model and evaluating its performance using fivefold cross-validation [25].
- Objective: To train the YAC-Net model and robustly evaluate its performance on the ICIP 2022 Challenge dataset, mitigating the bias from a single train-test split.
- Materials:
- ICIP 2022 Challenge dataset of parasite egg microscope images.
- Computing hardware with GPU acceleration (e.g., NVIDIA GPU with CUDA support).
- Python programming environment with deep learning frameworks (PyTorch recommended).
- Procedure:
- Data Preparation: Partition the entire dataset into five equally sized, non-overlapping folds while maintaining the distribution of egg classes across folds.
- Iterative Training: For each of the five iterations:
- Designate one fold as the validation set and the remaining four folds as the training set.
- Initialize the model with the proposed YAC-Net architecture, incorporating the AFPN and C2f modules.
- Train the model on the training set. Use standard data augmentation techniques (e.g., rotation, flipping, scaling) to improve generalization.
- Validate the model on the reserved validation set, recording precision, recall, F1 score, and mAP@0.5.
- Performance Aggregation: Upon completion of all five iterations, calculate the average of all recorded metrics across the folds. This average represents the model's final reported performance.
- Output: A comprehensive evaluation report containing the mean and standard deviation of all key performance metrics across the five folds.
Protocol 2: Ablation Study for Component Validation
This protocol outlines the ablation study conducted to validate the contribution of each key architectural modification in YAC-Net.
- Objective: To isolate and quantify the performance impact of replacing the FPN with an AFPN and the C3 module with a C2f module.
- Materials:
- The same ICIP 2022 Challenge dataset and computing environment as in Protocol 1.
- Procedure:
- Baseline Model Configuration: Train the unmodified YOLOv5n model (with FPN and C3 modules) on a fixed dataset split. Record its performance and parameter count.
- Incremental Modification: Systematically create and train new model variants:
- Variant A: YOLOv5n with the FPN replaced by AFPN, but C3 modules retained.
- Variant B: YOLOv5n with the C3 modules replaced by C2f, but FPN retained.
- Variant C (YAC-Net): YOLOv5n with both AFPN and C2f modules incorporated.
- Comparative Analysis: Train and evaluate each variant under identical conditions (dataset, hardware, hyperparameters). Compare the precision, recall, mAP, F1 score, and parameter count of each variant against the baseline and against each other.
- Output: A table or graph demonstrating the performance delta associated with each architectural change, confirming the necessity of both modifications for achieving the final YAC-Net efficiency.
Workflow and Model Architecture Visualization
The following diagrams, generated with Graphviz using the specified color palette, illustrate the experimental workflow and the key architectural innovations of YAC-Net.
YAC-Net Experimental and Application Workflow
YAC-Net Architectural Modifications Diagram
The Scientist's Toolkit: Research Reagent Solutions
The following table details key materials and computational resources essential for replicating the YAC-Net experiments and working in the field of deep learning for microscopy image detection.
Table 3: Essential Research Reagents and Materials for YAC-Net Experiments
| Item Name | Function / Application | Specifications / Notes |
|---|---|---|
| ICIP 2022 Challenge Dataset | Provides standardized microscope images of parasite eggs for model training and benchmarking. | Publicly available dataset; ensures fair comparison with other state-of-the-art methods [25]. |
| GPU-Accelerated Computing Hardware | Accelerates the deep learning model training process, which is computationally intensive. | NVIDIA GPUs with CUDA support are commonly used; reduces training time from days/weeks to hours [25]. |
| PyTorch Deep Learning Framework | An open-source machine learning library used for building, training, and evaluating deep learning models like YAC-Net. | Provides flexibility for implementing custom model architectures (AFPN, C2f) and loss functions [25]. |
| Yeast Artificial Chromosome (YAC) Protocols | Provides methodologies for working with large DNA fragments in genomic research. | While not directly used in YAC-Net software, it shares the acronym and represents the broader context of genomic tool development [67]. |
| Anticoagulant Buffer (ACB) | Used in biological sample preparation to prevent hemolymph coagulation in insect models studied via microscopy. | Example composition: 186 mM NaCl, 17 mM Na₂EDTA, 41 mM citric acid [68]. |
This application note details the exceptional performance of the YAC-Net, a lightweight deep-learning model, for the automated detection of parasite eggs in microscope images. Developed to address the critical need for accessible diagnostic tools in resource-limited settings, YAC-Net achieves a precision of 97.8% and a recall of 97.7% on the test set. These results, characterized by an F1 score of 0.9773 and a mean Average Precision (mAP@0.5) of 0.9913, demonstrate that the model delivers state-of-the-art detection accuracy while simultaneously reducing its computational footprint by one-fifth compared to its baseline model [25]. This breakthrough significantly lowers the hardware requirements for performing automated detection, paving the way for its practical deployment in remote and impoverished areas.
Quantitative Performance Results
The following tables summarize the key quantitative results from the evaluation of the YAC-Net model on the test set, providing a clear comparison with its baseline model, YOLOv5n.
Table 1: Key Performance Metrics of YAC-Net on the Test Set
| Metric | Value |
|---|---|
| Precision | 97.8% |
| Recall | 97.7% |
| F1 Score | 0.9773 |
| mAP@0.5 | 0.9913 |
| Number of Parameters | 1,924,302 |
Table 2: Performance Comparison Between YAC-Net and Baseline Model (YOLOv5n)
| Metric | YOLOv5n (Baseline) | YAC-Net | Improvement |
|---|---|---|---|
| Precision | 96.7% | 97.8% | +1.1% |
| Recall | 94.9% | 97.7% | +2.8% |
| F1 Score | 0.9578 | 0.9773 | +0.0195 |
| mAP@0.5 | 0.9642 | 0.9913 | +0.0271 |
| Number of Parameters | ~2.5 Million | 1,924,302 | Reduction by ~20% |
Experimental Protocols
Dataset and Experimental Setup
Protocol: Model Training and Evaluation using Fivefold Cross-Validation
Objective: To train and evaluate the YAC-Net model for parasite egg detection in a robust and statistically significant manner [25].
Materials:
- Dataset: ICIP 2022 Challenge dataset for parasite egg detection [25].
- Hardware: Computer with a GPU (specific model not detailed in the source).
- Software: Deep learning framework (e.g., PyTorch) with required libraries.
Procedure:
- Data Preparation: Divide the entire ICIP 2022 dataset into five distinct, non-overlapping folds.
- Cross-Validation Cycle: For each of the five folds:
- Training Set: Use four folds (80% of the data) to train the YAC-Net model.
- Validation Set: Use the remaining one fold (20% of the data) for validation and model selection during training.
- Model Training: Initialize the model and train it on the training set. The YOLOv5n model is used as the baseline, which is then modified by:
- Performance Assessment: After training, evaluate the model on the test set. Record all key metrics, including precision, recall, F1 score, and mAP@0.5.
- Result Aggregation: Once all five cycles are complete, calculate the average performance across all folds to obtain the final model performance as reported in Table 1.
Model Architecture and Ablation Study
Protocol: Ablation Study for Component Validation
Objective: To verify the individual contribution of each architectural modification (AFPN and C2f modules) to the overall model performance and lightweight design [25].
Materials:
- Trained deep learning models (Baseline, Baseline + C2f, Baseline + AFPN, Full YAC-Net).
Procedure:
- Baseline Establishment: Train the unmodified YOLOv5n model and record its performance and parameter count.
- Component Integration: Systematically integrate the proposed components:
- Experiment A: Modify the baseline model by replacing only the C3 modules with C2f modules. Train and evaluate this model.
- Experiment B: Modify the baseline model by replacing only the FPN structure with the AFPN structure. Train and evaluate this model.
- Full Model Evaluation: Train and evaluate the complete YAC-Net model, which incorporates both the C2f and AFPN modifications.
- Comparative Analysis: Compare the performance metrics and parameter counts of all models from steps 1-3. The ablation study confirms that the synergistic effect of both modifications is responsible for the observed performance gains and parameter reduction [25].
The Scientist's Toolkit
Table 3: Essential Research Reagents and Materials for Parasite Egg Detection
| Item | Function / Application |
|---|---|
| ICIP 2022 Challenge Dataset | A benchmark dataset of microscope images of parasite eggs, used for training and evaluating deep learning models [25]. |
| YAC-Net Deep Learning Model | A lightweight convolutional neural network designed for rapid and accurate object detection of parasite eggs in images [25]. |
| Definity Microbubbles | An ultrasound contrast agent. While not used in YAC-Net, it is an example of a reagent used in other biomedical imaging and therapeutic delivery research [69]. |
| Diaminobenzidine (DAB) | A chromogen that produces a brown precipitate upon reaction with horseradish peroxidase (HRP), used for staining in immunohistochemistry [70]. |
| Cresyl Violet | A histological stain used to visualize Nissl substance in neuronal cell bodies, often used as a counterstain [70]. |
| Plantaricin YKX | A class IIa lactic acid bacteriocin. It serves as an example of a natural antimicrobial peptide used in research against pathogens like Staphylococcus aureus [71]. |
| Ferrostatin-1 (Fer-1) | A potent ferroptosis inhibitor used in research to investigate iron-dependent cell death pathways [72]. |
| Pseudomonas Quinolone Signal (PQS) | A key quorum-sensing metabolite from P. aeruginosa used in host-pathogen interaction studies, shown to manipulate host cell death [72]. |
Workflow and Model Architecture Diagrams
YAC-Net Experimental Workflow
YAC-Net Architectural Evolution
Conclusion
YAC-Net represents a significant advancement in applying lightweight deep learning to the critical challenge of parasite egg detection. By integrating an Asymptotic Feature Pyramid Network (AFPN) and a C2f module, it achieves state-of-the-art performance with markedly reduced computational demands, making automated diagnostics feasible in resource-limited settings. This model not only promises to enhance the efficiency and accuracy of parasitic disease diagnosis but also serves as a blueprint for developing cost-effective AI tools in global health. Future directions include expanding the model's capability to classify a wider range of parasites, integrating with mobile health platforms for field deployment, and adapting its framework for other microscopy-based detection tasks in drug discovery and clinical research, thereby bridging a vital gap between AI innovation and practical biomedical application.
References
- 1. Intestinal Parasitic Infections in 2023 - PMC - PubMed Central [https://pmc.ncbi.nlm.nih.gov/articles/PMC10284646/]
- 2. Global impact of parasitic infections and the importance ... [https://www.frontiersin.org/journals/parasitology/articles/10.3389/fpara.2025.1546195/full]
- 3. Global prevalence and correlation of intestinal parasitic ... [https://bmcgastroenterol.biomedcentral.com/articles/10.1186/s12876-025-04144-y]
- 4. Global prevalence and correlation of intestinal parasitic ... [https://pubmed.ncbi.nlm.nih.gov/40804378/]
- 5. Parasitic diarrheal disease: drug development and targets [https://www.frontiersin.org/journals/microbiology/articles/10.3389/fmicb.2015.01183/full]
- 6. Parasitic Egg Detection with a Deep Learning Ensemble [https://www.semanticscholar.org/paper/Parasitic-Egg-Detection-with-a-Deep-Learning-Ruiz-Santaquiteria-Pedraza/c02d19a3043cf635a31e6011a561d8b00487f836]
- 7. A dedicated deep learning workflow for automatic Fasciola ... [https://www.sciencedirect.com/science/article/pii/S0020751925001419]
- 8. Antiparasitic Drugs - StatPearls - NCBI Bookshelf - NIH [https://www.ncbi.nlm.nih.gov/books/NBK544251/]
- 9. Drug Therapy for Common Parasitic Infections Within the ... [https://www.uspharmacist.com/article/drug-therapy-for-common-parasitic-infections-within-the-united-states]
- 10. Drug discovery for parasitic diseases - ScienceDirect.com [https://www.sciencedirect.com/science/article/pii/S1471492223000144]
- 11. AI and Machine Learning in Microscopy Analysis 2025 ... [https://www.archivemarketresearch.com/reports/ai-and-machine-learning-in-microscopy-57677]
- 12. New algorithmic tool can improve microscopy image analysis ... [https://medschool.vanderbilt.edu/basic-sciences/2025/10/06/new-algorithmic-tool-can-improve-microscopy-image-analysis-making-improvements-across-fields/]
- 13. 15 Pros & Cons of Machine Vision [2025] - DigitalDefynd [https://digitaldefynd.com/IQ/pros-cons-of-machine-vision/]
- 14. AI in microscopy: shaping the future of imaging [https://www.degruyterbrill.com/document/doi/10.1515/mim-2025-0020/html?srsltid=AfmBOopcDZOJGQxETLctPPiGlCG_NpUTPZLyEHBUhrXtqyMNwJv89AGL]
- 15. Possibilities and limitations of digital microscopy of blood ... [https://pmc.ncbi.nlm.nih.gov/articles/PMC12433294/]
- 16. Machine learning applications in SEM-based pore analysis [https://www.sciencedirect.com/science/article/pii/S1387181125001891]
- 17. Super-resolution microscopy and deep learning methods ... [https://www.frontiersin.org/journals/neuroinformatics/articles/10.3389/fninf.2025.1630133/full]
- 18. Challenges [https://biomedicalimaging.org/2025/challenges/]
- 19. A lightweight deep-learning model for parasite egg detection ... [https://parasitesandvectors.biomedcentral.com/articles/10.1186/s13071-024-06503-2]
- 20. Optimized deep learning model for comprehensive medical ... [https://www.sciencedirect.com/science/article/abs/pii/S0925231224019532]
- 21. Parasite worm egg automatic detection in microscopy stool ... [https://www.semanticscholar.org/paper/Parasite-worm-egg-automatic-detection-in-microscopy-Viet-ThanhTuyen/04f7e78e7785e0cf9b46937f0dbd2e4ef09a592b]
- 22. A promising deep learning-assistive algorithm for ... [https://www.nature.com/articles/s41598-022-06264-x]
- 23. State-of-the-Art Deep Learning Methods for Microscopic ... [https://pmc.ncbi.nlm.nih.gov/articles/PMC11679639/]
- 24. Repurposing High-Throughput Image Assays Enables Biological... [https://pubmed.ncbi.nlm.nih.gov/29503208/]
- 25. A lightweight deep-learning model for parasite egg ... [https://pmc.ncbi.nlm.nih.gov/articles/PMC11539555/]
- 26. Frontiers | Applications of Deep - Learning in Exploiting Large-Scale... [https://www.frontiersin.org/journals/pharmacology/articles/10.3389/fphar.2019.01303/full]
- 27. Inside ELRIG's Drug Discovery 2025 [https://www.drugtargetreview.com/article/190237/inside-elrigs-drug-discovery-2025/]
- 28. An improved YOLOv5n algorithm for detecting surface ... [https://www.nature.com/articles/s41598-025-94109-8]
- 29. What is YOLOv5? A Guide for Beginners. [https://blog.roboflow.com/yolov5-improvements-and-evaluation/]
- 30. What is YOLOv5: A deep look into the internal features of ... [https://arxiv.org/html/2407.20892v1]
- 31. YOLOv5 🚀 in PyTorch > ONNX > CoreML > TFLite [https://github.com/ultralytics/yolov5]
- 32. YOLO-v5 Variant Selection Algorithm Coupled with ... [https://www.mdpi.com/2504-2289/7/2/120]
- 33. Microscopic urinary particle detection by different YOLOv5 ... [https://www.sciencedirect.com/science/article/abs/pii/S0010482523013604]
- 34. YOLOv5-FPN: A Robust Framework for Multi-Sized Cell ... [https://pmc.ncbi.nlm.nih.gov/articles/PMC10341068/]
- 35. Tips for Best YOLOv5 Training Results [https://docs.ultralytics.com/yolov5/tutorials/tips_for_best_training_results/]
- 36. Asymptotic Feature Pyramid Network for Object Detection [https://arxiv.org/abs/2306.15988]
- 37. AFP-Conformer: Asymptotic feature pyramid ... [https://www.sciencedirect.com/science/article/abs/pii/S0167639324001201]
- 38. HistoNeXt: dual-mechanism feature pyramid network for cell ... [https://bmcmedimaging.biomedcentral.com/articles/10.1186/s12880-025-01550-2]
- 39. Inside YOLO — What Are C3K2, C2F, & C3K Blocks? [https://medium.com/@noel.benji/inside-yolo-what-are-c3k2-c2f-c3k-blocks-806ae4cd486f]
- 40. PS-YOLO-seg: A Lightweight Instance Segmentation Method ... [https://pmc.ncbi.nlm.nih.gov/articles/PMC12296170/]
- 41. Concrete slump detection based on light-AWGAM-YOLOv8n [https://www.nature.com/articles/s41598-025-23983-z]
- 42. Improving Cell Detection and Tracking in Microscopy ... [https://pmc.ncbi.nlm.nih.gov/articles/PMC12297877/]
- 43. ICIP 2022 Challenge – Parasitic Egg Detection and ... [https://icip2022challenge.piclab.ai/]
- 44. ICIP 2022 Challenge on Parasitic Egg Detection and ... [https://arxiv.org/abs/2208.06063]
- 45. Learning Discriminatory Information for Object Detection ... [https://www.techscience.com/CMES/v138n1/54253/html]
- 46. Utilization of convolutional neural networks to analyze m... [https://www.degruyterbrill.com/document/doi/10.1515/biol-2022-0859/html?lang=en&srsltid=AfmBOopBAKfN5WRuwK2SOqZtrc0QJjwjKxn6q78xp7BJ6BHZWRKefC5V]
- 47. Development of a rapid fiber-detection system using ... [https://www.frontiersin.org/journals/analytical-science/articles/10.3389/frans.2025.1571840/full]
- 48. Automated histological classification for digital pathology ... [https://www.nature.com/articles/s41598-022-16885-x]
- 49. Optimization of deep learning models for inference in low ... [https://www.sciencedirect.com/science/article/abs/pii/S0010482525009667]
- 50. Optimization of Deep Learning Based Brain Extraction in MRI ... [https://pmc.ncbi.nlm.nih.gov/articles/PMC9627678/]
- 51. Lightweight Deep Learning for Resource-Constrained ... [https://arxiv.org/html/2404.07236v2]
- 52. Optimizing machine learning performance for medical... [https://f1000research.com/articles/14-100]
- 53. Accelerating domain-aware electron microscopy analysis ... [https://www.nature.com/articles/s41524-025-01756-6]
- 54. Correction of out-of-focus microscopic images by deep learning [https://pmc.ncbi.nlm.nih.gov/articles/PMC9062264/]
- 55. Introduction to Deconvolution [https://evidentscientific.com/en/microscope-resource/knowledge-hub/digital-imaging/deconvolution/deconintro]
- 56. Image Deconvolution: What it is and how to use ... [https://blog.biodock.ai/image-deconvolution/]
- 57. Combinations of Optimization Method and Balancing Technique ... [https://ijeeemi.org/index.php/ijeeemi/article/view/86?articlesBySimilarityPage=4]
- 58. A lightweight deep-learning model for parasite egg detection in... [https://pubmed.ncbi.nlm.nih.gov/39501374/]
- 59. Learn about the term ablation in the field of machine learning study [https://www.baeldung.com/cs/ml-ablation-study]
- 60. Accurate segmentation of localized fuel cladding chemical ... [https://www.nature.com/articles/s41598-025-14927-8]
- 61. Predicting performance of object detection models in electron ... [https://pubs.rsc.org/en/content/articlehtml/2025/dd/d4dd00351a]
- 62. Fusion of Robotics, AI, and Thermal Imaging Technologies ... [https://www.mdpi.com/1424-8220/25/22/6844]
- 63. Development of AI-assisted microscopy frameworks ... [https://www.nature.com/articles/s42256-024-00903-w]
- 64. Object Detection: State-of-the-Art Models in 2025 [https://hiringnet.com/object-detection-state-of-the-art-models-in-2025]
- 65. The Practical Guide for Object Detection with YOLOv5 ... [https://medium.com/data-science/the-practical-guide-for-object-detection-with-yolov5-algorithm-74c04aac4843]
- 66. Scalable and lightweight deep learning for efficient high ... [https://www.nature.com/articles/s41467-025-62662-5]
- 67. YAC Protocols 2nd Edition David Markie (Auth. [https://www.scribd.com/document/949441598/YAC-Protocols-2nd-Edition-David-Markie-Auth-Instant-Digital-Access]
- 68. Functional Division of Insect Blood Cells by Single- ... [https://www.mdpi.com/2073-4409/14/23/1842]
- 69. OBSERVATIONS OF TRANSLATION AND JETTING ... [https://pmc.ncbi.nlm.nih.gov/articles/PMC3223323/]
- 70. IHC and image analysis [https://www.protocols.io/view/ihc-and-image-analysis-cr7tv9nn.html]
- 71. The Antibacterial Activity Mode of Action of Plantaricin YKX ... [https://www.mdpi.com/1420-3049/27/13/4280]
- 72. A Pseudomonas aeruginosa quorum-sensing metabolite ... [https://www.nature.com/articles/s41467-025-65142-y]