SYBR Green I Flow Cytometry in Malaria Research: A Comprehensive Guide for High-Throughput Growth Inhibition Assays
This article provides a comprehensive overview of the application of SYBR Green I-based flow cytometry for assessing malaria parasite growth and inhibition.
SYBR Green I Flow Cytometry in Malaria Research: A Comprehensive Guide for High-Throughput Growth Inhibition Assays
Abstract
This article provides a comprehensive overview of the application of SYBR Green I-based flow cytometry for assessing malaria parasite growth and inhibition. It covers the foundational principles of the technique, detailing its mechanism of action based on the fluorescent staining of parasite DNA within infected red blood cells. The content delivers robust methodological protocols for setting up and performing assays for both drug screening and vaccine candidate evaluation, including adaptations for different Plasmodium species. It addresses common troubleshooting scenarios and optimization strategies to enhance assay precision and reliability. Finally, the article presents a critical validation of the method through direct comparison with established techniques like the lactate dehydrogenase (LDH) assay, hypoxanthine incorporation, and light microscopy, highlighting its advantages in speed, objectivity, and suitability for high-throughput screening in modern antimalarial drug discovery pipelines.
The Science Behind SYBR Green I: Principles of Flow Cytometric Detection of Malaria Parasites
SYBR Green I is an asymmetric cyanine dye that exhibits high affinity for double-stranded DNA (dsDNA) in a sequence-independent manner [1]. Its core mechanism of action is based on a fundamental property: upon binding to the minor groove of dsDNA, its fluorescence increases up to 1000-fold compared to its unbound state [1]. This dramatic signal enhancement makes it an exceptionally powerful tool for detecting and quantifying parasitic DNA, particularly in Plasmodium-infected red blood cells (RBCs), which contain parasitic DNA while uninfected, mature RBCs are anucleate and lack DNA [2] [3].
In the context of malaria research, especially flow cytometry-based growth inhibition assays, this property is exploited to distinguish infected from non-infected RBCs. As the parasite develops within the RBC, its DNA content increases, providing more binding sites for SYBR Green I and resulting in a correspondingly more intense fluorescent signal that can be precisely measured by a flow cytometer [4] [3]. This protocol outlines the detailed mechanism and provides standardized methods for using SYBR Green I in malaria parasite detection and drug screening.
Core Binding Mechanism and Specificity
The specificity of SYBR Green I for malaria parasite detection in flow cytometry stems from a straightforward yet powerful biochemical principle. The dye preferentially binds to dsDNA over single-stranded DNA or RNA, though some detection of double-stranded RNA is possible [1]. The fluorescence emission maximum for the DNA-bound dye is approximately 522 nm when excited with a 488 nm laser, a standard configuration on most flow cytometers [1].
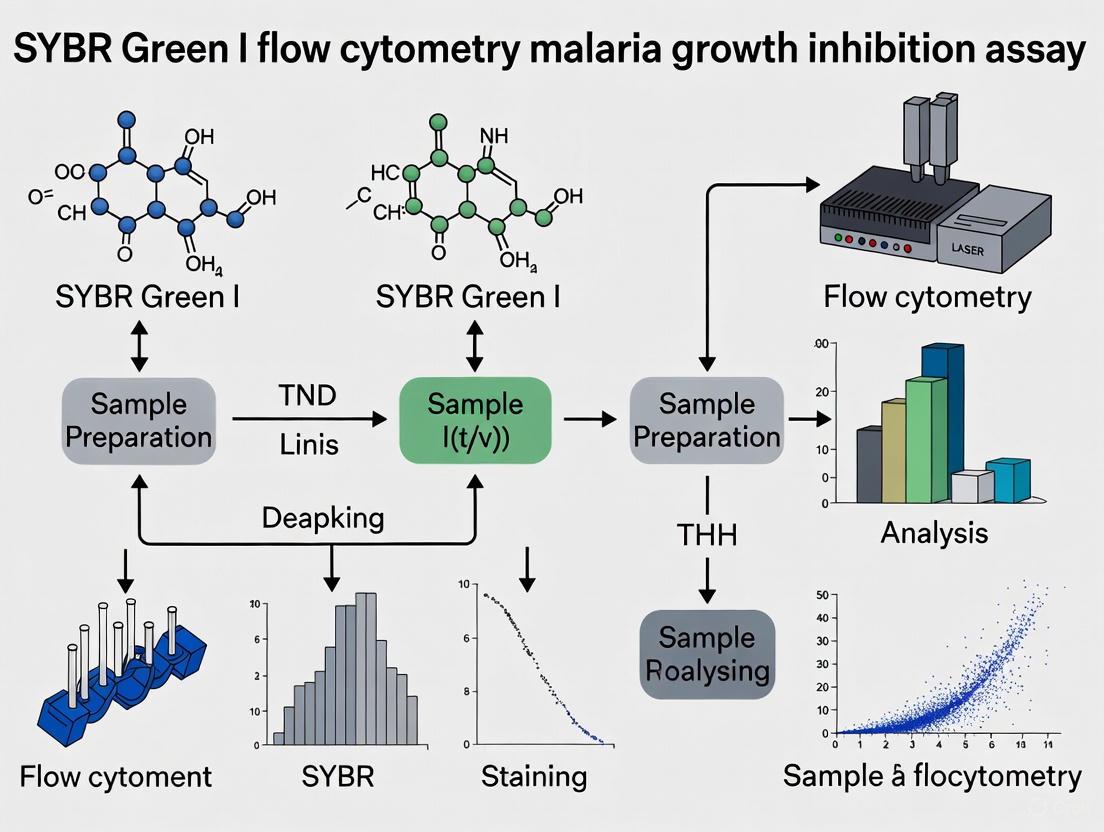
The following diagram illustrates the foundational workflow of how SYBR Green I is used to detect malaria parasites via flow cytometry, from sample preparation to final analysis.
Molecular Basis of Specific Fluorescence
The dramatic fluorescence enhancement occurs due to the restriction of intramolecular bond rotation within the dye molecule upon its insertion into the dsDNA helix. In solution, the dye molecule can rotate freely, and the energy from light excitation is largely dissipated as heat. When bound tightly within the constrained environment of the DNA minor groove, this rotation is hindered, forcing the molecule to emit the energy as fluorescence [1]. The amount of dye bound, and thus the fluorescence intensity, is directly proportional to the total parasite DNA mass, allowing the flow cytometer not only to identify infected RBCs but also to gauge the developmental stage of the parasite based on DNA content [4] [3].
Optimized Staining Protocol for Flow Cytometry
This section provides a detailed step-by-step protocol for staining Plasmodium-infected RBCs with SYBR Green I for accurate flow cytometric enumeration.
Materials and Reagents
Table 1: Essential Reagents and Materials for SYBR Green I Staining
| Item | Specification/Function | Example Source/Note |
|---|---|---|
| SYBR Green I | 10,000x concentrate in DMSO | Molecular Probes, Sigma-Aldrich [1] [5] |
| Parasite Culture | Synchronized P. falciparum, P. knowlesi, or P. berghei | Maintain in human or mouse RBCs as appropriate [5] [2] |
| Staining Buffer | Phosphate-Buffered Saline (PBS) or complete culture medium | Isotonic buffer for maintaining cell integrity |
| Fixative | 4% Paraformaldehyde (PFA) with 0.4% Glutaraldehyde | For cell fixation pre-staining (optional) [5] |
| RNase A | Ribonuclease A | Optional, to remove potential RNA binding [1] |
| Flow Cytometer | Equipped with 488 nm laser and FITC/GFP filter (530/30 nm) | Standard configuration |
Step-by-Step Staining Procedure
Sample Preparation: Harvest Plasmodium-infected RBC culture or infected blood. For in vivo samples from rodent models, collect blood via venipuncture into an anticoagulant. Wash cells once with 1x PBS to remove serum proteins and media components. For fixed samples, resuspend the cell pellet in 4% PFA with 0.4% glutaraldehyde and incubate for 30 minutes at room temperature, followed by two washes with PBS [5].
Dye Dilution: Prepare a working solution of SYBR Green I in PBS. A 4x final concentration is often optimal, but this should be determined empirically for each system [2]. The working solution should be prepared fresh from the 10,000x DMSO stock and protected from light.
Staining Incubation:
- Resuspend the washed cell pellet in the SYBR Green I working solution.
- Incubate the mixture for 30 minutes at 37°C in the dark to prevent photobleaching of the dye [2].
- Gently mix the tubes by inversion every 10 minutes to ensure uniform staining.
Data Acquisition:
- After incubation, analyze the samples immediately on the flow cytometer without a washing step to avoid dye loss from cells [3].
- Set the flow cytometer to trigger on a combination of forward scatter (FSC) and side scatter (SSC) to gate on RBCs and exclude debris.
- Collect fluorescence in the FL-1 (FITC/GFP) channel (approximately 530/30 nm bandpass filter).
Gating Strategy:
- Create a dot plot of FSC-A vs. SSC-A and draw a gate (R1) around the intact RBC population.
- From R1, create a histogram of FL-1 (Green Fluorescence). Infected RBCs will appear as a distinct population with high FL-1 fluorescence, while uninfected RBCs will show minimal fluorescence.
- For complex samples containing leukocytes, include an anti-CD45 antibody conjugated to a fluorochrome like APC to positively identify and exclude white blood cells from the analysis [3].
Critical Assay Parameters and Optimization
Successful quantification relies on careful optimization of key parameters. The table below summarizes critical variables and their optimized ranges based on published studies.
Table 2: Key Assay Parameters for SYBR Green I Staining in Different Plasmodium Species
| Parameter | Recommended Optimization Range | Optimal Value (Example) | Impact on Assay |
|---|---|---|---|
| SYBR Green I Concentration | 2x – 10x final concentration | 4x (P. berghei [2]) | Signal-to-noise ratio, staining intensity |
| Incubation Time | 15 – 60 minutes | 30 minutes (P. berghei [2]) | Dye penetration and DNA binding equilibrium |
| Incubation Temperature | Room Temperature – 37°C | 37°C | Kinetics of dye uptake and binding |
| Cell Concentration | 10^6 – 10^7 cells/mL | ~10^6 cells/mL | Avoids signal saturation and coincidence |
| Fixation | Optional (PFA/Glutaraldehyde) | 4% PFA / 0.4% Glutaraldehyde [5] | Preserves cell morphology but may affect permeability |
Interference and Limitations
A critical consideration for drug screening is that the SYBR Green I assay is susceptible to false-positive readouts when testing DNA-binding compounds. Cationic cell-penetrating peptides (CPPs) and DNA intercalators (e.g., doxorubicin, actinomycin D) can compete with the dye for DNA binding sites, leading to a reduced fluorescent signal that can be misinterpreted as parasite growth inhibition [6]. This interference can occur in solution upon cell lysis (for CPPs) or via intercalation with intracellular DNA in vivo (for small molecules) [6].
Mitigation Strategy: For cationic peptides, this interference can be significantly reduced by removing the supernatant containing excess peptides after the drug incubation period and before adding the lysis buffer with SYBR Green I [6]. However, for potent intercalators, this washing step may not correct the signal, necessitating validation of antiplasmodial activity with a non-DNA binding dependent assay like the [3H]hypoxanthine incorporation assay or a parasite lactate dehydrogenase (pLDH) assay [6].
Data Interpretation and Analysis
In a flow cytometry histogram, the FL-1 fluorescence allows clear discrimination between populations.
- Uninfected RBCs: Appear as a tight, low-fluorescence peak on the left of the histogram.
- Infected RBCs (iRBCs): Appear as a separate population with higher fluorescence, shifted to the right.
Parasitemia Calculation:
% Parasitemia = (Number of events in iRBC gate / Total number of events in RBC gate) × 100
Advanced analysis can leverage the fact that fluorescence intensity is proportional to DNA content. This allows for the rudimentary staging of parasites, as rings have lower DNA content than trophozoites, which in turn have less DNA than schizonts containing multiple nuclei [3]. This can be visualized by gating on sub-populations within the broader iRBC population on a two-dimensional dot plot, such as Hoechst vs. Ethidium [3].
The Scientist's Toolkit: Research Reagent Solutions
Table 3: Essential Reagents and Kits for SYBR Green I-Based Malaria Research
| Reagent/Kits | Core Function | Research Application Note |
|---|---|---|
| SYBR Green I (10,000x Stock) | High-affinity dsDNA binding dye | Core detection reagent for quantifying parasite DNA [1] [2] |
| Bst 2.0 WarmStart DNA Polymerase | Strand-displacing DNA polymerase | Essential for LAMP-based molecular detection of Plasmodium [7] |
| DNeasy Blood & Tissue Kit | DNA extraction from whole blood | Prepares template for PCR/LAMP diagnostics from clinical samples [7] |
| Anti-CD45-APC Antibody | Leukocyte surface marker staining | Critical for excluding white blood cells in flow cytometry of whole blood, preventing false positives [3] |
| Rapamycin-inducible DiCre System | Conditional gene knockout | Tool for studying essential genes like transcription factor PfAP2-P in blood-stage development [8] |
| Parasite Lactate Dehydrogenase (pLDH) Assay Kit | Measure metabolic activity | Used as an orthogonal, non-DNA based method to validate growth inhibition results [6] [5] |
SYBR Green I provides a robust, sensitive, and relatively simple core mechanism for detecting malaria parasite DNA through fluorescence enhancement. The protocols detailed herein allow for the precise quantification of parasitemia and assessment of growth inhibition for antimalarial drug screening. Researchers must remain vigilant of the method's limitation regarding DNA-binding compounds and employ appropriate countermeasures to ensure data fidelity. When optimized and validated, SYBR Green I-based flow cytometry remains an indispensable tool in the malaria research and drug development pipeline.
Core Principle and Quantitative Validation
The fundamental advantage of SYBR Green I flow cytometry in malaria research lies in the exploitation of a single, critical biochemical difference: the presence of parasite DNA within infected red blood cells (RBCs) and its complete absence in uninfected RBCs. Mature human erythrocytes are enucleated and devoid of nucleic acids, whereas Plasmodium parasites, during their intraerythrocytic life cycle, contain double-stranded DNA [9]. SYBR Green I, a cyanine dye with high avidity for double-stranded DNA, binds specifically to this parasite nucleic acid, emitting a strong fluorescent signal upon excitation by a 488 nm laser, a standard feature on most flow cytometers [2] [3]. This provides a clear, binary distinction between infected and uninfected cells, forming the basis for highly precise parasitemia measurement.
This method has been rigorously validated against traditional microscopy, demonstrating superior performance. The table below summarizes key quantitative findings from validation studies:
Table 1: Validation of SYBR Green I Flow Cytometry Against Reference Methods
| Comparison | Parasite Species | Key Metric | Result | Reference |
|---|---|---|---|---|
| vs. Light Microscopy | P. falciparum | Linear Correlation (R²) | 0.9925 | [9] |
| vs. GFP Fluorescence | P. berghei (GFP-expressing) | Linear Correlation (R²) | 0.999 | [3] |
| Limit of Detection | P. berghei | Parasitemia | 0.02% - 0.04% | [3] |
| Limit of Detection | P. falciparum | Parasitemia | 0.2% | [9] |
| Assay Specificity | P. falciparum | Resolution of multiply-infected RBCs | Clear resolution of singly-, doubly-, and triply-infected RBCs | [9] |
This high level of precision enables researchers to accurately calculate the Parasite Multiplication Rate (PMR) and the Selectivity Index (SI), which are critical parameters for understanding parasite virulence and invasion efficiency [9]. Furthermore, the ability to resolve multiply-infected erythrocytes, a tedious and often inaccurate task by microscopy, provides nuanced data on parasite invasion phenotypes [9].
Detailed Experimental Protocol
This section provides a step-by-step protocol for determining parasitemia and assessing growth inhibition using SYBR Green I and flow cytometry.
Reagent and Material Preparation
- SYBR Green I Stain: Prepare a 1:1000 dilution of the commercial stock solution in 1X PBS. Protect from light and store at -20°C [9].
- Staining Buffer: Phosphate-buffered saline (PBS) supplemented with 0.5% Bovine Serum Albumin (BSA) and 0.02% sodium azide [9].
- Parasite Culture: Maintain Plasmodium falciparum cultures in human O+ erythrocytes at 4% hematocrit in complete RPMI-1640 media, supplemented with 25 mM HEPES, 0.21% sodium bicarbonate, 50 mg/L hypoxanthine, and 0.5% Albumax II. Culture in a gas mixture of 1% O₂, 5% CO₂, and 94% N₂ at 37°C [9] [10].
- Synchronization: Treat cultured parasites with 5% D-sorbitol to synchronize them at the ring stage, which is crucial for accurate DNA quantification [9] [10].
Staining and Flow Cytometry Workflow
The following diagram illustrates the core workflow for sample processing and analysis:
- Sample Preparation: For in vitro drug testing, plate synchronized ring-stage parasites in 96-well or 384-well plates at a starting parasitemia of 0.5-1.0% and 2% hematocrit. Include controls: untreated infected wells (100% growth), and uninfected RBCs (background) [9] [10].
- Drug Incubation: Incubate the culture plates for 72 hours at 37°C in a malaria gas mixture to allow for one complete cycle of invasion and growth [10].
- Staining Procedure:
- Transfer 200 µL of culture to a microtiter plate.
- Pellet cells by centrifugation (e.g., 1200 rpm for 5 minutes).
- Wash twice with 100 µL of staining buffer.
- Resuspend the cell pellet in 75 µL of the 1:1000 SYBR Green I working solution.
- Incubate for 20 minutes at 25°C in the dark.
- Wash cells once with staining buffer to remove unbound dye and resuspend in PBS for analysis [9].
- Flow Cytometry Acquisition:
- Use a flow cytometer equipped with a 488 nm laser.
- Collect a minimum of 100,000 events per sample to ensure statistical robustness, particularly at low parasitemia.
- Set the fluorescence detector for SYBR Green I (e.g., FITC/FL-1 channel) using logarithmic amplification.
- Use unstained, uninfected RBCs to set the baseline fluorescence and account for autofluorescence [9] [3].
Data Analysis for Growth Inhibition
- Parasitemia Calculation: The percentage of infected RBCs (% Parasitemia) is determined by the proportion of SYBR Green I-positive events within the total RBC population after gating out debris and doublets.
Growth Inhibition Calculation: The growth inhibition activity (GIA) of a test compound or antibody is calculated using the formula:
% GIA = [1 - (% Parasitemia in Test Well / % Parasitemia in Control Well)] × 100 [5]
Parasite Multiplication Rate (PMR): To calculate the fold-increase in parasitemia over one cycle, divide the final parasitemia after reinvasion by the initial parasitemia at the ring stage [9].
The Scientist's Toolkit: Essential Research Reagents
The successful implementation of this protocol relies on a set of key reagents and materials. The table below details these essential components and their functions.
Table 2: Key Research Reagent Solutions for SYBR Green I Flow Cytometry
| Reagent/Material | Function/Application | Example Specifications |
|---|---|---|
| SYBR Green I | High-affinity DNA stain that selectively labels parasites within RBCs. | Molecular Probes, 1:1000 dilution in PBS [9]. |
| Human O+ RBCs | Host cells for in vitro culturing of P. falciparum parasites. | Washed, Duffy positive for P. knowlesi/P. vivax models [5]. |
| Complete RPMI Media | Culture medium supporting parasite growth and development. | RPMI-1640 with HEPES, Hypoxanthine, Albumax II [9]. |
| D-Sorbitol | Agent for synchronizing parasite cultures at the ring stage. | 5% (wt/vol) solution in water [10]. |
| Anti-CD45 Antibody | (For whole blood) Pan-leukocyte marker to exclude WBCs from analysis. | APC-conjugated, used in tri-color protocols [3]. |
| 96/384-well Plates | Platform for high-throughput drug sensitivity and inhibition assays. | Tissue culture-treated, U-bottom or flat-bottom [10]. |
Integration in the Drug Discovery Pipeline
The SYBR Green I flow cytometry assay is highly versatile and integrates seamlessly into various stages of the antimalarial drug and vaccine development pipeline.
- High-Throughput Screening (HTS): The assay can be miniaturized to 384-well format, enabling the rapid screening of thousands of compounds from chemical libraries to identify novel antimalarial hits [10].
- Mode of Action Studies: By analyzing the DNA content histograms, researchers can infer the stage-specific activity of compounds. For instance, a block in DNA replication will prevent the emergence of populations with higher DNA content (schizonts) [11].
- Vaccine Efficacy Testing: The assay is a standard tool for evaluating the growth inhibitory activity (GIA) of antibodies elicited by blood-stage malaria vaccines. The precise measurement of parasitemia reduction directly quantifies functional antibody efficacy [5].
This protocol provides a robust, quantitative, and high-throughput compatible method that leverages a fundamental biochemical difference to advance the fight against malaria.
Flow cytometry has emerged as a powerful, high-throughput alternative to traditional microscopy for malaria research, enabling precise quantification of parasitemia and assessment of drug effects. This technology allows for rapid analysis of thousands of cells per second, providing objective, quantitative data on parasite proliferation, stage distribution, and viability. For research on malaria growth inhibition, particularly when utilizing SYBR Green I-based assays, specific instrument configurations are essential to achieve optimal sensitivity, resolution, and reliable results. This application note details the critical components, configurations, and protocols for implementing flow cytometry in SYBR Green I-based malaria growth inhibition assays, providing researchers with a foundation for robust experimental design.
Flow Cytometer Configuration for SYBR Green I Assays
The configuration of a flow cytometer is paramount for successfully detecting and quantifying Plasmodium-infected red blood cells (iRBCs) stained with SYBR Green I. This DNA-binding dye has excitation and emission maxima near 497 nm and 520 nm, respectively, necessitating specific optical paths [12].
Critical Instrument Components
A standard flow cytometer configured for SYBR Green I detection in malaria assays should include the following core components:
- 488 nm Laser: A blue laser is the standard excitation source for SYBR Green I. This is a common feature on most benchtop analytical cytometers.
- Optical Filters: A combination of filters is required to isolate the SYBR Green I fluorescence signal:
- Dichroic Mirror/Long Pass Filter: A 502 nm long pass (502LP) filter is typically used to separate the emission signal, directing light below 502 nm to one detector and light above 502 nm to another.
- Bandpass Filter for SYBR Green I: A 530/30 nm bandpass (530/30BP) filter is placed in front of the detector to capture the primary green fluorescence of SYBR Green I-bound DNA [13].
- Forward Scatter (FSC) and Side Scatter (SSC) Detectors: These detectors measure cell size and granularity/complexity, respectively. They are crucial for gating on the red blood cell population and excluding debris and other cell types.
- Fluorescence Detectors (PMTs): Photomultiplier tubes are used to detect and convert the fluorescent light signals into electronic signals. The PMT for the 530/30 nm channel should be set with appropriate voltage to maximize the separation between infected and non-infected RBCs.
Table 1: Key Flow Cytometer Configuration for SYBR Green I Malaria Assays
| Component | Specification | Function in Assay |
|---|---|---|
| Excitation Laser | 488 nm (air-cooled argon-ion) | Excites the SYBR Green I dye bound to parasite DNA |
| Emission Filter (SYBR Green I) | 530/30 nm Bandpass (BP) | Isolates the green fluorescence signal from stained iRBCs |
| Dichroic Mirror | 502 nm Long Pass (LP) | Splits the emission light for potential multi-color detection |
| Trigger Signal | Fluorescence (530 nm) | Ensures only fluorescent events (potential iRBCs) are recorded, saving memory and improving sensitivity |
| Reference Beads | ~1 µm fluorescent beads | Serves as an internal standard for instrument performance and volumetric counting |
Instrument Set-Up and Quality Control
Proper instrument set-up is critical for day-to-day reproducibility. Before running experimental samples, perform the following steps:
- Calibration: Use fluorescent calibration beads to ensure the cytometer's lasers and detectors are performing within specified parameters.
- Threshold Setting: Set the trigger or threshold on the fluorescence channel (e.g., 530 nm) to ignore non-fluorescent debris and record only events that are potential iRBCs. This significantly reduces file sizes and focuses data collection on the population of interest [13].
- Volumetric Counting: If absolute parasite counts are required, utilize instruments with volumetric counting capabilities or add a known concentration of reference beads (e.g., CountBright beads) to the sample [13]. This allows for the calculation of absolute cell concentrations in the original sample.
Experimental Protocols for Malaria Growth Inhibition
The following protocols outline the core methodologies for assessing malaria parasite growth and inhibition using SYBR Green I and flow cytometry.
Protocol: SYBR Green I-Based Growth Inhibition Activity (GIA) Assay
This protocol is adapted from established methods for measuring antimalarial drug or antibody efficacy [5] [14].
Materials and Reagents:
- Plasmodium falciparum culture (synchronized early rings recommended).
- Complete RPMI 1640 culture medium.
- Human O+ red blood cells (RBCs).
- Test compounds (drugs) or inhibitory antibodies.
- SYBR Green I nucleic acid gel stain (commercial stock, e.g., 10,000X concentrate).
- Phosphate-Buffered Saline (PBS), pH 7.4.
- 96-well U-bottom or V-bottom plates.
- Flow cytometer with 488 nm laser and 530/30 nm filter.
Procedure:
- Parasite Culture and Plating:
- Adjust the parasitemia of a synchronized P. falciparum culture to 0.5-1.0% and hematocrit to 1-2% in complete medium.
- Dispense 100 µL of the parasite suspension into each well of a 96-well plate.
- Add 100 µL of medium containing the test compound at 2X the desired final concentration. Include untreated control wells (100 µL parasite suspension + 100 µL medium alone) and uninfected RBC controls.
Incubation:
- Incub the plate at 37°C in a humidified gas jar with a mixture of 90% N₂, 5% O₂, and 5% CO₂ for 72 hours (or one full intraerythrocytic cycle).
Staining and Preparation for Flow Cytometry:
- After incubation, resuspend the cells in each well by pipetting.
- Transfer a 50 µL aliquot from each well to a new 96-well V-bottom plate.
- Wash cells once with 150 µL of PBS by centrifuging the plate at 1500-2000 x g for 2 minutes. Carefully decant or aspirate the supernatant.
- Resuspend the cell pellet in 100 µL of PBS containing a 1:5,000 to 1:10,000 dilution of SYBR Green I stock solution.
- Incubate the plate in the dark at room temperature for 30-60 minutes.
- Optional: Wash cells once more with PBS to remove unbound dye (this step can be omitted for a quicker, "no-wash" protocol if background is acceptable).
- Resuspend the final stained pellet in 150-200 µL of PBS for acquisition on the flow cytometer.
Flow Cytometry Acquisition:
- Set the flow cytometer according to the configuration detailed in Section 2.
- Acquire a minimum of 50,000 events per sample, gating on the RBC population based on FSC and SSC characteristics.
- Record the fluorescence intensity in the 530 nm (FITC/GFP) channel.
Data Analysis:
- Define a positive population for infected RBCs (iRBCs) based on the fluorescence of the untreated control.
- The percentage of growth inhibition is calculated as follows:
% Inhibition = [1 - (% iRBCs in Test Well / % iRBCs in Untreated Control Well)] x 100
Protocol: Direct-from-Blood qPCR-Based GRRA for Artemisinin Resistance Phenotyping
While not a flow cytometry protocol, the recently developed Growth, Resistance, and Recovery Assay (GRRA) highlights advanced phenotyping and uses SYBR Green I in a qPCR readout, offering a complementary approach [14].
Key Workflow:
- Assay Setup: Clinical isolates or cultured parasites are exposed to a pharmacologically relevant pulse of dihydroartemisinin (DHA).
- Sample Collection: Samples are taken at multiple timepoints: for Growth (6-96h), for Resistance (replicative viability at 120h), and for Recovery (120-192h).
- qPCR Quantification: A straight-from-blood SYBR Green I-based qPCR protocol is used to quantify parasite DNA directly from in vitro cultures without DNA extraction.
- Phenotype Calculation: The DNA quantification data is used to calculate three distinct phenotypes: innate growth rate, resistance to drug kill, and recovery capacity after drug exposure [14].
Table 2: Key Reagent Solutions for SYBR Green I Malaria Assays
| Research Reagent | Function/Application in Assay |
|---|---|
| SYBR Green I Dye | Fluorogenic DNA stain that selectively labels parasite nucleic acid within red blood cells; core to iRBC detection. |
| Complete RPMI 1640 Medium | Culture medium supporting intraerythrocytic growth of Plasmodium parasites. |
| Dihydroartemisinin (DHA) | Active artemisinin derivative used to challenge parasites and measure ring-stage survival and recovery. |
| Glutaraldehyde/Paraformaldehyde | Fixatives used to preserve cell morphology and stabilize samples for later analysis or sorting. |
| Phosphate-Buffered Saline (PBS) | Isotonic buffer used for washing cells and diluting stains and reagents. |
| RNase A | Enzyme used to digest RNA, reducing non-specific background signal from ribosomal RNA in reticulocytes. |
| Triton X-100 | Detergent used for cell permeabilization, allowing dye access to DNA in fixation-based protocols. |
Workflow Visualization
The following diagram illustrates the logical workflow and signaling pathway for a SYBR Green I-based flow cytometry malaria assay.
Diagram 1: Workflow of SYBR Green I Flow Cytometry Assay for Malaria.
Discussion and Technical Considerations
Optimizing a flow cytometry assay for malaria research requires careful attention to several technical aspects. Dye Concentration and Staining Conditions are critical; while SYBR Green I has high affinity for DNA, excessive concentrations can be toxic to cells or increase background. An optimized concentration (e.g., 1:5,000 to 1:10,000 dilution of commercial stock) with an incubation of 30-60 minutes in the dark is generally effective [12]. For fixed cells, a higher concentration and shorter incubation may be used. The Discrimination of Reticulocytes is a known challenge, as these immature RBCs contain RNA that can bind SYBR Green I, leading to false positives. This can be mitigated by using RNase A treatment in permeabilization protocols or by employing a bidimensional analysis strategy that exploits differences in the fluorescence emission spectrum of iRBCs versus reticulocytes, similar to approaches used with YOYO-1 dye [15]. Finally, Sample Fixation and Storage can enhance workflow flexibility. Fixing samples with glutaraldehyde (e.g., 0.5% final concentration) followed by freezing at -80°C allows for batch analysis [16]. However, fixation and permeabilization protocols must be rigorously optimized to ensure the dye can access intracellular DNA without destroying light-scatter properties. The integration of these protocols and configurations provides a robust framework for applying SYBR Green I flow cytometry to advanced malaria growth inhibition and drug resistance studies.
In malaria research, precise quantification of parasite growth and replication is fundamental for evaluating new drug candidates, vaccines, and understanding fundamental biology. The asexual blood stages of Plasmodium parasites are responsible for the clinical symptoms of malaria, and their rapid replication through schizogony is a primary target for intervention strategies [17]. This application note details the use of SYBR Green I-based flow cytometry to directly correlate parasite DNA replication with fluorescence signal across different developmental stages, providing a robust framework for growth inhibition studies. This method leverages the stoichiometric binding of SYBR Green I to double-stranded DNA, allowing for the precise quantification of parasite replication and biomass, which is essential for high-throughput screening in drug development pipelines [18] [19].
Quantitative Correlation of DNA Content and Fluorescence
The foundation of this assay is the direct, stoichiometric binding of SYBR Green I to double-stranded DNA, which enables the fluorescence signal to serve as a reliable proxy for genomic content and, by extension, parasite replication and stage progression.
Table 1: Fluorescence Intensity Characteristics Across Plasmodium Falciparum Developmental Stages
| Developmental Stage | Approximate DNA Content | Relative SYBR Green I Fluorescence | Key Characteristics |
|---|---|---|---|
| Ring | 1N | Low | Uninucleated; low DNA content results in dim fluorescence signals. |
| Trophozoite | 1N | Medium | Large, single nucleus; active metabolism but no DNA replication. |
| Schizont | 4N-32N | High | Multinucleated; DNA replication culminates in high fluorescence. |
| Merozoites (post-egress) | 1N | Low (individual) | Individual daughter cells; fluorescence signal dissipates upon red blood cell invasion to form new rings. |
The utility of this correlation is demonstrated in growth inhibition assays (GIA), where a reduction in parasite growth caused by inhibitory antibodies or antimalarial compounds is quantified by a decrease in overall SYBR Green I fluorescence. This method has been validated against other techniques, such as the parasite lactate dehydrogenase (pLDH) assay, and offers the advantage of directly measuring parasite numbers and DNA content rather than indirect metabolic activity [17] [20]. Furthermore, flow cytometry-based measurements using DNA stains like SYBR Green I have been shown to be more reproducible and scalable for high-throughput applications compared to traditional light microscopy [20] [19].
Protocol: SYBR Green I-Based Growth Inhibition Assay
This protocol describes a standardized procedure for assessing parasite growth inhibition using SYBR Green I and flow cytometry, adapted for use with Plasmodium falciparum.
Materials and Reagents
- Parasite Culture: Continuous culture of Plasmodium falciparum (e.g., 3D7 or D10 strain) in human O+ erythrocytes [20] [19].
- Culture Medium: RPMI-1640 medium supplemented with 25 mM HEPES, 50 µg/mL hypoxanthine, 25 mM NaHCO₃, and 5-10% human serum or Albumax II [17] [20].
- SYBR Green I Staining Solution: SYBR Green I nucleic acid gel stain. A working solution is prepared in PBS [19].
- Test Samples: Purified inhibitory antibodies, human or animal sera, or small molecule antimalarials.
- Equipment: Flow cytometer with a 488 nm laser and FITC/GFO detection channel (e.g., Becton Dickinson FACSCalibur or LSR-II), CO₂ incubator, plate centrifuge, 96-well U-bottom plates [17] [20].
Step-by-Step Procedure
- Parasite Synchronization: Synchronize a high-parasitemia culture of P. falciparum to the ring stage using 5% sorbitol treatment. This ensures a homogeneous population for the assay [19].
- Assay Setup: Dilute the synchronized ring-stage parasites to a starting parasitemia of 0.1-0.5% and 1-2% hematocrit in complete culture medium. Distribute 50-100 µL of the parasite suspension into each well of a 96-well plate.
- Sample Addition: Add the test samples (e.g., antibodies, drugs) to the parasite cultures at the desired dilution. Include control wells with non-inhibitory serum, PBS, and unininfected red blood cells. Perform all treatments in duplicate or triplicate.
- Incubation: Incubate the assay plate for 48 hours (one full intraerythrocytic cycle) or 96 hours (two cycles) in a humidified gassed incubator at 37°C (90% N₂, 5% O₂, 5% CO₂) [17] [20]. For two-cycle assays, add fresh culture medium at the 48-hour mark.
- Staining and Fixation: a. After incubation, centrifuge the plate and carefully remove the supernatant. b. Fix the cells by resuspending the pellet in 100 µL of fixative solution (e.g., 0.05% glutaraldehyde in PBS) and incubating for 10 minutes [19]. c. Wash the cells once with PBS. d. Resuspend the cell pellet in 100 µL of PBS containing a 1X dilution of SYBR Green I stain. Incubate for 1 hour in the dark at room temperature.
- Flow Cytometry Analysis: a. Centrifuge the plate, remove the supernatant, and resuspend the cells in 200 µL of PBS. b. Acquire data on a flow cytometer, collecting a minimum of 50,000 events per well. c. Gate on the intact erythrocyte population using forward and side scatter, then determine the proportion of SYBR Green I-positive cells (FL1/H channel) within this gate.
- Data Analysis: Calculate the percentage of growth inhibition using the formula:
% Inhibition = [1 - (% Parasitemia in Test Well / % Parasitemia in Control Well)] × 100
Signaling Pathways and Experimental Workflows
The following diagrams illustrate the core biological process and the experimental workflow detailed in this application note.
Diagram 1: Parasite Lifecycle and DNA Fluorescence Correlation. The intraerythrocytic cycle of Plasmodium parasites shows a direct relationship between morphological stage, DNA replication, and the resulting SYBR Green I fluorescence signal. DNA replication occurs during the schizont stage, leading to a proportional increase in fluorescence intensity that can be quantified by flow cytometry.
Diagram 2: SYBR Green I Growth Inhibition Assay Workflow. The step-by-step protocol from parasite synchronization to data analysis. The flow cytometry step involves gating on intact erythrocytes before quantifying the SYBR Green I-positive (parasitized) population to determine parasitemia and calculate growth inhibition.
Research Reagent Solutions
The following table lists key reagents and their critical functions in the SYBR Green I growth inhibition assay.
Table 2: Essential Reagents for SYBR Green I-Based Growth Inhibition Assays
| Reagent / Material | Function in the Assay | Notes for Application |
|---|---|---|
| SYBR Green I | Stoichiometric DNA stain for flow cytometric detection of parasitized RBCs. | Provides high-affinity binding to dsDNA; yields lower CVs than propidium iodide in some systems [18]. |
| Synchronization Agent (e.g., Sorbitol) | Selectively lyses mature parasite stages, yielding a highly synchronized ring-stage culture for assay start. | Critical for ensuring all parasites are at the same developmental stage at the beginning of the assay [19]. |
| Culture Medium (RPMI-1640) | Supports in vitro growth of Plasmodium blood stages during the inhibition assay. | Must be supplemented with serum or Albumax II and gassed with appropriate CO₂/O₂/N₂ mixture [17] [20]. |
| Human O+ Erythrocytes | Host cells for the parasite's intraerythrocytic development. | Served as both the invasion target and the physiological environment for the assay [20] [19]. |
| Fixative (e.g., Glutaraldehyde) | Preserves cellular morphology and fixes the parasitemia at the end of the assay period. | Allows for staining and analysis to be performed at a later time if necessary [19]. |
| Inhibitory Samples (Antibodies, Drugs) | Test compounds used to quantify the reduction in parasite growth. | Includes vaccine-induced antibodies, drug candidates, or known antimalarials for validation [17] [20]. |
The correlation between parasite DNA replication and SYBR Green I fluorescence provides a powerful, quantitative tool for malaria research and drug development. The protocol outlined here offers a sensitive, reproducible, and scalable method to assess growth inhibition, enabling researchers to accurately evaluate the efficacy of novel therapeutic interventions against the malaria parasite.
Executing the Assay: A Step-by-Step Protocol for Drug and Antibody Screening
Within the context of malaria growth inhibition research utilizing SYBR Green I-based flow cytometry, the prerequisite steps of parasite culture and synchronization are foundational to data accuracy and reproducibility. This application note details standardized protocols for the in vitro maintenance of Plasmodium falciparum and the synchronization of cultures at the ring stage, specifically optimized for subsequent high-throughput screening (HTS) and flow cytometric analysis. The methods described herein ensure the precise staging of parasites required for robust and reliable quantification of drug effects or antibody-mediated growth inhibition.
The discovery of novel antimalarial drugs is urgently needed to combat increasing mortality, morbidity, and drug resistance in endemic areas [10]. In vitro growth inhibition assays, particularly those employing SYBR Green I staining and flow cytometric detection, are essential tools for evaluating the efficacy of potential drug candidates and vaccine-induced antibodies [5] [14]. The clinical symptoms of malaria arise from the growth and multiplication of blood-stage parasites, making assays that measure these parameters crucial for development of new therapeutics [5].
A critical determinant for the success of these assays is the use of highly synchronized parasite cultures. The Plasmodium falciparum life cycle in red blood cells is asynchronous under standard culture conditions, leading to mixtures of rings, trophozoites, and schizonts at any given time. For assays that measure a specific drug's effect on a particular stage—such as the ring-stage survival assay (RSA) for artemisinin resistance—or for accurate multiplication rate calculations, achieving high levels of synchrony is not optional but mandatory [10] [14]. This protocol outlines the essential pre-assay preparations for the culture and synchronization of P. falciparum to ensure reproducible and interpretable results in downstream flow cytometry applications.
Materials and Reagents
Research Reagent Solutions
The following table lists the essential materials required for the culture and synchronization of Plasmodium falciparum parasites.
| Item | Function/Application in Protocol |
|---|---|
| Human O+ Red Blood Cells (RBCs) | Host cells for the in vitro culture of Plasmodium falciparum blood stages [10]. |
| RPMI 1640 Culture Medium | Base medium for parasite culture, supplemented with additional nutrients [10] [5]. |
| Albumax I/II | Lipid-rich bovine serum albumin used as a substitute for human serum in culture medium [10] [5]. |
| Hypoxanthine | Essential supplement that enables nucleic acid synthesis by the parasite [10] [5]. |
| D-Sorbitol | Chemical agent used for selective lysis of mature trophozoite and schizont stages to synchronize cultures at the ring stage [10]. |
| SYBR Green I Nucleic Acid Gel Stain | Fluorescent dye that binds to parasite DNA; used for flow cytometric detection and quantification of parasitemia [5] [14]. |
| Phosphate-Buffered Saline (PBS) | Buffer used for washing cells and as a diluent for solutions like sorbitol [10]. |
| Dimethyl Sulfoxide (DMSO) | Solvent for preparing stock solutions of library compounds for HTS. Note that DMSO can damage cell membranes if used incorrectly with dyes [10] [21]. |
| Giemsa Stain | Conventional microscopic stain for visualizing and assessing parasite morphology and parasitemia on blood smears [5]. |
Culture Medium Preparation
Complete culture medium is prepared as follows [10] [5]:
- Base Medium: RPMI 1640
- Supplements:
- 100 µM hypoxanthine
- 12.5 µg/ml gentamicin
- 0.5% (wt/vol) Albumax I
- 2 g/L sodium bicarbonate
- The medium should be adjusted to the appropriate pH, and cultures are typically maintained at 37°C in a mixed-gas environment of 1% O₂, 5% CO₂, and 94% N₂ [10].
Protocols
In Vitro Culture ofPlasmodium falciparumAsexual Stages
This procedure is adapted from established protocols for maintaining drug-sensitive and resistant strains [10].
- Preparation: Obtain human O+ RBCs and wash three times in incomplete RPMI 1640 or PBS by centrifugation at 1,000–1,500 × g for 5–10 minutes.
- Initiating Culture: Resuspend the washed RBCs to a 2% hematocrit in complete culture medium.
- Inoculation: Introduce the desired P. falciparum strain (e.g., 3D7, NF54, K1, Dd2) into the RBC suspension to initiate an asynchronous culture.
- Incubation: Maintain cultures in 75 cm² culture flasks at 37°C in a specialized malaria culture chamber with a gaseous mix of 1% O₂, 5% CO₂, and balance N₂.
- Daily Maintenance: Change the culture medium daily to replenish nutrients and remove waste products.
- Sub-culturing: When parasitemia reaches 5–10%, typically every 3–4 days, sub-culture by diluting the infected RBCs with fresh, uninfected RBCs to a starting parasitemia of 0.5–1%.
Synchronization of Parasites at the Ring Stage
Synchronization is achieved through sequential sorbitol treatments, which selectively lyse mature parasite stages [10]. The following workflow and detailed protocol ensure high-quality synchronization.
Detailed Step-by-Step Procedure:
- Preparation of Sorbitol Solution: Prepare a 5% (wt/vol) D-sorbitol solution in distilled water. Sterilize by filtration through a 0.22 µm membrane and warm to 37°C before use [10].
- First Synchronization: a. Centrifuge the asynchronous culture containing a mix of parasite stages at 1,500 × g for 5 minutes. Aspirate and discard the supernatant. b. Resuspend the parasite pellet in 5 volumes of pre-warmed 5% sorbitol solution. Mix gently but thoroughly. c. Incubate the suspension in a 37°C water bath for 10–15 minutes. d. Centrifuge at 1,500 × g for 5 minutes and carefully remove the sorbitol supernatant. e. Wash the pellet twice with complete culture medium or PBS to ensure all sorbitol is removed. f. Resuspend the treated parasites in complete medium with fresh RBCs (2% hematocrit) and return to the culture flask. The surviving population will now be highly enriched for early ring-stage parasites.
- Second Synchronization: To achieve a tighter synchrony, allow the ring-stage parasites to progress through one complete intraerythrocytic cycle (approximately 40–48 hours). When the new rings appear (around 48 hours post-invasion), repeat the sorbitol treatment exactly as described in Step 2 to lys any remaining or newly formed schizonts [10]. This "double-synchronization" is critical for assays requiring a narrow developmental window.
Synchronization Quality Control
After the final synchronization step, prepare a thin blood smear, fix with methanol, and stain with Giemsa. Examine the smear under a light microscope using a 100× oil immersion objective. A successfully synchronized culture should exhibit >90% of parasites at the ring stage with uniform morphology.
Data Presentation and Standardization
Quantitative Parameters for Culture
The table below summarizes key parameters that should be documented for robust and reproducible culture conditions.
| Parameter | Target / Specification | Purpose / Rationale |
|---|---|---|
| Starting Hematocrit | 2% (for standard culture) [10] | Maintains optimal cell density for gas exchange and nutrient availability. |
| Starting Parasitemia | 0.5-1% (for sub-culture); 1% schizonts for HTS [10] | Prevents overgrowth and maintains parasites in log-phase growth. |
| Synchrony Efficiency | >90% ring-stage post-synchronization | Ensures uniformity for stage-specific drug assays. |
| Culture Gas Conditions | 1% O₂, 5% CO₂, 94% N₂ [10] | Mimics the in vivo physiological oxygen tension in the bloodstream. |
| Sorbitol Concentration | 5% (wt/vol) [10] | Proven effective for selective lysis of mature forms without excessive damage to rings. |
Applications in Flow Cytometry-Based Assays
Proper synchronization is the gateway to reliable high-throughput screening and growth inhibition assays. The following diagram illustrates how synchronized cultures feed into downstream applications.
- High-Throughput Screening (HTS): In image-based HTS against P. falciparum, cultures are synchronized at the schizont stage and then allowed to reinvade to obtain a highly synchronous population of young rings. These are dispensed into 384-well plates containing test compounds and incubated for 72 hours [10]. The use of nucleic acid stains like SYBR Green I or Hoechst 33,342 allows for automated image acquisition and analysis to determine parasite viability and growth [10].
- Growth and Resistance Phenotyping: Advanced assays like the Growth, Resistance, and Recovery Assay (GRRA) rely on synchronized ring-stage parasites to accurately measure phenotypes such as replicative viability after drug exposure (e.g., to dihydroartemisinin). The straight-from-blood SYBR Green I-based qPCR protocol provides a semi-high throughput method for phenotyping [14]. The initial synchrony is critical for standardizing the point of drug application and for interpreting the recovery and growth profiles post-treatment.
Meticulous parasite culture and synchronization are not merely preparatory steps but are integral to the validity of subsequent flow cytometry-based analyses in malaria research. The standardized protocols detailed in this application note for maintaining in vitro cultures and achieving high-grade ring-stage synchrony via sorbitol treatment provide a critical foundation. By ensuring parasite uniformity, these methods directly enhance the reproducibility, accuracy, and biological relevance of data generated in drug discovery and vaccine development pipelines. Adherence to these protocols will empower researchers to generate robust, comparable, and high-quality data in the fight against malaria.
Within malaria growth inhibition research, accurate and high-throughput assessment of parasitemia is a cornerstone for evaluating antimalarial drug efficacy and vaccine candidates. Flow cytometric enumeration of Plasmodium-infected red blood cells (RBCs) stained with SYBR Green I has emerged as a powerful alternative to conventional microscopic counting, offering enhanced speed, precision, and objectivity [22] [2] [23]. This application note details optimized protocols for SYBR Green I staining, specifically contextualized for malaria research, to support robust and reproducible growth inhibition assays.
Core Staining Optimization Parameters
The following table summarizes optimized staining parameters for SYBR Green I in various applications, including specific data for the rodent malaria parasite Plasmodium berghei.
Table 1: Optimized SYBR Green I Staining Parameters for Different Cell Types
| Cell Type / Application | Optimal SYBR Green I Concentration | Optimal Incubation Time | Optimal Incubation Temperature | Key Supporting Conditions | Primary Citation |
|---|---|---|---|---|---|
| Plasmodium berghei-Infected RBCs | 4x dilution of commercial stock | 30 minutes | Room Temperature (specified protocol) | Bidimensional FL-1/FL-3 detection; accurate for parasitemia >0.02% [22] [2] | Somsak et al. [22] |
| Microalgae (Chromochloris zofingiensis) | 0.5x dilution of commercial stock | 5 minutes | 25°C | Staining in 0.9% NaCl solution; dye concentration was the most significant factor affecting cell damage [12] | Abiusi et al. [12] |
| Aquatic Viruses | 5 x 10⁻⁵ dilution of commercial stock | 10 minutes | 80°C | Fixation with 0.5% glutaraldehyde; dilution in Tris-EDTA buffer [16] | Brussaard et al. [16] |
| Antibiotic Resistance (Bacteria) | Mixed 1:3 with Propidium Iodide (PI) | 20 minutes | Room Temperature (in dark) | Used as a viability stain in a growth-independent antibiotic susceptibility test [24] | Feng et al. [24] |
Detailed Experimental Protocols
Protocol for Flow Cytometric Enumeration ofPlasmodium berghei-Infected RBCs
This protocol is adapted for in vivo antimalarial drug screening using the rodent model parasite P. berghei [22] [2].
Materials:
- SYBR Green I nucleic acid gel stain (commercial stock, e.g., Thermo Fisher Scientific S7563)
- Infected blood sample from P. berghei-infected mice
- Phosphate-Buffered Saline (PBS) or appropriate dilution buffer
- Flow cytometer equipped with a 488-nm laser and standard filter set (e.g., FL1 530/30 nm and FL3 >620 nm)
Procedure:
- Sample Preparation: Dilute the infected mouse blood in PBS to a suitable concentration for flow cytometry analysis.
- Staining: Add SYBR Green I to the diluted blood sample to achieve a final concentration of 4x the commercial stock solution.
- Incubation: Incubate the stained sample for 30 minutes at room temperature, protected from light.
- Data Acquisition: Analyze the sample on a flow cytometer. Use a bi-dimensional plot of FL-1 (530 nm) versus FL-3 (620 nm) to accurately distinguish infected from non-infected RBCs and detect parasitemia levels as low as 0.02%.
- Analysis: The parasitemia is calculated as the percentage of SYBR Green I-positive events within the total RBC population.
General Framework for Staining Optimization Using RSM
For researchers needing to optimize SYBR Green I for a novel parasite strain or condition, Response Surface Methodology (RSM) provides a systematic approach, as demonstrated for microalgae [12].
Materials:
- SYBR Green I stock solution
- Target cell population
- Appropriate culture medium or buffer
- Flow cytometer
- Software for experimental design (e.g., Design-Expert)
Procedure:
- Define Factors and Ranges: Identify critical staining factors to optimize. Typically, these are:
- Dye Concentration (e.g., 0.5x to 10x of commercial stock)
- Incubation Time (e.g., 5 to 30 minutes)
- Incubation Temperature (e.g., 4°C to 37°C)
- Experimental Design: Utilize a Central Composite Design (CCD) within RSM to generate a set of experimental runs that efficiently explores the interaction effects between these factors.
- Response Measurement: For each experimental run, measure key responses, which usually include:
- Staining Efficiency: The percentage of the target population that is successfully stained.
- Cell Damage: The percentage of cells that are negatively affected by the staining process (e.g., loss of membrane integrity).
- Model Fitting and Analysis: Use the software to fit a statistical model to the data. This model will identify significant factors and their interactions.
- Validation: Perform a validation experiment using the optimized parameters predicted by the model to confirm the results.
The Scientist's Toolkit: Essential Research Reagents
Table 2: Key Reagents for SYBR Green I-based Flow Cytometry in Malaria Research
| Item | Function/Application | Example Usage & Notes |
|---|---|---|
| SYBR Green I Nucleic Acid Stain | High-affinity dye for double-stranded DNA; penetrates cell membranes. | Core stain for detecting DNA-containing parasites within anucleated RBCs; excited by 488-nm laser [22] [2]. |
| Propidium Iodide (PI) | Impermeant dye staining dead/damaged cells. | Used in combination with SYBR Green I for viability assessment (e.g., in antibiotic resistance tests) [24]. |
| Anti-CD45 Antibody | Pan-leukocyte marker. | Critical for excluding nucleated white blood cells and erythroblasts from analysis in whole blood, preventing false positives [3]. |
| Glutaraldehyde | Fixative. | Preserves sample integrity (e.g., used at 0.5% final concentration for virus staining); note: may not be required for all protocols [16] [25]. |
| Tris-EDTA (TE) Buffer | Dilution medium. | Optimal diluent for SYBR Green I staining of viruses and other particles; helps maintain staining consistency [16]. |
| Dihydroethidium / Hydroethidine | Cell-permeant dye converted to ethidium in viable cells. | Used in multi-color staining protocols to differentiate parasite stages and identify reticulocytes based on RNA content [3]. |
Workflow and Decision Pathway
The following diagram illustrates the logical workflow for establishing a robust SYBR Green I staining protocol for malaria growth inhibition assays.
Critical Considerations for Malaria Research
When applying SYBR Green I staining in the context of malaria growth inhibition, several factors are paramount:
- Distinguishing Non-Target Cells: In whole blood samples, nucleated white blood cells and RNA-containing reticulocytes can be stained by nucleic acid dyes and mistaken for infected RBCs. Incorporating an anti-CD45 antibody to identify and exclude leukocytes, and using an RNA-selective dye like hydroethidium, is essential for accurate parasitemia measurement [3] [23].
- Signal Stability: The SYBR Green I fluorescent signal is stable for several hours after the incubation period, allowing for batch processing and analysis of multiple samples without significant signal degradation [22].
- Lysis Conditions: While some protocols for other microorganisms involve enzymatic lysis of cell walls (e.g., using lyticase for fungi [26]), this is generally not required for Plasmodium-infected RBCs. The dye readily penetrates the RBC and parasite membranes. The primary "lysis" condition to optimize is the potential use of fixatives like glutaraldehyde, which can enhance virus detection [16] [25] but may not be necessary for all malaria blood-stage protocols.
Within malaria research, accurate quantification of parasitemia is fundamental for assessing parasite biology, drug susceptibility, and vaccine efficacy. Flow cytometry has emerged as a powerful alternative to light microscopy, offering greater objectivity, throughput, and the ability to distinguish complex infection phenotypes [9] [3]. This application note details the establishment of robust gating strategies for identifying Plasmodium-infected red blood cells (iRBCs) using SYBR Green I staining, framed within the context of malaria growth inhibition studies. The protocols and strategies herein are designed to provide researchers and drug development professionals with reliable methods to quantify parasite multiplication rates and investigate invasion mechanisms [9] [17].
Gating Strategy Fundamentals
A hierarchical gating strategy is critical for accurately resolving iRBCs from other cellular elements in stained blood samples. The following workflow outlines the core sequence of gates.
The initial gate (G1) on Forward Scatter-Area (FSC-A) versus Side Scatter-Area (SSC-A) eliminates debris and identifies the main population of red blood cells based on their size and granularity [3]. Subsequent gating on FSC-A versus FSC-Height (FSC-H) is crucial for excluding doublets or cell aggregates, ensuring that only single cells are analyzed for DNA content [3] [27]. In whole blood samples, the use of a CD45- gate is highly recommended to exclude white blood cells and nucleated erythroblasts, which are also stained by DNA-binding dyes and can be mistaken for iRBCs [3]. The final analytical gate identifies the SYBR Green I-positive (DNA+) population, which corresponds to iRBCs. This gate can further resolve sub-populations of singly-infected and multiply-infected erythrocytes based on fluorescence intensity [9].
Key Protocols and Methodologies
SYBR Green I Staining for Parasitemia and Multiplicity of Infection
This protocol enables the simultaneous determination of parasitemia and the number of multiply-infected erythrocytes, which is essential for calculating the Parasite Multiplication Rate (PMR) and Selectivity Index (SI) [9].
- Parasite Culture: Maintain P. falciparum asexual stages in human erythrocytes at 4% hematocrit in complete RPMI-1640 medium. For invasion assays, use sorbitol-synchronized, ring-stage parasites [9].
- Staining Procedure:
- Pellet 200 µL of parasite culture (approx. 1% parasitemia) in a 96-well plate via centrifugation (1,200 rpm for 5 minutes).
- Wash cells twice with 100 µL of 1X PBS containing 0.5% BSA and 0.02% sodium azide.
- Incubate with 75 µL of a 1:1000 dilution of SYBR Green I in the dark for 20 minutes at 25°C.
- Wash cells once in the same buffer and resuspend in PBS for acquisition [9].
- Flow Cytometry Data Acquisition: Collect data using a flow cytometer equipped with a 488 nm laser. Acquire a minimum of 100,000 events per sample. Use unstained, uninfected erythrocytes for initial gating to account for autofluorescence [9].
- Analysis: The DNA-positive population will display distinct peaks corresponding to erythrocytes harboring one (singly-infected), two (doubly-infected), or three (triply-infected) parasites. Erythrocytes with more than three parasites are typically not well-resolved [9].
Tri-Color Flow Cytometry for Whole Blood Analysis
This method is suitable for analyzing field samples or in vivo infections, as it effectively discriminates iRBCs from leukocytes and reticulocytes [3].
- Sample Preparation: Dilute 1 µL of fresh whole blood (human or mouse) in 100 µL of PBS.
- Staining: Add anti-CD45 antibody (e.g., conjugated to APC) to identify leukocytes, along with DNA dyes such as dihydroethidium and Hoechst 33342. Incubate for 20 minutes at room temperature, protected from light [3].
- Data Acquisition and Analysis: After applying the standard gating hierarchy (debris exclusion -> singlets), use a CD45/Hoechst dot plot to identify and gate out CD45+ leukocytes. The iRBCs are then identified as the CD45-negative, Hoechst-positive (DNA-positive) population [3].
48-Hour Growth Inhibition Assay (GIA)
This protocol is designed for high-throughput screening of antimalarial compounds or inhibitory antibodies [28].
- Assay Setup:
- Prepare a dilution series of the test compound in a 96-well plate using complete RPMI medium.
- Add an equal volume of parasite culture to each well to achieve a final parasitemia of 0.5-1% and a hematocrit of 2%.
- Include controls for 100% parasite growth (no drug) and 100% killing (high-dose drug).
- Incubate the plate for 48 hours at 37°C in a gaseous environment of 1% O2, 5% CO2, and 94% N2 [28].
- Endpoint Staining and Analysis:
- After incubation, add 100 µL of a lysis buffer containing SYBR Green I (0.1 µL/mL) directly to each well. Mix thoroughly until no red blood cell sediment remains.
- Incubate the plate in the dark for 1 hour at room temperature.
- Measure fluorescence using a plate reader (excitation: 485 nm, emission: 530 nm) [28].
- Calculate the percentage of growth inhibition by normalizing fluorescence values to the 100% growth and 100% killing controls. Fit dose-response curves to determine IC50 values [28].
Critical Experimental Parameters and Validation
Optimizing Fluorescence Signal
Optimal staining conditions are paramount for assay sensitivity. Key findings from optimization studies are summarized below.
Table 1: Key Parameters for SYBR Green I Assay Optimization
| Parameter | Effect on Assay | Recommended Optimization | Source |
|---|---|---|---|
| Incubation Time | Fluorescence signal increases with longer incubation. | Freeze-thaw culture, then incubate with lysis buffer/SYBR Green I for 3 hours in the dark for maximum signal. | [29] |
| Hematocrit | High hematocrit can quench fluorescence. | Use a final hematocrit of 1.5% to 2% for drug assays. An optimal signal-to-noise ratio is achieved up to 6.5% hematocrit. | [29] [30] |
| Sample Type | White blood cells (WBCs) cause high background. | For whole blood, use a CD45- gate to exclude WBCs. Where possible, use WBC-free erythrocyte concentrates for higher sensitivity. | [3] [30] |
| Parasite Stage | Trophozoite/Schizont DNA replication confounds multiplicity analysis. | Use tightly synchronized ring-stage parasites. Late-stage parasites have higher DNA content, preventing resolution of infection multiplicity. | [9] |
Assay Validation and Performance
The SYBR Green I flow cytometry method has been rigorously validated against traditional microscopy.
Table 2: Validation Metrics of SYBR Green I Flow Cytometry
| Metric | Performance | Context and Notes | Source |
|---|---|---|---|
| Correlation with Microscopy | High linear correlation (R² = 0.9925) | Observed for parasitemia measurement in serially diluted laboratory strains. | [9] |
| Limit of Detection (LOD) | 0.2% parasitemia (WBC-free culture) | LOD increases to ~0.55% in whole blood due to background from leukocyte DNA. | [9] [30] |
| Multiplicity Resolution | Can resolve singly-, doubly-, and triply-infected RBCs. | Critical for calculating the Selectivity Index (SI). Requires ring-stage parasites. | [9] |
| Utility in Field Isolates | Good concordance with microscopy for ex vivo samples. | Accurately measures parasitemia and detects multiple invasion events in wild isolates. | [9] |
The Scientist's Toolkit
A list of essential reagents and materials required for setting up these experiments is provided below.
Table 3: Essential Research Reagents and Materials
| Item | Function/Application | Example/Catalog |
|---|---|---|
| SYBR Green I | Asymmetrical cyanine dye that binds dsDNA; stains parasite nucleic acid. | Molecular Probes S-7563 (10,000X stock in DMSO) [9] [28] |
| Hoechst 33342 | Cell-permeant DNA dye; used in multi-color staining strategies. | Thermo Fisher Scientific (H3570) [31] [3] [27] |
| Anti-CD45 Antibody | Pan-leukocyte marker; critical for excluding WBCs in whole blood analysis. | APC-conjugated, clone 30-F11 [3] |
| RPMI-1640 Medium | Base medium for parasite culture and assay setup. | Sigma-Aldrich R5886 [9] [17] |
| Albumax II | Lipid-rich bovine serum albumin; used as a serum substitute in culture medium. | Gibco 11021-045 [9] [17] |
| Saponin-based Lysis Buffer | Lyses erythrocytes to release parasite DNA for plate-based assays. | 20 mM Tris, 5 mM EDTA, 0.008% saponin, 0.08% Triton X-100 [29] |
Troubleshooting and Diagrammatic Workflow
Common challenges include poor signal-to-noise ratio and inability to resolve multiply-infected cells. To address low fluorescence, incorporate a freeze-thaw step prior to staining and extend the incubation time with the dye [29]. If multiply-infected cells cannot be resolved, ensure cultures are highly synchronized at the ring stage, as later stages replicate DNA, confounding fluorescence intensity-based interpretation [9]. High background in whole blood samples can be mitigated by using an anti-CD45 antibody to gate out leukocytes [3].
The following diagram integrates the key experimental and analytical steps into a complete workflow for a growth inhibition assay.
The measurement of parasite growth and inhibition is fundamental to malaria research, particularly in the development of new drugs and vaccines. SYBR Green I-based flow cytometry has emerged as a robust, high-throughput method to quantify parasitemia and assess inhibitory effects, overcoming the limitations of traditional microscopy, which is time-consuming and subjective [9]. This fluorescent nucleic acid stain binds to parasite DNA within infected red blood cells (RBCs), allowing for precise, automated quantification of parasitemia and the distinction between different stages of intraerythrocytic development [4] [3]. The application of this method is crucial for determining key pharmacological parameters: the Parasite Multiplication Rate (PMR), which measures the fold-increase in parasitemia after each asexual cycle, and the Growth Inhibition Activity (GIA), which quantifies the inhibitory effects of antibodies or drugs as a percentage [17] [9]. This protocol details the application of SYBR Green I flow cytometry for these calculations within the context of malaria growth inhibition research.
Core Principles of the Assay
The clinical symptoms of malaria are a direct consequence of the blood stage of the Plasmodium life cycle, where merozoites invade RBCs, undergo asexual multiplication, and rupture the host cell to release new merozoites [17]. The SYBR Green I flow cytometry assay targets this stage. The dye exhibits a strong preference for double-stranded DNA and, due to the lack of DNA in mature erythrocytes, any fluorescence signal detected is directly attributable to the presence of the parasite [9]. This allows for the direct counting of infected RBCs and, because the fluorescence intensity is proportional to DNA content, can help resolve different parasite stages and even identify multiply-infected erythrocytes [4] [9].
The two primary readouts from this method are:
- Parasite Multiplication Rate (PMR): An absolute measure of parasite growth, calculated from the fold-change in parasitemia between cycles. It is essential for studying parasite fitness and the asexual blood-stage activity of antimalarial compounds [17] [9].
- Percent Growth Inhibition (GIA): A relative measure used to determine the efficacy of inhibitory agents, such as candidate vaccines or drugs, by comparing parasitemia in treated samples to control samples [17] [5].
Comparative Assay Methods
While SYBR Green I flow cytometry is a powerful technique, researchers should be aware of alternative methods. The table below summarizes the key assays used in malaria growth inhibition studies.
Table 1: Comparison of Malaria Growth and Inhibition Assays
| Assay Method | Principle of Detection | Key Outputs | Advantages | Limitations |
|---|---|---|---|---|
| SYBR Green I Flow Cytometry [4] [17] [9] | Fluorescent staining of parasite DNA | PMR, Percent Inhibition, Multiply-infected RBCs | High-throughput, objective, provides absolute parasite counts, can distinguish parasite stages. | Requires a flow cytometer; mature reticulocytes can cause background staining. |
| Lactate Dehydrogenase (LDH) Activity [17] [5] | Detection of parasite-specific LDH enzyme activity | Percent Inhibition | Simpler protocol, no specialized equipment beyond a plate reader. | Measures enzyme activity, not direct parasite count; provides only relative growth rates. |
| Light Microscopy [3] | Visual identification of Giemsa-stained parasites | PMR, Parasite Staging | Considered the gold standard; allows for species identification and detailed staging. | Low-throughput, labor-intensive, subjective, prone to inter-observer variability. |
Figure 1: A generalized workflow for conducting growth inhibition assays using SYBR Green I and flow cytometry.
Experimental Protocol
Materials and Reagents
Table 2: Essential Research Reagent Solutions
| Item | Function / Description | Example / Source |
|---|---|---|
| SYBR Green I | Nucleic acid gel stain that binds parasite DNA for fluorescence detection. | Life Technologies, Sigma-Aldrich S9430 [4] [17] |
| Culture Media | Supports in vitro parasite growth. Typically RPMI-1640 with supplements. | RPMI-1640 supplemented with HEPES, Albumax II, hypoxanthine [17] [9] |
| Parasite Strain | Asexual blood-stage parasites. | P. falciparum (e.g., 3D7) or P. knowlesi (e.g., A1-H.1) [17] [3] |
| Human RBCs | Host cells for parasite invasion and growth. | Duffy positive (Fy+) RBCs for P. knowlesi [17] |
| Fixative | Stabilizes cells for flow cytometry analysis. | 4% paraformaldehyde with 0.4% glutaraldehyde [17] |
| Anti-CD45 Antibody | Pan-leukocyte marker to exclude white blood cells from analysis. | Critical for accurate parasitemia determination in whole blood [3] |
| Nycodenz | Density gradient medium for synchronizing parasites via schizont purification. | Progen 1002424 [17] |
Step-by-Step Procedure
A. Parasite Culture and Synchronization
- Maintain cultures of the desired Plasmodium species (e.g., P. falciparum or P. knowlesi) in human RBCs at a suitable hematocrit (e.g., 2-4%) in complete RPMI medium, gassed with a mixture of 90% N₂, 5% O₂, and 5% CO₂ at 37°C [17] [9].
- To obtain a synchronous population, purify schizonts using a density gradient. Transfer 5 ml of a 55% Nycodenz working solution to a 15 ml conical tube. Pellet a high-parasitemia culture (900 × g, 4 min), resuspend the pellet in RPMI at 50% hematocrit, and carefully layer onto the Nycodenz. Centrifuge (900 × g, 15 min). The schizonts will form a layer at the interface, which can be collected and washed [17].
- The resulting synchronized ring-stage parasites are used to initiate the assay.
B. Assay Setup for Growth and Inhibition
- Plate the synchronized parasites in a 96-well tissue culture plate. For multiplication assays, dilute parasites to a known starting parasitemia (e.g., 0.1-1.0%) [9]. For inhibition assays, incubate parasites with serial dilutions of test compounds or inhibitory antibodies [17].
- Include essential controls: untreated parasite control (for PMR calculation), uninfected RBC control (for background fluorescence), and if applicable, a drug control (e.g., a known potent antimalarial to confirm assay validity) [17].
- Incubate the assay plate for a predetermined period, typically 48-72 hours, covering one or more full intraerythrocytic cycles. Maintain appropriate gas conditions throughout.
C. Staining and Flow Cytometry
- After incubation, transfer a sample (e.g., 200 µl) from each well to a corresponding well in a 96-well round-bottom plate.
- Pellet the cells by centrifugation (e.g., 1200 rpm for 5 min) and wash twice with 100 µl of 1x PBS containing 0.5% BSA [9].
- Resuspend the cell pellet in 75 µl of a 1:1000 dilution of SYBR Green I in PBS. Incubate for 20 minutes at 25°C in the dark [9].
- Wash the cells once to remove excess dye and resuspend in PBS for acquisition.
- Acquire data on a flow cytometer (e.g., BD LSR-II) equipped with a 488 nm laser, collecting a minimum of 100,000 events per sample. Use the FITC channel for SYBR Green I detection [17] [9].
Figure 2: A simplified gating strategy for identifying SYBR Green I-positive infected red blood cells while excluding debris and cell aggregates.
Data Analysis and Calculations
Quantifying Parasitemia
After data acquisition, analyze the flow cytometry files using software such as FlowJo or FACSDiva.
- Apply the gating strategy shown in Figure 2 to select single cells and exclude debris and aggregates.
- Create a histogram or dot plot of the FITC (SYBR Green I) signal. Using the uninfected RBC control, set a fluorescence threshold to distinguish positive (infected) from negative (uninfected) events.
- The parasitemia (% infected RBCs) for a sample is calculated as:
Parasitemia = (Number of SYBR Green I positive events / Total number of RBC events) × 100% [9] [3].
Calculating Parasite Multiplication Rate (PMR)
The PMR is the fold-increase in parasitemia over one cycle of invasion and growth [9].
- Determine the initial parasitemia (%P₀) at the start of the assay (T=0).
- Determine the final parasitemia (%P_f) in the untreated control culture after one full cycle (e.g., 48 hours for P. falciparum).
- Calculate the PMR using the formula:
PMR = %P_f / %P₀
This calculation can be extended over multiple cycles to determine the cumulative multiplication rate.
Calculating Percent Growth Inhibition (% GIA)
The percent inhibition quantifies the effect of a test compound or antibody relative to the untreated control [17].
- Determine the parasitemia in the test sample (%Psample) and in the untreated control (%Pcontrol) after the assay incubation.
- Calculate the % GIA using the formula:
% GIA = [1 - (%Psample / %Pcontrol)] × 100%
A value of 100% indicates complete inhibition of parasite growth, while 0% indicates no effect.
Table 3: Example Data Set for PMR and GIA Calculation
| Sample | Initial Parasitemia (%P₀) | Final Parasitemia (%P_f) | PMR | % GIA |
|---|---|---|---|---|
| Untreated Control | 0.5% | 2.5% | 5.0 | -- |
| Test Antibody 10 µg/mL | 0.5% | 1.0% | 2.0 | 60% |
| Test Drug 100 nM | 0.5% | 0.6% | 1.2 | 76% |
| Maximum Inhibition Control | 0.5% | 0.5% | 1.0 | 100% |
Troubleshooting and Methodological Considerations
- Synchronization: The accuracy of the PMR calculation and the ability to resolve multiply-infected erythrocytes are highly dependent on using tightly synchronized ring-stage parasites [9]. Trophozoites and schizonts with higher DNA content can be misclassified as multiple infections.
- Specificity in Whole Blood: When working with whole blood samples from patients or animal models, the presence of nucleated cells like leukocytes and erythroblasts can lead to false positives, as they also stain with DNA dyes. Including an anti-CD45 antibody to identify and exclude leukocytes is critical for robust parasitemia measurement in these contexts [3].
- Assay Linearity and Range: The SYBR Green I flow cytometry method demonstrates a high linear correlation with microscopy (R² > 0.99) and has a limit of detection for parasitemia as low as 0.2% [9]. However, microscopic validation is recommended when establishing the assay in a new laboratory.
- Dye Concentration and Staining: Optimization of SYBR Green I concentration and staining time is necessary to achieve a strong signal-to-noise ratio while minimizing background fluorescence. The described protocol (1:1000 dilution for 20 min) serves as a reliable starting point [4] [9].
The adaptation of the SYBR Green I-based flow cytometry assay across different Plasmodium species is a critical methodological advancement in malaria research. This protocol enables high-throughput, quantitative assessment of parasite growth and inhibition, which is essential for drug and vaccine development [9] [32]. While the core principle of using a DNA-binding dye to detect parasitized erythrocytes remains consistent, key modifications are required to account for species-specific biological differences, particularly variations in life cycle length, host cell preference, and invasion mechanisms [17] [33]. This application note details the standardized protocols for applying this assay to P. falciparum, P. knowlesi, and surrogate species, providing researchers with a framework for reliable, cross-species comparative studies.
Core Principles of the SYBR Green I Assay
The SYBR Green I-based flow cytometry assay leverages the fundamental biological difference between uninfected and infected red blood cells (RBCs)—the presence of parasite DNA [33]. SYBR Green I is a cyanine dye that exhibits high avidity for double-stranded DNA, with an 11-fold greater preference for double-stranded over single-stranded DNA and low binding affinity for RNA [9]. When excited by a 488-nm argon laser, it emits fluorescence in the FL-1 channel (530/30 nm), allowing for precise detection and quantification of DNA-containing parasites within anucleate erythrocytes [4] [2].
A significant advantage of this method is its ability to resolve multiply-infected erythrocytes, providing data on both parasitemia (percentage of infected RBCs) and the total number of intracellular parasites, which is crucial for calculating invasion efficiency and parasite multiplication rates [9]. The assay avoids the subjectivity and time-intensive nature of manual microscopy and eliminates the need for radioactivity required in traditional hypoxanthine incorporation assays [33]. Furthermore, as a one-step staining procedure that doesn't require fixation, it is particularly suited for high-throughput screening applications [32].
Species-Specific Protocol Adaptation
1Plasmodium falciparumProtocol
Culture and Synchronization
- Culture Conditions: Maintain P. falciparum asexual stages in human O+ erythrocytes at 4% hematocrit in complete RPMI-1640 media supplemented with 25 mM HEPES, 0.21% sodium bicarbonate, 50 mg/L hypoxanthine, and 0.5% Albumax II [9].
- Synchronization: Achieve synchronization using sorbitol lysis to obtain ring-stage parasites for invasion assays [9]. This ensures developmental homogeneity, which is critical for accurate flow cytometric analysis.
Staining and Analysis
- Staining Protocol: Incubate 200 µL of parasite culture with 75 µL of 1:1000 SYBR Green I dilution for 20 minutes at 25°C in the dark [9].
- Washing and Analysis: Wash cells twice in 1× PBS + 0.5% BSA + 0.02% sodium azide, resuspend in PBS, and acquire data using a flow cytometer with a 488-nm excitation laser [9]. Collect a minimum of 100,000 events per sample for statistical reliability.
- Gating Strategy: Initial gating should be performed using unstained, uninfected erythrocytes to account for autofluorescence. Infected RBCs are identified based on significantly higher fluorescence intensity in the FL-1 channel [9].
2Plasmodium knowlesiProtocol
Culture and Synchronization
- Culture Conditions: Culture P. knowlesi parasites in Duffy-positive (Fy+) human red blood cells at 2% hematocrit in custom modified RPMI media [17]. Maintain cultures in a flask gassed with a mixture of 90% N₂, 5% O₂, and 5% CO₂ at 37°C.
- Synchronization: Synchronize via purification with Nycodenz. Transfer 5 mL of 55% Nycodenz working solution to a 15 mL conical tube, pellet a high parasitemia (4-10%) culture, and resuspend the parasite pellet at 50% hematocrit in RPMI before layering over Nycodenz [17].
Staining and Analysis
- Staining Protocol: Use a similar SYBR Green I staining approach as for P. falciparum, but note that P. knowlesi has a shorter life cycle (24 hours versus 48 hours for P. falciparum), requiring adjusted incubation times for invasion/multiplication assays [17].
- Applications: This protocol is particularly valuable for studying invasion mechanisms relevant to P. vivax, as P. knowlesi serves as an experimentally tractable surrogate with shared biological features [17].
Surrogate Species:Plasmodium bergheiProtocol
Staining Optimization
- Optimal Staining: For flow cytometric enumeration of P. berghei-infected mouse RBCs, use SYBR Green I at a 4× concentration for 30 minutes [2].
- Detection Method: Employ a bi-dimensional FL-1530/FL-3620 detection method, which accurately detects parasitemia above 0.02% [2].
Validation
- This protocol has been validated in antimalarial assays, showing comparable results to conventional microscopic counting, thus providing a rapid and precise tool for high-throughput in vivo drug screening [2].
Comparative Protocol Parameters
Table 1: Key Parameters for SYBR Green I Flow Cytometry Across Plasmodium Species
| Parameter | P. falciparum | P. knowlesi | P. berghei |
|---|---|---|---|
| Host RBC Type | Human O+ | Duffy-positive human | Mouse (ICR) |
| Life Cycle Duration | 48 hours | 24 hours | 24 hours |
| Optimal SYBR Green I Concentration | 1:1000 dilution | Similar to P. falciparum | 4× concentration |
| Staining Duration | 20 minutes | 20 minutes (adjusted life cycle) | 30 minutes |
| Detection Limit | 0.2% parasitemia [9] | Not specified | 0.02% parasitemia [2] |
| Primary Applications | Drug screening, invasion studies, vaccine development | P. vivax surrogate studies, drug testing | In vivo drug screening, rodent model studies |
Quantitative Data Comparison
Table 2: Performance Metrics of SYBR Green I Assay Across Applications
| Assay Type | Correlation with Microscopy | Limit of Detection | Key Advantages |
|---|---|---|---|
| P. falciparum Growth Inhibition | R² = 0.9925 [9] | 0.2% parasitemia [9] | Distinguishes singly vs. multiply-infected RBCs |
| P. berghei Drug Screening | Comparable to microscopic counting [2] | 0.02% parasitemia [2] | Suitable for in vivo samples, high precision |
| Invasion Assay (P. falciparum) | High concordance for multiply-infected RBCs [9] | Not specified | Measures PMR and SI simultaneously |
| Sporozoite Invasion Assay | 90% of sorted cells show intracellular parasites [34] | Not specified | Quantitative, medium-throughput for liver stages |
Workflow Diagram
The Scientist's Toolkit
Table 3: Essential Research Reagents and Materials
| Reagent/Material | Function/Application | Species Specificity |
|---|---|---|
| SYBR Green I | DNA-specific fluorescent dye for detecting parasitized RBCs | Universal for Plasmodium species [4] [9] [2] |
| Human O+ Erythrocytes | Host cells for P. falciparum culture | P. falciparum-specific [9] |
| Duffy-positive Human RBCs | Essential for P. knowlesi invasion | P. knowlesi-specific [17] |
| Mouse RBCs (ICR strain) | Host cells for P. berghei infection | P. berghei-specific [2] |
| RPMI-1640 Complete Media | Base culture medium for parasite maintenance | Universal with species-specific supplements [9] [17] |
| Sorbitol | Synchronization agent for ring-stage parasites | Primarily P. falciparum [9] |
| Nycodenz | Density gradient medium for parasite synchronization | P. knowlesi and other species [17] |
| Albumax II | Serum substitute for culture media | Universal |
| Hypoxanthine | Essential nucleic acid precursor | Universal |
Troubleshooting and Technical Considerations
Critical Assay Parameters
- Developmental Stage Dependency: The precision of distinguishing multiply-infected erythrocytes requires analysis at the ring stage. During later stages (trophozoites, schizonts), DNA replication begins, making it difficult to distinguish between erythrocytes harboring multiple ring-stage parasites versus those with a single, more mature parasite [9].
- Sample Quality: For field isolates or clinical samples, note that some isolates may not grow as synchronously as laboratory-adapted cultures. A small proportion of parasites may arrest at later developmental stages, which can be addressed by labeling acceptor erythrocytes with a dye such as FITC to distinguish donor from acceptor erythrocytes [9].
- Instrument Calibration: Regular calibration with unstained and uninfected RBC controls is essential to establish proper gating boundaries and account for autofluorescence [9] [33].
Advanced Applications
- Invasion Phenotyping: This method enables simultaneous determination of parasitemia and the number of multiply-infected erythrocytes, allowing for nuanced invasion phenotype analysis, including calculation of Parasite Multiplication Rate (PMR) and Selectivity Index (SI) [9].
- Drug Resistance Screening: The assay's quantitative nature and compatibility with 96-well formats make it ideal for high-throughput screening of compound libraries against blood-stage parasites [32].
- Antibody Inhibition Studies: The method can separate parasite invasion from growth, making it suitable for evaluating functional antibody responses in vaccine studies, particularly through invasion inhibition assays [9] [33].
The adaptation of SYBR Green I-based flow cytometry protocols across P. falciparum, P. knowlesi, and surrogate species like P. berghei represents a significant advancement in malaria research methodology. While maintaining a standardized core approach, researchers must implement specific modifications to account for species-specific biological characteristics, particularly regarding host cell selection, life cycle timing, and optimal staining conditions. The detailed protocols and comparative analysis provided in this application note offer researchers a robust framework for implementing these assays in diverse research contexts, from basic parasite biology to applied drug and vaccine development. The high reproducibility, quantitative output, and medium-throughput capacity of these optimized protocols will continue to accelerate malaria research and therapeutic development.
Enhancing Assay Performance: Troubleshooting Common Pitfalls and Optimization Strategies
In malaria growth inhibition research, SYBR Green I flow cytometry is a cornerstone technique for quantifying parasitemia. However, the accuracy of these assays is frequently compromised by background fluorescence originating from cellular debris and the formation of dye aggregates. This background signal can obscure true positive events, leading to inaccurate quantification of parasite viability and, consequently, unreliable assessment of drug efficacy. Addressing these sources of noise is therefore not merely a technical exercise but a fundamental requirement for generating robust, reproducible data in anti-malarial drug development. This application note details the sources of this interference and provides validated protocols to mitigate it, ensuring data of the highest quality.
Background interference in flow cytometry can be categorized into two primary types, each requiring a distinct resolution strategy. The table below summarizes the characteristics and primary solutions for these interference types.
Table 1: Characteristics and Solutions for Major Types of Background Interference
| Interference Type | Source | Impact on Data | Primary Solution |
|---|---|---|---|
| Cellular Debris | Fragments of ruptured cells or platelets containing nucleic acids [35]. | False positive events in the low-fluorescence region, inflating parasitemia counts [35]. | Membrane Integrity Staining (e.g., Propidium Iodide) [35] [13]. |
| Dye Aggregation | Spontaneous formation of SYBR Green I micelles in aqueous solution, especially at high concentrations [36]. | Highly fluorescent particles that are misidentified as true parasite events [36]. | Optimal staining formulation and sample processing [36] [25]. |
The Dual-Stain Approach: Discriminating Debris from True Positives
A highly effective method to exclude debris is the implementation of a dual-staining protocol using SYBR Green I alongside a viability dye such as propidium iodide (PI). The underlying principle is based on differential membrane permeability: SYBR Green I is a membrane-permeant dye that stains all nucleic acid-containing particles, including debris. In contrast, PI is impermeant to intact cell membranes and only enters cells with compromised membranes, such as dead parasites or the contents of dead host cells [35] [13].
When both dyes bind to nucleic acids within a compromised particle, a phenomenon called Fluorescence Resonance Energy Transfer (FRET) occurs. The SYBR Green I fluorescence is quenched, while the PI fluorescence is enhanced. In a flow cytometry plot, this results in a distinct population of SYBR Green I low / PI high events, which can be electronically gated out as compromised cells and debris [35] [13]. This leaves a cleaner population of SYBR Green I high / PI low events, representing intact, potentially viable parasites.
Mitigating Dye Aggregation for Cleaner Signal
Dye aggregation presents a significant challenge, as these aggregates can be intensely fluorescent and mistaken for true targets. This has been observed not only with SYBR Green I but also with other fluorescent nanoparticles [36]. A study on Mycobacterium tuberculosis detection demonstrated that false positives from nanoparticle aggregates and non-specific binding to debris could be dramatically reduced by using a two-color flow cytometric approach that combined specific antibody-conjugated nanoparticles with a general nucleic acid stain like SYBR Green I [36]. The SYBR Green I signal served to identify nucleic acid-containing particles, helping to differentiate true bacterial targets from non-biological aggregates. This principle can be adapted for malaria research by ensuring optimal staining conditions to prevent aggregate formation.
Furthermore, research on flow virometry has shown that protocol factors such as stain concentration, incubation temperature and time, and the use of additives like glutaraldehyde can significantly impact the separation of the target signal from the background [25]. Optimizing these parameters is crucial for minimizing non-specific signal.
Optimized Experimental Protocols
Debris Exclusion via SYBR Green I and Propidium Iodide Dual Staining
This protocol is adapted from methods successfully used to analyze microbiota in mosquito midguts and bacterial viability in aquatic samples [35] [13].
dot code for Experimental Workflow: Dual-Stain Debris Exclusion
Graphical Workflow Title: Experimental Workflow: Dual-Stain Debris Exclusion
Materials:
- SYBR Green I nucleic acid stain (e.g., Invitrogen S7563)
- Propidium Iodide (PI) stock solution (e.g., 1 mg/mL)
- Phosphate-Buffered Saline (PBS) or appropriate assay buffer
- Fixed or live Plasmodium-infected red blood cell culture
- Flow cytometer with 488 nm excitation and filters for FITC (530/30 nm) and PE/PI (585/42 nm or 610/20 nm)
Procedure:
- Sample Preparation: Prepare your infected erythrocyte sample according to your standard assay procedure (e.g., after drug treatment).
- Staining Solution: Prepare a master staining solution in PBS containing a 1:10,000 dilution of SYBR Green I and a final concentration of 10 µg/mL PI [35].
- Staining: Resuspend the cell pellet in the staining solution. Incubate for 30 minutes in the dark at room temperature [35].
- Data Acquisition: Analyze the sample on the flow cytometer without washing. Collect a sufficient number of events, typically 50,000 to 100,000.
- Data Analysis:
Protocol to Minimize Dye Aggregation and Background
This protocol integrates strategies from virometry and bacterial detection to optimize staining specificity [36] [25].
Materials:
- SYBR Green I nucleic acid stain
- Tris-EDTA (TE) Buffer or PBS
- Glutaraldehyde (electron microscopy grade)
- 0.2 µm syringe filters
Procedure:
- Stock Solution Handling: Always thaw and store SYBR Green I stock solution as recommended by the manufacturer. Avoid repeated freeze-thaw cycles.
- Stain Dilution: To prevent aggregation, dilute the SYBR Green I stock concentrate directly into the assay buffer immediately before use. Do not prepare highly concentrated intermediate stocks. A final working dilution of 1:10,000 is recommended for bacterial systems and can serve as a starting point for malaria assays [35].
- Sample Fixation (Optional but Recommended): Fixing samples with glutaraldehyde can enhance the target signal and improve population resolution. Based on flow virometry optimization, add glutaraldehyde to a final concentration of 0.2% - 0.5% to the cell sample and incubate for 5-10 minutes before staining [25]. Note: Test fixation compatibility with your specific parasite and assay.
- Filtration: After staining and before running on the cytometer, filter the sample through a 0.2 µm syringe filter. This step is highly effective at removing large dye aggregates and other particulate contaminants that can cause false positives and clog the instrument [36].
- Control Samples: Include a unstained control and a sample stained with SYBR Green I but no cells to quantify the level of background and aggregation directly.
The Scientist's Toolkit: Essential Reagent Solutions
The following table lists key reagents and their critical functions in overcoming background challenges in SYBR Green I-based flow cytometry.
Table 2: Key Research Reagent Solutions for Background Reduction
| Reagent | Function & Mechanism | Application Note |
|---|---|---|
| SYBR Green I | A permeant nucleic acid gel stain that binds dsDNA with >1000-fold fluorescence enhancement upon binding [37]. | The primary stain for detecting parasite DNA. Optimal dilution is critical to minimize aggregation [35] [25]. |
| Propidium Iodide (PI) | A membrane-impermeant nucleic acid intercalator. Used as a counterstain to identify dead cells and debris with compromised membranes [35] [13]. | Enables FRET-based exclusion of debris when used with SYBR Green I. Final concentration of 10 µg/mL is standard [35]. |
| Glutaraldehyde | A cross-linking fixative. Stabilizes cellular structures and can enhance the specific fluorescence signal of stained targets in flow virometry [25]. | Use at 0.2-0.5% final concentration. Must be validated for the specific malaria assay as it may affect parasite antigenicity. |
| SYTO 16 | A cell-permeant nucleic acid stain reported to be more effective than SYBR Green I for concurrent detection of algae and bacteria in complex wastewater samples [38]. | A potential alternative to SYBR Green I if background remains high in complex sample matrices. |
| Activated Charcoal | An adsorbent material used for waste removal. Binds SYBR Green I dye molecules for safe disposal [39]. | For decontamination: use 1 gram of activated charcoal per 10 liters of SYBR Green I waste solution [39]. |
Data Analysis and Gating Strategy
A logical gating strategy is paramount for accurately resolving the target parasite population. The following diagram illustrates the step-by-step process for analyzing data from a SYBR Green I/PI dual-stained sample.
dot code for Gating Strategy for Debris Exclusion
Graphical Workflow Title: Gating Strategy for Debris Exclusion
Implementation of the Gating Strategy:
- Trigger on Fluorescence: Set a threshold on the SYBR Green I channel (e.g., FL1) to ignore non-fluorescent particles and reduce file size, as demonstrated in mycobacterial counting [40].
- Light Scatter Gate (FSC vs. SSC): Gate on events based on forward (FSC) and side scatter (SSC) to exclude remaining sub-cellular debris and large aggregates. The target infected red blood cells will typically fall within a defined scatter region.
- Single Cells Gate (FSC-H vs. FSC-A): Use a plot of FSC-Height versus FSC-Area to gate on single cells and exclude doublets or clumps, which are a known source of counting inaccuracy [40].
- Viability Gate (SYBR Green I vs. PI): This is the critical step for debris exclusion. On the plot of SYBR Green I vs. PI, clearly identify the population that is high for SYBR Green I and low for PI. This gate captures the intact, viable parasites while excluding SYBR Green I low debris and PI high dead cells/debris [35] [13].
By systematically applying these protocols and analytical strategies, researchers can significantly enhance the precision and reliability of SYBR Green I flow cytometry assays, thereby strengthening the data that underpins malaria growth inhibition and drug development research.
In the context of malaria growth inhibition research, flow cytometry has emerged as a powerful tool for high-throughput screening of antimalarial compounds. The accuracy of these assays depends heavily on achieving an optimal signal-to-noise ratio, which enables clear discrimination between parasite nucleic acids and background fluorescence. This application note details protocols for optimizing laser and detector configurations for SYBR Green I-based flow cytometry within malaria drug discovery pipelines. The procedures outlined are derived from established methodologies in current literature and are framed specifically for research involving Plasmodium falciparum asexual blood stages.
The Scientist's Toolkit: Research Reagent Solutions
The table below lists essential reagents and their specific functions in SYBR Green I flow cytometry protocols for malaria research.
Table 1: Key Research Reagents for SYBR Green I Flow Cytometry
| Reagent/Material | Function/Application | Supporting Context |
|---|---|---|
| SYBR Green I | Fluorescent nucleic acid stain for detecting parasite DNA in high-throughput screening [10]. | |
| Wheat Germ Agglutinin-Alexa Fluor 488 | Counterstain for red blood cell membranes; enables distinguishing infected from uninfected cells [10]. | |
| Hoechst 33342 | Nuclear stain used in conjunction with SYBR Green I for multi-parameter analysis of parasite stages [10]. | |
| Glutaraldehyde | Fixative for sample preservation; recommended final concentration of 0.5% [16]. | |
| Dimethyl Sulfoxide (DMSO) | Solvent for compound libraries; final concentration should be minimized (e.g., ≤1%) to avoid cytotoxicity [10]. | |
| Otto's Buffer | Nuclei isolation buffer for plant/FCM; its citric acid component improves chromatin stoichiometry for dyes like SYBR Green I [41]. | |
| Tris-EDTA (TE) Buffer | Dilution medium for stained samples; pH 8.0 is optimal for SYBR Green I fluorescence signal [16]. |
Workflow for Malaria Drug Sensitivity Assays
The following diagram illustrates the core experimental workflow for an image-based antimalarial drug screening assay that incorporates the optimization steps detailed in subsequent sections.
Optimizing Staining Protocols for Maximum Signal
Proper staining is fundamental to achieving a high signal-to-noise ratio. The following table summarizes optimized staining conditions for SYBR Green I in flow cytometric applications, synthesized from multiple research contexts.
Table 2: Optimized Staining Conditions with SYBR Green I
| Parameter | Recommended Condition | Experimental Context & Impact |
|---|---|---|
| Dye Concentration | 5 × 10⁻⁵ dilution of commercial stock [16]. | Optimized for viral counting; prevents signal saturation and reduces background. |
| Incubation Temperature | 80°C [16] or room temperature (20-25°C) [10]. | High temperature enhances stain penetration and fluorescence yield. |
| Incubation Time | 10-20 minutes in the dark [10] [16]. | Ensures complete binding to dsDNA while minimizing photobleaching. |
| Dilution Medium | Tris-EDTA (TE) Buffer, pH 8.0 [16]. | Alkaline pH maximizes fluorescence signal of SYBR Green I. |
| Fixative | 0.5% glutaraldehyde (15-30 min fixation) [16]. | Preserves cell morphology with minimal impact on subsequent staining efficiency. |
Instrument Configuration for Signal-to-Noise Enhancement
Laser and Optical Filter Configuration
For SYBR Green I, which has an excitation maximum of ~494 nm and an emission maximum of ~521 nm, the standard configuration of a 488-nm argon-ion laser is ideal [16]. The emitted fluorescence is typically collected through a 530/30 nm bandpass filter (or equivalent). The trigger should be set on the green fluorescence channel to exclude debris and non-fluorescent particles [16].
Systematic Optimization of Detector Settings
The relationship between hardware settings and the resulting signal-to-noise ratio is critical. The following diagram conceptualizes this relationship and the key parameters involved.
A practical, step-by-step protocol for this optimization is as follows:
- Prepare Control Samples: Include an unstained culture of uninfected red blood cells and a sample of SYBR Green I-stained, infected red blood cells.
- Initial Laser and Detector Setup:
- Set the instrument's laser power to a standard level for FITC detection (e.g., 15mW for a 488-nm laser).
- Begin with the PMT voltage for the green (FITC) detector at a median setting, for instance, 500 V.
- Adjust PMT Voltage:
- Run the unstained control and record the background fluorescence. The population should be positioned on the leftmost side of the histogram.
- Run the stained sample. Increase the PMT voltage until the positive signal from infected RBCs is clearly separated from the unstained population and is within the dynamic range of the detector. Avoid saturating the signal.
- Set Thresholding:
- Apply a threshold on the green fluorescence channel. Adjust the threshold level to exclude the bulk of the events from the unstained control while retaining the positive population from the stained sample. This effectively removes particulate noise and ensures the instrument triggers only on fluorescent events of interest [16].
- Verify with Biological Controls: Use a known drug-sensitive parasite strain (e.g., 3D7) treated with a potent antimalarial as a negative control for growth, and an untreated culture as a positive control. The optimized settings should yield a clear distinction between these two populations.
Application in Antimalarial High-Throughput Screening
In a validated HTS campaign, the application of optimized flow cytometry is crucial. One study used an image-based screening method with SYBR Green I and other fluorescent stains to screen an in-house library of 9,547 compounds against P. falciparum [10]. The high-resolution imaging and analysis, dependent on a strong signal-to-noise ratio, allowed for the selection of 256 hit compounds from a primary screen. Subsequent dose-response analyses confirmed 157 compounds with IC₅₀ values less than 1 µM, demonstrating the effectiveness of a well-optimized detection system in identifying potent antimalarial agents [10].
In the pursuit of novel antimalarial therapeutics, SYBR Green I flow cytometry has become an indispensable tool for high-throughput screening of compound libraries and evaluation of parasite growth inhibition [5]. The reliability of these assays, however, is fundamentally dependent on the consistency of nucleic acid staining, which can be significantly compromised by variations in parasite lysis and dye permeability. Inconsistent staining not only introduces experimental variability but can also lead to misinterpretation of drug efficacy, potentially derailing the development of promising therapeutic candidates.
This application note addresses the critical technical challenges researchers face in achieving reproducible sample preparation for SYBR Green I-based malaria assays. We present optimized, detailed protocols designed to standardize the processes of parasite lysis and dye accessibility, thereby enhancing the reliability of data generated in drug discovery workflows. By implementing these methods, researchers can minimize technical artifacts and focus on biologically significant findings in malaria growth inhibition research.
Understanding Staining Variability: Technical Challenges and Solutions
Multiple factors contribute to variable staining outcomes in flow cytometric analysis of Plasmodium parasites. Understanding these variables is the first step toward implementing effective controls:
- Dye Solvent Effects: The choice of solvent for preparing dye stock solutions can profoundly impact membrane integrity. Studies demonstrate that DMSO (dimethyl sulfoxide), a common solvent for fluorescent dyes, can progressively damage bacterial and potentially parasitic membranes during staining, leading to artifactual results. TRIS buffer has been identified as a superior alternative that avoids this membrane-compromising effect [21].
- Dye Concentration Optimization: Suboptimal propidium iodide concentrations below 3 µM result in incomplete staining of damaged cells, while concentrations exceeding 12 µM cause false-positive staining of intact cells due to membrane perturbation [21]. Similar concentration-dependent effects are observed with SYBR Green I, where excessive concentrations can increase background fluorescence and reduce the signal-to-noise ratio [12].
- Temperature and Timing Dependencies: Staining temperature significantly impacts results. Low temperatures (25°C) lead to slow reaction kinetics and incomplete staining, while high temperatures (44°C) can damage cells and cause false-positive results. An optimal temperature of 35°C provides balanced staining efficiency and membrane preservation [21]. Additionally, a minimum incubation period of 15 minutes is required for staining stability, with shorter durations producing inconsistent results [21].
Impact on Malaria Drug Discovery
The implications of staining variability extend throughout the malaria drug development pipeline. In phenotypic screenings for new antimalarial chemotypes, inconsistent staining can obscure subtle growth inhibitory effects, potentially causing researchers to overlook promising compounds with novel mechanisms of action [42]. Furthermore, in artemisinin resistance monitoring using assays like the Ring-stage Survival Assay (RSA) and Growth, Resistance, and Recovery Assay (GRRA), staining artifacts could be misinterpreted as resistance phenotypes, leading to inaccurate surveillance data [14].
Optimized Staining Protocol for SYBR Green I Flow Cytometry
Reagent Preparation
- SYBR Green I Stock Solution (100X): Prepare in TRIS buffer (10 mM, pH 8.0) instead of DMSO to prevent membrane damage [21]. Aliquot and store at -20°C protected from light.
- Staining Buffer: Phosphate-buffered saline (PBS, pH 7.4) without calcium or magnesium.
- Fixative Solution (Optional): 4% paraformaldehyde with 0.4% glutaraldehyde in PBS. Note that fixation alters cell structure and prevents subsequent morphological analysis [43].
- Lysis Solution (for absolute quantification): 0.1% Triton X-100 in PBS for complete parasite membrane permeabilization [43].
Step-by-Step Staining Procedure
- Sample Preparation: Harvest Plasmodium falciparum-infected erythrocyte cultures and transfer 100 µL aliquots to 1.5 mL microcentrifuge tubes. Centrifuge at 2,000 × g for 2 minutes and carefully aspirate supernatant.
- Cell Washing: Resuspend cell pellets in 1 mL of pre-warmed (35°C) staining buffer. Repeat centrifugation and aspiration.
- Staining Application: Resuspend washed cells in 1 mL of staining buffer containing 1X SYBR Green I (diluted from TRIS-buffered stock). The optimal dilution should be determined empirically for each dye lot but typically ranges from 0.5 µM to 1X concentration [12].
- Incubation: Incubate samples for 15-20 minutes at 35°C in the dark without agitation [21]. This optimized temperature and duration ensure complete staining while preserving membrane integrity.
- Analysis: Analyze samples immediately by flow cytometry using a 488 nm excitation laser and standard FITC/530 nm emission filter set [43]. Do not wash cells after staining to prevent dye dissociation and concentration-dependent variability.
Quality Control Measures
- Threshold Setting: Set forward scatter (FSC) threshold at 10,000 to reduce contamination from cell debris [43].
- Singlet Gating: Exclude non-single cells by gating according to FSC-A versus FSC-H characteristics, followed by SSC-W versus SSC-H gating [43].
- Instrument Calibration: Include unstained and low-parasitemia controls (0.01-0.1%) in each run to verify staining sensitivity and specificity.
- Standard Curve: Prepare a dilution series of synchronized cultures (0.01%-10% parasitemia) to establish a linear correlation between fluorescence intensity and parasite burden.
Quantitative Optimization Data for Staining Parameters
Table 1: Optimized Staining Parameters for SYBR Green I in Malaria Flow Cytometry
| Parameter | Suboptimal Range | Optimal Range | Experimental Impact |
|---|---|---|---|
| Dye Solvent | DMSO | TRIS buffer | DMSO causes membrane damage; TRIS preserves integrity [21] |
| Incubation Temperature | <25°C or >44°C | 35°C | Low temps slow kinetics; high temps damage membranes [21] |
| Incubation Time | <15 minutes | 15-20 minutes | Shorter times yield unstable, incomplete staining [21] |
| Dye Concentration | Variable, lot-dependent | 0.5 µM - 1X (empirically determined) | High concentrations increase background; low concentrations reduce sensitivity [12] |
| Cell Concentration | >10^7 cells/mL | 10^6 - 10^7 cells/mL | Over-concentration causes signal quenching and flow issues |
Table 2: Troubleshooting Guide for Common Staining Issues
| Problem | Potential Causes | Solutions |
|---|---|---|
| High Background Fluorescence | Excessive dye concentration; incomplete washing; cell debris | Titrate dye concentration; include wash step; adjust FSC threshold [43] |
| Low Signal Intensity | Suboptimal dye concentration; short incubation; incorrect temperature | Optimize dye concentration; ensure 15-20 min incubation at 35°C [21] |
| Population Heterogeneity | Variable dye permeability; mixed parasite stages | Use synchronized cultures; include permeabilization step with 0.1% Triton X-100 [43] |
| Day-to-Day Variability | Dye stock degradation; temperature fluctuations | Prepare fresh dilutions; use temperature-controlled incubator [21] |
Workflow Diagram: Systematic Approach to Staining Optimization
The Scientist's Toolkit: Essential Research Reagents
Table 3: Key Research Reagent Solutions for SYBR Green I Malaria Assays
| Reagent | Function/Application | Optimization Notes |
|---|---|---|
| SYBR Green I Nucleic Acid Gel Stain | Primary DNA dye for parasite detection and quantification | Prepare stock in TRIS buffer; determine optimal dilution for each lot [21] |
| TRIS Buffer (10 mM, pH 8.0) | Solvent for dye stock preparation | Preferable to DMSO; prevents membrane damage artifacts [21] |
| Propidium Iodide | Viability staining for membrane-compromised cells | Use at 6 µM final concentration; higher concentrations cause false positives [21] |
| Triton X-100 | Detergent for complete membrane permeabilization | Use at 0.1% for absolute DNA quantification; alters cell structure [43] |
| Paraformaldehyde/Glutaraldehyde Fixative | Cell fixation for sample preservation | 4% PFA with 0.4% glutaraldehyde; prevents morphological analysis [43] |
| SYTO 9 Alternative Dye | Green fluorescent nucleic acid stain | Alternative to SYBR Green I; different permeability characteristics [12] |
| ViSafe Green (VSG) | Nucleic acid-binding dye for viable cells | Fixation-free method; allows subsequent morphological study [43] |
Advanced Applications in Malaria Drug Discovery
Integration with Growth Inhibition Assays
The optimized staining protocol directly enhances key assays in antimalarial drug development:
- Growth Inhibition Activity (GIA) Assays: Standardized SYBR Green I staining provides robust quantification of inhibitory antibodies or drugs targeting blood-stage parasites [5]. Consistent staining is particularly crucial when evaluating subtle differences in invasion inhibition.
- Multiplication Assays: Flow cytometry-based multiplication rate assessments benefit from the linear correlation between SYBR Green I fluorescence and parasite DNA content, especially when examining transitions between schizont rupture and new ring stage formation [5].
- Artemisinin Resistance Monitoring: In the recently developed Growth, Resistance, and Recovery Assay (GRRA), standardized staining across multiple timepoints (6-192 hours) enables accurate phenotyping of resistant parasites through direct-from-blood qPCR protocols adapted from flow cytometric methods [14].
Protocol Adaptation for Different Plasmodium Species
While optimized for P. falciparum, this staining protocol can be adapted for other human malaria parasites:
- P. knowlesi: Apply identical staining conditions but adjust incubation times based on the shorter life cycle (24 hours versus 48 hours for P. falciparum) [5].
- P. vivax (surrogate studies): Use P. knowlesi as a close relative with similar biology when direct P. vivax culture is not possible, maintaining the same staining parameters [5].
Consistent parasite lysis and dye permeability are not merely technical details but fundamental requirements for generating reliable data in malaria growth inhibition research. By implementing the systematically optimized protocols outlined in this application note—particularly the critical adjustments to dye solvent, concentration, temperature, and incubation time—researchers can significantly reduce staining variability in SYBR Green I flow cytometry. These standardized methods support more accurate assessment of antimalarial compound efficacy, ultimately accelerating the development of novel therapeutics against this global health threat. The integration of these optimized staining protocols with emerging assays like the GRRA [14] provides a comprehensive framework for advancing malaria drug discovery.
The accurate determination of drug efficacy against Plasmodium falciparum is a cornerstone of antimalarial research and development. The Malaria SYBR Green I-based Fluorescence (MSF) assay has emerged as a robust, non-radioactive alternative to traditional isotopic methods for high-throughput screening (HTS). This application note details the critical validation procedures—specifically the assessment of assay linearity and dynamic range—required to ensure the MSF assay generates reliable, high-quality data suitable for drug discovery and resistance monitoring. Adherence to these protocols allows researchers to confidently quantify parasite growth inhibition and determine crucial half-maximal inhibitory concentration (IC50) values.
In the face of increasing artemisinin resistance, robust high-throughput screening methods are essential for discovering and evaluating new antimalarial compounds [44]. The MSF assay leverages the fluorescent properties of the SYBR Green I dye, which exhibits a significant fluorescence enhancement upon binding to malarial DNA in infected erythrocytes [45]. Because mature erythrocytes lack DNA, the assay provides a specific signal proportional to parasite biomass [45].
For an HTS assay to be considered validated, it must demonstrate several key performance characteristics, including:
- Linearity: The ability of the assay to produce results that are directly proportional to the analyte concentration (parasitemia) across a specified range.
- Dynamic Range: The interval between the upper and lower limits of analyte that can be detected with acceptable accuracy and precision.
- Robustness (Z′-factor): A statistical measure of assay quality and suitability for HTS, accounting for the signal-to-noise ratio and data variation [45].
This protocol outlines the experimental steps to validate these parameters for the MSF assay, ensuring its application in reliable malaria drug susceptibility testing.
Validation Parameters and Experimental Protocols
Establishing Dynamic Range and Limit of Detection
The dynamic range defines the span of parasitemia levels over which the assay provides a usable signal. The following protocol determines the lower limit of detection (LLOD) and lower limit of quantitation (LLOQ).
Materials:
- Synchronized culture of P. falciparum (e.g., strains D6, W2)
- Uninfected human erythrocytes (RBCs)
- Complete culture medium (RPMI 1640 supplemented with HEPES, hypoxanthine, and human serum/Albumax)
- SYBR Green I nucleic acid stain (10,000X concentrate in DMSO)
- Lysis buffer (e.g., Tris-EDTA buffer, pH 7.5, with 0.008% saponin and 0.08% Triton X-100)
- 96-well or 384-well black-walled, clear-bottom microtiter plates
- Plate-reading fluorometer or high-throughput flow cytometer
Procedure:
- Prepare a master culture of P. falciparum at a known high parasitemia (e.g., 10% ring-stage parasites). Determine the exact parasitemia via Giemsa-stained blood smear or flow cytometry.
- Perform a series of twofold serial dilutions of the infected RBC master culture into uninfected RBCs. Create a dilution series covering a wide range of expected parasitemia, from the initial high parasitemia down to a theoretical 0.001%.
- Plate triplicate samples of each dilution (e.g., 100 µL per well) into a microtiter plate. Include wells containing only uninfected RBCs as negative controls.
- Lyse the RBCs and stain the parasitic DNA by adding an equal volume of lysis buffer containing SYBR Green I at a defined working concentration (e.g., 1X or 2X). Incubate in the dark for a specified period (e.g., 30-60 minutes).
- Measure the fluorescence intensity using a fluorometer with appropriate settings (excitation ~497 nm, emission ~520 nm).
- Data Analysis:
- Calculate the mean fluorescence intensity (MFI) for each dilution, subtracting the average MFI of the uninfected RBC control.
- Plot the net MFI against the known parasitemia.
- The LLOD is typically defined as the parasitemia that yields a fluorescence signal three standard deviations above the mean of the negative control.
- The LLOQ is the lowest parasitemia that can be measured with both precision (CV < 20%) and accuracy (80-120% of expected value) [45].
Assessing Assay Linearity and Z′-factor
Assay linearity ensures that changes in fluorescence signal accurately reflect changes in parasite numbers, which is critical for generating valid dose-response curves.
Procedure:
- Using the data generated from the dynamic range experiment, perform a linear regression analysis on the scatter plot of fluorescence signal versus parasitemia.
- The coefficient of determination (r²) indicates the degree of linearity. An r² value ≥ 0.95 is generally considered acceptable for a linear relationship over the working range of the assay.
- To calculate the Z′-factor, a measure of assay robustness, plate at least 16 wells each of high (positive) controls (e.g., 2-4% parasitemia) and low (negative) controls (uninfected RBCs).
- Process and measure the fluorescence of all control wells as described in Section 2.1.
- Calculate the Z′-factor using the following formula:
- Z′ = 1 - [ (3σ₊ + 3σ₋) / |μ₊ - μ₋| ]
- Where σ₊ and σ₋ are the standard deviations of the high and low controls, and μ₊ and μ₋ are their respective mean signals.
- A Z′-factor ≥ 0.5 is indicative of an excellent assay robust enough for HTS environments. The MSF assay has been shown to achieve Z′-factor values in the range of 0.73 to 0.95 [45].
Workflow for MSF Assay Validation and Screening
The following diagram illustrates the integrated workflow from parasite preparation to data analysis in the MSF assay.
Data Presentation and Analysis
The table below compiles key performance metrics established for the MSF assay during validation, as demonstrated in the literature.
Table 1: Performance Metrics of the Validated Malaria SYBR Green I Assay
| Validation Parameter | Result | Acceptance Criterion | Experimental Context |
|---|---|---|---|
| Limit of Detection (LLOD) | 0.04% - 0.08% parasitemia | Signal > 3x SD of negative control | Detection of P. falciparum DNA [45] |
| Limit of Quantitation (LLOQ) | ~0.5% parasitemia | Measurable with precision & accuracy | Quantitation of P. falciparum biomass [45] |
| Assay Robustness (Z′-factor) | 0.73 - 0.95 | ≥ 0.5 | High-throughput screening against drug panel [45] |
| Correlation with [3H]Hypoxanthine Assay | r² ≥ 0.9238 | High degree of correlation | IC50 determination for standard antimalarials [45] |
Data Analysis and IC50 Determination
For drug susceptibility testing, dose-response curves are generated from fluorescence data. The workflow below outlines the gating and analysis strategy used in flow cytometry, which can also be adapted for plate-reader data analysis.
- Signal Measurement: The fluorescence pulse area for each event, which correlates directly with fluorescence intensity, is measured by the photomultiplier tube (PMT) in a flow cytometer or as relative fluorescence units (RFU) in a plate reader [46].
- Gating and Quantification: In flow cytometry, initial gating on forward and side scatter is used to exclude dead cells and doublets, ensuring analysis is performed on an intact, single-cell population [46]. The percentage of infected cells or total fluorescence intensity is then calculated.
- IC50 Calculation: The percent growth inhibition is calculated relative to the high (no drug) and low (no parasite) controls. These values are plotted against the logarithm of the drug concentration, and the resulting curve is fitted to a four-parameter logistic (4PL) model to determine the IC50 value [47]. A successful assay should fit the 4PL model with an r² ≥ 0.90 [47].
The Scientist's Toolkit: Research Reagent Solutions
The successful implementation of the MSF assay relies on a set of key reagents. The following table details essential materials and their specific functions in the protocol.
Table 2: Essential Reagents for the MSF Assay
| Reagent / Material | Function / Role in the Assay | Application Notes |
|---|---|---|
| SYBR Green I Nucleic Acid Stain | High-affinity DNA dye that exhibits >1000-fold fluorescence enhancement upon binding to malarial DNA; primary readout for parasite biomass [37]. | Preferentially stains dsDNA. More sensitive than ethidium bromide. A 10,000X DMSO stock is diluted in lysis buffer for use. |
| P. falciparum Reference Strains (e.g., D6, W2, K1) | Genetically characterized strains with known drug susceptibility profiles; used for assay development, validation, and as internal controls [45] [44]. | Strains like chloroquine-sensitive D6 and -resistant W2 are used to validate assay performance across different drug classes. |
| Synchronizing Agent (e.g., 5% D-Sorbitol) | Selectively lyses mature trophozoite and schizont stages, resulting in a highly synchronized culture of ring-stage parasites for standardized drug exposure [44]. | Critical for the Ring-Stage Survival Assay (RSA) to study artemisinin resistance. |
| Lysis Buffer with Mild Detergent (e.g., Triton X-100, Saponin) | Permeabilizes the erythrocyte and parasite membranes, allowing the SYBR Green I dye to access and bind to parasitic DNA [45] [44]. | Concentration must be optimized (e.g., ~0.0003% Triton X-100) to permit dye access without causing excessive hemolysis or damaging parasite DNA [44]. |
| Calibration Beads for QFCM (e.g., Quantum MESF Beads) | Used in quantitative flow cytometry (QFCM) to convert fluorescence intensity into absolute units (MESF), enabling standardization across instruments and experiments [48]. | Essential for multicenter studies or when precise quantification of biomarker expression is required alongside viability counting. |
| Microtiter Plates (Black-walled, clear-bottom) | Maximizes fluorescence signal by reducing cross-talk between wells and allowing bottom-reading in fluorometers and imaging systems. | Ideal for HTS applications. |
Rigorous validation of linearity and dynamic range is not merely a procedural step but a fundamental requirement for generating pharmacologically relevant data from the MSF assay. The protocols outlined herein provide a framework for researchers to establish a robust, sensitive, and reproducible HTS platform. By confirming that the assay performs with a wide dynamic range, a linear response to parasitemia, and a high Z′-factor, scientists can confidently employ the SYBR Green I assay in the critical fight against malaria, from routine drug resistance surveillance to the discovery of next-generation antimalarial therapies.
Benchmarking Performance: Validation Against Gold Standard and Alternative Methods
In malaria research and drug development, robust in vitro assays are indispensable for evaluating parasite viability and drug susceptibility. Two primary methods, the SYBR Green I assay and the Lactate Dehydrogenase (LDH) assay, are widely employed for this purpose. This application note provides a detailed comparative analysis of these two techniques, framing the discussion within the context of their application in SYBR Green I flow cytometry for malaria growth inhibition research. We present structured data, experimental protocols, and analytical workflows to guide researchers and drug development professionals in selecting and implementing the most appropriate assay for their specific needs.
Fundamental Principles and Technical Comparison
The SYBR Green I and LDH assays operate on distinct biochemical principles to quantify Plasmodium falciparum growth and viability. SYBR Green I is a fluorescent cyanine dye that exhibits a massive increase in fluorescence upon binding to double-stranded DNA (dsDNA), enabling direct quantification of parasite nucleic acids [49]. In contrast, the LDH assay is an enzymatic method that detects parasite-specific lactate dehydrogenase (pLDH), a glycolytic enzyme produced by live parasites, by measuring its activity in converting lactate to pyruvate, which is coupled to a colorimetric or fluorescent signal generation [50] [51].
Key Characteristics of the Detection Mechanisms:
- SYBR Green I: This dye is highly specific for dsDNA, with its fluorescence increasing up to 1000-fold upon DNA binding [49]. Its signal is directly proportional to the DNA amount and, consequently, the parasite biomass, independent of the parasite's metabolic state. This allows for the quantification of fixed cells or cells with low metabolic activity [49].
- pLDH Assay: This method measures the functional activity of a specific parasite enzyme. The signal depends on the enzyme's concentration and its catalytic activity, which can be influenced by the parasite's metabolic condition and viability [51].
Table 1: Core Technical Characteristics of SYBR Green I and LDH Assays
| Characteristic | SYBR Green I Assay | LDH Assay |
|---|---|---|
| Detection Target | Double-stranded DNA (dsDNA) | Parasite Lactate Dehydrogenase (pLDH) enzyme activity |
| Signal Mechanism | Fluorescence enhancement upon DNA intercalation | Enzymatic reaction coupled to colorimetric/fluorometric change |
| Dependency | Parasite DNA content (biomass) | Enzyme concentration and metabolic activity |
| Assay Format | End-point, can be adapted for real-time monitoring [52] | Typically end-point |
| Sample Processing | Often requires cell lysis and DNA release [51] | Can be performed on culture supernatant or lysates |
Comparative Performance Analysis
Recent studies directly comparing these assays for antimalarial drug testing reveal critical performance metrics. A 2023 study by Hawadak et al. found no statistical difference between the half-maximal inhibitory concentration (IC₅₀) values for chloroquine, artemisinin, and other compounds determined by SYBR Green I and pLDH assays against P. falciparum field isolates (p = 0.714) [50]. The study reported a significant concordance between the methods for classifying chloroquine-resistant isolates (Cohen's kappa coefficient, k = 0.819, p < 0.001) [50].
Table 2: Performance Comparison in Antimalarial Drug Susceptibility Testing
| Performance Metric | SYBR Green I Assay | LDH Assay | Notes |
|---|---|---|---|
| IC₅₀ Concordance | High correlation with pLDH IC₅₀ values [50] [51] | High correlation with SYBR Green I IC₅₀ values [50] [51] | No significant difference reported (p = 0.714) [50] |
| Resistance Classification | 43.48% resistant to chloroquine [50] | 34.78% resistant to chloroquine [50] | Similar proportion (z = 0.302; p = 0.762) with strong concordance (k = 0.819) [50] |
| Correlation with Gold Standard | Comparable to HRP2 ELISA and isotopic methods [51] | Comparable to isotopic methods [51] | Both are validated alternatives to radioactive assays |
| Sensitivity | High; can detect DNA from ~50-70 cells [49] | High for active infections | SYBR Green I sensitivity is tied to DNA content, not metabolic state |
| Throughput Potential | High; adaptable to 384-well plates and HTS [10] | High; well-established for HTS | Both are suitable for high-throughput screening (HTS) |
Advantages and Limitations
A critical evaluation of the pros and cons of each assay is essential for informed decision-making.
SYBR Green I Assay:
- Pros:
- High Sensitivity and Direct Quantification: The assay provides a direct, metabolism-independent measure of parasite biomass via DNA quantification, with protocols capable of detecting as few as 50-70 cells [49].
- Cost-Effectiveness and Reagent Availability: The SYBR Green I dye is relatively inexpensive and readily available from multiple commercial sources worldwide, unlike some proprietary antibodies [51].
- Simplicity and Speed: Modern protocols are often single-step or involve minimal steps (lysis followed by fluorescence reading), reducing hands-on time and complexity [52] [51].
- Flexibility and Adaptability: It can be used with fixed cells or cell lysates, allowing sample storage and batch processing. It is easily adaptable to various formats, including flow cytometry and high-throughput imaging [10] [49].
- Cons:
- Dependence on DNA Content: The signal reflects total DNA, which can be influenced by stage-specific DNA replication and may not perfectly correlate with the number of viable, metabolically active parasites at a single time point.
- Interference from Host DNA: In crude samples, host white blood cell DNA can potentially contribute to background signal, though studies show reliable results without white blood cell removal [51].
LDH Assay:
- Pros:
- Metabolic Activity Marker: Measures the activity of a key metabolic enzyme, providing a functional readout of viable parasites.
- Species-Specific Potential: pLDH can be targeted with species-specific antibodies, allowing for differentiation between Plasmodium species in co-cultures or mixed infections [53].
- Established Track Record: A well-characterized and widely published method for drug susceptibility testing [50] [51].
- Cons:
- Dependency on Metabolic State: Enzyme activity can be influenced by the parasite's developmental stage and overall metabolic health, potentially confounding results under certain drug pressures or culture conditions.
- Reagent Limitations: High-quality, specific anti-pLDH antibodies are required and may not be as universally available or affordable as DNA dyes. Genetic diversity in pLDH can also affect antibody binding affinity in some field isolates [51].
- Protocol Complexity: Typically involves multiple steps, including antibody incubation and washing in ELISA formats, making it more time-consuming than some SYBR Green I protocols [51].
Application Protocols
Protocol: SYBR Green I-Based Drug Susceptibility Assay
This protocol is adapted for a 96-well plate format and is suitable for flow cytometry or plate reader detection [50] [52] [51].
Research Reagent Solutions:
- SYBR Green I Dye: 10,000X concentrate in DMSO. Function: Fluorescent nucleic acid stain for parasite DNA quantification.
- RPMI 1640 Culture Medium: Supplemented with HEPES, NaHCO₃, and Albumax I or human serum. Function: Supports in vitro parasite growth during drug exposure.
- Lysis Buffer: Tris-HCl (20 mM, pH 7.5), EDTA (5 mM), Saponin (0.008% w/v), Triton X-100 (0.08% v/v). Function: Releases parasite DNA from red blood cells by disrupting membranes.
- Drug Plates: Pre-dosed 96-well plates with serial dilutions of antimalarial compounds (e.g., Chloroquine, Artemisinin). Function: Provides a gradient of drug pressure for IC₅₀ determination.
- Phosphate-Buffered Saline (PBS): Function: Washing and dilution buffer.
Procedure:
- Parasite Culture Preparation: Synchronize P. falciparum cultures (e.g., strain 3D7) to the ring stage. Adjust parasitemia to 0.5-1% and hematocrit to 2% in complete culture medium [51].
- Drug Exposure: Add 180 µL of the parasite culture to each well of the pre-dosed drug plate. Include control wells (no drug for 100% growth, and no parasites for background). Incubate the plates at 37°C in a mixed-gas environment (5% O₂, 5% CO₂, 90% N₂) for 72 hours [50] [51].
- Staining and Lysis: Following incubation, freeze the plates at -80°C for at least 24 hours to lyse cells. Thaw the plates and add 100 µL of a SYBR Green I solution (diluted 1:1000 to 1:5000 in lysis buffer) to each well [52] [51].
- Signal Measurement: Incubate the plates in the dark for 30-60 minutes. Measure fluorescence using a plate reader (excitation ~485 nm, emission ~535 nm) or analyze by flow cytometry to quantify parasite DNA content.
- Data Analysis: Calculate fluorescence values relative to control wells. Use non-linear regression (dose-response analysis) to determine the IC₅₀ for each drug [50].
Protocol: pLDH Drug Susceptibility Assay (ELISA Format)
This protocol outlines a pLDH capture ELISA for determining drug susceptibility [50] [51].
Research Reagent Solutions:
- Anti-pLDH Antibodies: Monoclonal antibodies for capture and detection. Function: Specifically bind to pLDH antigen for quantitative detection.
- pLDH Substrate: Tetramethylbenzidine (TMB) or other HRP-compatible chromogenic substrate. Function: Enzymatic reaction produces a color change proportional to pLDH activity.
- Lysis Buffer: Similar to SYBR Green I protocol. Function: Releases pLDH enzyme from parasites.
- Drug Plates and Culture Medium: As described in the SYBR Green I protocol.
Procedure:
- Parasite Culture and Drug Exposure: Steps 1 and 2 are identical to the SYBR Green I protocol. Cultivate synchronized parasites in drug plates for 72 hours [51].
- Sample Harvest: After incubation, centrifuge the plates. Collect the supernatant, which contains released pLDH, or lyse the cells to release total pLDH.
- ELISA Procedure: a. Coating: Coat a separate ELISA plate with capture anti-pLDH antibody. Incubate overnight, then block. b. Antigen Capture: Add the harvested supernatants or lysates to the coated plate. Incubate to allow pLDH binding. c. Detection: Add a detection anti-pLDH antibody (often conjugated to Horseradish Peroxidase, HRP). Incubate and wash. d. Signal Development: Add the HRP substrate (TMB). Incubate in the dark until color develops, then stop the reaction with acid.
- Signal Measurement: Measure the absorbance of the solution in each well using a plate reader (e.g., at 450 nm).
- Data Analysis: Calculate absorbance values relative to controls. Use non-linear regression to determine IC₅₀ values, similar to the SYBR Green I method [50].
Workflow and Decision Pathway
The following diagram illustrates the key decision points and procedural steps for both assays, highlighting their parallel paths and distinct endpoints.
The Scientist's Toolkit: Essential Research Reagents
Table 3: Key Reagent Solutions for SYBR Green I and LDH Assays
| Reagent | Function | Application Notes |
|---|---|---|
| SYBR Green I Dye | Fluorescent nucleic acid stain for quantifying parasite DNA. | Available from multiple suppliers. Dilute in lysis buffer (e.g., containing saponin/Triton X-100) for optimal cell permeabilization and DNA access [51]. |
| Anti-pLDH Antibodies | Monoclonal antibodies for specific capture and detection of parasite LDH. | Critical for ELISA specificity. Performance can vary based on genetic diversity of pLDH in field isolates [51]. |
| pLDH Enzyme Substrate | Chromogenic/fluorogenic substrate (e.g., TMB) for HRP-conjugated detection antibodies. | Generates measurable signal proportional to active pLDH enzyme present. |
| Parasite Culture Medium | RPMI 1640 supplemented with Albumax I or serum, HEPES, and NaHCO₃. | Supports robust parasite growth during the 72-hour drug exposure period. Phenol red in the medium does not interfere with SYBR Green I fluorescence [51]. |
| Pre-dosed Drug Plates | 96-well plates containing serial dilutions of antimalarial compounds. | Allows for high-throughput IC₅₀ determination. Plates can be prepared in advance and stored frozen [51]. |
Both SYBR Green I and LDH assays are validated and highly effective tools for antimalarial drug susceptibility testing. The choice between them depends heavily on the specific research context. The SYBR Green I assay offers advantages in simplicity, cost, and adaptability for high-throughput flow cytometry and screening platforms. In contrast, the LDH assay provides a direct measure of metabolic function and offers potential for species discrimination. For most modern drug discovery applications, particularly those integrated with flow cytometry, the SYBR Green I method presents a compelling combination of performance, practicality, and throughput. However, in scenarios where metabolic activity is a primary endpoint or for specific diagnostic applications confirming HRP2-deleted parasites, LDH-based assays remain a vital tool in the malaria researcher's arsenal.
Within malaria research and drug development, robust and reliable assays for quantifying parasite growth and inhibition are fundamental. For decades, the hypoxanthine incorporation assay and microscopic examination of Giemsa-stained blood smears have served as cornerstone methodologies. The former measures parasite metabolism through the uptake of a radioactive nucleotide precursor [54], while the latter provides a direct morphological assessment of infected erythrocytes [55] [56]. This Application Note validates the performance of a SYBR Green I-based flow cytometry assay by conducting a direct, quantitative comparison against these two established techniques. The data presented herein confirm that this fluorescence-based method delivers results of equivalent accuracy and reliability, while offering significant advantages in throughput, objectivity, and efficiency for malaria growth inhibition studies.
Comparative Analysis of Methodologies
The SYBR Green I flow cytometry (FCMA), [3H]-hypoxanthine incorporation (THA), and light microscopy (LM) assays were systematically evaluated for their ability to determine the 50% inhibitory concentration (IC~50~) of standard antimalarial drugs against Plasmodium falciparum laboratory strains.
Key Assay Characteristics and Performance Metrics
Table 1: Head-to-Head Comparison of Malaria Drug Susceptibility Assays
| Assay Characteristic | SYBR Green I Flow Cytometry (FCMA) | [3H]-Hypoxanthine Incorporation (THA) |
Light Microscopy (LM) |
|---|---|---|---|
| Measurement Principle | Fluorescence intensity from dsDNA binding [45] | Radioactivity from nucleic acid precursor uptake [54] | Visual count of infected RBCs on stained slides [54] |
| Detection Limit (Parasitemia) | 0.04% - 0.08% [45]; 0.001% demonstrated with other DNA dyes [43] | Not explicitly stated, but considered highly sensitive | Subject to examiner skill and parasitemia level [54] |
| Key Performance Metric | Z'-factor: 0.73 - 0.95 (highly robust) [45] | Considered the historical "gold standard" [45] | Subjective; dependent on examiner training [55] |
| Correlation with THA (r²) | 0.9238 (global, phenotypic) [45] | N/A | N/A |
| Agreement with LM | High linear correlation (R² = 0.9925) for parasitemia [9] | N/A | N/A |
| Assay Time (Excluding Culture) | ~1-2 hours (including staining and analysis) | ~48 hours (incubation) + harvesting and counting | Several hours for counting and staging [55] |
| Throughput | High (96-well or 384-well format) [45] [54] | Moderate (96-well format) | Low (manual, tedious) [54] |
| Objectivity | High (automated, quantitative) | High (instrument-based quantification) | Low (subjective, prone to inter-observer variation) [54] [55] |
Quantitative Correlation of IC~50~ Values
A critical validation step involved comparing the drug sensitivity profiles generated by the FCMA and THA across multiple parasite strains and antimalarial drugs.
Table 2: Comparison of IC₅₀ Values (nM) Obtained by FCMA and Reference Assays
| Parasite Strain | Drug | SYBR Green I FCMA (IC₅₀, nM) | Reference Assay (IC₅₀, nM) | Correlation/Notes |
|---|---|---|---|---|
| D6 & W2 [45] | Chloroquine, Mefloquine, Quinine, Artemisinin, etc. | Variable by strain and drug | [3H]-hypoxanthine Incorporation |
Global correlation: r² ≥ 0.9238 [45] |
| 3D7, E8B, W2mef [54] | Chloroquine, Mefloquine, Dihydroartemisinin | Variable by strain and drug | [3H]-hypoxanthine Incorporation & pLDH Assay |
Good agreement at 24h (FCMA); differences noted at 48h at low IC₅₀ values [54] |
| Laboratory-adapted strains [57] | Crude plant extracts | Comparable IC₅₀ values | [3H]-hypoxanthine Incorporation |
SYBR Green I assay found to be a "cost-effective alternative" [57] |
| HB3 [9] | N/A (Parasitemia measurement) | N/A | Light Microscopy | R² = 0.9925 for parasitemia measurement [9] |
The data demonstrate that the SYBR Green I FCMA reproduces the resistance patterns identified by the traditional hypoxanthine incorporation assay with a high degree of fidelity, validating its use for reliable drug susceptibility testing [45] [57]. Furthermore, its accuracy in enumerating parasitemia is virtually indistinguishable from meticulous microscopic counting [9].
Detailed Experimental Protocols
Protocol 1: SYBR Green I Flow Cytometry for Drug Susceptibility Testing
This protocol is adapted for a 96-well plate format to determine the IC~50~ of antimalarial compounds against P. falciparum [45] [54].
I. Materials and Reagents
- SYBR Green I (10,000x concentrate in DMSO, e.g., Molecular Probes) [45]
- Complete Tissue Culture Medium (TCM): RPMI 1640 supplemented with HEPES, hypoxanthine, NaHCO₃, and 10% human plasma or 0.5% Albumax II [45] [9]
- Drug Dilutions: Prepare serial dilutions of antimalarial drugs in TCM.
- Synchronized P. falciparum Culture: Sorbitol-synchronized at the ring stage [54] [9].
- Phosphate Buffered Saline (PBS) with 0.5% Bovine Serum Albumin (BSA) [9]
- Equipment: Flow cytometer with plate reader capability, 96-well U-bottom plates, CO₂ incubator, centrifuge.
II. Procedure
- Plate Setup: Dispense 100 µL of drug solutions in triplicate across a 96-well plate. Include parasite control wells (no drug) and blank wells (uninfected red blood cells).
- Inoculate Parasites: Add 100 µL of synchronized parasite culture (1-2% initial parasitemia, 1-2% hematocrit) to all wells except blanks.
- Incubate: Incubate the plate for 48 hours (or desired period) at 37°C in a controlled atmosphere (e.g., 5% O₂, 5% CO₂, balance N₂).
- Stain with SYBR Green I: a. Post-incubation, centrifuge the plate (1200 rpm for 5 min) and wash cells once with 100 µL PBS/0.5% BSA. b. Resuspend the cell pellet in 75 µL of a 1:1000 dilution of SYBR Green I in PBS [9]. c. Incubate in the dark at 25°C for 20-30 minutes.
- Flow Cytometric Analysis: a. Wash cells once in PBS/0.5% BSA and resuspend in an appropriate volume of PBS. b. Acquire a minimum of 50,000 events per well on a flow cytometer using the FITC/FL1 channel. c. Gate on single erythrocytes using FSC-A/FSC-H to exclude doublets and debris.
III. Data Analysis
- The fluorescence intensity of the DNA-bound SYBR Green I is directly proportional to the parasite biomass within each erythrocyte.
- For each drug concentration, calculate the percentage growth inhibition relative to the parasite control wells:
% Inhibition = [1 - (Mean FL1 of drug well / Mean FL1 of control well)] * 100 - Fit the % inhibition values against the log~10~ of drug concentration using non-linear regression (e.g., sigmoidal dose-response curve) in software such as GraphPad Prism to determine the IC~50~ value.
Protocol 2: Reference Assays for Comparison
A. [3H]-Hypoxanthine Incorporation Assay [54]
- Set up the drug and parasite plate as in Protocol 1, steps 1-3, but use medium without hypoxanthine.
- After initiating the assay, add 10 µL of
[3H]-hypoxanthine working solution (e.g., 0.5 µCi/well). - After 48h incubation, freeze-thaw plates to lyse cells. Harvest contents onto glass-fiber filtermats using a cell harvester.
- Measure incorporated radioactivity using a beta scintillation counter.
- Calculate % inhibition and IC~50~ as for FCMA, using scintillation counts.
B. Light Microscopy for Parasitemia and Staging [54]
- Prepare thin blood smears from each well (or culture) at the end of the assay period.
- Fix with absolute methanol and stain with Giemsa solution.
- Examine under 100x oil immersion. Count a minimum of 5,000 erythrocytes across multiple fields.
- Calculate parasitemia as:
(Number of infected RBCs / Total number of RBCs counted) * 100. - For drug assays, calculate % inhibition based on parasitemia in test wells relative to control wells.
The Scientist's Toolkit: Essential Research Reagents
Table 3: Key Reagent Solutions for SYBR Green I-based Malaria Research
| Reagent / Material | Function / Role in the Assay | Example & Notes |
|---|---|---|
| SYBR Green I Dye | Fluorescent nucleic acid stain that binds dsDNA; core detection reagent. | 10,000x concentrate in DMSO (Molecular Probes); dilute to 1:1,000 - 1:10,000 in PBS for use [45] [9]. |
| Synchronization Agent | Enriches for specific parasite stages (e.g., rings) for synchronized, interpretable results. | 5% D-Sorbitol: Lyses mature trophozoite and schizont stages, leaving ring stages intact [54]. |
| Culture Supplement | Provides essential nutrients and growth factors for sustained in vitro parasite growth. | Hypoxanthine: Critical nucleic acid precursor [45]. Albumax II: Lipid-rich bovine albumin substitute for human serum [45] [5]. |
| Pan-Leukocyte Marker | Identifies and allows exclusion of contaminating white blood cells in field samples. | Anti-CD45 Antibody (e.g., conjugated to APC): Used in tri-color flow assays to distinguish WBCs (CD45+) from infected RBCs (CD45-) in whole blood [55]. |
| Erythrocytes | Host cells for the asexual blood-stage parasite culture. | Human O+ or Duffy-positive RBCs for P. falciparum and P. knowlesi, respectively [5] [58]. |
Workflow and Correlation Diagrams
Diagram 1: Experimental workflow for the head-to-head comparison of malaria drug susceptibility assays.
Diagram 2: Logical relationships and quantitative correlations between the SYBR Green I FCMA and the two reference assays.
Within the framework of a broader thesis on SYBR Green I-based flow cytometry for malaria research, this application note addresses a critical component of drug discovery: the validation of assay methods through the agreement of key pharmacodynamic metrics. The half-maximal inhibitory concentration (IC50) serves as a fundamental measurement for quantifying the potency of antimalarial compounds in vitro. The emergence and spread of resistance to first-line therapies, including artemisinin-based combination therapies (ACTs), underscore the necessity for robust, reliable, and high-throughput drug susceptibility testing [59] [60]. This note demonstrates how the SYBR Green I flow cytometry assay has been rigorously validated against traditional isotopic methods, establishing excellent concordance in IC50 values for a panel of common antimalarials. This agreement confirms the methodology's suitability for deployment in modern antimalarial drug discovery and resistance surveillance campaigns.
Key Metrics: IC50 Value Agreement Between Assays
The transition from traditional drug susceptibility assays to fluorescence-based methods requires demonstrating comparable performance. The table below summarizes the high degree of correlation observed between the SYBR Green I-based fluorescence (MSF) assay and the standard [3H]-hypoxanthine incorporation assay for a range of antimalarial drugs.
Table 1: Correlation of IC50 Values Between SYBR Green I MSF Assay and [3H]-Hypoxanthine Assay
| Antimalarial Drug | Plasmodium falciparum Strain | Global Phenotypic Correlation (r²) | Notes |
|---|---|---|---|
| Chloroquine | D6 (CQ-sensitive), W2 (CQ-resistant) | ≥ 0.9238 | Displays expected resistance patterns [45] |
| Mefloquine | D6, W2 | ≥ 0.9238 | Correlation consistent across strains [45] |
| Quinine | D6, W2 | ≥ 0.9238 | Reliable detection of susceptibility [45] |
| Artemisinin | D6, W2 | ≥ 0.9238 | Validated for key artemisinin derivatives [45] |
| Pyrimethamine | D6, W2 | ≥ 0.9238 | Includes antibiotics and antifolates in panel [45] |
This high degree of global and phenotypic correlation, regardless of the drug's mechanism of action, confirms that the SYBR Green I assay delivers pharmacodynamic data consistent with the established gold standard [45]. Furthermore, flow cytometry methods using different DNA stains, such as Hoechst 33342, have also shown strong agreement with hypoxanthine uptake data for drugs including chloroquine, mefloquine, and artemisinin, providing additional validation for flow cytometric approaches in general [61].
Experimental Protocol: SYBR Green I Flow Cytometry for Drug Susceptibility Testing
The following section provides a detailed, step-by-step protocol for determining the IC50 of antimalarial compounds against Plasmodium falciparum blood-stage parasites using the SYBR Green I-based flow cytometry assay.
Materials and Reagents
- Parasite Culture: Continuous cultures of P. falciparum (e.g., strains 3D7, Dd2, W2).
- Culture Medium: RPMI 1640 medium supplemented with HEPES, hypoxanthine, NaHCO₃, and 10% human plasma or Albumax I [45].
- Erythrocytes: Washed human O+ or A+ erythrocytes.
- Test Compounds: A panel of antimalarial drugs (e.g., chloroquine diphosphate, mefloquine HCl, artemisinin) dissolved in appropriate solvents (e.g., water, DMSO) [45].
- SYBR Green I Dye: Commercial stock solution (e.g., 10,000X concentrate in DMSO) [45].
- Lysis Buffer: Phosphate-buffered saline (PBS) containing 0.05% saponin and 2 mM EDTA [3].
- Equipment: Flow cytometer with a 488 nm laser and FITC/GFP filter (530/30 nm bandpass). Fluorescence-compatible 96-well microtiter plates. CO₂ incubator. Centrifuge.
Procedure
- Parasite Culture and Synchronization: Maintain asynchronous P. falciparum cultures at 5% hematocrit in complete culture medium. For more precise results, synchronize cultures to the ring stage using 5% sorbitol treatment to obtain a highly homogeneous parasite population [62].
- Drug Plate Preparation: Prepare a serial dilution of the test antimalarial compounds in culture medium across a 96-well plate. Include drug-free control wells (for 100% growth) and wells with a high concentration of a known potent antimalarial (e.g., 1 µM artemisinin) for 0% growth background.
- Inoculation and Incubation: Adjust the synchronized parasite culture to 1-2% parasitemia and 1-2% hematocrit. Add 100 µL of this parasite suspension to each well of the drug plate. Incubate the plate for 48 or 72 hours at 37°C in a gaseous environment of 5% CO₂, 5% O₂, and balance N₂ [45].
- Sample Processing and Staining: a. Following incubation, resuspend the contents of each well and transfer a 50 µL aliquot to a new 96-well plate. b. Add 100 µL of SYBR Green I staining solution (diluted 1:10,000 in PBS containing 0.05% saponin and 2 mM EDTA) to each well [3]. c. Incubate the plate in the dark at room temperature for 30-60 minutes.
- Flow Cytometric Analysis: Analyze 50,000 events per well on the flow cytometer. Use forward scatter (FSC) and side scatter (SSC) to gate on the erythrocyte population. Measure SYBR Green I fluorescence in the FITC/GFP channel. The infected red blood cells (iRBCs) will be clearly distinguishable from uninfected RBCs based on their high fluorescence intensity.
- Data Analysis: a. Calculate the percentage of parasitemia in each well: (Number of iRBCs / Total Number of RBCs) × 100. b. Normalize the data: (Parasitemia in drug well / Mean parasitemia in drug-free control wells) × 100 = % Growth. c. Plot % Growth against the log10 of the drug concentration. d. Fit the data using a non-linear regression curve (e.g., variable slope four-parameter logistic curve) in software such as GraphPad Prism to determine the IC50 value.
Diagram 1: SYBR Green I assay workflow for IC50 determination.
The Scientist's Toolkit: Essential Research Reagents
Successful implementation of this assay relies on a set of key reagents and materials. The table below details these essential components and their functions within the protocol.
Table 2: Key Research Reagent Solutions for SYBR Green I Flow Cytometry
| Reagent/Material | Function/Application in the Assay |
|---|---|
| SYBR Green I Nucleic Acid Stain | Fluorogenic dye that selectively binds to parasite double-stranded DNA, enabling fluorescence-based detection and quantification of infected RBCs [45] [3]. |
| RPMI 1640-based Culture Medium | Provides essential nutrients and environment for the in vitro survival and growth of intraerythrocytic P. falciparum parasites during drug exposure [45]. |
| Human Erythrocytes (O+ or A+) | Serve as host cells for the asexual blood-stage propagation of P. falciparum in culture. |
| Saponin-based Lysis Buffer | Selectively permeabilizes the erythrocyte and parasite membranes, allowing the SYBR Green I dye to access and stain parasite DNA while reducing background signal [3]. |
| Standard Antimalarial Drugs | Used as assay controls and reference compounds for validating assay performance and comparing the potency of novel agents (e.g., Chloroquine, Artemisinin) [45]. |
Advanced Applications and Lifecycle Analysis
A significant advantage of flow cytometry over other non-microscopic methods is its capacity for high-content analysis. While SYBR Green I staining is excellent for determining overall parasitemia, other flow cytometric panels can provide deeper insights into the parasite's lifecycle and the stage-specific action of drugs.
Table 3: Multi-Parameter Flow Cytometry for Advanced Analysis
| Application | Staining Panel | Measurable Outcome |
|---|---|---|
| Parasite Staging | Dihydroethidium (Ethidium) + Hoechst 33342 + Anti-CD45 [3] | Differentiation of ring, trophozoite, and schizont stages based on DNA/RNA content, while excluding leukocytes. |
| Stage-Specific Drug Action | Hoechst 33342 + Thiazole Orange [61] | Determination of separate IC50 values for ring, trophozoite, and schizont stages for a single drug. |
| Reagent-Free Viability | Depolarized Side-Scatter (Hemozoin) [62] | Detection of viable, hemozoin-containing parasites without dyes, allowing real-time and multi-cycle analysis. |
Diagram 2: Multi-parameter staining for advanced parasite analysis.
The data and protocols presented herein confirm that the SYBR Green I flow cytometry assay demonstrates excellent agreement with the historical [3H]-hypoxanthine gold standard for determining IC50 values of common antimalarials like chloroquine and artemisinin. This validation, coupled with the method's inherent advantages of speed, safety, and suitability for high-throughput screening, solidifies its position as a cornerstone technique for modern antimalarial drug discovery. Furthermore, the ability of flow cytometry to be expanded into multi-parameter analyses provides a powerful tool for deciphering complex phenotypes associated with emerging drug resistance and for elucidating the stage-specific action of next-generation antimalarial compounds.
The discovery and development of novel antimalarial drugs are urgently needed to address increasing mortality, morbidity, and drug resistance in endemic areas [10]. SYBR Green I-based flow cytometry has emerged as a powerful methodology in modern antimalarial research, enabling high-throughput screening (HTS) and phenotypic drug discovery against Plasmodium falciparum, the most deadly malaria parasite [9] [33]. This technology leverages the unique nucleic acid staining properties of SYBR Green I, a cyanine dye that binds with high avidity to double-stranded DNA and can be excited at 488 nm using a visible light laser commonly available in flow cytometers [2]. Since mature human erythrocytes lack DNA, any fluorescence detected after SYBR Green I staining is attributable specifically to parasite DNA, providing a highly specific means to quantify parasitemia and assess drug effects [9] [45].
The application of SYBR Green I in flow cytometry addresses significant limitations of traditional methods for evaluating malaria parasite growth and invasion. Microscopic examination of Giemsa-stained blood smears, while considered the historical gold standard, is time-consuming, subjective, and prone to significant inter-operator error with demonstrated false positive rates as high as 36% and false negatives up to 18% [33]. Similarly, radioactive hypoxanthine incorporation assays, though widely used, require special handling, involve multiple processing steps, and cannot differentiate between parasite developmental stages [33]. SYBR Green I-based flow cytometry overcomes these challenges by providing objective, high-content, moderate-throughput assays that can rapidly quantify parasitemia, distinguish between singly and multiply-infected erythrocytes, and evaluate parasite viability with high precision and accuracy [9] [45].
SYBR Green I Detection Principle and Technical Advantages
The fundamental principle underlying SYBR Green I application in malaria research stems from its exceptional affinity for double-stranded DNA and its fluorescence enhancement upon DNA binding [41]. SYBR Green I exhibits an 11-fold greater preference for double-stranded DNA than single-stranded DNA and has low binding affinity for RNA, making it particularly suitable for detecting malaria parasites within erythrocytes [9]. When bound to DNA, SYBR Green I produces a 100-fold increase in fluorescence compared to its unbound state, enabling highly sensitive detection of parasitized cells [63]. This dye penetrates cell membranes without requiring fixation steps necessary for other stains like propidium iodide, simplifying experimental protocols and reducing processing time [9] [2].
From a technical perspective, SYBR Green I offers several advantages that make it ideal for high-throughput screening applications. The dye emits on the fluorescein isothiocyanate (FITC) channel when excited at 488nm by an argon laser, which is standard on most flow cytometers [4] [2]. This compatibility with common laboratory equipment increases the accessibility of the methodology across research settings. Additionally, SYBR Green I displays lower coefficient of variation values compared to propidium iodide in DNA quantification, suggesting better stoichiometric nuclear staining and more precise measurements [41]. The dye also exhibits greater safety profiles compared to traditional alternatives like ethidium bromide, being less mutagenic while maintaining high sensitivity for detecting parasitic DNA [45] [41].
Figure 1: SYBR Green I Detection Principle. The diagram illustrates the molecular mechanism by which SYBR Green I binds to parasite DNA, resulting in significant fluorescence enhancement that enables detection and quantification via flow cytometry.
Application Notes: Protocol for High-Throughput Drug Screening
Parasite Culture and Preparation
For high-throughput drug screening using SYBR Green I flow cytometry, Plasmodium falciparum asexual stages are maintained in vitro in human O+ erythrocytes at 4% hematocrit in complete RPMI-1640 media supplemented with 25 mM HEPES, 0.21% sodium bicarbonate, 50 mg/L hypoxanthine, and 0.5% Albumax II [9] [10]. To ensure synchronized parasite development, maintained parasites are double-synchronized at the ring stage using 5% sorbitol treatment and cultivated through one complete cycle before drug sensitivity testing [10]. The synchronization step is critical for obtaining accurate drug response data, as the flow cytometer's ability to resolve multiply-infected erythrocytes is optimal with ring-stage parasites [9]. For invasion assays, enzyme-treated infected donor cells are mixed with equivalent cell numbers of RPMI-treated erythrocyte control cells or enzyme-treated erythrocyte negative control cells to assess invasion efficiency [9].
Drug Treatment and Staining Procedure
Compound libraries are prepared in 100% dimethyl sulfoxide (DMSO) and transferred using automated liquid handling systems into 384-well glass plates [10]. Plasmodium falciparum cultures (strain 3D7) are dispensed in drug-treated 384-well plates with 1% schizont-stage parasites at 2% hematocrit and incubated for 72 hours in a malaria culture chamber with mixed gas at 37°C [10]. Following incubation, cultures are pelleted via centrifugation (1200 rpm, 5 minutes) and washed twice with 100 µL of 1× phosphate-buffered saline (PBS) containing 0.5% bovine serum albumin (BSA) and 0.02% sodium azide [9]. Cells are then incubated with 75 µL of 1:1000 SYBR Green I for 20 minutes at 25°C, protected from light [9]. After staining, cells are washed in PBS + BSA + sodium azide and resuspended in PBS for flow cytometry analysis [9].
Flow Cytometry Analysis and Data Acquisition
Flow cytometry data is collected using instruments such as the FACSCalibur (Becton Dickinson) with an acquisition of 100,000 events per sample to ensure statistical significance [9]. Initial gating is carried out with unstained, uninfected erythrocytes to account for erythrocyte autofluorescence and establish baseline signals [9]. The flow cytometer accurately detects parasitemia above 0.02-0.04%, with a quantitation limit of approximately 0.5% parasitemia, demonstrating high sensitivity for detecting low levels of infection [45] [2]. The SYBR Green I-based flow cytometry method shows excellent linear correlation (R²=0.9925) with microscopy-based parasitemia determination while offering significantly higher throughput and objectivity [9]. The assay quality is significantly robust, displaying a Z′ range of 0.73 to 0.95, making it suitable for high-throughput screening applications where consistency and reproducibility are paramount [45].
Figure 2: High-Throughput Screening Workflow. The diagram outlines the key steps in SYBR Green I-based flow cytometry for antimalarial drug screening, from parasite preparation through data analysis.
Advanced Applications in Phenotypic Drug Discovery
Distinguishing Singly and Multiply-Infected Erythrocytes
A significant advantage of SYBR Green I flow cytometry in phenotypic drug discovery is its ability to resolve multiply-infected erythrocytes, providing nuanced insights into parasite invasion efficiency and host cell selectivity [9]. The high concordance between microscopy- and flow cytometry-determined parasitemia is attributable to the flow cytometer's capacity to clearly resolve singly-, doubly-, and triply-infected erythrocytes based on differential DNA content [9]. This resolution enables researchers to simultaneously calculate both the parasitemia and the number of multiply-infected erythrocytes, allowing for the assessment of critical determinants of P. falciparum virulence such as the parasite multiplication rate (PMR) and selectivity index (SI) [9]. The PMR represents the fold increase in parasitemia following each round of asexual growth, while the SI is the ratio of observed multiply-infected erythrocytes to those expected by random events, as predicted by a Poisson distribution [9].
The ability to quantify multiple infection events has revealed important biological differences between laboratory-adapted isolates and wild isolates. While most in vivo parasitemia is limited to single invasion events, ex vivo parasitemia reveals significantly more multiple invasion events, with even higher frequencies observed in ex vivo isolates compared to in vitro culture-adapted lines [9]. This capability is particularly valuable for understanding parasite biology and identifying compounds that may specifically impact invasion mechanisms rather than general parasite viability. Furthermore, the method can be adapted for field-based research settings, as demonstrated by successful applications with samples from Senegalese patients both in vivo and after a single round of reinvasion ex vivo [9].
Stage-Specific Drug Effects and Mechanism Elucidation
SYBR Green I flow cytometry facilitates the investigation of stage-specific drug effects by enabling researchers to monitor parasite development and viability at different life cycle stages [32]. By measuring newly invaded erythrocytes at the ring stage, this flow cytometry-based approach can separate parasite invasion from parasite growth, which is not possible with other high-throughput assays that depend on metabolic labeling, such as the standard tritiated hypoxanthine assay [9]. This distinction is particularly important for understanding the mechanisms of action of potential antimalarial compounds, as some may specifically target invasion proteins while others impact intracellular development.
The technology also enables ex vivo applications including measurement of the inhibitory effects of antibodies used in parasite neutralization assays and assessment of the ability of parasites to invade erythrocytes of different ages by co-staining for age-specific markers such as CD71 and phosphatidyl serine [9]. These advanced applications provide multidimensional data on parasite biology and compound effects that extend beyond simple growth inhibition, contributing to more informed candidate selection in drug discovery pipelines. The precision with which flow cytometry resolves developmental stages requires cultures to be at the ring-stage for optimal multiple infection discrimination, as the instrument cannot distinguish between the fluorescence emitted by an erythrocyte harboring three ring-stage parasites versus one infected by a single, early trophozoite once DNA replication begins [9].
Quantitative Validation and Performance Metrics
SYBR Green I-based flow cytometry has been extensively validated against traditional methods for malaria research, demonstrating excellent performance characteristics that support its application in high-throughput screening and phenotypic drug discovery. The table below summarizes key validation metrics and performance characteristics reported across multiple studies:
Table 1: SYBR Green I Flow Cytometry Validation and Performance Metrics
| Validation Parameter | Performance Metric | Experimental Details | Citation |
|---|---|---|---|
| Detection Limit | 0.02-0.04% parasitemia | P. berghei and P. falciparum infected RBCs | [45] [2] |
| Quantitation Limit | ~0.5% parasitemia | P. falciparum strains D6 and W2 | [45] |
| Correlation with Microscopy | R² = 0.9925 | P. falciparum HB3 serial dilutions | [9] |
| Assay Quality (Z′ factor) | 0.73-0.95 | High-throughput screening conditions | [45] |
| Multiply-Infected RBC Resolution | Singly-, doubly-, triply-infected cells | Ring-stage P. falciparum cultures | [9] |
| Comparison to Hypoxanthine Uptake | r² ≥ 0.9238 | Global and phenotypic correlation | [45] |
The robust quantitative performance of SYBR Green I flow cytometry is further demonstrated in its application to diverse malaria parasite strains, including drug-sensitive and resistant variants. The methodology has been successfully used to determine IC₅₀ values for a broad panel of antimalarial drugs including chloroquine, mefloquine, quinine, artemisinin, doxycycline, azithromycin, pyrimethamine, dapsone, and sulfadoxine against both chloroquine-sensitive (D6) and chloroquine-resistant (W2) P. falciparum strains [45]. The expected parasite drug resistance patterns are maintained with the SYBR Green I assay, confirming its reliability for compound profiling across parasite populations with different genetic backgrounds and resistance profiles [45].
Additional validation comes from the application of SYBR Green I flow cytometry to rodent malaria models, particularly Plasmodium berghei, which is widely used for in vivo efficacy evaluation during antimalarial drug development [2]. Studies have established optimal staining conditions for P. berghei-infected mouse red blood cells, recommending a 4× concentration of SYBR Green I for 30 minutes, which accurately detects parasitemia above 0.02% using the bi-dimensional FL-1530/FL-3620 detection method [2]. The dye remains stable during prolonged incubation periods with no loss of fluorescent signal over several hours, facilitating processing of large sample batches in screening campaigns [2].
Research Reagent Solutions and Technical Specifications
Successful implementation of SYBR Green I flow cytometry for malaria research requires specific reagents and materials optimized for the application. The table below details essential research reagent solutions and their functions in the experimental workflow:
Table 2: Essential Research Reagent Solutions for SYBR Green I Malaria Flow Cytometry
| Reagent/Material | Specification/Concentration | Function in Protocol | Citation |
|---|---|---|---|
| SYBR Green I | 1:1000 dilution in buffer; 10,000× stock in DMSO | DNA-specific fluorescent staining of parasites | [9] [45] |
| Culture Medium | RPMI-1640 with 25 mM HEPES, 0.21% sodium bicarbonate, 50 mg/L hypoxanthine, 0.5% Albumax II | Parasite cultivation and maintenance | [9] [10] |
| Synchronization Agent | 5% sorbitol (wt/vol) | Synchronization of parasite cultures at ring stage | [10] |
| Washing Buffer | 1× PBS + 0.5% BSA + 0.02% sodium azide | Cell washing and stain preparation | [9] |
| Enzyme Treatments | α-2-3,6,8-Vibrio cholera neuraminidase (66.7 mU/ml), trypsin (1 mg/ml), chymotrypsin (1 mg/ml) | Prevention of reinvasion in invasion assays | [9] |
| Fixative | 4% paraformaldehyde (for image-based screening) | Cell fixation for automated imaging | [10] |
The selection and quality of these reagents directly impact assay performance and data quality. SYBR Green I is particularly critical, with studies demonstrating that it displays lower coefficient of variation values (1.57-2.85%) compared to propidium iodide (2.75-4.80%) in DNA staining applications, suggesting more precise stoichiometric staining [41]. The dye's exceptional affinity for double-stranded DNA and rapid staining capability make it ideal for high-throughput applications where processing time is a consideration [41]. Additionally, the use of specialized culture supplements like Albumax II (lipid-rich bovine serum albumin) provides essential nutrients for robust parasite growth without the variability associated with human serum, improving experimental consistency [10] [45].
Beyond these core reagents, successful implementation requires attention to technical specifications including laser configuration (488nm excitation standard), detector sensitivity (FITC channel detection), and sample processing parameters (acquisition of 100,000 events per sample recommended) [9] [33] [2]. The methodology has been adapted for various formats including 96-well and 384-well plates, with ongoing developments focused on increasing throughput and compatibility with automated screening systems [9] [10]. These technical optimizations collectively contribute to the robust, reproducible performance of SYBR Green I flow cytometry in malaria drug discovery applications.
SYBR Green I-based flow cytometry represents a sophisticated methodological platform that has significantly advanced high-throughput screening and phenotypic drug discovery for malaria. The technology combines the specificity of DNA staining with the quantitative power of flow cytometry to enable rapid, objective assessment of antimalarial compound effects against Plasmodium falciparum and other malaria parasites. Its ability to distinguish between singly and multiply-infected erythrocytes, determine stage-specific drug effects, and provide robust quantitative data on parasite viability and growth inhibition makes it particularly valuable for modern antimalarial drug discovery campaigns. As drug resistance continues to undermine existing antimalarial therapies, SYBR Green I flow cytometry offers a powerful tool for identifying and characterizing novel chemotypes with activity against resistant parasite strains, ultimately contributing to the global effort to control and eliminate malaria.
Conclusion
SYBR Green I flow cytometry has firmly established itself as a robust, objective, and efficient method for quantifying malaria parasite growth and inhibition. It successfully addresses critical limitations of traditional microscopy, such as subjectivity and low throughput, while providing a non-radioactive alternative to hypoxanthine incorporation assays. Its excellent correlation with established methods for determining IC50 values validates its reliability for both routine drug sensitivity testing and high-throughput screening of novel compounds. The future of this technique is bright, with its application expanding into new areas such as monitoring artemisinin resistance phenotypes, evaluating vaccine-induced antibody efficacy in growth inhibition activity assays (GIA), and facilitating the ex vivo analysis of clinical isolates from the field. As the push for new antimalarials intensifies, SYBR Green I flow cytometry will remain an indispensable tool in the global effort to combat malaria.
References
- 1. SYBR Green I - an overview [https://www.sciencedirect.com/topics/biochemistry-genetics-and-molecular-biology/sybr-green-i]
- 2. Flow cytometric enumeration of Plasmodium berghei ... [https://www.sciencedirect.com/science/article/abs/pii/S0001706X11003676]
- 3. A rapid and robust tri-color flow cytometry assay for ... [https://www.nature.com/articles/srep00118]
- 4. Plasmodium Falciparum: Development and Validation of a ... [https://pubmed.ncbi.nlm.nih.gov/19017530/]
- 5. Multiplication and Growth Inhibition Activity Assays for the ... [https://bio-protocol.org/en/bpdetail?id=3743&type=0]
- 6. Assessment of SYBR Green I Dye-Based Fluorescence ... [https://pmc.ncbi.nlm.nih.gov/articles/PMC4394797/]
- 7. Validation of SYBR green I based closed‐tube loop‐mediated ... [https://malariajournal.biomedcentral.com/articles/10.1186/s12936-021-03707-0]
- 8. DNA-binding protein PfAP2-P regulates parasite ... [https://www.nature.com/articles/s41564-023-01497-6]
- 9. A flow cytometry-based assay for measuring invasion of ... [https://pmc.ncbi.nlm.nih.gov/articles/PMC3089760/]
- 10. High-throughput screening and meta-analysis for lead ... [https://pmc.ncbi.nlm.nih.gov/articles/PMC12590855/]
- 11. Plasmodium species: Flow cytometry and microfluorometry ... [https://www.sciencedirect.com/science/article/abs/pii/0014489487900129]
- 12. Optimized Protocol for Microalgae DNA Staining with ... [https://www.mdpi.com/2409-9279/5/5/76]
- 13. Flow cytometry analysis of the microbiota associated with the ... [https://parasitesandvectors.biomedcentral.com/articles/10.1186/s13071-016-1438-0]
- 14. Measuring growth, resistance, and recovery after artemisinin ... [https://pmc.ncbi.nlm.nih.gov/articles/PMC12355871/]
- 15. Feasibility of Flow Cytometry for Measurements ... [https://pmc.ncbi.nlm.nih.gov/articles/PMC3067720/]
- 16. Optimization of Procedures for Counting Viruses by Flow ... [https://pmc.ncbi.nlm.nih.gov/articles/PMC368280/]
- 17. Multiplication and Growth Inhibition Activity Assays for the ... [https://pmc.ncbi.nlm.nih.gov/articles/PMC7842542/]
- 18. Flow cytometric analysis using SYBR Green I for genome ... [https://pubmed.ncbi.nlm.nih.gov/20149417/]
- 19. Growth inhibition assay [https://bio-protocol.org/exchange/minidetail?id=18148544&type=30]
- 20. Development of fluorescent Plasmodium falciparum for in vitro ... [https://pmc.ncbi.nlm.nih.gov/articles/PMC2891815/]
- 21. A pipeline for developing and testing staining protocols ... [https://www.sciencedirect.com/science/article/abs/pii/S0167701216303098]
- 22. Flow Cytometric Enumeration of Plasmodium Berghei ... [https://pubmed.ncbi.nlm.nih.gov/22222185/]
- 23. Methodology and Application of Flow Cytometry for ... [https://pmc.ncbi.nlm.nih.gov/articles/PMC3071436/]
- 24. A Rapid Growth-Independent Antibiotic Resistance ... [https://www.frontiersin.org/journals/medicine/articles/10.3389/fmed.2018.00127/full]
- 25. Flow virometry for water-quality assessment: protocol ... [https://www.nature.com/articles/s41545-023-00224-2]
- 26. An improved staining method of cell cycle analysis with Sybr ... [https://pmc.ncbi.nlm.nih.gov/articles/PMC7889188/]
- 27. Methodology to streamline flow cytometric-based detection ... [https://www.sciencedirect.com/science/article/abs/pii/S0167701222000343]
- 28. 48-h growth inhibition assay using SYBR green I. [https://bio-protocol.org/exchange/minidetail?id=10938358&type=30]
- 29. An improved SYBR Green-1-based fluorescence method for ... [https://malariajournal.biomedcentral.com/articles/10.1186/s12936-015-1011-x]
- 30. The SYBR Green I Malaria Drug Sensitivity Assay [https://pmc.ncbi.nlm.nih.gov/articles/PMC2829899/]
- 31. Flow Cytometric Sorting of Infected Erythrocytes ... [https://pmc.ncbi.nlm.nih.gov/articles/PMC9209910/]
- 32. SYBR® Green I-Based Fluorescence Assay to Assess Cell Viability of Malaria Parasites for Routine Use in Compound Screening - PubMed [https://pubmed.ncbi.nlm.nih.gov/28470521/]
- 33. Methodology and Application of Flow Cytometry for Investigation of Human Malaria Parasites - PMC [https://www.ncbi.nlm.nih.gov/pmc/articles/PMC3071436/]
- 34. Development of a quantitative flow cytometry-based assay ... [https://pmc.ncbi.nlm.nih.gov/articles/PMC3307955/]
- 35. Resolution of Viable and Membrane-Compromised ... [https://pmc.ncbi.nlm.nih.gov/articles/PMC93217/]
- 36. Using fluorescent nanoparticles and SYBR Green I based ... [https://www.sciencedirect.com/science/article/abs/pii/S0956566308002510]
- 37. Nucleic Acid Detection on Gels, Blots and Arrays—Section ... [https://www.thermofisher.com/us/en/home/references/molecular-probes-the-handbook/nucleic-acid-detection-and-genomics-technology/nucleic-acid-detection-and-quantitation-in-electrophoretic-gels-and-capillaries.html]
- 38. Flow cytometry for rapid characterisation of microbial ... [https://www.sciencedirect.com/science/article/abs/pii/S0043135419310176]
- 39. SYBR Green waste removal - General Lab Techniques [http://www.protocol-online.org/biology-forums-2/posts/6877.html]
- 40. Flow cytometry method for absolute counting and single- ... [https://www.nature.com/articles/s41598-021-98176-5]
- 41. Flow cytometric analysis using SYBR Green I for genome ... [https://www.sciencedirect.com/science/article/abs/pii/S0065128109001159]
- 42. The critical role of PSAC channel in malaria parasite ... [https://www.sciencedirect.com/science/article/pii/S2451945625001369]
- 43. A simple monochromatic flow cytometric assay for assessment ... [https://malariajournal.biomedcentral.com/articles/10.1186/s12936-020-03156-1]
- 44. Trio fluorophore-based phenotypic assay for the detection ... [https://www.nature.com/articles/s41598-024-52414-8]
- 45. Assessment and Continued Validation of the Malaria SYBR ... [https://pmc.ncbi.nlm.nih.gov/articles/PMC1891422/]
- 46. Data analysis in flow cytometry [https://www.abcam.com/en-us/technical-resources/guides/flow-cytometry-guide/data-analysis-in-flow-cytometry]
- 47. Taking advantage of a high-throughput flow cytometer for ... [https://pmc.ncbi.nlm.nih.gov/articles/PMC7193121/]
- 48. Quantitative Flow Cytometry: Applications & Benefits [https://kcasbio.com/blogs/understanding-quantitative-flow-cytometry/]
- 49. DNA Dyes—Highly Sensitive Reporters of Cell Quantification [https://www.mdpi.com/1420-3049/26/18/5515]
- 50. Comparison of SYBR green I and lactate dehydrogenase ... [https://pubmed.ncbi.nlm.nih.gov/37778462/]
- 51. Comparison of a SYBR Green I-Based Assay with a Histidine ... [https://pmc.ncbi.nlm.nih.gov/articles/PMC1855478/]
- 52. Measuring growth, resistance, and recovery after artemisinin ... [https://malariajournal.biomedcentral.com/articles/10.1186/s12936-025-05481-9]
- 53. and HRP2-based rapid tests for Plasmodium vivax and ... [https://journals.plos.org/plosntds/article?id=10.1371/journal.pntd.0013307]
- 54. A comparative study of a flow - cytometry -based assessment of in vitro... [https://malariajournal.biomedcentral.com/articles/10.1186/1475-2875-8-294]
- 55. A rapid and robust tri-color flow assay for monitoring... cytometry [https://www.nature.com/articles/srep00118?error=cookies_not_supported]
- 56. (PDF) A rapid and robust tri-color flow assay for monitoring... cytometry [https://www.academia.edu/19670236/A_rapid_and_robust_tri_color_flow_cytometry_assay_for_monitoring_malaria_parasite_development]
- 57. Comparison of SYBR -, PicoGreen-, and... | Semantic Scholar Green I [https://www.semanticscholar.org/paper/Comparison-of-SYBR-Green-I-%2C-PicoGreen-%2C-and-assays-Abiodun-Gbotosho/4b487eec797f4869393b2c8659e587f458eb460a]
- 58. Optimized plasmid loading of human erythrocytes for ... [https://pmc.ncbi.nlm.nih.gov/articles/PMC11456387/]
- 59. Changes in susceptibility of Plasmodium falciparum to ... [https://pmc.ncbi.nlm.nih.gov/articles/PMC12335539/]
- 60. Development in Assay Methods for in Vitro Antimalarial ... [https://www.frontiersin.org/journals/pharmacology/articles/10.3389/fphar.2017.00754/full]
- 61. Addressing the malaria drug resistance challenge using ... [https://pmc.ncbi.nlm.nih.gov/articles/PMC3131497/]
- 62. A Novel Flow Cytometric Hemozoin Detection Assay for Real ... [https://journals.plos.org/plosone/article?id=10.1371/journal.pone.0061606]
- 63. Rapid high throughput SYBR green assay for identifying the ... [https://journals.plos.org/plosone/article?id=10.1371/journal.pone.0215669]