Parasite DNA Barcoding: A Practical Guide to Choosing Between Sanger and Next-Generation Sequencing
This article provides a comprehensive comparison of Sanger sequencing and Next-Generation Sequencing (NGS) for parasite DNA barcoding, tailored for researchers, scientists, and drug development professionals.
Parasite DNA Barcoding: A Practical Guide to Choosing Between Sanger and Next-Generation Sequencing
Abstract
This article provides a comprehensive comparison of Sanger sequencing and Next-Generation Sequencing (NGS) for parasite DNA barcoding, tailored for researchers, scientists, and drug development professionals. It covers the foundational principles of both technologies, explores their specific methodological applications in parasitology, addresses common troubleshooting and optimization challenges, and offers a rigorous validation and cost-benefit analysis. The goal is to equip readers with the evidence needed to select the most appropriate, efficient, and cost-effective sequencing strategy for their specific research or diagnostic projects involving parasite identification and characterization.
DNA Barcoding Foundations: Sanger Sequencing and NGS Core Technologies Explained
What is DNA Barcoding? Defining the Core Concept for Parasite Identification
DNA barcoding is a method of species identification that uses short, standardized segments of DNA from a specific gene or genes to uniquely identify an organism to the species level [1] [2]. The core premise is that by comparing an unknown DNA sequence against a reference library of known sequences, a researcher can accurately identify a specimen, much like a supermarket scanner uses a universal product code (UPC) to identify an item against a database [3] [1]. This method has revolutionized the field of taxonomy and biodiversity studies, particularly for organisms like parasites, where traditional morphometric identification can be challenging, time-consuming, and require specialized expertise that is often in short supply [4].
In parasitology, the challenges of identification are extraordinary. Parasites are often small, develop through complex, multi-host life cycles, and can exist in hosts as assemblages of many species or as cryptic species complexes [4]. DNA barcoding provides a powerful tool to overcome these hurdles, enabling precise identification that is crucial for understanding disease ecology, developing control strategies, and conducting accurate surveillance [5] [4]. The technique is distinct from the science of circumscribing species and resolving their evolutionary relationships, but it serves as a powerful scaffold both to motivate and guide these efforts [4]. The recent release of the National Aquatic Environmental DNA Strategy underscores the urgency of building comprehensive DNA barcode libraries, as environmental sequencing techniques for ecosystem monitoring depend entirely on the availability of such reference data [3].
Conceptual Foundation and Barcoding Workflow
The Core Principle and the "Barcoding Gap"
The fundamental principle underlying DNA barcoding is the existence of a "barcoding gap" [1]. For a genetic marker to function as an effective barcode, it must exhibit low intraspecific genetic variation (variation within a species) and high interspecific genetic variation (variation between species) [1] [6]. This disparity ensures that the genetic differences between species are greater than the differences within a species, allowing for reliable discrimination. An ideal barcode marker possesses conserved flanking sites for developing universal PCR primers, enabling amplification across a wide range of taxa, and a sequence length that is short enough to be easily obtained with current technology [1].
Universal Workflow for DNA Barcoding
The process of DNA barcoding follows a standardized sequence of steps, from sample collection to species identification. The following diagram illustrates this core workflow, which is universally applicable across different organismal groups.
This workflow is agnostic to the specific sequencing technology used (Sanger or NGS). The critical steps involve obtaining a tissue sample, isolating DNA, amplifying the specific barcode region using targeted primers, sequencing the amplified product, and computationally comparing the resulting sequence against a reference library such as the Barcode of Life Data System (BOLD) to obtain an identification [3] [1] [2]. The reliability of the final identification is directly dependent on the completeness and quality of the reference library [3] [1].
Marker Selection for Parasites and Vectors
The choice of genetic marker is critical for the success of DNA barcoding and varies significantly across different organismal groups. No single gene region is universally effective for all taxa, from viruses to plants and animals [1]. The table below summarizes the standard barcode markers used for parasites and their vectors.
Table 1: Standard DNA Barcode Markers for Parasites and Related Organisms
| Organism Group | Primary Barcode Marker(s) | Alternative or Supplemental Markers | Key Considerations |
|---|---|---|---|
| Animals (including helminths and insect vectors) | Cytochrome c oxidase I (COI) [1] | Cytochrome b (Cytb), 12S rRNA, 16S rRNA [1] | Mitochondrial genes are preferred for their haploid mode of inheritance, lack of introns, and high copy number [1]. |
| Fungi & Fungal Parasites | Internal Transcribed Spacer (ITS) rRNA [1] [6] | 28S LSU rRNA, Cytochrome c oxidase I (COI) [1] | COI performs well in some fungal groups but not all; more than one primer combination is often required [1]. |
| Protists (e.g., parasitic protozoa) | 18S rRNA gene (V4 subregion) [1] | D1–D2 or D2–D3 regions of 28S rDNA, ITS rDNA, COI [1] | A variety of barcodes are used; no single standard has been universally adopted for all protists. |
| Prokaryotes (Bacteria) | 16S rRNA gene [1] | Type II chaperonin (cpn60), β subunit of RNA polymerase (rpoB) [1] | The 16S gene is highly conserved and widely used for different bacterial taxa [1]. |
| Plants | Maturase K (matK), Ribulose-bisphosphate carboxylase (rbcL) [1] [6] | ITS DNA, trnH-psbA spacer [1] [6] | Plant mitochondrial genes evolve too slowly; multi-locus markers from the chloroplast genome provide better discrimination [1]. |
For gastrointestinal helminth parasites, a systematic review found that studies utilize a variety of genetic marker regions, with the choice impacting the taxonomic resolution and success of identification [7]. This underscores the importance of selecting a marker with a sufficient "barcoding gap" for the specific parasitic group under investigation.
Sanger Sequencing vs. NGS: A Technical Comparison for Barcoding
The core DNA barcoding workflow can be implemented using different sequencing technologies, primarily Sanger sequencing and Next-Generation Sequencing (NGS). The choice between them is fundamental and depends on the research question, scale, and available resources.
Technology Comparison
The table below provides a detailed comparison of Sanger sequencing and NGS in the context of DNA barcoding.
Table 2: Comparative Analysis of Sanger Sequencing and NGS for DNA Barcoding Applications
| Feature | Sanger Sequencing | Next-Generation Sequencing (NGS) |
|---|---|---|
| Fundamental Method | Chain termination using dideoxynucleotides (ddNTPs) and capillary electrophoresis [8] [9]. | Massively parallel sequencing (e.g., Sequencing by Synthesis) of millions to billions of DNA fragments simultaneously [8]. |
| Typical Output | Single, long contiguous read per reaction (500–1000 bp) [8] [9]. | Millions to billions of short reads (50–300 bp) [8]. |
| Throughput & Scalability | Low to medium throughput. Ideal for individual samples or small batches. Processes one specimen per reaction [8]. | Extremely high throughput. Capable of sequencing entire genomes or hundreds of multiplexed samples in a single run [8]. |
| Cost Basis | Low cost per run for small projects, but high cost per base. Lower initial instrument cost [8]. | High capital and reagent cost per run, but very low cost per base. Economical for large-scale projects [8]. |
| Accuracy | Exceptionally high per-base accuracy (~99.999%; Phred score > Q50), making it the "gold standard" for confirmation [8] [9]. | High overall accuracy is achieved through high depth of coverage, which allows for statistical correction of random errors in individual reads [8]. |
| Ideal Barcoding Application | - Targeted confirmation of specific variants [8]. - Sequencing single, isolated specimens [1]. - Validating results from NGS or other high-throughput screens [8] [9]. | - DNA Metabarcoding: Identifying multiple species from a bulk environmental sample (e.g., stool, water, soil) [1] [7]. - eDNA analysis [3] [1]. - Discovering unknown or cryptic species in a community [7]. |
| Bioinformatics Demand | Low. Requires basic sequence alignment software [8]. | High. Requires sophisticated pipelines for read alignment, variant calling, and data management, plus significant computing resources [8]. |
Decision Workflow: Selecting the Right Technology
The choice between Sanger and NGS is not mutually exclusive; they are often used in complementary ways. The following diagram outlines a decision process for selecting the appropriate sequencing method based on project goals.
Experimental Protocols
Protocol A: Sanger Sequencing for Single-Specimen DNA Barcoding
This protocol is designed for generating a DNA barcode from an individual parasite specimen.
1. Sample Collection and Preservation
- Tissue Sampling: For a single specimen, a small piece of tissue (e.g., a proglottid from a cestode, a section of a nematode, a leg from an insect vector) is sufficient. To avoid contamination, sterilize tools (e.g., scalpels, forceps) between samples. It is recommended to collect two samples from one specimen: one for DNA analysis and one as a voucher specimen for archival in a museum or herbarium [1].
- Preservation: Preserve tissue samples immediately in 95-100% ethanol or place in a -20°C/-80°C freezer. Avoid using formalin, as it degrades DNA. Proper preservation is crucial to prevent DNA degradation [1].
2. DNA Extraction
- Method Selection: Use a commercial DNA extraction kit (e.g., DNeasy Blood & Tissue Kit from Qiagen) suitable for the sample type. The method should be optimized for yield and purity while removing inhibitors like polysaccharides or humic acids that can affect downstream PCR [1].
- Inhibitor Removal: Ensure the extraction method effectively removes PCR inhibitors. Additional purification steps may be necessary for complex samples [1].
3. PCR Amplification of the Barcode Region
- Primer Selection: Choose universal or group-specific primers for the target barcode marker (e.g., COI for a helminth, ITS for a fungus). Primers should target the standardized barcode region for the organismal group (see Table 1).
- PCR Reaction: Set up a standard polymerase chain reaction (PCR) using a high-fidelity DNA polymerase to minimize amplification errors. The reaction typically includes template DNA, primers, dNTPs, reaction buffer, and polymerase.
- Thermocycling Conditions: Conditions are primer-specific but generally involve an initial denaturation (e.g., 95°C for 2 min), followed by 30-40 cycles of denaturation (e.g., 95°C for 30 s), annealing (primer-specific temperature for 30 s), and extension (e.g., 72°C for 45-60 s), with a final extension (e.g., 72°C for 5-10 min) [6].
- Amplicon Verification: Check the success and specificity of the PCR by running a portion of the product on an agarose gel. A single, bright band of the expected size should be visible.
4. Sequencing
- Purification: Purify the PCR product to remove excess primers, dNTPs, and enzymes. Use a commercial PCR purification kit.
- Sequencing Reaction: Prepare a sequencing reaction using the same primers as for PCR (or internal primers for larger fragments). The reaction uses fluorescently labeled ddNTPs in a cycle-sequencing protocol [8] [9].
- Capillary Electrophoresis: The reaction products are cleaned up and loaded into an automated Sanger sequencer, where they are separated by size via capillary electrophoresis. The instrument detects the fluorescent signal and generates a chromatogram (sequence trace file) [8] [9].
5. Data Analysis
- Sequence Editing: Manually inspect the chromatogram using software (e.g., Geneious, CodonCode Aligner) to correct any base-calling errors and trim low-quality sequence ends.
- Sequence Alignment: Perform a basic local alignment (e.g., using BLAST) against a reference database.
- Identification: Query the curated sequence against a dedicated barcode database like the Barcode of Life Data System (BOLD). A sequence similarity of ≥97-98% is often used as a threshold for species-level identification, but this can vary by group and should be interpreted in the context of the barcoding gap [2].
Protocol B: NGS Metabarcoding for Parasite Community Analysis
This protocol is used for identifying the composition of parasite communities from complex samples like fecal material, blood, or environmental water.
1. Sample Collection and DNA Extraction (from Bulk Sample)
- Sample Type: Collect the bulk sample (e.g., stool, water from a transmission site, invertebrate vectors pooled by location). Use DNA-free materials to avoid contamination, especially for eDNA samples where target DNA may be at low abundance [1].
- DNA Extraction: Extract total genomic DNA from the bulk sample. The extraction method must be robust and capable of lysing diverse cell types (e.g., fungal spores, helminth eggs). The resulting DNA is a mixture from all organisms present in the sample.
2. Library Preparation (PCR with Indexed Primers)
- Primer Design: Design primers that amplify a short, informative barcode region (e.g., a portion of COI, 18S V4 region). The primers must include:
- Platform-specific adapters: For binding to the sequencing flow cell.
- Unique dual indices (barcodes): Short, sample-specific nucleotide sequences added to each sample during a second PCR step. This allows multiple samples to be pooled together into a single sequencing run (multiplexing) and computationally sorted after sequencing.
- Amplification: Perform a PCR amplification for each sample using these indexed primers. Using a high-fidelity polymerase is critical to reduce errors in the final data.
3. Sequencing
- Pooling and Clean-up: Quantify the amplified libraries, pool them in equimolar ratios, and purify the pool.
- Massively Parallel Sequencing: Load the pooled library onto an NGS platform (e.g., Illumina MiSeq or HiSeq). The platform performs sequencing by synthesis, generating millions of short reads from all the amplified DNA fragments in the pool simultaneously [8] [7].
4. Bioinformatic Analysis
- Demultiplexing: Assign the sequenced reads back to their original samples based on the unique dual indices.
- Quality Filtering & Trimming: Remove low-quality reads and trim primers/adapters from the sequences.
- Clustering into OTUs/ASVs: Cluster the high-quality sequences into Operational Taxonomic Units (OTUs) or Amplicon Sequence Variants (ASVs) based on sequence similarity. This groups sequences that are likely from the same species.
- Taxonomic Assignment: Compare the representative sequence from each OTU/ASV against a reference database (e.g., SILVA for rRNA genes, BOLD for COI) to assign taxonomic identities [3] [1] [7]. The output is a table detailing the parasite community composition for each sample.
The Scientist's Toolkit: Essential Research Reagents and Materials
Table 3: Key Research Reagent Solutions for DNA Barcoding
| Item | Function/Application | Examples / Key Characteristics |
|---|---|---|
| DNA Extraction Kits | Isolation of high-quality, inhibitor-free genomic DNA from diverse sample types (tissue, feces, water). | Kits optimized for specific sample matrices (e.g., soil, stool, formalin-fixed tissue). Examples: DNeasy Blood & Tissue Kit (Qiagen), PowerSoil DNA Isolation Kit (MoBio). |
| High-Fidelity DNA Polymerase | Accurate amplification of the target barcode region with low error rates during PCR. | Enzymes with proofreading activity (3'→5' exonuclease). Examples: Q5 High-Fidelity DNA Polymerase (NEB), Phusion High-Fidelity DNA Polymerase (Thermo Fisher). |
| Standardized Barcode Primers | PCR amplification of the specific, standardized gene region for the target organism group. | Universally applicable primer sets for markers like COI (e.g., LCO1490/HCO2198), ITS (e.g., ITS1/ITS4), 16S (e.g., 27F/1492R). |
| Sanger Sequencing Kits | Preparation of fluorescently labeled sequencing fragments for capillary electrophoresis. | BigDye Terminator v3.1 Cycle Sequencing Kit (Thermo Fisher). |
| NGS Library Prep Kits | Preparation of sequencing-ready libraries from amplified PCR products, including indexing for multiplexing. | Illumina DNA Prep Kit. Kits must be compatible with the chosen sequencing platform. |
| Reference Databases | Curated libraries of known DNA barcodes for taxonomic identification of unknown sequences. | Barcode of Life Data System (BOLD), SILVA (rRNA genes), PR2 (protist rRNA genes) [3] [1]. |
| Bioinformatics Software | Processing, analyzing, and interpreting raw sequencing data. | - For Sanger: Geneious, CodonCode Aligner.- For NGS: QIIME 2, mothur, DADA2 for metabarcoding analysis [7]. |
DNA barcoding has emerged as an indispensable tool in modern parasitology, providing a rapid and standardized method for identifying parasites, their vectors, and reservoirs with a level of resolution that often surpasses traditional morphology-based approaches [4] [7]. The technique's power is amplified when combined with either Sanger sequencing for targeted, high-confidence identification of individual specimens, or with NGS-based metabarcoding for comprehensive profiling of complex parasite communities [8] [7].
The choice between Sanger and NGS is not a question of which is superior, but rather which is optimal for the specific research objective. Sanger sequencing remains the gold standard for validation and small-scale projects, while NGS is transformative for large-scale biodiversity surveys, discovery of cryptic species, and holistic studies of parasite communities [8] [7]. As reference libraries like BOLD continue to expand, the accuracy and scope of DNA barcoding will only increase, solidifying its role as a cornerstone technology for scientific research, disease control, and biodiversity conservation [3] [2].
For parasite DNA barcoding research, the selection of an appropriate sequencing methodology is paramount to achieving accurate species identification and phylogenetic analysis. Despite the rise of high-throughput technologies, Sanger sequencing, developed by Frederick Sanger and colleagues in 1977, remains the gold standard for accuracy and reliability for specific, targeted sequencing applications [10] [11]. Its exceptional precision, often cited as >99.99% base accuracy, makes it an indispensable tool for validating DNA sequences, including those generated by Next-Generation Sequencing (NGS) platforms [10] [12]. This application note details the principle, protocol, and application of the chain-termination method, contextualizing its use within parasite DNA barcoding research where confirming the sequence of a specific genetic locus (e.g., 18S rRNA, COI) is critical for diagnosis, surveillance, and drug development.
Principle of the Chain-Termination Method
The core principle of Sanger sequencing is the termination of DNA synthesis at specific nucleotide bases using dideoxynucleotide triphosphates (ddNTPs). The process relies on a DNA polymerase to synthesize a new DNA strand complementary to the single-stranded template DNA.
During the sequencing reaction, the polymerase incorporates deoxynucleotide triphosphates (dNTPs) to extend the DNA chain. Critically, the reaction also includes a small proportion of fluorescently labeled dideoxynucleotide triphosphates (ddNTPs). Structurally, ddNTPs lack a 3'-hydroxyl group that is essential for forming the phosphodiester bond with the next incoming nucleotide [10] [11] [13]. When a ddNTP is incorporated into the growing DNA chain instead of a dNTP, the absence of the 3'-OH group halts further elongation, resulting in chain termination [11].
In modern, automated Sanger sequencing, each of the four ddNTPs (ddATP, ddTTP, ddCTP, ddGTP) is labeled with a distinct fluorescent dye [14]. This setup allows the reaction to be performed in a single tube, generating a collection of DNA fragments of varying lengths, each terminating at a specific base and fluorescing with a color corresponding to that terminal ddNTP.
Diagram 1: The fundamental principle of chain termination during DNA synthesis in Sanger sequencing. The incorporation of a ddNTP halts further elongation.
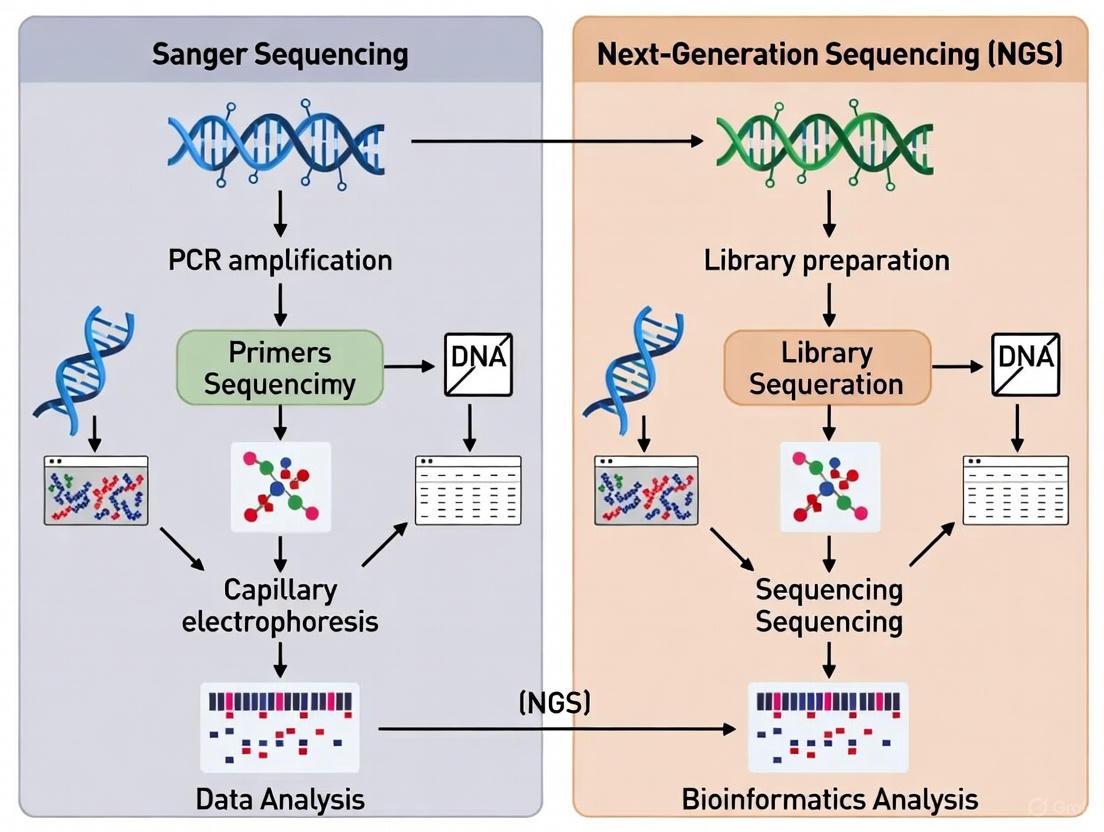
Sanger Sequencing Workflow
The Sanger sequencing method can be broken down into a series of standardized steps, from template preparation to sequence analysis, as illustrated below and detailed in the subsequent protocol.
Diagram 2: The end-to-end workflow for a typical Sanger sequencing experiment.
Detailed Experimental Protocol
Protocol: Sanger Sequencing for Parasite DNA Barcoding
I. DNA Template Preparation
- Input Material: Use purified PCR product (amplicon) containing the target barcode locus (e.g., ~600 bp region of the 18S rRNA gene).
- Purification: Clean the PCR product to remove excess primers, dNTPs, and enzymes. Use a column-based purification kit or enzymatic clean-up (e.g., ExoSAP-IT) [11] [13].
- Quantification: Accurately measure the DNA concentration using a spectrophotometer (e.g., Nanodrop) or fluorometer. Aim for 10–30 ng/μL of purified PCR product for optimal results [14].
- Goal: Deliver a high-quality, single-stranded DNA template for the sequencing reaction.
II. Cycle Sequencing PCR (Chain Termination PCR) This is a specialized PCR reaction that generates the terminated fragments.
- Reaction Setup (10 μL example volume):
- Template DNA: 1–10 ng (or 1–5 μL of purified PCR product)
- Sequencing Primer: 3.2 pmol (typically 1–2 μL of a 1–5 μM stock). Use a single primer, specific to one end of your barcode amplicon.
- Ready Reaction Mix: 4 μL (This commercial mix contains DNA polymerase, buffer, dNTPs, and fluorescently labeled ddNTPs) [11] [13].
- Nuclease-free water: to 10 μL.
- Thermal Cycling Conditions:
- Initial Denaturation: 96°C for 1 minute.
- 25–35 Cycles of:
- Denaturation: 96°C for 10 seconds.
- Annealing: 50–55°C for 5–10 seconds.
- Extension: 60°C for 4 minutes.
- Final Hold: 4°C [13].
- Post-Reaction Clean-up: Purify the reaction products to remove unincorporated ddNTPs and salts. This can be done using column-based kits or ethanol/sodium acetate precipitation.
III. Capillary Electrophoresis
- Loading: The purified sequencing reaction is loaded into a capillary filled with a polymer matrix.
- Separation: An electric current is applied. The negatively charged DNA fragments are drawn through the capillary, separating by size, with the smallest fragments migrating fastest [11] [13].
- Process: This is performed in automated DNA sequencers (e.g., Applied Biosystems ABI 3730).
IV. Detection and Data Analysis
- Laser Excitation: As DNA fragments pass a detector at the end of the capillary, a laser excites their fluorescent dyes.
- Signal Capture: A charged-coupled device (CCD) camera captures the fluorescence emitted by each fragment, identifying the terminal base [14].
- Chromatogram Generation: Software converts these signals into a sequence chromatogram, which displays colored peaks corresponding to each base in the sequence [11].
- Sequence Analysis: Manually inspect the chromatogram for quality. High-quality data shows sharp, well-spaced, non-overlapping peaks. Use sequence analysis software (e.g., SnapGene Viewer, FinchTV) to align the sequence against reference barcode databases for parasite identification [14].
Sanger Sequencing vs. NGS for Parasite DNA Barcoding
The choice between Sanger sequencing and NGS depends on the specific goals of the parasite barcoding project. The table below provides a quantitative comparison to guide this decision.
Table 1: Comparative analysis of Sanger sequencing and NGS for DNA barcoding applications.
| Aspect | Sanger Sequencing | Next-Generation Sequencing (NGS) |
|---|---|---|
| Principle | Chain-termination method [10] | Massively parallel sequencing [15] [16] |
| Throughput | Low; one fragment per reaction [17] | Very high; millions of fragments per run [16] [18] |
| Read Length | 800–1,000 bp [10] [11] | Varies; typically shorter (e.g., Illumina: 36–300 bp) [10] [15] |
| Accuracy | >99.99% (Gold Standard) [10] [12] | High, but may require deeper coverage for confidence [10] |
| Cost per Sample | Cost-effective for 1–20 targets [16] [17] | Cost-effective for high-throughput; higher startup cost [16] [19] |
| Speed (Turnaround) | Relatively slow for high sample numbers [10] | Faster for high sample volumes [16] [18] |
| Variant Detection Sensitivity | Low; limit of detection ~15–20% [16] [17] | High; can detect variants down to ~1% frequency [16] [17] |
| Data Analysis | Straightforward; minimal bioinformatics [13] | Complex; requires specialized bioinformatics tools [13] [18] |
| Ideal Application in Barcoding | Validation of NGS results, sequencing specific clones, targeted single-gene barcoding [11] [14] | Discovery, metagenomics, identifying mixed parasite infections, population studies [15] [18] |
A 2016 systematic evaluation of over 5,800 NGS-derived variants found a validation rate of 99.965% when checked with Sanger sequencing, underscoring its role as a reliable validator [12]. For parasite barcoding, this means Sanger is ideal for definitively confirming the sequence of a specific PCR amplicon from a purified sample or clone. In contrast, NGS is unparalleled for analyzing complex, mixed-infection samples directly from host tissue or environmental sources.
Table 2: Key reagent solutions for a Sanger sequencing experiment.
| Research Reagent / Material | Function in the Protocol |
|---|---|
| Purified DNA Template (PCR amplicon) | The target DNA fragment (e.g., parasite barcode locus) to be sequenced. Provides the sequence of interest. |
| Sequence-Specific Primer | A short, single-stranded DNA oligonucleotide that binds specifically to the template, providing a starting point for DNA polymerase. |
| BigDye Terminators / Ready Reaction Mix | Commercial mix containing DNA polymerase, buffer, dNTPs, and fluorescently labeled ddNTPs. The core reagent for the chain-termination sequencing reaction [12] [14]. |
| Capillary Electrophoresis System (e.g., ABI 3730) | Automated instrument that separates terminated DNA fragments by size and detects their fluorescent signals [13]. |
| Sequence Analysis Software (e.g., SnapGene Viewer) | Software for visualizing the sequence chromatogram, performing base calling, and analyzing the quality of the sequence data [14]. |
Next-Generation Sequencing (NGS), also known as Massively Parallel Sequencing (MPS), represents a fundamental shift in DNA sequencing technology that has revolutionized biological research and clinical diagnostics. Unlike traditional Sanger sequencing, which processes a single DNA fragment at a time, NGS enables the parallel sequencing of millions to billions of DNA fragments simultaneously [20]. This technological leap provides ultra-high throughput, scalability, and speed at a significantly reduced cost per base, making large-scale genomic studies feasible for average research laboratories [15] [20].
The evolution from first-generation Sanger sequencing to NGS has transformed research capabilities across diverse fields. While Sanger sequencing revolutionized molecular biology in the late 20th century, its relatively low throughput and high cost limited its application for large-scale projects [15]. NGS has effectively addressed these limitations, enabling researchers to explore complex biological systems at an unprecedented resolution and scale, from whole genome sequencing to targeted analysis of specific genomic regions [15] [20]. This paradigm shift is particularly valuable for parasite DNA barcoding research, where the ability to simultaneously sequence multiple markers across numerous specimens provides powerful advantages over traditional approaches.
NGS Technology and Platforms
Core Technological Principles
NGS technologies share a common foundation of massively parallel sequencing but employ different biochemical approaches for determining DNA sequences. The most widespread method is sequencing by synthesis (SBS), which tracks the addition of fluorescently labeled nucleotides as the DNA chain is copied [20]. The Illumina platform implements this approach using reversible terminator chemistry, where each nucleotide incorporation is detected before the terminator is removed to allow the next incorporation [15]. This method generates highly accurate sequencing data but typically produces shorter reads compared to other technologies.
Alternative NGS platforms utilize different detection mechanisms. Ion Torrent technology employs semiconductor sequencing that detects hydrogen ions released during DNA polymerase-mediated nucleotide incorporation [21] [15]. This approach eliminates the need for optical scanning, significantly reducing sequencing time, but has higher error rates in homopolymer regions [21]. Pyrosequencing (used in the 454 platform) detects the release of pyrophosphate during nucleotide incorporation, while sequencing by ligation (used in SOLiD platforms) utilizes DNA ligase rather than polymerase to determine the sequence [15].
Third-generation sequencing technologies, such as Pacific Biosciences (PacBio) and Oxford Nanopore, have further expanded NGS capabilities by enabling single-molecule real-time sequencing without the need for PCR amplification [15]. These technologies produce significantly longer reads, which are particularly valuable for resolving complex genomic regions and detecting structural variants, though they traditionally had higher error rates than Illumina platforms [15].
Comparison of Major NGS Platforms
Table 1: Technical Specifications of Major NGS Platforms
| Platform | Sequencing Technology | Amplification Method | Read Length | Key Advantages | Primary Limitations |
|---|---|---|---|---|---|
| Illumina | Sequencing by synthesis | Bridge PCR | 36-300 bp | High accuracy, low error rates (~0.1%) | Signal crowding can increase error rates to ~1% with overloading [15] |
| Ion Torrent | Semiconductor sequencing | Emulsion PCR | 200-400 bp | Fast run times, no optical detection | Homopolymer errors, higher error rates (≥1%) [21] [15] |
| 454 Pyrosequencing | Pyrosequencing | Emulsion PCR | 400-1000 bp | Longer reads than early Illumina | Expensive, insertion/deletion errors in homopolymers [15] |
| PacBio SMRT | Single molecule real-time | None required | 10,000-25,000 bp | Very long reads, detects epigenetic modifications | Higher cost, lower throughput [15] |
| Oxford Nanopore | Nanopore sensing | None required | 10,000-30,000 bp | Longest reads, real-time analysis, portable | Highest error rates (up to 15%) [15] |
NGS Workflow and Experimental Design
Standard NGS Workflow
The standard NGS workflow consists of three main steps: library preparation, sequencing, and data analysis [20]. Library preparation involves fragmenting DNA or RNA samples and attaching adapter sequences that facilitate amplification and sequencing. For targeted sequencing approaches like DNA barcoding, this step typically includes PCR amplification with primers designed to target specific genomic regions of interest [22] [23].
During sequencing, the prepared libraries are loaded onto NGS platforms where massive parallel sequencing occurs through platform-specific detection methods. The output consists of short DNA sequences (reads) that are subsequently assembled and analyzed using bioinformatic tools [20].
The following diagram illustrates the generalized NGS workflow for parasite DNA barcoding research:
Experimental Design Considerations for Parasite DNA Barcoding
Effective experimental design for parasite DNA barcoding requires careful consideration of several factors:
Marker Selection: Different genomic regions are appropriate for different organisms. The cytochrome c oxidase subunit 1 (CO1) gene serves as the standard barcode for animals, while the 18S rRNA gene and internal transcribed spacer (ITS) regions are commonly used for protists and fungi [24] [23]. For parasite research, selection of the appropriate barcode region is critical for achieving sufficient taxonomic resolution.
Sample Multiplexing: To maximize throughput and cost-effectiveness, multiple samples can be sequenced simultaneously by adding unique oligonucleotide tags (barcodes or indices) to each sample during library preparation [22]. This approach allows sequencing of hundreds of specimens in a single run, with bioinformatic demultiplexing to assign sequences to their original samples.
Sequencing Depth: The required sequencing depth depends on the application. For DNA barcoding aimed at species identification, moderate coverage is typically sufficient, while detection of rare variants or heteroplasmy requires deeper sequencing [22] [25].
Control Implementation: Including positive controls (samples with known sequences) and negative controls (no-template samples) is essential for validating sequencing accuracy and detecting contamination [23].
Application Notes for Parasite DNA Barcoding
Advantages of NGS over Sanger Sequencing for Parasite Research
NGS offers several significant advantages for parasite DNA barcoding research compared to traditional Sanger sequencing:
Enhanced Detection of Mixed Infections: NGS can detect and resolve multiple parasite species or strains within a single sample, which is particularly valuable for identifying co-infections that may be missed by Sanger sequencing [22] [23].
Discovery of Novel Species: The ability to sequence complex mixtures without prior purification enables discovery of novel parasite species that would be difficult to isolate and culture [24].
Resolution of Intra-individual Variation: NGS can detect heteroplasmy (intra-individual sequence variation) in parasite populations, providing insights into parasite biology and evolution [22].
High Throughput at Reduced Cost: While Sanger sequencing requires individual reactions for each specimen and amplicon, NGS allows parallel sequencing of thousands of specimens simultaneously, dramatically reducing per-sample costs [22] [24].
Multi-locus Sequencing: NGS facilitates simultaneous sequencing of multiple barcode regions, improving taxonomic resolution and enabling more robust phylogenetic analyses [21] [24].
Table 2: Comparison of Sanger Sequencing and NGS for Parasite DNA Barcoding
| Parameter | Sanger Sequencing | NGS |
|---|---|---|
| Throughput | 1-96 samples per run | Millions to billions of reads per run |
| Cost per Sample | Higher for large-scale studies | Significantly lower for large-scale studies |
| Multiplexing Capability | Limited | High (hundreds to thousands of samples) |
| Detection of Mixed Infections | Limited, requires cloning | Excellent, can resolve multiple species |
| Novel Species Discovery | Requires individual processing | Enabled by untargeted approaches |
| Data Complexity | Single sequence per reaction | Multiple sequences per sample |
| Equipment Requirements | Lower | Higher |
| Bioinformatic Needs | Minimal | Substantial |
Protocol: DNA Barcoding of Tick-Borne Protists Using 18S rRNA Gene
Based on a recent study investigating tick-borne protists, the following protocol details DNA barcoding using the 18S rRNA gene with the Illumina MiSeq platform [23]:
Sample Preparation and DNA Extraction
- Sample Collection and Preservation: Collect ticks from field locations using appropriate methods (e.g., flagging). Preserve specimens in 70% ethanol at room temperature until processing.
- Morphological Identification: Identify tick species and developmental stages using standard morphological keys.
- Sample Pooling: Pool specimens to reduce processing costs: up to 10 nymphs or 50 larvae per pool. Process individual adults separately.
- Homogenization: Combine pooled ticks with PBS and homogenize using bead beating methods.
- DNA Extraction: Extract genomic DNA using the DNeasy Blood & Tissue Kit (Qiagen) or equivalent, following manufacturer's protocols.
- DNA Quantification: Measure DNA concentration using a spectrophotometer (e.g., DeNovix) or fluorometric methods.
Library Preparation for 18S rRNA Barcoding
- DNA Normalization: Normalize DNA concentrations across samples using Qubit dsDNA Quantification Assay Kits to minimize bias.
- Primer Selection: Select appropriate primers targeting variable regions of the 18S rRNA gene. The V4 and V9 regions have been successfully used for protist diversity studies:
- V4 region forward: 5'-TCGTCGGCAGCGTCAGATGTGTATAAGAGACAGCCAGCAGCCGCGGTAATTCC-3'
- V4 region reverse: 5'-GTCTCGTGGGCTCGGAGATGTGTATAAGAGACAGACTTTCGTTCTTGAT-3'
- V9 region forward: 5'-TCGTCGGCAGCGTCAGATGTGTATAAGAGACAGCCCCTGCHTTTGTACACAC-3'
- V9 region reverse: 5'-GTCTCGTGGGCTCGGAGATGTGTATAAGAGACAGCCCTTCYGCAGGTTCACCTAC-3'
- Initial PCR Amplification:
- Reaction volume: 25 μL
- Template DNA: 2 μL
- Primer concentration: 0.2 μM each
- Cycling conditions: 3 min at 95°C; 25 cycles of 30 s at 95°C, 30 s at 55°C, 30 s at 72°C; final extension 5 min at 72°C
- Library Indexing: Perform a second PCR (8-10 cycles) to attach dual indices and Illumina sequencing adapters using the Nextera XT Index Kit.
- Library Purification: Clean PCR products using AMPure beads (Agencourt Bioscience).
- Library Quantification and Qualification: Quantify final libraries using qPCR according to the KAPA Library Quantification protocol. Assess quality using TapeStation D1000 ScreenTape (Agilent Technologies).
Sequencing and Data Analysis
- Sequencing: Pool normalized libraries and sequence on Illumina MiSeq platform using 2×250 bp or 2×300 bp paired-end chemistry.
- Data Preprocessing:
- Remove adapter and primer sequences using Cutadapt v3.2+
- Trim forward and reverse reads to 250 bp and 200 bp, respectively
- Sequence Processing:
- Perform read error correction, merging, and denoising using DADA2 v1.18+
- Remove chimeric sequences using the consensus method of removeBimeraDenovo function
- Generate amplicon sequence variants (ASVs) for downstream analysis
- Taxonomic Assignment:
- Align ASVs to reference databases (e.g., NCBI NT) using BLAST
- Assign taxonomy based on highest similarity matches
- Validation: Confirm NGS findings using conventional or real-time PCR with species-specific primers.
Technical Considerations and Limitations
Despite its powerful capabilities, NGS-based DNA barcoding presents several technical challenges that require consideration:
Primer Bias: Different primer sets can yield different results in DNA barcoding studies, as demonstrated in tick-borne protist research where V4 and V9 regions of the 18S rRNA gene identified different sets of protozoa [23]. This highlights the importance of primer validation and potentially using multiple primer sets for comprehensive analysis.
Quantification Accuracy: While NGS read counts generally reflect relative abundances in mixtures, various factors can introduce quantification biases, including PCR amplification efficiency differences, variable sequencing depth, and bioinformatic processing artifacts [25] [15]. Including control mixtures with known ratios can help assess and correct for these biases.
Contamination Detection: The sensitivity of NGS makes it susceptible to detecting contaminants, such as intracellular endosymbionts (e.g., Wolbachia) or environmental DNA [22]. Careful experimental controls and bioinformatic filtering are essential to distinguish true parasite sequences from contaminants.
Reference Database Limitations: Accurate taxonomic assignment depends on comprehensive reference databases. For many parasite groups, particularly rare or newly discovered species, reference sequences may be absent or poorly represented in databases [24].
The Scientist's Toolkit: Essential Research Reagents and Materials
Table 3: Essential Research Reagents for NGS-based Parasite DNA Barcoding
| Reagent/Material | Function | Examples/Alternatives |
|---|---|---|
| DNA Extraction Kit | Isolation of high-quality genomic DNA from specimens | DNeasy Blood & Tissue Kit (Qiagen), Phenol-chloroform extraction |
| PCR Enzymes | Amplification of target barcode regions | High-fidelity DNA polymerases (e.g., Platinum Taq, Q5) |
| Sequence-Specific Primers | Target enrichment of barcode regions | CO1 primers for animals, 18S rRNA primers for protists |
| Multiplexing Oligos | Sample-specific barcoding for multiplexing | Nextera XT Index Kit, TruSeq DNA CD Indexes |
| Library Prep Kit | Preparation of sequencing libraries | Illumina DNA Prep, KAPA HyperPrep Kit |
| Size Selection Beads | Fragment size selection and purification | AMPure XP beads, SPRIselect |
| Quantification Kits | Accurate measurement of DNA concentration | Qubit dsDNA HS Assay Kit, KAPA Library Quantification Kit |
| Quality Control Tools | Assessment of library quality and size distribution | TapeStation D1000 ScreenTape, Bioanalyzer DNA chips |
| Sequencing Consumables | Platform-specific flow cells and reagents | MiSeq Reagent Kit v3, NovaSeq S-Prime Flow Cell |
| Bioinformatics Tools | Data processing and analysis | Cutadapt, DADA2, BLAST, QIIME2, custom scripts |
Next-Generation Sequencing has fundamentally transformed parasite DNA barcoding research, enabling high-throughput, cost-effective species identification and discovery at a scale unimaginable with Sanger sequencing. The ability to simultaneously sequence thousands of specimens and multiple genetic loci provides unprecedented resolution for studying parasite diversity, ecology, and evolution.
As NGS technologies continue to evolve, several trends are likely to shape the future of parasite DNA barcoding. Third-generation sequencing platforms offering long-read capabilities are becoming increasingly accessible, potentially overcoming current limitations in resolving complex or repetitive genomic regions [15]. The ongoing reduction in sequencing costs is making large-scale barcoding projects more feasible, facilitating comprehensive biodiversity surveys and monitoring programs [24]. Additionally, improvements in bioinformatic tools and reference databases will enhance the accuracy and efficiency of taxonomic assignments.
For researchers embarking on parasite DNA barcoding studies, NGS offers powerful advantages but requires careful experimental design and validation. The protocols and applications outlined in this overview provide a foundation for leveraging this transformative technology to advance our understanding of parasite diversity and biology.
The selection of an appropriate DNA sequencing technology is a critical step in experimental design, particularly for specialized applications such as parasite DNA barcoding. This field requires a precise balance of read length to capture barcode regions, throughput to handle multiple samples or species, and accuracy to ensure correct taxonomic identification. While Sanger sequencing has been the long-standing gold standard for focused projects, Next-Generation Sequencing (NGS) technologies offer a suite of high-throughput options, including both short-read (e.g., Illumina) and long-read (e.g., PacBio, Oxford Nanopore) platforms [17] [26] [27]. This application note provides a detailed, technical comparison of these technologies, framed within the context of parasite research, to guide researchers in selecting the optimal methodology for their barcoding initiatives.
Comprehensive Comparison of Technical Specifications
The core technical specifications of sequencing technologies directly determine their suitability for parasite DNA barcoding. The table below provides a quantitative comparison of Sanger sequencing, dominant NGS short-read technologies, and emerging long-read platforms.
Table 1: Key Technical Specifications of Major Sequencing Platforms
| Technology & Example Platform | Typical Read Length | Throughput per Run | Reported Accuracy | Key Strengths |
|---|---|---|---|---|
| Sanger Sequencing (Capillary Electrophoresis) | 500 - 1,000 bp [8] [28] | Low (One fragment per reaction) [17] [16] | >99.99% (Q50) [8] | Gold-standard accuracy; simple data analysis [26] [28] |
| NGS (Short-Read) - Illumina NovaSeq X | 50 - 300 bp [26] [27] | Up to 16 Tb; 26 billion reads [29] [27] | Q30 (99.9%) [27] | Extremely high throughput and low cost per base [16] [29] |
| NGS (Short-Read) - Element AVITI | Up to 300 bp [29] [27] | Up to 360 Gb [29] | Q40 (99.99%) [27] | Benchtop scale; very high accuracy [29] [19] |
| NGS (Long-Read) - PacBio Revio (HiFi) | 15,000 - 20,000 bp [29] | 360 Gb [29] | >99.9% (Q30) [30] [27] | High accuracy long reads; detects base modifications [30] [26] |
| NGS (Long-Read) - Oxford Nanopore (Duplex) | Thousands to millions of bases [26] | Up to 200 Gb (PromethION) [19] | >99.9% (Q30) with duplex chemistry [30] | Ultra-long reads; real-time analysis; portability [17] [26] |
Interpretation of Specifications for Parasite Barcoding
- Read Length: For single-locus barcoding (e.g., using ~650 bp of COI), Sanger sequencing provides a single, contiguous read, often covering the entire region [26]. While short-read NGS must assemble the barcode from multiple fragments, long-read NGS can easily encompass the entire barcode and flanking regions, which is advantageous for multi-locus or multi-marker barcoding approaches.
- Throughput: Sanger sequencing is optimal for projects involving tens to hundreds of samples [28]. NGS is unequivocally superior for large-scale biodiversity screens, enabling the multiplexing of thousands of samples in a single run through DNA barcoding [17] [16].
- Accuracy: Sanger's near-perfect accuracy makes it ideal for definitive validation of a reference sequence [8]. NGS accuracy is achieved through high coverage depth; for instance, a variant must be present in multiple overlapping reads to be confirmed, which also allows for the detection of mixed infections or cryptic species present in low frequency within a sample [17] [8].
Detailed Experimental Protocols
Protocol A: Sanger Sequencing for Targeted Parasite Barcode Validation
This protocol is designed for confirming the sequence of a specific DNA barcode region (e.g., COI, 18S) from a purified parasite sample or PCR product.
Workflow Overview:
Materials & Reagents:
- Parasite Genomic DNA: Template DNA extracted from a single parasite or purified isolate.
- Barcode-Specific Primers: Oligonucleotides designed to amplify the target barcode region (e.g., COI).
- PCR Master Mix: Includes thermostable DNA polymerase, dNTPs, and reaction buffer.
- Cycle Sequencing Kit: Contains BigDye terminators, DNA polymerase, and buffer.
- Capillary Sequencer: e.g., Applied Biosystems 3500 Series Genetic Analyzer.
Step-by-Step Methodology:
- PCR Amplification: Amplify the target DNA barcode region using gene-specific primers in a thermal cycler. Standard cycling conditions are: initial denaturation at 95°C for 2 min; 35 cycles of 95°C for 30s, primer-specific annealing temperature (50-60°C) for 30s, and 72°C for 1 min/kb; final extension at 72°C for 5-10 min.
- Amplicon Purification: Clean the PCR product to remove excess primers, dNTPs, and enzymes using a spin column-based purification kit or enzymatic cleanup. Verify amplification success and purity via agarose gel electrophoresis.
- Cycle Sequencing Reaction: Set up the Sanger sequencing reaction. A typical 10 µL reaction contains 1-10 ng of purified PCR product, 1-3.2 pmol of a single sequencing primer, and Ready Reaction Mix. Cycling parameters: rapid thermal ramp to 96°C; 25 cycles of 96°C for 10s, 50°C for 5s, and 60°C for 4 min.
- Post-Reaction Purification: Remove unincorporated dye terminators using a precipitation protocol (e.g., sodium acetate/EDTA) or a spin column.
- Capillary Electrophoresis: Load the purified sequencing reaction onto the capillary sequencer. The instrument will denature the DNA, inject it into the capillary, separate fragments by size, and detect fluorescent signals.
- Base Calling and Analysis: The sequencer's software will generate a chromatogram and call bases. Analyze the sequence using alignment software (e.g., Geneious, BLAST) for validation and comparison.
Protocol B: NGS-Based Parasite DNA Barcoding via Amplicon Sequencing
This protocol uses a targeted NGS approach to sequence DNA barcodes from hundreds to thousands of samples simultaneously, ideal for biodiversity studies or pathogen screening.
Workflow Overview:
Materials & Reagents:
- Barcoded PCR Primers: Fusion primers containing the NGS platform-specific adapter, a unique sample barcode index, and the target-specific sequence.
- High-Fidelity DNA Polymerase: Reduces PCR errors during amplification.
- NGS Library Preparation Kit: Specific to the chosen platform (e.g., Illumina MiSeq Reagent Kit).
- Magnetic Beads: For post-PCR and library clean-up and size selection.
- NGS Platform: e.g., Illumina MiSeq, iSeq; or PacBio Revio for long-read amplicons.
Step-by-Step Methodology:
- Template-Specific Amplification: For each parasite DNA sample, perform a first-round PCR with tailed primers that contain the gene-specific sequence. This ensures high specificity.
- Indexing PCR: In a second, limited-cycle PCR, add the full Illumina adapters and unique dual indices (UDIs) to each sample's amplicons. This step multiplexes the samples.
- Library Pooling and Purification: Quantify the indexed PCR products from each sample using a fluorometric method. Combine equimolar amounts of each product into a single pool. Purify the pooled library using magnetic beads to remove primer dimers and fragments outside the desired size range.
- Library Quality Control: Precisely quantify the final pooled library using qPCR (for Illumina) and assess size distribution and quality with a bioanalyzer or tape station.
- Sequencing: Dilute the library to the appropriate concentration and load it onto the NGS sequencer along with the necessary reagents (e.g., flow cell, buffer, nucleotides). For a 300 bp barcode, a 2x300 bp paired-end run on an Illumina MiSeq is typical.
- Bioinformatic Analysis:
- Demultiplexing: Assign raw sequence reads to individual samples based on their unique barcodes.
- Read Processing: Trim adapters and low-quality bases. Merge paired-end reads.
- Clustering: Cluster high-quality sequences into Amplicon Sequence Variants (ASVs) or Operational Taxonomic Units (OTUs) to identify unique taxa.
- Taxonomic Assignment: Compare ASVs/OTUs against a reference barcode database (e.g., BOLD System) for identification.
The Scientist's Toolkit: Essential Research Reagents and Materials
The following reagents are critical for successfully implementing the protocols described above.
Table 2: Essential Reagents for Parasite DNA Barcoding Studies
| Item | Function/Application | Example Use-Case |
|---|---|---|
| Barcode-Specific Primers | Amplify target gene regions (e.g., COI, 18S rRNA) from parasite DNA. | Designing primers for cytochrome c oxidase I (COI) for metazoan parasite identification. |
| High-Fidelity PCR Mix | Reduces errors during PCR amplification, crucial for generating accurate barcode sequences. | Used in the initial amplification step of both Sanger and NGS barcoding protocols. |
| Magnetic Bead-Based Cleanup Kits | Efficiently purify PCR products and NGS libraries by removing enzymes, salts, and short fragments. | Post-PCR cleanup and final NGS library size selection before sequencing. |
| Unique Dual Indexes (UDIs) | Molecular barcodes ligated to amplicons, allowing multiplexing of hundreds of samples in a single NGS run. | Pooling DNA from multiple parasite specimens or environmental samples for high-throughput screening. |
| NGS Library Prep Kit | Platform-specific reagents for preparing DNA fragments for sequencing (fragmentation, end-repair, adapter ligation). | Illumina DNA Prep kit for preparing amplicon libraries for the MiSeq platform. |
The choice between Sanger and NGS sequencing for parasite DNA barcoding is not a matter of one being universally superior, but rather which is optimal for the specific research objective.
Use Sanger Sequencing when: The project requires validating a limited number of specific sequences with gold-standard accuracy, such as confirming the identity of a known parasite from a host, generating reference barcodes for a local species, or verifying a small number of PCR products. Its straightforward workflow and minimal bioinformatics requirements make it highly efficient for these focused tasks [26] [28].
Use NGS Amplicon Sequencing when: The research involves large-scale biodiversity assessment, pathogen discovery, or analyzing complex samples. This includes identifying all parasite species in an environmental sample (e.g., water, soil), conducting large-scale host-parasite surveys, or detecting mixed infections and cryptic species [17] [8]. The massive throughput and ability to detect low-frequency variants are key advantages.
For comprehensive barcoding projects, a hybrid approach is often most powerful: using NGS for high-throughput discovery and initial screening, followed by Sanger sequencing for authoritative validation of critical or novel findings [28]. This strategy leverages the respective strengths of both technologies to ensure both breadth and depth in parasite DNA barcoding research.
The field of DNA sequencing has undergone a revolutionary transformation since Frederick Sanger first introduced the chain-termination method in 1977 [9] [31]. This groundbreaking work, which earned Sanger his second Nobel Prize, formed the foundational technology for deciphering genetic code for approximately four decades [31]. The original method relied on slab gel electrophoresis and was capable of determining only a few hundred bases per experiment with cumbersome, time-consuming operations [9]. The subsequent automation through capillary electrophoresis and fluorescent labeling significantly improved sequencing speed, throughput, and accuracy, establishing Sanger sequencing as the central technology for landmark projects including the Human Genome Project [9].
The genomics landscape experienced another seismic shift with the emergence of Next-Generation Sequencing (NGS) technologies, which fundamentally changed the economics and scale of genomic analysis [8] [15]. Unlike Sanger sequencing, which processes a single DNA fragment per reaction, NGS platforms leverage massively parallel sequencing to simultaneously process millions to billions of DNA fragments [8] [28]. This paradigm shift has enabled comprehensive genomic studies previously deemed impossible, dramatically reducing the cost per base while generating unprecedented volumes of data [8] [29].
For parasite DNA barcoding research, the choice between Sanger sequencing and NGS presents a critical strategic decision. This application note examines the technical evolution, comparative performance, and practical implementation of both sequencing paradigms within the specific context of parasite research, providing structured protocols and analytical frameworks to guide researcher selection and methodology optimization.
Technological Evolution and Comparative Analysis
Fundamental Methodological Divergence
The core distinction between Sanger and NGS technologies lies in their underlying biochemistry and detection mechanisms. Sanger sequencing, often termed the "chain termination method," utilizes dideoxynucleoside triphosphates (ddNTPs) that lack the 3'-hydroxyl group necessary for DNA chain elongation [8] [31]. When incorporated by DNA polymerase during in vitro replication, these ddNTPs terminate synthesis at specific positions, producing a nested set of DNA fragments that are separated by capillary electrophoresis to determine the base sequence [8].
In contrast, NGS encompasses multiple technological approaches united by the principle of massive parallelism [8] [15]. The most prevalent method, Sequencing by Synthesis (SBS), employs fluorescently labeled, reversible terminators that are incorporated one nucleotide at a time across millions of DNA clusters immobilized on a solid surface [8]. After each incorporation cycle, imaging detects the fluorescent signal, followed by terminator cleavage to enable subsequent cycles [8]. Alternative NGS chemistries include pyrosequencing (detecting pyrophosphate release), ion semiconductor sequencing (detecting hydrogen ion release), and sequencing by ligation [15].
Performance Characteristics and Technical Specifications
The following tables summarize the key technical parameters and performance characteristics of Sanger sequencing versus NGS platforms, with specific relevance to parasite DNA barcoding applications.
Table 1: Fundamental methodological comparison between Sanger sequencing and NGS
| Feature | Sanger Sequencing | Next-Generation Sequencing |
|---|---|---|
| Fundamental Method | Chain termination using ddNTPs [8] | Massively parallel sequencing (e.g., SBS, ligation, ion detection) [8] |
| Detection Method | Capillary electrophoresis with fluorescent detection [8] | High-resolution optical imaging of clustered fragments [8] |
| Output Type | Single, long contiguous read per reaction [8] | Millions to billions of short reads (paired or unpaired) [8] |
| DNA Input | High-quality, purified DNA required [28] | Compatible with degraded DNA, mixed samples, and low-input protocols [28] |
| Multiplexing | Limited | High-degree multiplexing with barcoding enables simultaneous sequencing of hundreds of samples [8] |
Table 2: Performance metrics and cost considerations for sequencing technologies
| Parameter | Sanger Sequencing | NGS Platforms |
|---|---|---|
| Read Length | 500-1000 bp [8] [28] | 50-300 bp (short-read); 10,000-30,000 bp (long-read) [8] [15] |
| Accuracy | ~99.99% (Phred score > Q50) [8] [31] | High overall accuracy achieved through depth of coverage; single-read accuracy typically lower than Sanger [8] |
| Cost per 1Mb | High (approximately $500 per 1000 bases in 2011) [32] | Very low (approximately $0.50 per 1000 bases in 2011) [32] |
| Throughput | Low to medium (individual samples or small batches) [8] | Extremely high (entire genomes or exomes in single run) [8] |
| Run Time | 1-2 hours for modern capillary systems [9] | Several hours to days depending on platform and application [29] |
| Best Applications | Single gene targets, variant confirmation, plasmid sequencing [8] [28] | Whole genome sequencing, metagenomics, transcriptomics, population studies [8] [28] |
The economic and temporal efficiencies of sequencing are drastically impacted by the choice of platform. While Sanger sequencing has lower initial instrument costs, its sequential nature and separate reaction requirements result in a high cost per base [8]. NGS, despite substantial capital investment, achieves significantly lower cost per base pair through massive parallelization, making large-scale projects financially viable [8]. Recent advancements continue to push these economics further, with platforms like the Ultima Genomics UG 100 potentially reducing human genome sequencing costs from approximately $500 to $100 [29].
Application to Parasite DNA Barcoding Research
Method Selection Framework
Parasite DNA barcoding presents unique challenges including mixed infections, low parasite DNA concentration in host tissues, and the need for accurate species identification from complex samples [33]. The selection between Sanger and NGS approaches depends on specific research objectives, sample characteristics, and resource constraints.
Sanger sequencing remains the preferred method for:
- Targeted single-species identification from high-quality, purified DNA samples [28]
- Confirmation of specific genetic variants initially discovered through NGS screening [8]
- Small-scale barcoding projects with limited targets (≤100 samples) and known primer sequences [32]
- Laboratories with minimal bioinformatics infrastructure due to straightforward data analysis [28]
NGS technologies are superior for:
- Metagenomic approaches identifying multiple parasite species in single samples [29]
- Population genetics studies requiring numerous samples or deep sequencing to detect rare variants [8]
- Discovery of novel parasite species or genetic markers without prior sequence knowledge [34]
- Large-scale surveillance studies where multiplexing provides significant cost and time savings [8]
Parasite Barcoding Experimental Protocols
Sanger Sequencing Protocol for Parasite DNA Barcoding
Principle: Amplification of specific barcode region (e.g., COX1, 18S rRNA) followed by chain-termination sequencing [31].
Workflow:
- DNA Extraction: Use commercial kits (e.g., QIAamp DNA Micro kit) for parasite DNA purification from host tissues, feces, or blood. Include negative controls.
- PCR Amplification:
- Primer Design: Select conserved regions flanking variable barcode region (e.g., primers for nematode COX1) [33].
- Reaction Setup: 25μL containing 10-100ng DNA, 1X PCR buffer, 2.5mM MgCl₂, 0.2mM dNTPs, 0.5μM each primer, 1.25U DNA polymerase.
- Thermocycling: Initial denaturation 95°C/3min; 35 cycles of 95°C/30s, 50-60°C/30s, 72°C/1min; final extension 72°C/7min.
- Amplicon Purification: Treat with Exonuclease I and Shrimp Alkaline Phosphatase (37°C/15min, 80°C/15min) or use bead-based clean-up.
- Sequencing Reaction:
- Dye-Terminator Mix: 2μL BigDye Terminator v3.1, 1μM primer, 50-100ng purified PCR product in 10μL total volume.
- Thermocycling: 25 cycles of 96°C/10s, 50°C/5s, 60°C/4min.
- Post-Reaction Clean-up: Remove unincorporated dyes using column-based purification or ethanol precipitation.
- Capillary Electrophoresis: Load samples onto automated sequencer (e.g., Applied Biosystems 3500 Series).
- Sequence Analysis: Trim low-quality bases, perform BLAST search against reference databases (e.g., NCBI, BOLD).
NGS Protocol for Parasite Metagenomic Barcoding
Principle: Multiplexed amplification of barcode regions from multiple samples/parasites followed by massively parallel sequencing [33] [15].
Workflow:
- DNA Extraction: Use kits optimized for diverse sample types (e.g., soil, water, tissue) with mechanical lysis for robust parasite cyst disruption.
- Library Preparation:
- Amplification with Barcoded Primers: Two-step PCR approach: (1) Target amplification with tailed primers; (2) Indexing with unique dual indices (UDIs) for each sample.
- Reaction Clean-up: Solid-phase reversible immobilization (SPRI) beads for size selection and purification.
- Quality Control: Fragment analyzer or bioanalyzer to verify amplicon size; fluorometric quantification.
- Pooling and Normalization: Combine indexed libraries in equimolar ratios based on qPCR quantification.
- Sequencing: Load normalized pool onto NGS platform (e.g., Illumina MiSeq, PacBio Revio) following manufacturer specifications.
- Bioinformatic Analysis:
- Demultiplexing: Sort reads by sample-specific barcodes.
- Quality Filtering: Remove low-quality reads and trim adapters (FastQC, Trimmomatic).
- OTU Clustering: Group sequences into Operational Taxonomic Units (97% similarity).
- Taxonomic Assignment: Compare to reference databases (SILVA, NT) using BLAST or phylogenetic placement.
- Diversity Analysis: Calculate alpha and beta diversity metrics (QIIME2, mothur).
Research Reagent Solutions for Parasite DNA Barcoding
Table 3: Essential reagents and materials for parasite DNA barcoding studies
| Reagent/Material | Function | Example Products |
|---|---|---|
| DNA Extraction Kits | Isolation of high-quality DNA from diverse sample matrices | QIAamp DNA Micro Kit, DNeasy PowerSoil Kit, Maxwell RSC Blood DNA Kit |
| PCR Enzymes | Amplification of barcode regions with high fidelity | Platinum Taq DNA Polymerase, Q5 High-Fidelity DNA Polymerase |
| Sanger Sequencing Kits | Fluorescent dye-terminator sequencing reactions | BigDye Terminator v3.1 Cycle Sequencing Kit |
| NGS Library Prep Kits | Preparation of sequencing libraries with barcodes/adapters | Illumina DNA Prep, Nextera XT DNA Library Prep Kit |
| Quantification Reagents | Accurate measurement of DNA concentration and quality | Qubit dsDNA HS Assay Kit, Library Quantification Kit for Illumina |
| Size Selection Beads | Purification and size selection of DNA fragments | AMPure XP Beads, SPRIselect Reagent |
| Capillary Sequencers | Instrumentation for Sanger sequencing | Applied Biosystems 3500 Series Genetic Analyzer |
| NGS Platforms | High-throughput sequencing instruments | Illumina NovaSeq X, PacBio Revio, Element AVITI |
Emerging Trends and Technological Innovations
The sequencing landscape continues to evolve rapidly, with several trends particularly relevant to parasite barcoding research. The ongoing reduction in sequencing costs enables larger-scale studies, with platforms like Ultima Genomics UG 100 potentially driving human genome sequencing costs down to approximately $100 [29]. Long-read technologies from PacBio and Oxford Nanopore are overcoming previous limitations in accuracy while providing advantages for resolving complex genomic regions and detecting structural variations [29] [15].
The integration of multiomic approaches represents another significant advancement, combining genomic, transcriptomic, and epigenomic data from the same sample [34]. Spatial sequencing technologies enable researchers to map gene expression within tissue samples at high resolution, providing critical insights into host-parasite interactions within the tissue microenvironment [35] [34]. Artificial intelligence and machine learning are increasingly being applied to analyze complex genomic datasets, accelerating biomarker discovery and enhancing our understanding of parasite biology [34].
Concluding Recommendations for Parasite Barcoding
For parasite DNA barcoding research, the selection between Sanger sequencing and NGS platforms should be guided by specific research objectives, scale, and available resources. Sanger sequencing remains the gold standard for targeted, small-scale barcoding projects where high accuracy for individual sequences is paramount and operational simplicity is desirable [8] [28]. Its long read lengths (500-1000 bp) are particularly advantageous for spanning multiple variable regions within standard barcode markers [8].
NGS technologies are unequivocally superior for comprehensive parasite community analysis, detection of mixed infections, and large-scale biodiversity surveys [33] [29]. The ability to multiplex hundreds of samples significantly reduces per-sample costs and processing time, while the deep coverage enables detection of rare species and genetic variants that would be missed by Sanger methods [8] [33].
Many modern parasitology laboratories adopt a hybrid approach, leveraging NGS for discovery-based studies of complex samples and parasite communities, while employing Sanger sequencing for validation of specific findings and routine identification of known parasites [28]. This synergistic approach capitalizes on the respective strengths of both technologies, providing both breadth and depth in parasite barcoding research.
As sequencing technologies continue to advance, further integration of these platforms with bioinformatic tools and multiomic approaches will undoubtedly expand our understanding of parasite biodiversity, evolution, and host interactions, ultimately contributing to improved disease control and management strategies.
From Lab to Data: Practical Workflows and Parasitology Applications
In the context of parasite DNA barcoding research, the choice of sequencing technology is pivotal. While next-generation sequencing (NGS) offers high throughput for metagenomic studies, Sanger sequencing remains the gold standard for obtaining reference-quality sequences for individual barcode loci due to its exceptional accuracy (99.99%) and long read lengths up to 1000 base pairs [36] [31]. This protocol details the optimized Sanger sequencing workflow, from PCR amplification to capillary electrophoresis, providing a reliable method for generating definitive parasite barcode sequences for species identification, phylogenetic analysis, and database development.
The Sanger sequencing workflow transforms a purified DNA sample into a base-called sequence through a series of defined steps. The entire process, from sample to answer, can be completed in less than one workday [37]. The following diagram illustrates the key stages:
Step-by-Step Experimental Protocol
Primer Design and PCR Amplification
Objective: To specifically amplify the target parasite DNA barcode region (e.g., COI, 18S rRNA).
- Primer Design: For parasite barcoding, design primers that flank the target barcoding region. Use online tools like NCBI Primer-BLAST to ensure specificity [38]. To avoid sequencing the primer binding sites themselves, design primers to bind at least 60-100 bp away from the key base of interest [39].
- PCR Reaction Setup:
- Use a high-fidelity DNA polymerase (e.g., Platinum II Taq Hot-Start DNA Polymerase) for robust amplification, even with challenging parasite DNA templates that may be GC-rich or contain secondary structures [37].
- Universal PCR Conditions: A universal annealing temperature of 60°C can be used to co-cycle multiple assays, reducing optimization time [37].
- Post-PCR Verification: Analyze the PCR product by capillary or gel electrophoresis to confirm a single, sharp band of the expected size, indicating a homogeneous product suitable for sequencing [38].
PCR Product Cleanup
Objective: To remove excess dNTPs, primers, salts, and polymerase from the PCR reaction that would interfere with the sequencing reaction.
- Recommended Method: Enzymatic cleanup using a reagent like ExoSAP-IT Express.
- Alternative Methods: Column-based or bead-based purification kits are also effective [38].
Cycle Sequencing
Objective: To generate a nested set of fluorescently labeled DNA fragments terminating at each base position.
- Reaction Setup: Use a kit such as the BigDye Terminator v3.1 Cycle Sequencing Kit [37].
- The reaction contains the cleaned PCR product, sequencing primer, DNA polymerase, dNTPs, and fluorescently labeled ddNTPs (chain-terminators).
- Thermal Cycling: The program involves repeated cycles of denaturation, primer annealing, and extension/termination. The labeled ddNTPs, when incorporated, terminate the growing DNA strand and provide a fluorescent signal specific to the base (A, T, C, or G) [40] [31].
- BigDye Direct Alternative: For a simplified workflow, the BigDye Direct Cycle Sequencing Kit combines post-PCR cleanup and cycle sequencing into a single step, though it requires M13-tailed PCR primers [37].
Purification of Extension Products
Objective: To remove unincorporated dye-terminators and salts from the sequencing reaction to prevent "dye blobs" and other artifacts during electrophoresis.
- Recommended Method: Use the BigDye XTerminator Purification Kit.
- This kit provides a fast, simple method where cleanup is complete in under 40 minutes and typically requires less than 10 minutes of hands-on labor [37].
- The process effectively removes unincorporated terminators, eliminating downstream "dye blobs" that can interfere with base calling, particularly around position 80 in the chromatogram [37] [39].
Capillary Electrophoresis
Objective: To separate the terminated DNA fragments by size and detect their fluorescent labels.
- Instrumentation: Load the purified sequencing products into an automated DNA sequencer (e.g., Applied Biosystems SeqStudio) [37].
- Process: The fragments are injected into a capillary array filled with polymer. An electric current is applied, pulling the negatively charged DNA fragments through the polymer. Smaller fragments migrate faster than larger ones [40] [31].
- Detection: As fragments pass a laser detector at the end of the capillary, the fluorescent dye on the terminal ddNTP is excited. The emitted light is recorded, generating a chromatogram (trace file) [39] [40].
Data Analysis
Objective: To convert the raw fluorescence data into a reliable DNA sequence.
- Base Calling: Software (e.g., Phred) analyzes the chromatogram, assigns a quality score (QV) to each base, and generates the sequence text file [39] [31].
- Quality Assessment: Visually inspect the chromatogram. High-quality data typically has:
- Sharp, well-spaced peaks (especially between bases ~100-500).
- A low baseline with minimal background noise.
- Quality scores (QV) ≥ 20, which corresponds to a base-calling error probability of ≤ 1% [39].
- Variant Analysis: For parasite studies, use software like Minor Variant Finder to detect mixed infections (minor variants present at frequencies as low as 5%) within a sample [37].
Key Research Reagent Solutions
The following table details essential reagents and their functions in the Sanger sequencing workflow.
Table 1: Essential Reagents for Sanger Sequencing
| Reagent / Kit | Function | Key Features |
|---|---|---|
| High-Fidelity DNA Polymerase (e.g., Platinum II Taq Hot-Start) [37] | Amplifies target DNA barcode region from parasite genomic DNA. | Engineered for fast synthesis, inhibitor resistance, and robust amplification; universal annealing at 60°C. |
| ExoSAP-IT Express Reagent [37] | Purifies PCR products by degrading unused dNTPs and primers. | 5-minute protocol; one-tube, one-step cleanup; 100% recovery of PCR products. |
| BigDye Terminator v3.1 Kit [37] | Performs the cycle sequencing reaction with fluorescently labeled ddNTPs. | Industry-standard; high performance for long read lengths; refined performance in GC-rich regions. |
| BigDye XTerminator Purification Kit [37] | Removes unincorporated dye-terminators after cycle sequencing. | <40-minute protocol; minimal hands-on time; effectively eliminates "dye blobs". |
| POP-1 Polymer & Sequencing Buffer [37] | Matrix for capillary electrophoresis, separating DNA fragments by size. | Used in automated sequencers; allows for flexible sequencing and fragment analysis. |
Technical Specifications and Data Quality Metrics
Understanding the quantitative output and quality metrics is crucial for evaluating sequencing success, particularly when building a reliable parasite barcode database.
Table 2: Sanger Sequencing Performance Metrics
| Parameter | Typical Specification | Notes for Parasite Barcoding |
|---|---|---|
| Read Length [41] [31] | 500 - 1000 bp | Ideal for sequencing common DNA barcodes (e.g., ~650 bp for COI). |
| Raw Accuracy (Per Base) [36] [31] | > 99.99% (Phred QV > 40) | The "gold standard" for validating NGS-derived barcodes. |
| Optimal Read Region [39] | Bases ~100 - 500 | Design primers to ensure the barcode region falls within this high-quality zone. |
| Sensitivity (Variant Detection) [41] [26] | 15 - 20% allele frequency | Suitable for detecting dominant sequences in a sample; lower than NGS. |
| Continuous Read Length (CRL) [39] | > 500 bp (for high-quality data) | A key metric; the longest stretch with an average QV ≥ 20. |
| Average Signal Intensity [39] | > 1000 RFU | Values below 100 indicate noisy traces; very high values can cause oversaturation. |
Sanger Sequencing vs. NGS for Parasite DNA Barcoding
The following diagram and table compare the core methodologies to guide technology selection.
Table 3: Sanger Sequencing vs. Next-Generation Sequencing (NGS) for DNA Barcoding
| Feature | Sanger Sequencing | Next-Generation Sequencing (NGS) |
|---|---|---|
| Fundamental Method [8] | Chain termination with ddNTPs; linear process. | Massively parallel sequencing (e.g., Sequencing by Synthesis). |
| Throughput & Scalability [8] [36] | Low to medium; ideal for a small number of targets. | Extremely high; can sequence entire metagenomes or multi-gene panels. |
| Cost Efficiency [8] [26] | Low cost per run for a few samples; high cost per base. | High capital and reagent cost per run; very low cost per base. |
| Read Length [8] [31] | Long contiguous reads (500-1000 bp). | Billions of shorter reads (50-500 bp, depending on platform). |
| Variant Sensitivity [41] [26] | ~15-20%; lower sensitivity for minor variants. | <1-5%; superior for detecting mixed infections/heterogeneity. |
| Data Analysis [8] [36] | Simple; requires basic alignment software. | Complex; requires sophisticated bioinformatics for read assembly. |
| Ideal Barcoding Application | Gold-standard validation of specific barcode loci; sequencing individual clones or purified samples [8] [38]. | Discovery-based studies; identifying unknown parasites in complex samples or detecting mixed infections [8] [41]. |
This detailed protocol outlines a robust Sanger sequencing workflow capable of generating high-quality, reference-grade DNA barcodes for parasite identification. Its unmatched per-base accuracy and long read lengths make it an indispensable tool for constructing and validating curated barcode databases. In a synergistic approach with NGS, Sanger sequencing provides the critical verification needed to ensure the reliability of reference sequences, which form the foundation of all downstream taxonomic and phylogenetic analyses in parasite research.
The transition from Sanger sequencing to Next-Generation Sequencing (NGS) represents a paradigm shift in parasite DNA barcoding research. While Sanger sequencing, developed in the 1970s, has been the gold standard for decades, its limitation to sequencing single DNA fragments from individual samples makes large-scale studies of parasite biodiversity and drug resistance markers time-consuming and costly [42] [16]. In contrast, NGS technologies, particularly amplicon sequencing, enable massively parallel analysis of hundreds to thousands of gene regions across multiple samples simultaneously, providing unprecedented scale and discovery power for parasite genomics [43] [16].
This application note details the implementation of NGS amplicon sequencing workflows specifically within the context of parasite research, enabling researchers to efficiently identify species, track transmission patterns, and monitor the emergence of drug-resistant parasite populations through high-throughput DNA barcoding.
Workflow Comparison: Sanger Sequencing vs. NGS Amplicon Sequencing
The fundamental difference between Sanger sequencing and NGS amplicon sequencing lies in the scale of analysis and the nature of sample processing, as summarized in the table below.
Table 1: Comparison between Sanger sequencing and NGS amplicon sequencing for DNA barcoding
| Parameter | Sanger Sequencing | NGS Amplicon Sequencing |
|---|---|---|
| Sequencing Principle | Dideoxy chain termination | Massively parallel sequencing by synthesis |
| Throughput | Single DNA fragment per reaction | Millions of fragments per run [16] |
| Sample Multiplexing | Not available | Hundreds of samples simultaneously [42] [44] |
| Cost-Effectiveness | Cost-effective for 1-20 targets [16] | Cost-effective for high sample numbers; 86% cost reduction demonstrated for 96-plex parasite genotyping [43] |
| Variant Detection Sensitivity | ~15-20% [16] | As low as 1% for minor alleles [43] |
| Key Applications in Parasitology | Single isolate genotyping, validation of NGS findings | Population genetics, drug resistance surveillance, mixed-infection detection, biodiversity assessment [45] [43] |
For parasite research, this transition means moving from sequencing one isolate at a time to comprehensively analyzing entire parasite populations from complex samples, such as blood, tissue, or environmental sources, in a single experiment [42] [43].
Experimental Protocol: NGS Amplicon Sequencing for Parasite DNA Barcoding
The following protocol is adapted from established methods for pathogen genotyping [43] and is specifically framed for parasite research applications, such as monitoring antimalarial drug resistance markers or conducting biodiversity studies of protozoan communities.
Step 1: DNA Extraction and Sample Qualification
- Input Material: Use parasite genomic DNA extracted from clinical isolates (e.g., whole blood, Rapid Diagnostic Test (RDT) strips), cultured parasites, or environmental samples [43].
- Extraction Method: Employ commercial kits (e.g., QIAGEN DNeasy Blood and Tissue Kit) following manufacturer's protocols [45] [46].
- DNA Quantification: Quantify DNA mass using a fluorometer (e.g., Qubit with dsDNA BR Assay) and assess purity via spectrophotometry (e.g., Nanodrop) [47].
- Quality Control: Verify DNA integrity using gel electrophoresis or bioanalyzers (e.g., Agilent 2100 Bioanalyzer) [47].
Step 2: PCR Amplification of Target Barcode Regions
Amplify target gene regions (e.g., Pfkelch, Pfcrt for Plasmodium drug resistance; COI, 18S rRNA for species barcoding) using parasite-specific primers.
- Reaction Setup:
- DNA template: 2-50 ng (2 µL in 50 µL reaction)
- Primers: 1 µL of 10 µM each (e.g., universal COI primers for metazoans: GGWACWGGWTGAACWGTWTAYCCYCC and TAAACTTCAGGGTGACCAAARAAYCA) [45]
- PCR Components: 5 µL of 10x High Fidelity PCR buffer, 2 µL MgSO4 (50 mM), 1 µL dNTP mix (10 mM), 0.2 µL Platinum Taq DNA polymerase [45]
- Thermal Cycling:
- Initial denaturation: 95°C for 5 min
- 16 touchdown cycles: 95°C for 10 s, 62°C → 46°C (-1°C/cycle) for 30 s, 72°C for 60 s
- 20 standard cycles: 95°C for 10 s, 46°C for 30 s, 72°C for 60 s
- Final extension: 72°C for 8 min [45]
- Amplification Verification: Confirm successful amplification and expected amplicon size (~400-700 bp) via 2% agarose gel electrophoresis [45] [43].
Step 3: Library Preparation and Barcoding (Indexing)
Attach unique barcode sequences to each sample to enable multiplexing.
- Barcoding Strategies:
- Combinatorial Dual Indexing (CDI): Uses unique combinations of i5 and i7 indexes, each index is re-used. Cost-effective for high-scale multiplexing (e.g., 96 samples using 8 i5 and 12 i7 indexes) [44].
- Unique Dual Indexing (UDI): Uses completely unique i5 and i7 index pairs. Recommended for sensitive applications (e.g., low-frequency variant detection) as it mitigates index hopping effects [44].
- Barcode Incorporation: Achieve barcoding via:
- Library Clean-up: Purify barcoded amplicons using magnetic beads (e.g., AMPure XP) to remove primer dimers and unincorporated adapters [48]. Perform size selection if necessary to ensure uniform fragment distribution.
Step 4: Library Pooling and Sequencing
- Library Quantification: Precisely quantify final libraries using fluorometric methods (e.g., Qubit) and qPCR-based assays for accurate molarity determination [48].
- Pooling: Combine uniquely barcoded libraries in equimolar ratios based on quantified concentrations. For example, in a recent malaria study, 25 Plasmodium falciparum isolates and 6 artificial mixture samples were pooled for a single sequencing run [43].
- Sequencing Platform Selection:
Step 5: Data Analysis and Demultiplexing
- Demultiplexing: Use platform-specific software (e.g., Illumina's bcl2fastq) to assign sequenced reads to original samples based on their unique barcode combinations [44].
- Bioinformatic Processing:
- Quality Filtering: Remove low-quality reads and trim adapter sequences.
- Variant Calling: Identify single nucleotide polymorphisms (SNPs) and indels relative to reference genomes.
- Haplotype Reconstruction: For mixed parasite infections, determine dominant and minor haplotypes. Both Illumina MiSeq and Ion Torrent PGM can reliably detect minor alleles at frequencies as low as 1% with 500x coverage [43].
- Species Identification: For biodiversity studies, cluster sequences into Operational Taxonomic Units (OTUs) or Amplicon Sequence Variants (ASVs) and compare against reference barcode databases (e.g., BOLD, GenBank) for taxonomic assignment [42] [45].
Diagram 1: NGS amplicon sequencing workflow for parasite DNA barcoding.
The Scientist's Toolkit: Essential Research Reagents and Materials
Table 2: Key reagents and materials for NGS amplicon sequencing in parasite research
| Item | Function | Example Products/References |
|---|---|---|
| DNA Extraction Kit | Isolation of high-quality genomic DNA from various sample types | QIAGEN DNeasy Blood & Tissue Kit [45] |
| High-Fidelity DNA Polymerase | Accurate amplification of target barcode regions with minimal errors | Platinum Taq DNA Polymerase (Invitrogen) [45] |
| Barcoded Adapters/Primers | Sample multiplexing through unique nucleotide identifiers | Illumina Nextera XT Index Kit, seqWell plexWell [44] [43] |
| Library Purification Beads | Cleanup of PCR products and removal of adapter dimers | AMPure XP beads [48] |
| Library Quantification Kit | Accurate measurement of library concentration for pooling | Qubit dsDNA HS Assay Kit [47] |
| Sequencing Platforms | High-throughput sequencing of multiplexed libraries | Illumina MiSeq, Ion Torrent PGM [43] |
Application in Parasite Research: Case Study
Genotyping Drug Resistance Markers inPlasmodium falciparum
A recent study compared TADS (Targeted Amplicon Deep sequencing) on both Ion Torrent PGM and Illumina MiSeq platforms for typing molecular resistance markers in P. falciparum (pfcrt, pfdhfr, pfdhps, pfmdr1, pfkelch, and pfcytochrome b) [43].
- Experimental Design: The protocol was validated on 20 whole blood samples and 5 RDT samples from patients with uncomplicated falciparum malaria, with Sanger sequencing as the reference method [43].
- Performance Metrics: Both NGS platforms demonstrated 99.83% sequencing accuracy and 99.59% variant accuracy compared to Sanger sequencing, with complete concordance in SNP calls for 572 positions across six drug resistance genes [43].
- Sensitivity: In artificial mixed infections, both platforms detected minor alleles down to 1% density with 500x coverage, far exceeding the detection limit of Sanger sequencing (~15-20%) [43] [16].
- Cost Efficiency: The multiplexed NGS approach (96 samples per run) reduced costs by 86% compared to conventional Sanger sequencing [43].
Diagram 2: NGS barcode structure and indexing strategies.
NGS amplicon sequencing represents a transformative methodology for parasite DNA barcoding research, offering significant advantages over traditional Sanger sequencing in throughput, sensitivity, and cost-efficiency when processing multiple samples or targets. The robust workflows for library preparation, barcoding, and multiplexing enable comprehensive studies of parasite biodiversity, population genetics, and drug resistance evolution at unprecedented scales. As demonstrated in the genotyping of Plasmodium falciparum resistance markers, this approach provides the depth and accuracy required for modern parasitology research, making it an indispensable tool for researchers and drug development professionals working to understand and combat parasitic diseases.
DNA barcoding has revolutionized parasite identification by providing a molecular-based method to complement traditional morphological approaches. This technique is particularly valuable for distinguishing cryptic species, identifying immature life stages, and detecting parasites in complex sample types. The current landscape is defined by a methodological transition from the established standard of Sanger sequencing to the emerging power of Next-Generation Sequencing (NGS) platforms. Sanger sequencing, while reliable and widely used, processes only a single DNA template per sample, making it unsuitable for resolving mixed infections or capturing extensive intra-individual genetic variation [49]. In contrast, NGS technologies enable massive parallel sequencing of multiple DNA templates simultaneously, providing unprecedented resolution for detecting allelic diversity, mixed species infections, and cryptic parasite lineages [49] [50]. This Application Note examines the key genetic markers driving this transition and provides detailed protocols for their application in parasite research and drug development.
Key Genetic Markers for Parasite Barcoding
Marker Selection and Performance Comparison
The selection of appropriate genetic markers is critical for successful DNA barcoding. No single marker universally serves all parasite groups, necessitating a tailored approach based on the target organisms and research objectives.
Table 1: Key Genetic Markers for Parasite DNA Barcoding
| Marker | Genomic Location | Resolution | Primary Applications | Considerations |
|---|---|---|---|---|
| COI (Cytochrome c Oxidase I) | Mitochondrial | High for species-level | Animal parasites, insect vectors [49] [51] | High interspecies variation; numerous database entries [52] |
| ITS2 (Internal Transcribed Spacer 2) | Nuclear ribosomal DNA | High to very high | Mosquitoes, nematodes, closely related species [49] [52] | Hypervariable; contains indels and microsatellites; requires NGS for full characterization [49] |
| ITS1 (Internal Transcribed Spacer 1) | Nuclear ribosomal DNA | High | Nematode differentiation [52] | Variable rates of evolution; useful for specific parasite groups |
| 18S rRNA | Nuclear ribosomal DNA | Low to moderate | Higher-level taxonomy, nematode communities [52] | Highly conserved; limited species-level resolution |
| Cytb (Cytochrome b) | Mitochondrial | High | Fish parasites, phylogenetic studies [50] | Good species discrimination; often used alongside COI |
| 12S & 16S rRNA | Mitochondrial | Moderate to high | Nematode identification [52] | Less variable than COI but useful for specific applications |
Quantitative Marker Comparison for Nematode Identification
A recent comprehensive analysis of six genetic markers for nematodes of clinical and veterinary importance revealed significant differences in their resolution and performance [52].
Table 2: Performance Metrics of Genetic Markers for Nematode Identification
| Marker | Average Pairwise Nucleotide p-Distance | Sequence Availability in GenBank | Species Resolution |
|---|---|---|---|
| COI | 86.4% - 90.4% | 2491 sequences | High interspecies resolution |
| ITS-1 | 72.7% - 87.3% | 1082 sequences | High interspecies resolution |
| ITS-2 | 72.7% - 87.3% | 994 sequences | High interspecies resolution |
| 12S | 86.4% - 90.4% | 428 sequences | Moderate to high resolution |
| 16S | 86.4% - 90.4% | 143 sequences | Moderate to high resolution |
| 18S | 98.8% - 99.8% | 212 sequences | Low interspecies resolution |
The 18S rRNA gene showed the least interspecies resolution, with separate species of Ascaris, Mansonella, Toxocara, and Ancylostoma intermixing in phylogenetic trees [52]. In contrast, ITS-1, ITS-2, COI, 12S, and 16S loci all provided significantly better species discrimination.
Sanger Sequencing vs. NGS: Technical Comparisons
Performance Metrics Across Platforms
Different sequencing platforms offer varying advantages for DNA barcoding applications. A comparative analysis of Targeted Amplicon Deep sequencing (TADs) for Plasmodium falciparum drug resistance markers revealed key performance differences [43].
Table 3: Platform Comparison for Targeted Amplicon Sequencing
| Parameter | Illumina MiSeq | Ion Torrent PGM | Sanger Sequencing |
|---|---|---|---|
| Average Reads per Amplicon | 28,886 | 1,754 | Single sequence per sample |
| Coverage Range | 5,288 - 32,597 reads | 15 - 6,456 reads | N/A |
| Variant Accuracy | 99.59% | 99.59% | Reference standard |
| False Positive Rate | 0.00% | 0.00% | N/A |
| False Negative Rate | 0.00% | 0.00% | N/A |
| Minor Allele Detection | 1% density at 500X coverage | 1% density at 500X coverage | Limited sensitivity |
| Multiplexing Capacity | Up to 96 samples per run | Up to 96 samples per run | Individual processing |
Both NGS platforms demonstrated excellent concordance with Sanger sequencing while providing significantly enhanced throughput and sensitivity for minor variant detection [43]. The cost-effectiveness of NGS is particularly notable when multiplexing numerous samples, with studies reporting up to 86% reduction in cost compared to conventional Sanger sequencing [43].
Advantages of NGS for Complex Barcoding Applications
NGS technologies provide distinct advantages for challenging barcoding scenarios:
- Hypervariable Markers: For markers like ITS2 with substantial indels and microsatellites, NGS successfully characterized 382 unique sequences from 88 mosquito specimens, far exceeding what was possible with Sanger sequencing [49].
- Mixed Infections: NGS detected multiple species in individual samples from ovitraps, where Sanger sequencing failed to identify species mixtures [53].
- Cryptic Species Identification: Integrated taxonomic approaches combining morphology with NGS data have revealed cryptic species complexes in Culicoides biting midges [51].
- Multiple Marker Sequencing: The ability to simultaneously sequence several barcoding loci (COI, Cytb, EF1a) from hundreds of specimens provides robust multi-locus data for integrative taxonomy [50].
Experimental Protocols
NGS Amplicon Sequencing for Mosquito ITS2 Barcoding
This protocol adapts the methodology from Batovska et al. for characterizing ITS2 in mosquitoes using Illumina platforms [49].
Sample Preparation:
- DNA is extracted from individual mosquito legs or whole specimens using magnetic bead-based nucleic acid extraction kits (e.g., MagMAX DNA Multi-Sample Kit).
- Assess DNA quality and quantity using spectrophotometry (NanoDrop) or fluorometry (Qubit).
Primary PCR Amplification:
- Amplify the ITS2 region using primers ITS2-MOS-F (5′-GCTCGTGGATCGATGAAGAC-3′) and ITS2-MOS-R (5′-TGCTTAAATTTAGGGGGTAGTCAC-3′).
- PCR Reaction Setup:
- 15.3 μL 1× bovine serum albumin (BSA)
- 2.5 μL 10× ThermoPol Reaction Buffer
- 2 μL 2.5 μM dNTPs
- 1.25 μL of each 10 μM primer
- 0.2 μL 1.0 U Taq DNA Polymerase
- 5–15 ng template DNA
- PCR Cycling Conditions:
- 94°C for 2 minutes
- 40 cycles of: 94°C for 30 seconds, 51°C for 45 seconds, 72°C for 45 seconds
- Final extension: 72°C for 1 minute
- Verify PCR products on 2% agarose gel (expected size: ~350-600 bp)
Library Preparation and Sequencing:
- Purify PCR products using AMPure XP beads (0.8× beads ratio)
- Ligate universal Y-shape adaptors to individual PCR products
- Remove excess adaptors using AMPure XP beads
- Add unique 8 bp barcodes with Illumina P5 and P7 adapters via PCR (18 cycles)
- Perform additional AMPure XP bead clean-up
- Quantify library using NanoDrop and Qubit fluorometer
- Check library size distribution with Bioanalyzer
- Pool equimolar amounts of each sample
- Sequence on MiSeq platform with 2×250 bp reads using v3 chemistry
Bioinformatic Analysis:
- Demultiplex samples based on unique barcodes
- Perform quality trimming and filtering
- Cluster sequences and identify allelic variants
- Align consensus sequences to reference databases
- Perform phylogenetic analysis using neighbor-joining or maximum likelihood methods
Multiplex PCR for Container-Breeding Aedes Species Identification
This protocol provides a rapid alternative to DNA barcoding for specific applications where target species are known [53].
Sample Processing:
- Collect Aedes eggs from ovitraps using wooden spatulas
- Morphologically identify eggs to the extent possible
- Homogenize all eggs from each spatula using ceramic beads and a TissueLyser II
- Extract DNA using commercial kits (e.g., innuPREP DNA Mini Kit)
Multiplex PCR Setup:
- Use species-specific primer sets for:
- Ae. albopictus
- Ae. japonicus
- Ae. koreicus
- Ae. geniculatus
- PCR Components:
- 1× PCR buffer
- 2.5 mM MgCl₂
- 0.2 mM dNTPs
- 0.4 μM of each primer
- 1 U Taq DNA polymerase
- 2 μL DNA template
- PCR Cycling Conditions:
- 94°C for 5 minutes
- 35 cycles of: 94°C for 30 seconds, 60°C for 30 seconds, 72°C for 45 seconds
- Final extension: 72°C for 5 minutes
- Analyze products by capillary electrophoresis or gel documentation
Advantages Over Sanger Barcoding:
- Enables detection of multiple species in a single sample
- Higher success rate for species identification (1990/2271 samples vs. 1722/2271 with DNA barcoding)
- Faster turnaround time for routine monitoring
The Scientist's Toolkit: Essential Research Reagents
Table 4: Essential Research Reagents for Parasite DNA Barcoding
| Reagent/Category | Specific Examples | Function/Application |
|---|---|---|
| DNA Extraction Kits | MagMAX DNA Multi-Sample Kit, NucleoSpin Tissue Kit, QIAGEN DNeasy Blood & Tissue Kit | High-quality DNA extraction from various sample types |
| PCR Enzymes | Taq DNA Polymerase, Platinum Taq High Fidelity Polymerase | Robust amplification of barcode regions |
| Library Prep Kits | Illumina TruSeq Custom Amplicon, Ion Torrent PGM template OT2 400 | NGS library preparation for amplicon sequencing |
| Purification Systems | AMPure XP beads (Beckman Coulter) | PCR product clean-up and size selection |
| Quantification Tools | NanoDrop spectrophotometer, Qubit fluorometer, Bioanalyzer | Accurate nucleic acid quantification and quality control |
| Universal Primers | LCO1490/HCO2198 for COI, ITS2-MOS-F/R for insect ITS2 | Amplification of standard barcode regions across taxa |
| Species-Specific Primers | Multiplex primers for Aedes species [53] | Targeted detection of specific parasites or vectors |
| Positive Controls | 3D7 and K1 strains for Plasmodium [43] | Protocol validation and quality assurance |
Workflow Visualization
Diagram 1: Parasite DNA Barcoding Workflow: This diagram illustrates the complete workflow for parasite DNA barcoding, highlighting key decision points between Sanger and NGS sequencing approaches.
Diagram 2: Marker Selection Logic: This decision tree guides researchers in selecting appropriate genetic markers and sequencing methods based on their specific research questions, sample complexity, and available resources.
The field of parasite DNA barcoding is undergoing a significant transformation driven by NGS technologies. While Sanger sequencing remains a reliable method for straightforward identification tasks, NGS approaches provide superior capabilities for characterizing complex parasite communities, resolving cryptic species, and detecting minor variants. The marker selection—COI for broad species discrimination, ITS2 for closely related species and hypervariable applications, and supplemental markers for specific taxonomic groups—should be guided by the research objectives and sample characteristics. The protocols and methodologies detailed in this Application Note provide researchers with practical frameworks for implementing these powerful tools in parasite surveillance, drug development, and biodiversity studies. As reference databases continue to expand and sequencing costs decrease, NGS-based DNA barcoding is poised to become the standard approach for comprehensive parasite identification and classification.
The accurate identification of parasite species and the discovery of cryptic diversity—where morphologically similar organisms constitute distinct species—are fundamental to parasitology research, disease epidemiology, and drug development. For decades, Sanger sequencing has served as the cornerstone of parasite DNA barcoding, providing highly accurate data for individual specimens. However, the rise of Next-Generation Sequencing (NGS) has introduced powerful alternatives, notably metabarcoding, which enables the simultaneous identification of multiple species from a single, complex sample. This application note details the protocols for both methods, framing them within the critical comparative context of a researcher's choice between established gold-standard accuracy and revolutionary high-throughput capability.
The core principle of DNA barcoding involves sequencing a short, standardized genetic marker to assign an unknown organism to a known species. The cytochrome c oxidase subunit I (COI) gene is a standard marker for animals, while the 18S rRNA gene is widely used for protozoa and other eukaryotes [54] [55]. The choice between Sanger and NGS hinges on the research question: Sanger is ideal for confirming the identity of a single, isolated parasite, whereas NGS is indispensable for profiling the entire parasitic community within a host or environmental sample.
Detailed Experimental Protocols
Protocol 1: Sanger Sequencing for Cryptic Species Delimitation
This protocol is designed for identifying individual parasite specimens and resolving cryptic species complexes, as demonstrated in studies of Culicoides biting midges and their trypanosomatid parasites [55].
Workflow Overview:
Step-by-Step Methodology:
Sample Collection and DNA Extraction:
- Collect parasite specimens using field-appropriate methods (e.g., UV light traps for insects, fecal sampling for gut protozoa) [55]. Preserve samples in >70% ethanol or at -80°C.
- Extract genomic DNA from individual specimens. For small parasites or larvae, a volume of 200µL of sample material is often used with bead-beating (e.g., using Lysing Matrix E tubes) to ensure efficient lysis, followed by automated extraction systems like the AusDiagnostics MT-Prep or column-based kits (e.g., Qiagen DNeasy Blood & Tissue) [56].
PCR Amplification:
- Amplify the target barcode region (e.g., COI, 18S rRNA) using standard primers. A typical 25µL reaction mix includes:
- ~50-100 ng of genomic DNA
- 1X PCR Buffer
- 1.5-2.5 mM MgCl₂
- 0.2 mM each dNTP
- 0.2 µM each forward and reverse primer
- 0.5-1.0 U of high-fidelity DNA polymerase (e.g., Platinum Taq)
- Cycling Conditions: Initial denaturation at 95°C for 5 min; 35 cycles of 95°C for 30 s, 50-55°C (primer-specific) for 30 s, 72°C for 1 min/kb; final extension at 72°C for 7 min [55].
- Amplify the target barcode region (e.g., COI, 18S rRNA) using standard primers. A typical 25µL reaction mix includes:
Sequencing and Analysis:
- Purify PCR amplicons using enzymatic clean-up (e.g., ExoSAP-IT) or spin columns.
- Perform Sanger sequencing in both forward and reverse directions using the same PCR primers. Capillary electrophoresis on platforms like Applied Biosystems 3500xl allows for read lengths of 500-900 bp with a single-base accuracy of >99.9% [9].
- Assemble and edit chromatograms using software like Geneious or CodonCode Aligner.
- Identify sequences by querying public databases (NCBI BLAST, BOLD Systems).
- For cryptic species discovery, apply species delimitation algorithms like ASAP, TCS, and PTP to the assembled sequence data to infer Molecular Operational Taxonomic Units (MOTUs) [55].
Protocol 2: NGS Metabarcoding for Parasite Community Profiling
This protocol is used for the untargeted, parallel identification of all parasites in a complex sample, such as feces or blood, and is highly effective at delineating mixed-species infections [54].
Workflow Overview:
Step-by-Step Methodology:
Sample Processing and DNA Extraction:
- Homogenize the bulk sample (e.g., 0.1-0.2 g of feces). Include a well-characterized positive control (e.g., WHO WC-Gut RR) and negative extraction control [56].
- Extract total DNA using kits designed for complex samples (e.g., QIAamp PowerFecal Pro). Incorporate a bead-beating step for robust lysis of hardy parasite cysts and oocysts [54] [56].
Library Preparation for Amplicon Sequencing (Metabarcoding):
- Amplify the target barcode region (e.g., 18S rRNA V3-V4 regions for protozoa) using primers that contain Illumina or Nanopore adapter tails and sample-specific barcodes [54].
- Use a limited number of PCR cycles (e.g., 25-30) to minimize amplification bias. A typical reaction is similar to Protocol 1 but with barcoded primers.
- Purify the amplicons, quantify them, and pool equal masses from each sample to create the final library for sequencing.
Sequencing and Bioinformatics:
- Sequence the library on a high-throughput platform. Short-read platforms (Illumina MiSeq) offer high accuracy for community profiling, while long-read platforms (Oxford Nanopore MinION) can sequence the entire ~1500 bp 18S rRNA gene, improving taxonomic resolution [56].
- Process raw data through a bioinformatics pipeline:
- Demultiplexing: Assign sequences to samples based on barcodes.
- Quality Filtering & Clustering: Remove low-quality reads and cluster sequences into Operational Taxonomic Units (OTUs) or Amplicon Sequence Variants (ASVs) using tools like DADA2 or VSEARCH.
- Taxonomic Assignment: Classify OTUs/ASVs against curated reference databases (e.g., SILVA, PR2) to identify parasite species and subtypes [54].
Performance Data and Comparison
Table 1: Quantitative Comparison of Sanger Sequencing and NGS for Parasite DNA Barcoding
| Parameter | Sanger Sequencing | NGS (Metabarcoding) | Source |
|---|---|---|---|
| Single-Read Accuracy | >99.9% | ~99% (Illumina); <95% (Nanopore, raw read) | [41] [9] |
| Sensitivity (Variant Detection) | 15-20% | <1% | [41] |
| Ability to Detect Mixed Infections | Limited; produces unreadable electropherograms | Excellent; core application | [54] [56] |
| Typical Read Length | 500-900 bp | 50-500 bp (Illumina); Up to a megabase (Nanopore) | [41] |
| Throughput | One specimen per reaction | Thousands to millions of sequences per run | [57] |
| Cost per Sample | Low for few samples | High for few samples, but cost-effective for large batches | N/A |
| Time to Result (after DNA extraction) | 3-4 days (outsourced) / 24h (in-house) | 2-3 days (for full library prep and run) | [41] |
| Application in Cryptic Species Discovery | Effective via species delimitation algorithms applied to individual sequences | Powerful for revealing hidden diversity across entire communities | [55] |
Table 2: Practical Application Outcomes of Both Methods
| Application Scenario | Recommended Technology | Reported Outcome | Source |
|---|---|---|---|
| Identifying Culicoides vectors and their trypanosomatid parasites | Sanger Sequencing | Successfully identified 25 species and detected cryptic complexes; found 6.42% of midges positive for Leishmania DNA. | [55] |
| Differentiating mixed Blastocystis subtype infections | NGS (Metabarcoding) | Bypasses Sanger limitations, providing detailed insight into intra-species genetic diversity and mixed infections. | [54] |
| 16S rRNA gene diagnostic for culture-negative bacterial infections | NGS (Long-read Nanopore) | Overcomes Sanger's inability to resolve polymicrobial infections; enables sequencing of the full-length 16S gene. | [56] |
| Host-parasite interaction study (gobies and copepods) | Sanger Sequencing | Clarified that a single generalist copepod species infected multiple newly confirmed cryptic goby host species. | [58] |
The Scientist's Toolkit: Essential Research Reagents and Materials
Table 3: Key Research Reagent Solutions for Parasite DNA Barcoding
| Item | Function/Application | Example Products / Notes |
|---|---|---|
| Barcoding Primers | Amplifying standard genetic markers (COI, 18S rRNA) for Sanger or as a first step for NGS library prep. | mlCOIintF/jgHCO2198 (COI); Nem18SF/R (18S rRNA for eukaryotes). |
| High-Fidelity DNA Polymerase | Reduces PCR errors during amplification of barcode regions, critical for both Sanger and NGS. | Platinum Taq, Q5 Hot-Start Polymerase. |
| DNA Extraction Kits for Complex Samples | Efficiently lyses tough parasite walls and purifies DNA from inhibitors in feces/soil. | QIAamp PowerFecal Pro DNA Kit, DNeasy PowerSoil Pro Kit. |
| Metagenomic Control Materials | Validates and monitors performance of the entire NGS workflow, from extraction to sequencing. | NML Metagenomic Control Materials (MCM2α/β), WHO WC-Gut RR. |
| Oxford Nanopore Ligation Sequencing Kit | Prepares libraries for long-read sequencing on MinION platforms, enabling full-length barcode sequencing. | SQK-LSK114 kit. |
| Bioinformatics Platforms | For processing NGS data: demultiplexing, quality filtering, OTU clustering, and taxonomic assignment. | QIIME 2, MOTHUR; public databases: BOLD, SILVA, PR2. |
Analyzing Mixed Infections and Complex Parasite Communities
The accurate identification of parasite species and the detection of mixed infections are crucial for understanding disease epidemiology, transmission dynamics, and clinical outcomes. For decades, Sanger sequencing has served as the gold standard for parasite identification and DNA barcoding, providing highly accurate sequences for single, pure templates [8] [9]. However, its fundamental limitation emerges in complex parasite communities: Sanger sequencing produces a single, consensus sequence from a polymerase chain reaction (PCR) product, making it incapable of resolving multiple, distinct sequences present in the same sample [22] [59]. This technical constraint has likely led to systematic underestimation of mixed infection rates in parasitology research.
Next-generation sequencing (NGS) technologies, particularly amplicon sequencing, overcome this limitation through massively parallel sequencing of individual DNA molecules [8] [19]. This approach enables simultaneous detection of multiple parasite species or genetic variants within a single host, providing unprecedented resolution for analyzing complex parasite communities [60] [59]. This application note details how targeted NGS methods are transforming research on mixed parasite infections, with validated protocols for implementation in research and diagnostic settings.
Technical Comparison: Sanger Sequencing vs. NGS for Mixed Infection Analysis
The core technological differences between Sanger sequencing and NGS directly determine their efficacy in detecting mixed infections.
Table 1: Fundamental Technical Comparison Between Sanger Sequencing and NGS for Parasite Detection
| Feature | Sanger Sequencing | Next-Generation Sequencing (Amplicon) |
|---|---|---|
| Fundamental Method | Chain termination with dideoxynucleotides (ddNTPs) [8] [61] | Massively parallel sequencing of individual DNA molecules [8] [19] |
| Detection Output | Single, contiguous read per reaction [8] | Millions to billions of short reads [8] |
| Data for Mixed Templates | Single consensus sequence with ambiguous base calls (electropherogram noise) [22] | Multiple distinct sequences, each with individual read counts [60] [59] |
| Effective Abundance Threshold | Fails when secondary variants exceed ~30% of population [62] | Can detect variants at frequencies of 1% or lower, depending on sequencing depth [60] |
| Quantitative Capability | None; only qualitative identification of dominant sequence | Semi-quantitative; relative abundance can be inferred from read proportions [60] [62] |
The following diagram illustrates the fundamental workflow differences that account for their divergent performance in detecting mixtures:
Quantitative Evidence: NGS Outperforms Sanger for Detecting Mixtures
Multiple studies have directly compared the performance of Sanger sequencing and NGS for detecting mixed infections, demonstrating NGS's superior sensitivity and resolution.
Table 2: Documented Performance Comparison in Parasite Detection Studies
| Parasite/Study | Sanger Sequencing Result | NGS Amplicon Result | Key Finding |
|---|---|---|---|
| Giardia duodenalis [59] | Single assemblage detected | Multiple assemblages (A, B, E) detected in single samples | Mixed assemblages are far more common than previously thought using Sanger. |
| Cryptosporidium spp. [60] | Single species identification; missed low-abundance co-infections | Detection of C. parvum at 0.001 ng in stool background; identified novel species | High sensitivity allows detection of minor variants and novel species in complex samples. |
| Lichens (Photobiont) [62] | Unambiguous sequence only if dominant photobiont >70% | Quantified multiple photobionts; detected variants below 30% abundance | Sanger fails when the second most abundant target exceeds 30% of the population. |
| General DNA Barcoding [22] | Failed sequencing or ambiguous barcodes from mixed templates | Recovered full-length barcodes from 190 specimens simultaneously; detected Wolbachia, heteroplasmy | NGS overcomes limitations posed by co-amplification of non-target sequences. |
A study on Giardia duodenalis assemblages highlights this performance gap. While Sanger sequencing detected only the predominant assemblage in each sample, NGS revealed widespread mixed assemblage infections that would have been missed by conventional methods [59]. Similarly, for Cryptosporidium species identification, the amplicon sequencing approach detected mixtures and low-abundance variants critical for understanding transmission patterns [60].
Detailed Experimental Protocol: NGS Amplicon Sequencing for Parasite Detection
This protocol is adapted from published methodologies for parasite identification using amplicon sequencing of target genes [60] [59].
Sample Preparation and DNA Extraction
- Sample Collection: Collect clinical specimens (stool, blood, tissue) in appropriate preservatives. For formalin-fixed paraffin-embedded (FFPE) tissues, note that DNA may be fragmented but still suitable for targeted sequencing [63].
- DNA Extraction: Use commercial DNA extraction kits designed for the specific sample type. For stool samples, the DNeasy PowerSoil Pro Kit (Qiagen) is recommended to remove PCR inhibitors [60].
- DNA Quantification: Quantify DNA using fluorometric methods (e.g., Qubit fluorometer) to ensure sufficient input material while accounting for potential inhibitor carryover [60].
Primer Design and Target Selection
- Target Genes: Select appropriate genetic targets for parasite identification:
- Primer Design: Design primers flanking hypervariable regions. For 18S rRNA targeting Cryptosporidium, a 431-bp amplicon spanning V3-V4 regions has been successfully used [60].
- Adapter Modification: Modify primers to include Illumina adapter sequences for compatibility with sequencing platforms [60].
Library Preparation with Sample Barcoding
- Barcoded Primers: Use unique 8-10 bp barcodes (Multiple Identifiers - MIDs) for each sample [22]. This enables sample multiplexing.
- PCR Amplification:
- PCR Purification: Clean amplicons using magnetic beads to remove primers and enzymes.
- Library Pooling: Quantify individual amplicons and pool in equimolar ratios.
- Quality Control: Assess library quality using bioanalyzer or tape station.
Sequencing and Data Analysis
- Sequencing Platform: Use Illumina MiSeq or similar platform with 2×250 bp or 2×300 bp chemistry for sufficient overlap.
- Bioinformatics Pipeline:
- Demultiplexing: Assign reads to samples based on barcodes.
- Quality Filtering: Remove low-quality reads and trim adapters.
- Denoising: Use DADA2 or similar algorithm to correct errors and infer exact amplicon sequence variants (ASVs) [60].
- Taxonomic Assignment: Compare ASVs to curated reference databases using BLAST or phylogenetic placement.
- Relative Abundance: Calculate proportion of reads assigned to each taxon.
The following workflow summarizes the key experimental and computational steps:
The Scientist's Toolkit: Essential Research Reagents and Materials
Successful implementation of NGS for parasite detection requires specific reagents and computational resources.
Table 3: Essential Research Reagents and Materials for Parasite NGS
| Item | Function/Description | Example Products/Platforms |
|---|---|---|
| DNA Extraction Kit | Isolation of high-quality DNA from complex samples while removing PCR inhibitors | DNeasy PowerSoil Pro Kit (Qiagen) [60] |
| Barcoded Primers | Target-specific primers with unique sample barcodes for multiplexing | Custom-designed primers with 10-mer MIDs [22] |
| High-Fidelity DNA Polymerase | Accurate amplification with minimal bias in representation | Platinum Taq polymerase (Invitrogen) [22] |
| Library Prep Kit | Preparation of sequencing-ready libraries from amplicons | Pathogeno One 400+ Library Prep Kit [64] |
| Sequencing Platform | High-throughput sequencing of multiplexed libraries | Illumina MiSeq [60] [59] |
| Bioinformatics Tools | Data processing, variant calling, and taxonomic assignment | DADA2 pipeline [60], CLC Genomics Workbench [63] |
| Curated Reference Database | Accurate taxonomic classification of sequence variants | Custom Cryptosporidium 18S database [60], CryptoDB [60] |
The implementation of NGS amplicon sequencing represents a paradigm shift in parasitology research, enabling comprehensive analysis of mixed infections and complex parasite communities that were previously undetectable with Sanger sequencing [59]. The method's ability to identify multiple species and intra-species genetic variants within individual hosts provides unprecedented insight into transmission dynamics, host specificity, and the true complexity of parasite populations [60].
While Sanger sequencing remains valuable for confirming dominant sequences or testing single isolates [8] [9], NGS is now the technology of choice for ecological studies, epidemiological surveys, and clinical investigations where mixed infections are suspected. As sequencing costs continue to decline and bioinformatic tools become more accessible, NGS-based approaches will likely become standard for parasite community analysis, ultimately transforming our understanding of parasite biodiversity and disease pathogenesis.
The accurate detection of low-frequency genetic variants is a cornerstone of modern parasitology and mitochondrial disease research. In this context, heteroplasmy—the co-existence of multiple mitochondrial DNA (mtDNA) sequences within a single cell or individual—presents a significant analytical challenge. The severity of symptoms in mitochondrial diseases, and the population dynamics of parasites like Blastocystis sp., are often determined by the proportion of mutant alleles, necessitating techniques capable of reliable quantification [65]. The choice between Sanger sequencing and Next-Generation Sequencing (NGS) is critical, as it directly impacts the sensitivity, throughput, and ultimate success of variant detection studies.
Table 1: Key Performance Metrics of Sanger Sequencing vs. Next-Generation Sequencing
| Parameter | Sanger Sequencing | Next-Generation Sequencing (NGS) |
|---|---|---|
| Detection Limit for Low-Frequency Variants | ~15-20% [16] [17] | 1% or lower [16] [66] [17] |
| Typical Throughput | Processes a single DNA fragment per run [16] [17] | Massively parallel; sequences millions of fragments simultaneously [16] [17] |
| Read Length | Long read lengths (≥ 900 bp) [36] | Short reads (Illumina) to long reads (PacBio, Nanopore) [17] |
| Discovery Power | Limited; best for confirming known variants [16] [17] | High; ideal for identifying novel variants [16] [17] |
| Best Application in Variant Detection | Targeted analysis of a small number of samples when the variant is expected to be at high frequency [17] [36] | Screening many samples or genes; detecting rare variants and heteroplasmy [67] [16] [17] |
For parasite research, such as barcoding and subtyping the intestinal protist Blastocystis, these differences have practical consequences. One study demonstrated that real-time PCR (qPCR) proved more sensitive than conventional PCR for initial detection [67]. Furthermore, when subtyping, NGS showed higher sensitivity for detecting mixed subtype infections within a single host compared to Sanger sequencing, revealing a more complex picture of colonization [67].
Detailed Experimental Protocols
Protocol for NGS-Based Detection of Heteroplasmy in Mitochondrial Genomes
This protocol is designed for the sensitive detection of low-level heteroplasmy from total DNA extracts, incorporating strategies to mitigate artefacts from nuclear mitochondrial sequences (NUMTs) [65].
Key Reagents and Equipment:
- DNA Input: 50 ng of total genomic DNA (for probe-based capture) [68].
- mtDNA Enrichment Kit: e.g., xGen Human mtDNA Hyb Panel (IDT) [68] or similar.
- Library Prep Kit: Illumina-specific kits (e.g., for MiSeq) or other NGS systems.
- Sequencing Platform: Illumina MiSeq [67] [68] or comparable system.
- Bioinformatic Tools: Aligners (Minimap2), variant callers (Mutserve2), and the GRCh38 reference genome which includes the revised Cambridge Reference Sequence (rCRS) [66] [68].
Step-by-Step Procedure:
- Library Preparation & mtDNA Enrichment: Perform library preparation using a probe-based capture kit to enrich for mitochondrial DNA. This method is superior to PCR-based enrichment for avoiding NUMT co-amplification and providing uniform coverage [65] [68].
- High-Throughput Sequencing: Sequence the prepared libraries on an NGS platform to achieve high coverage (>7,000x per base is recommended for detecting minor allele frequencies down to 0.1%) [66].
- Bioinformatic Data Analysis:
- Alignment: Map the sequenced reads to a reference genome that includes both the nuclear (hg19/GRCh38) and mitochondrial (rCRS) genomes. Aligning to a combined reference is crucial for identifying and filtering out reads originating from NUMTs, which can be misinterpreted as heteroplasmy [65].
- Variant Calling: Use a specialized variant caller (e.g., Mutserve2) with a sensitive threshold (e.g., 1% or 0.1%) to identify potential heteroplasmic sites [68].
- Validation with Replicates: Sequence multiple technical and biological replicates to distinguish true, reproducible low-level heteroplasmy from stochastic sequencing errors. A variant must be detected across all replicates to be considered genuine [66].
Protocol for Sanger Sequencing with Minor Variant Finder for Low-Level Variant Detection
Traditional Sanger sequencing can be enhanced with specialized software to push its detection limit for somatic variants down to approximately 5%.
Key Reagents and Equipment:
- DNA Input: Control and test samples.
- PCR and Sequencing Reagents: Primers, BigDye Terminator Cycle Sequencing Kit [69].
- Genetic Analyzer: Applied Biosystems 3130 or 3500 series [70] [69].
- Analysis Software: Minor Variant Finder Software (Thermo Fisher) [70].
Step-by-Step Procedure:
- Sample Preparation and Sequencing:
- Prepare control and test samples using identical materials and procedures (same primers, instruments, etc.) to minimize technical noise [70].
- Perform Sanger sequencing on both forward and reverse strands for the control and test samples.
- Data Analysis with Minor Variant Finder:
- Import the sequencing data (.ab1 files) from the control and test samples into the Minor Variant Finder Software.
- The software's algorithm uses the control sample to neutralize background noise, resulting in a cleaner electropherogram for the test sample.
- Review the software-called minor variants, which can be detected at a level as low as 5% [70].
- Confirmation: Confirm findings by observing the minor variant on both forward and reverse strands.
The Scientist's Toolkit: Essential Research Reagents and Materials
Successful detection of low-frequency variants requires careful selection of laboratory reagents and computational tools.
Table 2: Key Reagent Solutions and Bioinformatics Tools
| Item Name | Type/Category | Critical Function in Workflow |
|---|---|---|
| xGen Human mtDNA Hyb Panel | mtDNA Enrichment Kit | Uses probe-based hybridization to selectively capture mtDNA from total genomic DNA, reducing co-amplification of NUMTs [68]. |
| Precision ID mtDNA Panel | Targeted NGS Panel | A PCR-based panel for amplifying the mitochondrial control region, designed for use with Ion Torrent NGS systems [69]. |
| Minor Variant Finder Software | Data Analysis Tool | Applies a noise-reduction algorithm to Sanger sequencing data, enabling detection of minor variants present at frequencies as low as 5% [70]. |
| Mutserve2 | Bioinformatics Tool | A specialized variant caller for mtDNA NGS data, used to identify and quantify heteroplasmic sites with high sensitivity [68]. |
| Combined Reference Genome (e.g., hg19+rCRS) | Bioinformatics Resource | A reference sequence containing both the nuclear and mitochondrial genomes, essential for filtering out NUMT-derived false positives during alignment [65]. |
| Revised Cambridge Reference Sequence (rCRS) | Reference Standard | The standard reference sequence for the human mitochondrial genome (NC_012920.1), used for consistent variant numbering and reporting [65] [68]. |
Critical Data Analysis and Bioinformatics Considerations
The analysis of low-frequency variants, particularly from NGS data, requires a robust bioinformatics pipeline to separate true biological signals from technical artefacts.
Key steps in the analysis include:
- NUMT Filtration: As highlighted in [65], failing to align sequence data to a combined nuclear and mitochondrial reference genome is a major source of error. NUMTs can be misinterpreted as genuine heteroplasmy, leading to inaccurate variant calls.
- Replicate Sequencing: True low-level heteroplasmy must be reproducible. Sequencing the same sample in multiple technical and biological replicates is a critical strategy to distinguish real variants from random sequencing errors. A confirmed heteroplasmy call should be detectable across all replicates [66].
- Variant Confirmation: Using an independent bioinformatics pipeline or a different sequencing platform (e.g., Illumina and NextSeq) to confirm the presence of a variant adds a further layer of confidence [66]. Additionally, parameters like genotype quality (GQ) scores and the presence of the variant on both sequencing strands should be assessed.
Solving Common Challenges in Parasite Barcoding Projects
The genetic characterization of parasites is fundamental to diagnosis, epidemiological monitoring, and drug development research. DNA barcoding, which relies on sequencing short, standardized gene regions, is a key tool for parasite identification [71] [72]. However, the success of any sequencing project, whether using traditional Sanger sequencing or Next-Generation Sequencing (NGS), is critically dependent on the quality and quantity of the input DNA template. Researchers frequently encounter significant challenges with low DNA yield and degraded samples, particularly when working with parasites obtained from clinical specimens, fixed archival materials, or sparse biopsies [73]. These template issues can lead to failed sequencing reactions, incomplete data, and inaccurate results, ultimately hampering research progress.
Within the context of parasite DNA barcoding, the choice between Sanger sequencing and NGS introduces distinct considerations for handling suboptimal samples. This application note provides a detailed comparison of these sequencing technologies and offers standardized protocols to overcome common template-related challenges, ensuring reliable genetic data for parasite research.
Sanger Sequencing vs. NGS: A Comparative Analysis for Parasite Research
The selection of an appropriate sequencing platform is a critical first step in experimental design. Table 1 summarizes the core characteristics of Sanger sequencing and NGS, highlighting their respective advantages and limitations in the context of parasite DNA barcoding.
Table 1: Comparison of Sanger Sequencing and NGS for Parasite DNA Barcoding
| Feature | Sanger Sequencing | Next-Generation Sequencing (NGS) |
|---|---|---|
| Fundamental Method | Chain termination using dideoxynucleotides (ddNTPs) [8] | Massively parallel sequencing of millions of fragments [8] |
| Optimal Read Length | 500 - 1000 bp [72] [8] | 50 - 500 bp (varies by platform) [41] [8] |
| Typical Sensitivity | 15-20% Variant Allele Frequency (VAF) [41] | <1% VAF [41] |
| DNA Requirement | Higher quantity required (micrograms to milligrams) [72] | Lower quantity required (nanograms to micrograms) [72] |
| Cost Basis | Low cost per run, high cost per base for large projects [8] | High capital and reagent cost per run, low cost per base [8] |
| Primary Application in Parasitology | Targeted sequencing of single barcode genes or specific regions from pure, high-quality samples [9] | Multiplexed barcoding, detection of mixed infections, and identification of unknown pathogens via metagenomics (mNGS) [71] [72] |
| Suitability for Low-Yield/Degraded DNA | Limited, requires sufficient intact template for a single, strong PCR amplification [74] | High; designed to work with fragmented DNA and can be applied to single PCR amplicons or used for shotgun sequencing of total DNA [73] [71] |
Sanger sequencing remains the "gold standard" for verifying specific variants and sequencing single, well-defined targets from high-quality DNA due to its long read lengths and high per-base accuracy [9] [8]. Its low per-run cost makes it ideal for laboratories focused on a limited number of known parasite targets.
In contrast, NGS excels in throughput and sensitivity. Its ability to simultaneously sequence millions of DNA fragments makes it uniquely suited for complex applications, such as identifying multiple parasite species in a single sample (metabarcoding) or detecting low-abundance pathogens that would be missed by Sanger sequencing [71] [72]. While NGS has a higher upfront cost, its cost per base is significantly lower, making it cost-effective for larger-scale screening projects [8] [75].
Protocols for Handling Low-Yield and Degraded Parasite DNA
Protocol 1: Vacuum Centrifugation for Concentrating Low-Yield DNA
Sparse parasite material often yields DNA concentrations below the recommended threshold for sequencing. Vacuum centrifugation is a reliable and efficient method for concentrating these dilute samples without compromising their mutational profile [73].
Detailed Methodology:
- Sample Assessment: Quantify the DNA sample using a fluorescence-based method (e.g., Qubit fluorometer with the dsDNA HS Assay Kit), as this is more accurate for low-concentration samples than spectrophotometry [73].
- Equipment Setup: Use a vacuum concentrator, such as the SpeedVac DNA130. Ensure the instrument is at room temperature (22–24 °C) [73].
- Concentration Process:
- Transfer the low-yield DNA sample (concentration below 0.5 ng/µL) into a microcentrifuge tube. A typical starting volume is 55 µL [73].
- Load the samples into the vacuum concentrator and start the run.
- The relationship between concentration, volume, and time can be modeled linearly. For a sample with an initial concentration of ~0.75 ng/µL, a 20-minute centrifugation increases the concentration by approximately 0.52 ng/µL while reducing the volume by about 22 µL [73].
- Monitor the process and adjust the time based on the desired final concentration and volume.
- Post-Concentration Quantification: Re-measure the DNA concentration and volume post-concentration to confirm successful concentration before proceeding to library preparation or PCR amplification [73].
The following workflow diagram illustrates the key steps in this protocol:
Protocol 2: Optimized 18S rDNA Metabarcoding for Parasite Identification
For the simultaneous identification of multiple parasites from a single sample, 18S ribosomal RNA (rRNA) gene metabarcoding is a powerful NGS-based approach. The following protocol, adapted from recent research, details the workflow with optimizations for output and accuracy [71].
Detailed Methodology:
DNA Extraction and Quality Control:
- Extract genomic DNA from parasite specimens (e.g., helminths preserved in ethanol or cultured protozoa) using a dedicated kit, such as the Fast DNA SPIN Kit for Soil [71].
- Assess DNA quality and quantity. For degraded samples, consider uracil DNA glycosylase (UDG) treatment to minimize cytosine deamination artifacts common in formalin-fixed or old samples [73].
Library Preparation for Amplicon Sequencing:
- Primary PCR Amplification: Amplify the 18S rDNA V9 region using primers 1391F and EukBR, which have adapters for NGS attached.
- Reaction Mix: Use KAPA HiFi HotStart ReadyMix or another high-fidelity polymerase.
- Cycling Conditions: 95°C for 5 min; 30 cycles of 98°C for 30s, 55°C for 30s, 72°C for 30s; final extension at 72°C for 5 min [71].
- Critical Optimization: The annealing temperature significantly affects the relative abundance of reads for each parasite. Testing a gradient from 40°C to 70°C is recommended to balance specificity and yield [71].
- Indexing PCR: Perform a limited-cycle (e.g., 8-cycle) PCR to add multiplexing indices and full Illumina sequencing adapters to the amplicons.
- Library Pooling and Clean-up: Pool the indexed libraries in equimolar ratios and purify.
- Primary PCR Amplification: Amplify the 18S rDNA V9 region using primers 1391F and EukBR, which have adapters for NGS attached.
Sequencing and Data Analysis:
- Sequence the pooled library on an appropriate Illumina platform (e.g., iSeq 100) using a v2 reagent kit [71].
- Bioinformatic Processing:
- Demultiplex and trim reads using tools like Cutadapt [71].
- Denoise, dereplicate, and filter chimeric sequences using the DADA2 algorithm within the QIIME 2 pipeline [71].
- Perform taxonomic assignment by comparing Amplicon Sequence Variants (ASVs) against a customized database of parasite 18S rRNA sequences from NCBI [71].
The metabarcoding workflow, from sample to identification, is summarized below:
The Scientist's Toolkit: Essential Reagents and Materials
Successful sequencing of challenging parasite DNA samples requires carefully selected reagents and equipment. The following table lists key solutions for the protocols described in this note.
Table 2: Research Reagent Solutions for Parasite DNA Sequencing
| Item | Function/Application | Example Product(s) |
|---|---|---|
| High-Fidelity DNA Polymerase | Reduces PCR errors during amplicon generation for both Sanger and NGS libraries, crucial for accurate barcoding. | KAPA HiFi HotStart ReadyMix [71] |
| Fluorometric DNA Quantitation Kit | Accurately measures low concentrations of double-stranded DNA, essential for assessing low-yield samples before sequencing. | Qubit dsDNA HS Assay Kit [73] |
| Uracil-DNA Glycosylase (UDG) | Treats DNA extracted from FFPE or old samples to reduce false-positive C>T transitions caused by cytosine deamination. | Thermo Scientific Uracil-DNA Glycosylase [73] |
| Vacuum Concentrator | Concentrates dilute DNA samples to levels suitable for sequencing reactions and library preparation. | SpeedVac DNA130 Vacuum Concentrator [73] |
| DNA Extraction Kit (Soil/Stool) | Efficiently lyses tough parasite structures (e.g., helminth eggs) and purifies DNA from complex, inhibitor-rich samples. | Fast DNA SPIN Kit for Soil [71] |
| NGS Amplicon Library Prep Kit | Provides reagents for targeted sequencing panels, enabling multiplexed parasite detection from a single sample. | Oncomine Focus Assay (adapted principle) [73] |
The challenges of low DNA yield and sample degradation are common in parasite research but can be effectively managed with robust protocols. For Sanger sequencing, concentrating DNA via vacuum centrifugation provides a direct path to obtaining sufficient template. For more complex applications, such as identifying multiple parasites or detecting low-abundance species, NGS-based metabarcoding offers a powerful, albeit more technically involved, solution. The critical factors for success in these endeavors include careful sample preparation, protocol optimization (especially of PCR conditions), and the selection of a sequencing platform whose strengths are aligned with the specific research goals. By implementing these standardized application notes, researchers can significantly improve the reliability and throughput of their parasite DNA barcoding studies.
In parasite DNA barcoding research, accurate sequencing is fundamental for species identification, epidemiological studies, and drug development. However, conventional Sanger sequencing faces significant limitations when encountering genomic complexities such as pseudogenes, insertion-deletion mutations (indels), and microsatellite regions. These elements create substantial challenges for reliable sequence determination, potentially compromising diagnostic accuracy and taxonomic classification. Next-generation sequencing (NGS) technologies have emerged as powerful alternatives that can overcome these limitations through massively parallel sequencing capabilities. This application note examines the technical challenges posed by complex genomic regions in parasite research and provides detailed protocols for implementing NGS-based solutions that enable more comprehensive and reliable DNA barcoding outcomes, thereby enhancing research precision in parasitology and drug development pipelines.
Table 1: Comparison of Sequencing Performance Across Genomic Challenges
| Genomic Challenge | Sanger Sequencing Limitations | NGS Advantages | Impact on Parasite Research |
|---|---|---|---|
| Pseudogenes | Cannot distinguish functional genes from non-functional copies; generates uninterpretable chromatograms [49] | Parallel sequencing detects all variants, enabling differentiation of true sequences from pseudogenes [49] [50] | Prevents misidentification of species; crucial for detecting genuine drug targets |
| Indels | Struggles with length polymorphisms; produces shifted sequences beyond indel sites [49] [76] | Accurately characterizes indel variants and their frequencies [76] [77] | Essential for understanding antigenic variation and virulence factors |
| Microsatellites | Homopolymer errors and difficult-to-sequence repetitive regions [49] [78] | High-resolution analysis of microsatellite length variations [49] [78] | Enables strain typing and outbreak tracing |
| Multi-species infections | Limited to single template sequencing; mixed infections yield uninterpretable results [53] | Simultaneous sequencing of multiple templates from mixed infections [53] [79] | Critical for understanding polyparasitism and treatment efficacy |
Technical Challenges in Sanger Sequencing
Pseudogenes and Non-Target Amplification
Sanger sequencing operates on the principle of sequencing a single DNA template per reaction, which becomes problematic when multiple similar sequences exist in the genome. Nuclear mitochondrial pseudogenes (NUMTs)—non-functional copies of mitochondrial genes that have been transferred to the nuclear genome—are particularly problematic as they can be co-amplified with the target barcoding region [50]. When sequenced with Sanger methodology, these conflicting templates produce overlapping signals in the chromatogram, making accurate base calling impossible. Studies on fig wasp barcoding revealed that approximately 5% of species produced paraphyletic results or divergent sequence groups when Sanger and NGS results were compared, suggesting NUMTS interference that went undetected with conventional sequencing [50].
Indel Polymorphisms and Frameshifts
Insertions and deletions present unique challenges for Sanger sequencing, particularly in parasite genomes where these mutations are common. The Internal Transcribed Spacer 2 (ITS2) region in mosquitoes exhibits significant length variation due to indels, causing reading frame shifts that complicate alignment and interpretation [49]. Traditional sequencing methods require cloning of PCR products before sequencing to overcome this limitation—a time-consuming and costly process that is impractical for high-throughput barcoding applications. In clinical parasitology, inaccurate indel calling can lead to misleading conclusions about functional consequences of genetic variants, with significant implications for diagnostic interpretation [76] [77].
Microsatellites and Homopolymer Regions
Microsatellites—tandem repeats of short DNA motifs—are notoriously difficult to sequence with Sanger methods due to polymerase slippage and homopolymer compression artifacts. These regions are common in parasite genomes and can serve as valuable markers for strain differentiation. However, Sanger sequencing struggles with repetitive elements, often resulting in ambiguous base calls and poor-quality sequences beyond the repeat region [49] [78]. This limitation hinders the development of robust microsatellite-based typing systems for tracking parasite transmission dynamics.
NGS Methodologies for Complex Sequence Resolution
Amplicon Sequencing of Hypervariable Regions
Amplicon-based NGS approaches enable comprehensive characterization of genetically complex regions by sequencing thousands of templates in parallel. This methodology is particularly effective for multi-copy gene families and length-variable regions that are problematic for Sanger sequencing. In mosquito DNA barcoding, NGS amplicon sequencing of the ITS2 region revealed 382 unique sequences (alleles) from 88 specimens—a level of diversity previously overlooked by traditional methods [49]. The protocol involves a two-step PCR approach: initial amplification with target-specific primers, followed by a second PCR to add Illumina adaptor sequences and sample-specific indexes for multiplexing [50].
Figure 1: NGS Amplicon Sequencing Workflow for Complex Genomic Regions
Targeted Enrichment Strategies
For applications requiring sequencing of multiple genomic regions or when host DNA contamination is a concern, targeted enrichment approaches combined with blocking primers significantly improve parasite sequence recovery. Recent advances in blood parasite identification have demonstrated the effectiveness of peptide nucleic acid (PNA) and C3-spacer modified oligonucleotides that selectively inhibit host DNA amplification while preserving pathogen detection sensitivity [79]. This approach enabled detection of Trypanosoma brucei rhodesiense, Plasmodium falciparum, and Babesia bovis in human blood samples with sensitivities as low as 1-4 parasites per microliter.
Multiplex PCR for Multi-Species Detection
In surveillance applications where multiple pathogen species may be present in a single sample, multiplex PCR approaches combined with NGS detection overcome the limitation of Sanger sequencing, which cannot resolve mixed templates. A 2024 study demonstrated that a multiplex PCR protocol could identify mixed Aedes species in ovitrap samples with higher success rates than DNA barcoding (1,990 vs. 1,722 samples successfully identified), including 47 samples with multiple species that Sanger sequencing failed to detect [53].
Experimental Protocols
Protocol 1: Amplicon Sequencing for Hypervariable Regions
Principle: This protocol utilizes a two-step PCR approach to sequence complex genomic regions containing indels and microsatellites, enabling detection of allelic diversity within individual organisms [49] [50].
Materials:
- Magnetic bead-based nucleic acid extraction kit (e.g., MagMAX DNA Multi-Sample Kit)
- High-fidelity DNA polymerase (e.g., ThermoPol Reaction Buffer)
- Tailored primers targeting hypervariable region (e.g., ITS2-MOS-F: 5'-GCTCGTGGATCGATGAAGAC-3' and ITS2-MOS-R: 5'-TGCTTAAATTTAGGGGGTAGTCAC-3')
- AMPure XP beads for purification
- Illumina MiSeq platform with v3 chemistry
Procedure:
- DNA Extraction: Isolate genomic DNA from single legs or small tissue samples using magnetic bead-based protocols to maximize yield from minimal material [49].
- First PCR - Target Amplification:
- Set up 25 µL reactions containing: 15.3 µL 1× BSA, 2.5 µL 10× ThermoPol Reaction Buffer, 2 µL 2.5 µM dNTPs, 1.25 µL of each 10 µM primer, 0.2 µL 1.0 U Taq DNA Polymerase, and 5-15 ng template DNA.
- Use the following thermal cycling conditions: 94°C for 2 min; 40 cycles of 94°C for 30 sec, 51°C for 45 sec, and 72°C for 45 sec; final extension at 72°C for 1 min.
- Amplicon Purification: Verify PCR products on 2% agarose gel, then purify using AMPure XP beads with a 0.8× beads ratio.
- Second PCR - Library Preparation:
- Ligate universal Y-shape adaptors onto individual PCR products.
- Remove excess adaptors using AMPure XP beads.
- Add unique 8 bp barcodes with Illumina P5 and P7 adapters via PCR (18 cycles).
- Perform final AMPure XP bead clean-up.
- Library Quantification and Pooling:
- Quantify each sample using NanoDrop 1000.
- Create a single equimolar pool and quantify using Qubit fluorometer.
- Check library size with Bioanalyzer 2100.
- Remove any remaining adaptor dimers with additional AMPure XP clean-up.
- Sequencing: Sequence pooled library on MiSeq platform with 2×250 bp reads using v3 chemistry.
Data Analysis:
- Demultiplex sequences based on barcodes.
- Perform quality control (e.g., Phred score >Q30).
- Cluster sequences based on similarity (≥97% identity).
- Align to reference sequences and identify indel/microsatellite variants.
Protocol 2: Host Depletion for Blood Parasite Detection
Principle: This protocol uses blocking primers to suppress host DNA amplification while enriching for parasite 18S rDNA sequences, enabling sensitive detection of low-abundance pathogens in blood samples [79].
Materials:
- Universal 18S rDNA primers (F566 and 1776R)
- Blocking primers (3SpC3Hs1829R and Hs422PNA)
- Innuprep DNA Mini Kit or BioExtract SuperBall Kit
- Long-range PCR enzyme mix
- Oxford Nanopore or Illumina sequencing platform
Procedure:
- Primer Design:
- Select universal primers flanking V4-V9 region of 18S rDNA (F566: 5'-...-3' and 1776R: 5'-...-3').
- Design two blocking primers: 3SpC3Hs1829R (C3-spacer modified) and Hs422PNA (peptide nucleic acid).
- DNA Extraction: Extract DNA from whole blood samples using robotic systems (e.g., KingFisher Flex96).
- PCR with Blocking Primers:
- Set up reactions containing: 10-50 ng DNA, universal primers (0.5 µM each), blocking primers (1.0 µM each), dNTPs, and long-range polymerase.
- Use thermal cycling conditions: 94°C for 2 min; 35 cycles of 94°C for 30 sec, 56°C for 45 sec, and 72°C for 2 min; final extension at 72°C for 10 min.
- Library Preparation and Sequencing:
- Purify PCR products with AMPure XP beads.
- Prepare sequencing library using ligation sequencing kit.
- Sequence on portable nanopore platform or Illumina system.
Table 2: Performance Comparison of Sequencing Approaches for Parasite Detection
| Parameter | Sanger Sequencing | NGS Amplicon Sequencing | Targeted NGS with Host Depletion |
|---|---|---|---|
| Detection Limit | Moderate (depends on target specificity) | High (1-10 parasites/µL) | Very high (1-4 parasites/µL) [79] |
| Mixed Infection Detection | Not possible | Excellent (47/2271 samples showed mixtures) [53] | Excellent (multiple Theileria species in cattle) [79] |
| Allelic Diversity Resolution | Limited to dominant variant | Comprehensive (382 alleles from 88 specimens) [49] | Moderate (depends on target region) |
| Host Contamination Resistance | Poor | Moderate | Excellent (blocking primers) [79] |
| Throughput | Low (96 samples/run) | High (384+ samples/run) | Moderate (96-192 samples/run) |
| Cost per Sample | $5-10 | $2-5 | $8-15 |
The Scientist's Toolkit: Essential Research Reagents
Table 3: Key Research Reagents for Addressing Sequence Complexity
| Reagent/Category | Specific Examples | Function & Application |
|---|---|---|
| Blocking Primers | C3-spacer modified oligos, PNA oligomers [79] | Suppress amplification of host DNA in clinical samples; enable pathogen enrichment in high-background samples |
| Magnetic Beads | AMPure XP, MagMAX kits [49] | Solid-phase reversible immobilization for DNA purification and size selection; crucial for NGS library preparation |
| High-Fidelity Polymerases | ThermoPol, Long-range PCR mixes | Accurate amplification of complex templates; minimize PCR errors in homopolymer regions |
| Universal Primers | F566/1776R for 18S rDNA [79], ITS2-MOS primers [49] | Amplify target regions across diverse parasite taxa; enable barcoding without prior sequence knowledge |
| Indexing Systems | Illumina barcodes, Unique dual indexes | Sample multiplexing; enable pooling of hundreds of samples in single NGS run |
| Platform-Specific Kits | MiSeq v3 chemistry, Nanopore ligation kits | Optimized chemistry for specific sequencing platforms; ensure maximum read length and accuracy |
The limitations of Sanger sequencing in addressing complex genomic regions have become increasingly apparent as parasite research advances toward more precise genetic characterization. NGS methodologies provide robust solutions to challenges posed by pseudogenes, indels, and microsatellites through massively parallel sequencing and specialized enrichment techniques. The protocols outlined herein enable researchers to overcome historical technical barriers, revealing previously hidden genetic diversity in parasite populations. As sequencing technologies continue to evolve, with emerging platforms offering improved accuracy and longer read lengths, the capacity to resolve complex genomic regions will further enhance parasite detection, typing, and tracking capabilities. Implementation of these NGS-based approaches will accelerate drug discovery pipelines and strengthen molecular epidemiology studies in parasitology.
The accurate amplification of genetic markers is fundamental to parasite DNA barcoding research, yet technical challenges frequently compromise results. High GC-rich content and repetitive regions represent particular obstacles that can prevent successful PCR amplification, leading to failed sequencing reactions and incomplete data. These challenges are especially relevant in the context of choosing between Sanger sequencing and next-generation sequencing (NGS) platforms for barcoding applications. While Sanger sequencing remains widely accessible, its inability to resolve mixed templates represents a significant limitation for complex parasite samples [53]. NGS methods, particularly amplicon-based metabarcoding, overcome this limitation by enabling the detection and differentiation of multiple species and subtypes within a single sample, providing a more comprehensive view of parasite diversity [54].
The foundation of any successful sequencing effort, regardless of the platform, is specific and efficient PCR amplification. This application note provides detailed protocols and strategies for optimizing PCR to overcome the challenges posed by difficult templates, with a specific focus on applications in parasite DNA barcoding.
Technical Challenges and Optimization Strategies
Understanding the Problem: GC-Rich Content and Secondary Structures
GC-rich templates, typically defined as sequences exceeding 65% guanine-cytosine content, pose a significant challenge for PCR amplification due to the formation of stable secondary structures. The stronger hydrogen bonding between G and C bases results in elevated melting temperatures and can cause DNA polymerases to "stutter" along templates, interrupting DNA synthesis [80]. These stable secondary structures can form hairpins and other complex configurations that block polymerase progression, leading to inefficient amplification or complete PCR failure [81].
In parasite genomics, these challenges are frequently encountered. For instance, the genome of Mycobacterium species, which includes important parasitic species, exhibits exceptionally high GC content (approximately 66%), making amplification of certain target genes particularly problematic [81]. Similarly, the epidermal growth factor receptor (EGFR) promoter region features GC content as high as 88%, requiring specialized optimization approaches for successful amplification [82].
Comprehensive Optimization Approaches
Chemical Enhancers and Additives
The use of PCR additives is one of the most effective strategies for facilitating amplification of GC-rich targets. These chemical enhancers work by interfering with secondary structure formation and reducing the thermodynamic stability of GC bonds.
- Dimethyl sulfoxide (DMSO) is widely utilized at concentrations ranging from 1% to 10%, with 5% frequently proving optimal. DMSO helps denature stable secondary structures by interfering with hydrogen bonding and base stacking, effectively lowering the melting temperature (Tm) of the template [82] [80] [83]. When using DMSO, the annealing temperature typically requires downward adjustment by 1-2°C for every 1% DMSO added [83].
- Other additives include formamide (typically 1.25-10%), which weakens base pairing and increases primer annealing specificity, and non-ionic detergents such as Tween 20 or Triton X-100 (0.1-1%), which can stabilize DNA polymerases and prevent secondary structure formation [83]. Bovine serum albumin (BSA) at approximately 400ng/μL can alleviate PCR inhibition from compounds present in biological samples such as fecal matter [83].
PCR Component Optimization
Fine-tuning individual PCR components is crucial for successful amplification of challenging templates.
- Magnesium Concentration: Magnesium chloride (MgCl₂) is an essential cofactor for thermostable DNA polymerases, with concentrations significantly impacting reaction specificity and efficiency. The recommended starting concentration is 1.5-2.0 mM, though optimal concentrations may range from 0.5 to 5.0 mM depending on primer composition and template characteristics [82] [83] [84]. Higher Mg²⁺ concentrations stabilize duplex formation but may reduce specificity.
- DNA Polymerase Selection: Highly processive DNA polymerases that remain tightly bound to templates during extension are particularly beneficial for GC-rich PCR. Hyperthermostable enzymes capable of withstanding denaturation temperatures of 98°C rather than standard 95°C can significantly improve strand separation [80]. Enzyme blends combining processivity with proofreading activity often yield optimal results for challenging templates.
- Template Considerations: DNA concentration significantly impacts amplification success. For formalin-fixed, paraffin-embedded tissues, a DNA concentration of at least 2 μg/mL has been shown necessary for successful amplification of GC-rich targets [82]. For standard PCR reactions with 25-30 cycles, approximately 10⁴ copies of the template DNA generally suffice to generate a detectable product [83].
Table 1: Optimal Concentrations for PCR Components in GC-Rich Amplification
| Component | Standard Concentration | GC-Rich Optimization Range | Function |
|---|---|---|---|
| MgCl₂ | 1.5 mM | 0.5 - 5.0 mM | DNA polymerase cofactor; stabilizes nucleic acid hybridization |
| DMSO | 0% | 1 - 10% (5% optimal) | Disrupts secondary structures; lowers Tm |
| Primers | 0.1-1.0 μM | 0.2-1.0 μM | Target-specific amplification |
| dNTPs | 200 μM each | 20-200 μM each | DNA synthesis building blocks |
| DNA Template | 10⁴ copies | Varies by sample type & quality | Amplification template |
Thermal Cycling Modifications
Adjusting thermal cycling parameters can dramatically improve amplification of difficult templates.
- Higher Denaturation Temperatures: Increasing denaturation temperatures from 95°C to 98°C improves strand separation of GC-rich templates [80]. The initial denaturation time may be extended up to 5 minutes when working with low DNA concentrations or particularly challenging secondary structures [83].
- Annealing Temperature Optimization: For GC-rich targets, optimal annealing temperatures are often significantly higher (e.g., 7°C or more) than calculated values based on standard formulas. Implementing a temperature gradient to empirically determine the optimal annealing temperature is strongly recommended [82].
- Touchdown PCR: This approach begins with an annealing temperature several degrees above the predicted Tm and gradually decreases it in subsequent cycles. This strategy promotes early amplification of specific targets while minimizing nonspecific binding in later cycles [80].
- Polymerase Activation: For hot-start polymerases, ensure complete activation during initial denaturation (typically 2-5 minutes at 95-98°C) to prevent nonspecific amplification during reaction setup [80] [83].
Table 2: Thermal Cycling Parameter Adjustments for Challenging Templates
| Cycling Step | Standard Parameters | GC-Rich Optimization | Rationale |
|---|---|---|---|
| Initial Denaturation | 94-95°C for 1-2 min | 98°C for 2-5 min | Improved strand separation of stable structures |
| Denaturation | 94-95°C for 10-30 s | 98°C for 10-20 s | Maintains template denaturation |
| Annealing | Calculated Tm for 30 s | Gradient: Tm+7°C to Tm; 30-60 s | Balances specificity with efficiency |
| Extension | 72°C, 1 min/kb | 72°C, 1-2 min/kb | Accommodates polymerase pausing |
Primer Design Innovations
Primer design represents a critical factor in successful amplification of challenging sequences. For GC-rich regions, specialized primer design strategies can dramatically improve outcomes.
- Codon Optimization: For extremely GC-rich targets, modifying primer sequences at the third (wobble) codon position without changing the encoded amino acid sequence can reduce overall GC content and minimize secondary structure formation. This approach has been successfully used to amplify genes from Mycobacterium tuberculosis that resisted standard amplification methods [81].
- Standard Design Principles: Optimal primer length generally falls between 15-30 nucleotides, with GC content of 40-60%. The 3' end of each primer should preferably contain a G or C base to promote strong binding, though this practice may increase annealing temperature. The melting temperatures (Tm) of forward and reverse primers should be within 5°C of each other, typically in the 52-58°C range [83] [84].
Application in Parasite Barcoding: Sanger Sequencing vs. NGS
The choice between Sanger sequencing and NGS platforms has significant implications for experimental design and PCR optimization in parasite barcoding research.
Methodological Comparison
- Sanger Sequencing Limitations: Conventional Sanger sequencing does not allow accurate identification of multiple species in a single sample, which represents a significant limitation when analyzing complex samples containing mixed parasite infections [53]. This method also lacks the sensitivity to detect minor subpopulations below approximately 15-20% of the total population.
- NGS Advantages: Amplicon-based NGS (metabarcoding) enables simultaneous detection and differentiation of multiple parasite species and subtypes within individual samples. This approach has been successfully applied to characterize genetic diversity in gut protozoa, including Blastocystis, Entamoeba, and Giardia [54]. NGS platforms can detect minor alleles at frequencies as low as 1% with adequate coverage (500X), providing unprecedented resolution for studying mixed infections and population diversity [43].
Platform Performance Characteristics
Comparative studies of NGS platforms have revealed important performance differences relevant to parasite barcoding. In a systematic comparison of Ion Torrent PGM and Illumina MiSeq for Plasmodium falciparum drug resistance markers, both platforms demonstrated excellent agreement with Sanger sequencing (99.83% sequencing accuracy). However, Illumina MiSeq provided significantly higher coverage (mean 28,886 reads per amplicon) compared to Ion Torrent PGM (mean 1,754 reads per amplicon) [43].
Integrated Experimental Protocols
Protocol 1: Standardized Workflow for GC-Rich PCR Amplification
Application: Amplification of GC-rich parasite DNA targets for downstream barcoding applications.
Reagents and Equipment:
- High-fidelity, hot-start DNA polymerase with high processivity
- 10X PCR buffer (without MgCl₂)
- 25 mM MgCl₂
- 10 mM dNTP mix
- DMSO (molecular biology grade)
- Forward and reverse primers (10 μM each)
- Template DNA (10-100 ng)
- Nuclease-free water
- Thermal cycler with gradient annealing capability
Procedure:
- Reaction Setup: Prepare a master mix on ice containing:
- 5.0 μL 10X PCR buffer
- 3.0 μL 25 mM MgCl₂ (1.5 mM final concentration)
- 1.0 μL 10 mM dNTP mix (200 μM each)
- 2.5 μL DMSO (5% final concentration)
- 1.0 μL forward primer (10 μM)
- 1.0 μL reverse primer (10 μM)
- 1.0 μL DNA polymerase (1-2.5 U)
- 5.0 μL template DNA (10-100 ng)
- Nuclease-free water to 50 μL total volume
Thermal Cycling:
- Initial denaturation: 98°C for 2 minutes
- 35 cycles of:
- Denaturation: 98°C for 20 seconds
- Annealing: Gradient from 65-72°C for 30 seconds (determine optimal temperature)
- Extension: 72°C for 1 minute per kb
- Final extension: 72°C for 5 minutes
- Hold: 4°C indefinitely
Analysis: Verify amplification by agarose gel electrophoresis before proceeding to purification and sequencing.
Protocol 2: Metabarcoding Library Preparation for Parasite Identification
Application: Preparation of amplicon libraries for NGS-based detection and differentiation of multiple parasite species.
Reagents and Equipment:
- All reagents from Protocol 1
- Modified primers with platform-specific adapter sequences
- Library purification kit
- Quantification system (e.g., Qubit, qPCR)
Procedure:
- Primary Amplification: Perform PCR as described in Protocol 1 using primers targeting conservative regions (e.g., 18S rRNA) with appended sequencing adapter sequences.
- Indexing PCR: Add platform-specific barcodes and complete adapter sequences in a second, limited-cycle PCR reaction.
- Library Purification: Clean amplified libraries using size-selection beads to remove primer dimers and nonspecific products.
- Quality Control and Quantification: Assess library quality by capillary electrophoresis and quantify precisely by qPCR.
- Pooling and Sequencing: Combine equimolar amounts of individually barcoded libraries for multiplexed sequencing on Illumina MiSeq, Ion Torrent, or similar platforms.
Visual Workflows and Diagrams
Diagram 1: Comprehensive strategy for challenging PCR targets and sequencing applications.
Research Reagent Solutions
Table 3: Essential Reagents for PCR Optimization in Parasite Barcoding
| Reagent Category | Specific Examples | Function in Optimization | Application Notes |
|---|---|---|---|
| Specialized Polymerases | Platinum II Taq, Pfu, Vent | High processivity, thermostability, proofreading | Pfu/Vent for high fidelity; Taq for high yield [80] [84] |
| Chemical Additives | DMSO, formamide, BSA | Disrupt secondary structures, reduce Tm, counteract inhibitors | Concentration titration required [82] [83] |
| Buffer Systems | MgCl₂-supplemented, GC enhancers | Optimize ionic environment, enhance specificity | Mg²⁺ concentration critical [82] [84] |
| Primer Design Tools | IDT OligoAnalyzer, NCBI Primer-BLAST | Predict Tm, secondary structures, specificity | Verify absence of hairpins/dimers [81] |
| Library Prep Kits | Illumina Nextera XT, Ion AmpliSeq | NGS adapter addition, multiplexing | Platform-specific requirements [43] [54] |
Successful PCR amplification of challenging genetic markers from parasite genomes requires a systematic approach addressing multiple reaction parameters simultaneously. Through strategic combination of chemical enhancers, specialized polymerase systems, optimized thermal cycling conditions, and sophisticated primer design, researchers can overcome the limitations imposed by high GC content and repetitive regions. The optimized PCR protocols described here provide a foundation for robust parasite DNA barcoding using both Sanger and NGS platforms, with NGS offering distinct advantages for complex samples containing multiple parasite species or genetic variants. As molecular parasitology continues to advance, these optimization strategies will remain essential for generating high-quality data for species identification, population genetics, and tracking of drug resistance markers.
In parasite DNA barcoding research, the choice between Sanger sequencing and Next-Generation Sequencing (NGS) dictates the specific data quality control (QC) protocols required to ensure reliable results. Sanger sequencing produces chromatograms representing single DNA sequences, where quality is assessed at the level of individual base calls. In contrast, NGS generates millions of short reads in parallel, requiring statistical approaches to evaluate quality across entire datasets. Within the broader thesis context of Sanger versus NGS for parasite barcoding, understanding how to interpret these different quality metrics is fundamental. Proper QC prevents misinterpretation of genetic variants, ensures accurate species identification, and validates the detection of mixed parasite infections or co-infections, which are critical for both basic research and drug development.
The fundamental distinction in data quality assessment stems from each technology's output. Sanger sequencing provides a single, consensus chromatogram for each amplified product, making quality assessment a visual and manual process focused on peak clarity and resolution. NGS, however, produces massive datasets where quality is quantified computationally using metrics like Q-scores and requires automated filtering and trimming protocols before biological interpretation can begin. This application note details the specific QC methodologies for both sequencing approaches within parasite barcoding workflows.
Interpreting Sanger Sequencing Chromatograms
Fundamentals of a Chromatogram
A chromatogram is a graphical representation of DNA sequence data generated during Sanger sequencing, displaying the order of nucleic bases (A, T, G, C) as a series of colored peaks. Each peak corresponds to a single base, and the sequence is determined by the peak color and order. The quality of the sequence data is directly determined by the quality of this chromatogram. A high-quality chromatogram is characterized by evenly spaced, sharp, and single peaks for each base position, with a low background signal between peaks. The primary quantitative metrics derived from a chromatogram are the retention time (time between sample injection and the peak maximum, which is characteristic of the base identity under set conditions) and the peak area and height, which are proportional to the concentration of the DNA fragment [85].
Step-by-Step Guide to Quality Assessment
A systematic approach to reading a chromatogram is essential for verifying sequence integrity in parasite barcoding.
- Inspect Peak Shape and Resolution: Peaks should be symmetrical and sharp. Broad or "spiky" peaks indicate potential issues with the sequencing reaction, such as salt contamination or suboptimal template purity. Each position should have a single, well-resolved peak; overlapping peaks (double peaks) at a single position suggest a heterogeneous template, which could result from a mixed parasite infection, PCR contamination, or primer binding issues [85].
- Evaluate the Baseline: The baseline is the signal level between peaks. A flat and low baseline signifies a clean sequencing reaction with minimal fluorescent background noise. A raised or noisy baseline can obscure true peaks and lead to base-calling errors, often resulting from unincorporated dyes or contaminants in the sample [85].
- Check for Dye Blobs: These are large, broad fluorescent artifacts, often occurring at specific positions in the run (e.g., near 100-200 bases). They can obscure the true sequence and are typically caused by problems with the sequencing chemistry or purification. The sequence data under a dye blob is generally considered unreliable [85].
- Assess Signal Decay: The signal intensity naturally decreases as the sequencing run progresses. However, a sharp or premature drop in signal can lead to unreadable sequence at the end of the read. This is often due to DNA secondary structures or limitations in the polymerase enzyme processivity.
Table 1: Troubleshooting Common Sanger Chromatogram Issues in Parasite Barcoding
| Problem | Potential Cause | Solution for Parasite Research |
|---|---|---|
| Double Peaks | Mixed template (co-infection), primer contamination | Re-sequence from original sample; use clonal PCR or NGS for confirmation. |
| Noisy/Raised Baseline | Unpurified PCR product, salt carryover | Re-purify the sequencing template using ExoSAP-IT or column purification [86]. |
| Dye Blobs | Issues with sequencing kit chemistry | Ensure fresh reagents and proper protocol; the data may need to be trimmed. |
| Rapid Signal Decay | High GC-content in parasite DNA, secondary structures | Use a specialized polymerase or a PCR additive like DMSO; sequence from both ends. |
Application in Parasite Barcoding
In parasite barcoding, a clean chromatogram is the first line of defense against misidentification. For example, distinguishing between pathogenic Entamoeba histolytica and benign E. dispar requires a high-fidelity sequence, as they are morphologically identical. A chromatogram with double peaks might indicate a mixed infection, necessitating cloning or NGS for resolution. Sanger sequencing remains the gold standard for validating single-gene variants discovered by NGS due to its high per-base accuracy of ~99.99% [17] [26].
NGS Read Quality Metrics and Control
The NGS Quality Control Workflow
NGS quality control is a multi-step, computational process designed to handle the millions to billions of short reads generated per run. The primary raw data output from Illumina and similar platforms is in FASTQ format. This file format contains both the nucleotide sequence for each read and a corresponding quality score for every single base [87].
Key NGS Quality Metrics
Understanding the core metrics is essential for evaluating dataset health.
- Q-score (Phred Score): This is the most critical metric. It predicts the probability of an incorrect base call. A Q-score is calculated as
Q = -10 log10(P), where P is the estimated error probability. A Q-score of 30 (Q30) is a standard benchmark, indicating a 1 in 1000 chance of an error, or 99.9% base call accuracy. A score of 20 (Q20) indicates 99% accuracy [87]. - Per Base Sequence Quality: This metric, often visualized in FastQC reports, shows how quality scores change across all positions in the read. Typically, quality is highest at the start of a read and degrades towards the 3' end. Any abnormal dips in quality at specific cycles can indicate technical issues during the sequencing run [87].
- Adapter Content: During library preparation, adapter sequences are ligated to DNA fragments. If the DNA fragment is shorter than the read length, the sequencer will also read the adapter sequence. High adapter content leads to wasted sequencing effort and must be identified and trimmed [87].
- GC Content: The distribution of GC content across reads should form a normal distribution centered on the expected GC% for the organism. Sharp deviations or bimodal distributions can indicate contamination or PCR bias [87].
Table 2: Essential NGS Quality Metrics and Their Interpretation
| Metric | Target Value/Range | Implication of Deviation |
|---|---|---|
| Q-score | > Q30 (99.9% accuracy) | Higher error rate; more false positives in variant calling. |
| % Bases > Q30 | > 80% for the run | Overall run quality is suboptimal. |
| % Duplicates | Varies by application | High duplication can indicate low library complexity or PCR over-amplification. |
| Adapter Content | < 1-5% | Significant data loss; requires aggressive trimming. |
| GC Content | Matches organism's expected % | Suggests contamination or technical artifacts. |
The NGS Data Cleaning Protocol
Raw NGS data is rarely perfect and requires preprocessing before biological analysis. This is a standard protocol for read cleaning and QC.
- Initial Quality Assessment: Run raw FASTQ files through a quality control tool like FastQC to generate a summary report of all key metrics [87].
- Adapter Trimming and Quality Filtering: Use tools like CutAdapt or Trimmomatic to perform the following:
- Remove adapter sequences.
- Trim low-quality bases from the 3' and/or 5' ends of reads (e.g., bases with Q < 20).
- Discard entire reads that fall below a minimum length threshold (e.g., < 50 bp) after trimming [87].
- Post-Cleaning Quality Assessment: Re-run FastQC on the trimmed and filtered FASTQ files to confirm that data quality has been improved (e.g., per-base quality is elevated and adapter content is minimized) [87].
Comparative Workflows: Sanger vs. NGS for Parasite Barcoding
The following diagrams and workflow illustrate the distinct data quality control pathways for Sanger and NGS in the context of parasite barcoding research.
The Scientist's Toolkit: Research Reagent Solutions
Table 3: Essential Reagents and Tools for Sequencing and Quality Control
| Item | Function/Application | Example in Parasite Barcoding |
|---|---|---|
| Zymo Quick-DNA Fecal/Soil Microbe Mini Prep Kit | DNA extraction from complex samples like feces, where parasite material is present. | Standardized DNA extraction from human or animal stool samples for parasite detection [86]. |
| Qiagen Blood & Tissue Kit | DNA extraction from specific parasite tissues or samples with hard cuticles. | Extraction of DNA from helminth specimens obtained from necropsy [86]. |
| ExoSAP-IT | Enzymatic purification of PCR products to remove primers and dNTPs before Sanger sequencing. | Cleaning PCR amplicons of parasite barcode genes (e.g., 18S V4, CO1) to ensure clean chromatograms [86]. |
| Illumina Nextera XT DNA Library Prep Kit | Preparation of sequencing libraries for Illumina NGS platforms. | Preparing multiplexed, barcoded libraries from PCR amplicons for metabarcoding studies of parasite communities [86]. |
| FastQC Software | Quality control check of raw NGS sequence data. | Initial assessment of read quality from a parasite metabarcoding run [87]. |
| CutAdapt / Trimmomatic | Trimming of adapter sequences and low-quality bases from NGS reads. | Cleaning and filtering raw reads from a parasite amplicon sequencing project prior to taxonomic assignment [87]. |
Robust data quality control is the non-negotiable foundation of reliable parasite DNA barcoding research. The choice between Sanger sequencing and NGS dictates a fundamentally different approach to QC. Sanger requires a meticulous, manual focus on individual chromatogram characteristics, while NGS demands computational proficiency in assessing population-level metrics across millions of reads. For focused studies of single parasites or amplicon validation, Sanger's simplicity and high accuracy are paramount. For characterizing complex parasitic communities, detecting low-abundance co-infections, or discovering novel parasites, NGS—despite its more complex QC pipeline—is indispensable. Mastering both sets of quality control protocols empowers researchers to accurately decipher the genetic identity of parasites, thereby advancing our understanding of parasite biology, ecology, and the development of new therapeutic agents.
In parasite DNA barcoding research, the choice between Sanger sequencing and Next-Generation Sequencing (NGS) represents a significant economic and methodological crossroads. Traditional Sanger sequencing, long considered the gold standard for accuracy, is often preferred for sequencing single genes or amplicon targets up to 100 base pairs [88]. However, its cost structure becomes prohibitive for larger-scale projects, with estimates around $500 per 1000 bases [88]. In contrast, NGS offers a dramatically lower cost per base—less than $0.50 per 1000 bases—making it economically advantageous for projects requiring high throughput [88]. This economic disparity has driven the development of cost-reduction strategies centered on multiplexing and efficient panel design, allowing researchers to maximize data yield while minimizing expenses.
For parasite barcoding studies, which often involve processing numerous samples across multiple species or geographical locations, the economic implications of sequencing strategy choices are substantial. A survey of freshwater bioassessment efforts in the United States revealed that traditional morphology-based taxonomy accounts for approximately 30% of total bioassessment costs [89]. While DNA barcoding using Sanger sequencing was initially found to be 1.7 to 3.4 times more expensive than traditional morphological approaches, NGS methods have become comparable or slightly less expensive [89]. This shift underscores the critical importance of strategic implementation of multiplexing and panel design for sustainable research programs in parasitology and microbial ecology.
Multiplexing Fundamentals and Economic Impact
Core Principles of Sample Multiplexing
Multiplex sequencing represents a powerful strategy for processing large numbers of libraries simultaneously during a single sequencing run [90]. The fundamental principle involves labeling individual DNA fragments with unique "barcode" sequences (also called indexes) during library preparation, enabling subsequent identification and computational sorting of reads before final data analysis [90]. This approach allows researchers to pool samples exponentially, increasing the number of samples analyzed in a single run without proportionally increasing cost or time [90].
The economic advantage of multiplexing stems from better utilization of sequencing capacity. Modern sequencing platforms generate more data than most individual samples require [91]. Without multiplexing, this excess capacity is wasted. By enabling multiple samples to share sequencing resources, multiplexing effectively divides sequencing expenses across multiple samples, dramatically reducing per-sample costs [91]. Additionally, processing samples in parallel increases workflow efficiency and minimizes batch effects, improving experimental reproducibility [91].
Barcoding Strategies and Index Selection
Two primary indexing strategies dominate multiplexing workflows: single indexing and dual indexing. Single indexing uses one barcode sequence per sample and is recommended when short run times are critical, as only the i7 index needs to be read [92]. Dual indexing incorporates two separate barcode sequences (i5 and i7) for each sample and provides enhanced protection for data integrity by minimizing the effects of index-hopping events [92]. For Illumina systems, combinatorial dual (CD) indexes are available for single-indexed workflows, while unique dual (UD) indexes are used for dual-indexed approaches [92].
The process of implementing an effective multiplexing workflow involves several critical steps. First, during library preparation, each sample is tagged with a unique barcode sequence through ligation or PCR incorporation [91]. These barcoded libraries are then pooled into a single mixture, which is loaded onto the sequencer [91]. During sequencing, both the barcode and the target DNA fragments are read [91]. Finally, during demultiplexing, bioinformatic tools identify the barcodes associated with each read and assign them back to the appropriate samples [91].
Table 1: Comparison of Multiplexing Indexing Strategies
| Index Type | Number of Barcodes | Advantages | Limitations | Ideal Use Cases |
|---|---|---|---|---|
| Single Indexing | One barcode (i7) per sample | Faster sequencing cycles; simpler library prep | Higher risk of index hopping; lower sample multiplexing capacity | Projects with limited sample numbers; rapid turnaround requirements |
| Dual Indexing | Two barcodes (i5 + i7) per sample | Enhanced sample multiplexing capacity; reduced index hopping | Longer sequencing cycles; more complex library prep | Large-scale studies; samples requiring high data integrity |
Economic Analysis of Multiplexing Approaches
The economic benefit of multiplexing can be quantified through per-sample cost reduction. For NGS approaches, pooling multiple samples in a single run distributes fixed run costs (reagents, instrument usage, personnel time) across all samples in the pool [90]. The increased throughput of NGS systems makes multiplexing particularly appealing for reducing per-sample sequencing costs [92]. For example, a typical Illumina sequencing run that might cost $2,000 in reagents and consumables would incur a per-sample cost of $200 for 10 samples, but only $20 per sample for 100 samples—a tenfold reduction.
For Sanger sequencing, multiplexing opportunities are more limited due to the technology's inherent design. However, cost efficiencies can still be achieved through batch processing of samples and efficient primer management. Sanger sequencing remains economically competitive for small-scale projects, with one study noting that "Sanger sequencing is still the core technology in many laboratories and research projects because of its unique advantages in single-fragment high-precision sequencing" [93]. The method is particularly cost-effective for verification of cloned products, mutation detection, and genotype confirmation where only a limited number of targets need to be analyzed [93].
Efficient NGS Panel Design Strategies
Foundational Principles of Targeted Sequencing Panels
Custom targeted NGS panels represent a powerful approach for focusing sequencing resources on genomic regions of highest interest, particularly for parasite barcoding applications. These panels examine clinically relevant genes or genomic regions, allowing rapid, cost-effective investigation of genomic abnormalities linked to specific organisms or disease processes [94]. The fundamental advantage of customized panels lies in their ability to achieve higher depth of coverage for targeted regions, enabling a lower threshold for detecting intratumoral heterogeneity and low-frequency variant allele changes [94].
The design process for NGS panels requires careful consideration of multiple factors. The American College of Medical Genetics and Genomics (ACMG) has established technical standards for diagnostic gene sequencing panels, emphasizing the impact of gene panel content on clinical sensitivity, specificity, and validity [95]. These standards address technical considerations such as sequencing limitations, presence of pseudogenes/gene families, transcript choice, and detection of copy-number variants [95]. While developed for clinical applications, these principles are equally relevant to parasite barcoding research.
Practical Framework for Panel Optimization
Effective panel design begins with strategic definition of target regions. The Nonacus Panel Design Tool exemplifies modern approaches, allowing researchers to input regions of interest using Browser Extensible Data (BED) files, gene lists, or a combination of both [96]. When designing panels for parasite barcoding, selection should focus on established barcode regions with proven discriminatory power, such as cytochrome c oxidase I (COI) for metazoans, while also considering emerging genetic markers that may provide additional resolution.
Tiling strategy significantly impacts panel performance and cost. Tiling refers to the number of probes covering each base within target regions [96]. A 1x tiling strategy covers each genomic base with one probe aligned end-to-end, while 2x tiling creates staggered probes with 40-80 bp overlaps, covering each base with two probes [96]. Higher tiling densities (2x or more) can improve sequencing accuracy, particularly for middle regions of DNA, but increase probe costs [96]. Advanced tiling options (0.05x-20x) allow fine-tuning based on project requirements and budget constraints [96].
Table 2: NGS Panel Tiling Strategies and Performance Characteristics
| Tiling Density | Probe Coverage | Sequencing Accuracy Impact | Cost Implications | Recommended Applications |
|---|---|---|---|---|
| 1x Tiling | Each base covered by one probe; probes aligned end-to-end | Standard accuracy; potential gaps in complex regions | Lowest cost; minimal probes | Well-characterized targets; limited budget projects |
| 2x Tiling | 40-80 bp probe overlap; each base covered by two probes | Improved accuracy; redundancy for difficult regions | Moderate cost increase | Complex genomic regions; high-quality requirements |
| Advanced Tiling (0.05x-20x) | Customizable coverage based on specific needs | Precision targeting of challenging areas | Highly variable based on density | Specialized applications; mixed target complexity |
Handling repetitive regions presents particular challenges in panel design. Approximately 50% of the human genome contains repeated DNA bases, including short tandem repeats and longer interspersed repeats [96]. These sequences create challenges during NGS and variant detection. Sophisticated panel design tools use integrated algorithms to automatically mask highly repetitive regions, preventing over-sequencing that wastes resources or under-sequencing that decreases variant detection sensitivity [96]. For parasite barcoding, researchers can choose to unmask these regions using "gap fill" options when repetitive regions contain biologically relevant information [96].
Integrated Protocols for Parasite DNA Barcoding
NGS Multiplexing Protocol for Parasite Barcoding
Sample Preparation and DNA Extraction
- Begin with high-quality DNA extraction from parasite samples using protocols optimized for the specific specimen type (tissues, whole organisms, or environmental samples).
- Quantify DNA using fluorometric methods to ensure accurate concentration measurements.
- Assess DNA quality through agarose gel electrophoresis or microfluidic analysis to confirm high molecular weight and minimal degradation.
Library Preparation and Barcoding
- Prepare sequencing libraries using a kit compatible with your sequencing platform (e.g., Collibri Stranded RNA Library Prep Kits for Illumina Systems) [92].
- Incorporate unique dual indexes (UD) during library preparation to minimize index hopping [92]. For the Collibri system, use the Unique Dual (UD) index version for maximum data integrity [92].
- Use 2x tiling density for probe design to ensure complete coverage of target barcode regions [96].
- Purify libraries to remove unincorporated nucleotides and primers.
Pooling and Quantification
- Quantify finished libraries using qPCR for accurate measurement of amplifiable fragments.
- Normalize libraries to equal concentrations based on qPCR results.
- Pool normalized libraries in equimolar ratios. For large pools (>96 samples), validate pooling uniformity by sequencing a test pool and calculating the coefficient of variation (CV) [91].
Sequencing and Data Analysis
- Load pooled libraries onto the sequencing platform following manufacturer recommendations.
- Include sufficient PhiX control DNA (1-5%) to ensure sequence diversity for platform calibration.
- After sequencing, demultiplex reads using the appropriate sample sheet specifying i5 and i7 indexes [92].
- Process barcode sequences through the Barcode of Life Data Systems (BOLD) or comparable analysis pipelines for taxonomic assignment.
Sanger Sequencing Protocol for Parasite Barcoding
Primer Design and Optimization
- Design primers targeting specific barcode regions (e.g., COI for metazoans) with length of 18-25 bases [93].
- Calculate annealing temperature using the formula: Tm = 4×(G+C) + 2×(A+T) [93].
- Avoid complementary sequences at the 3' ends to prevent primer-dimer formation.
- Validate primer specificity in silico using primer-BLAST against relevant databases.
PCR Amplification and Purification
- Set up PCR reactions with 10-50 ng of template DNA [93].
- Use thermostable DNA polymerase with proofreading activity for high-fidelity amplification.
- Implement touchdown PCR protocols for difficult templates to improve specificity.
- Visualize PCR products on agarose gels to confirm single bands of expected size.
- Purify amplicons using enzymatic or column-based methods to remove primers, dNTPs, and enzymes [38].
Sequencing Reaction and Cleanup
- Set up sequencing reactions with 1-5 ng of purified PCR product per 100 bp of sequence [38].
- Maintain primer-to-template molar ratio between 3:1 and 10:1 [93].
- Use cycle sequencing parameters with 25-35 cycles [93].
- Purify sequencing reactions to remove unincorporated dye terminators.
Capillary Electrophoresis and Data Analysis
- Load purified sequencing reactions onto capillary electrophoresis instruments.
- Process raw data to trim low-quality regions (typically first 15-40 bases) [38].
- Assemble contigs and resolve ambiguous bases by comparing forward and reverse sequences.
- Perform taxonomic assignment through BOLD identification algorithms.
Comparative Analysis and Workflow Integration
Technical and Economic Comparison
The choice between Sanger sequencing and NGS for parasite barcoding involves trade-offs across multiple parameters. Sanger sequencing generates longer read lengths (up to 700-1000 bp) compared to many NGS platforms (typically 100-300 bp), which can be advantageous for certain barcoding applications [88] [38]. However, NGS offers massively parallel sequencing capability, enabling processing of hundreds to thousands of samples simultaneously through multiplexing [90].
From a cost perspective, NGS provides dramatically lower cost per base ($0.50 per 1000 bases compared to $500 per 1000 bases for Sanger) [88]. However, for small-scale projects, the infrastructure and reagent costs of NGS may make Sanger sequencing more economical. One study found that "Sanger sequencing is still a good choice when sequencing single genes, amplicon targets up to 100 base pairs, or 96 samples or less" [88].
Table 3: Comparative Analysis of Sanger Sequencing vs. NGS for DNA Barcoding
| Parameter | Sanger Sequencing | Next-Generation Sequencing |
|---|---|---|
| Cost per 1000 bases | ~$500 [88] | <$0.50 [88] |
| Read Length | 700-1000 bp [38] [88] | 100-300 bp (short-read); >10,000 bp (long-read) [88] |
| Samples per Run | 1-96 (without multiplexing) [88] | Hundreds to thousands (with multiplexing) [90] |
| Ideal Use Cases | Single gene verification; small sample numbers; confirmation sequencing [88] | Multigene analysis; population studies; novel variant discovery [88] |
| Multiplexing Capacity | Limited | Extensive (384+ with unique barcodes) [91] |
| Turnaround Time | Faster for small batches | Longer sequencing cycles but higher throughput |
Workflow Integration Strategies
For comprehensive parasite barcoding studies, a hybrid approach leveraging both Sanger and NGS technologies often provides optimal results. This integrated strategy uses each technology for its strengths: NGS for high-throughput screening and discovery, and Sanger for validation and troubleshooting. Specifically, researchers can employ NGS with customized panels for initial screening of large sample sets, followed by Sanger sequencing to confirm novel or unexpected variants [94].
The integration of customized NGS panels with multiplexing strategies creates particularly powerful efficiencies for parasite barcoding. These panels allow researchers to focus sequencing resources on established barcode regions while maintaining flexibility to include additional genomic targets of interest. As noted in NGS panel design guidance, "Customized NGS panels ranging from 20 to more than 500 genes enable users to reliably and rapidly identify the genetic aberrations most commonly associated with a specific cancer type" [94]—a principle equally applicable to parasite identification and classification.
The Scientist's Toolkit: Essential Research Reagents
Table 4: Essential Research Reagents for Multiplexed DNA Barcoding
| Reagent Category | Specific Examples | Function in Workflow | Technical Considerations |
|---|---|---|---|
| Library Preparation Kits | Collibri Stranded RNA Library Prep Kits [92] | Convert sample DNA/RNA into sequencing-ready libraries | Compatible with Illumina systems; enable single or dual indexing |
| Indexing Adapters | Unique Dual Indexes (UD) [92], SMRTbell adapter indexes [91] | Provide unique barcode sequences for sample multiplexing | UD indexes minimize index hopping; ensure barcode balance and diversity |
| DNA Polymerases | AmpliTaq DNA Polymerase [93] | Catalyze DNA amplification in PCR and sequencing reactions | Select proofreading enzymes for high-fidelity applications; optimize concentration |
| Nucleic Acid Purification Kits | Column-based, bead-based, or enzymatic purification systems [38] | Remove contaminants, enzymes, and unincorporated nucleotides | Critical for sequence quality; follow manufacturer recommendations for sample type |
| Quantification Reagents | Fluorometric dsDNA assays, qPCR quantification kits | Precisely measure DNA concentration and quality | Fluorometry for library quantification; qPCR for accurate molarity |
| Target Enrichment Probes | Custom-designed biotinylated oligonucleotides [96] | Capture specific genomic regions in panel-based sequencing | 120 bp length typical; optimize tiling density based on project needs |
Workflow Visualization
The strategic implementation of multiplexing and efficient panel design represents a paradigm shift in parasite DNA barcoding economics. While Sanger sequencing maintains relevance for specific applications with limited sample numbers, NGS with optimized multiplexing strategies offers unprecedented scalability and cost-efficiency for large-scale barcoding initiatives. The critical success factors include appropriate index selection to maintain data integrity, thoughtful panel design to maximize target coverage, and strategic tiling to balance cost with sequencing quality.
For research programs navigating the transition between Sanger and NGS approaches, a hybrid model that leverages the complementary strengths of both technologies often provides the most practical pathway. This approach allows verification of critical findings through orthogonal methods while capitalizing on the throughput advantages of modern sequencing platforms. As sequencing technologies continue to evolve, the principles of efficient resource utilization through strategic multiplexing and targeted design will remain essential for advancing parasite barcoding research in an economically sustainable framework.
Head-to-Head Comparison: Accuracy, Cost, and Throughput Analysis
The accurate identification of parasites is fundamental to diagnostic medicine, public health initiatives, and drug development research. For decades, Sanger sequencing has been the established gold standard for molecular confirmation due to its exceptional base-level accuracy [14] [10]. However, the rise of Next-Generation Sequencing (NGS) introduces powerful, high-throughput capabilities, raising critical questions about performance benchmarks in parasite DNA barcoding [97] [49]. This application note delineates the distinct roles of Sanger sequencing and ultra-deep NGS methodologies, providing a structured comparison of their accuracy, sensitivity, and optimal applications to guide researchers in selecting the most appropriate technology for their investigative goals.
Technology Comparison: Sanger Sequencing vs. Next-Generation Sequencing
The following table summarizes the core technical characteristics and performance metrics of Sanger sequencing and NGS in the context of DNA barcoding.
Table 1: Comparative Analysis of Sanger Sequencing and NGS for DNA Barcoding
| Feature | Sanger Sequencing | Next-Generation Sequencing (NGS) |
|---|---|---|
| Sequencing Principle | Chain-termination method with dideoxynucleotides (ddNTPs) [10] | Massive parallel sequencing (e.g., sequencing-by-synthesis, sequencing-by-ligation) [98] [14] |
| Typical Read Length | 500 - 1000 bp [14] [10] | 150 - 700 bp (platform-dependent) [98] [14] |
| Throughput | Low (one sequence per reaction) [10] | Very High (millions of sequences simultaneously) [14] |
| Base Accuracy | ~99.99% (Very High) [14] [10] | ~98.2% - 99.9% (Variable by platform) [98] |
| Error Rate | ~0.001% [98] | 0.1% - 1.78% (e.g., Illumina: ~0.26-0.8%, Ion Torrent: ~1.78%) [98] |
| Variant Detection Sensitivity | Low (~15-20% allele frequency) [14] | Very High (can detect down to ~1% or lower with sufficient depth) [14] [99] |
| Cost Efficiency | For low-target number (1-20 targets) [14] | For high-target number or high-sensitivity needs [14] |
| Ideal for Parasite Barcoding | Verification of specific clones or PCR products; single-species identification from pure samples [49] [53] | Detection of mixed infections/cryptic species; discovering novel parasites; analyzing complex communities [79] [97] [49] |
Experimental Protocols for Parasite DNA Barcoding
Protocol 1: Sanger Sequencing for Targeted Parasite Identification
This protocol is optimized for confirming the identity of a specific parasite from a pure sample or clone [10] [53].
- DNA Extraction: Isolate genomic DNA from a parasite sample (e.g., from cultured organisms, a single worm, or purified eggs) using a commercial kit (e.g., MagMAX DNA Multi-Sample Kit, Nucleospin Tissue Kit) [49] [53].
- PCR Amplification:
- Primers: Design or select primers targeting a standard barcode region (e.g., COI for metazoans, 18S rDNA for broad eukaryotes) [97] [49].
- Reaction: Set up a 25 µL PCR reaction containing template DNA, primers, dNTPs, reaction buffer, and DNA polymerase [49].
- Cycling Conditions: Typical cycling includes an initial denaturation (e.g., 94°C for 2 min), 35-40 cycles of denaturation, annealing (temperature specific to primers), and extension (72°C), followed by a final extension [49].
- PCR Product Purification: Clean the amplified product enzymatically or using magnetic beads (e.g., AMPure XP) to remove excess primers and dNTPs [49].
- Sanger Sequencing Reaction: The purified PCR product is sequenced using a dideoxy terminator cycle sequencing kit on an instrument like an ABI 3730xl [49]. The process involves:
- Denaturation of dsDNA into single strands.
- Primer Annealing with a sequence-specific primer.
- Cycle Sequencing with fluorescently labeled ddNTPs that terminate chain elongation.
- Capillary Electrophoresis to separate DNA fragments by size [10].
- Data Analysis: Base-calling software generates a chromatogram. The sequence is compared to reference databases (e.g., NCBI GenBank) using tools like BLAST for identification [53].
Protocol 2: NGS Metabarcoding for Complex Parasite Communities
This protocol, based on the VESPA framework, is designed for comprehensive profiling of eukaryotic endosymbionts, including parasites, from complex samples like feces or blood [79] [100].
- Sample Collection and DNA Extraction: Collect samples (e.g., fecal material, blood). For blood, use blocking primers (e.g., C3-spacer modified oligos or Peptide Nucleic Acids) during subsequent PCR to suppress overwhelming host DNA amplification [79]. Extract total DNA with a robust kit (e.g., innuPREP DNA Mini Kit) [53].
- Library Preparation - Amplicon Sequencing:
- Primer Selection: Use universal primers targeting a hypervariable region with high taxonomic resolution (e.g., 18S rDNA V4 region) [100].
- PCR with Barcoded Adapters: Amplify the target region using primers that include unique 8-10 bp barcode sequences (Multiplex Identifiers, MIDs) for each sample. This allows sample multiplexing [22] [49].
- Pooling and Clean-up: Purify amplicons (e.g., with AMPure XP beads), quantify, and create a single equimolar pool. Perform a final clean-up to remove adapter dimers [49].
- Sequencing: Load the pooled library onto an NGS platform (e.g., Illumina MiSeq with 2x250 bp chemistry) for massively parallel sequencing [49].
- Bioinformatic Analysis:
- Demultiplexing: Assign sequences to samples based on their unique barcodes.
- Quality Filtering & Clustering: Remove low-quality reads and cluster sequences into Operational Taxonomic Units (OTUs) or Amplicon Sequence Variants (ASVs).
- Taxonomic Assignment: Compare representative sequences to curated databases (e.g., SILVA, NCBI nt) using classifiers like a naive Bayesian classifier or BLAST to identify parasite species [79] [100].
The Scientist's Toolkit: Essential Reagents and Materials
Successful implementation of parasite barcoding workflows requires specific reagents and tools. The following table details key solutions for both Sanger and NGS protocols.
Table 2: Essential Research Reagent Solutions for Parasite DNA Barcoding
| Reagent/Material | Function | Example Kits/Products |
|---|---|---|
| High-Fidelity DNA Polymerase | Reduces PCR-introduced errors during amplification of barcode regions, critical for both Sanger and NGS. | Platinum Taq DNA Polymerase [49], Phusion High-Fidelity DNA Polymerase |
| Magnetic Bead Clean-up Kits | Purifies PCR products by removing enzymes, salts, and unused primers; essential for preparing sequencing libraries. | AMPure XP Beads [49], MagMAX DNA Multi-Sample Kit [49] |
| Blocking Primers | Suppresses amplification of non-target DNA (e.g., host 18S rDNA in blood samples), enriching for parasite sequences in NGS. | C3-spacer modified oligonucleotides, Peptide Nucleic Acid (PNA) clamps [79] |
| DNA Standards & Controls | Validates sensitivity and specificity of sequencing assays; crucial for NGS where background errors are higher. | Commercial myeloid DNA standards [99], Engineered mock communities [100] [99] |
| Barcoded Adapter Primers | Enables multiplexing of hundreds of samples in a single NGS run by tagging each sample with a unique DNA barcode. | Illumina P5/P7 adapters with unique 8-10 bp MIDs [22] [49] |
Sanger sequencing and NGS are not mutually exclusive but are complementary technologies in the parasite researcher's arsenal. Sanger remains the unmatched choice for high-accuracy verification of a limited number of targets. In contrast, NGS metabarcoding provides unparalleled sensitivity and discovery power for detecting mixed infections, cryptic species, and low-abundance parasites within complex communities. The choice between them should be driven by the specific research question, with Sanger for confirmation and NGS for comprehensive community profiling and discovery. As NGS technologies continue to evolve and costs decrease, they are poised to become the new standard for complex diagnostic and research applications, though Sanger sequencing will retain its critical role in validation.
Within parasitology and drug development research, the accurate identification of species through DNA barcoding is a critical foundational step. The choice of sequencing technology—traditional Sanger sequencing or next-generation sequencing (NGS)—carries significant economic and practical implications for project planning and execution. This application note provides a detailed per-sample and per-project economic analysis to guide researchers in selecting the most cost-effective sequencing strategy for their specific parasite DNA barcoding goals. The decision framework extends beyond mere sequencing costs to encompass factors such as throughput, multiplexing capabilities, and the required bioinformatics infrastructure, providing a holistic tool for strategic planning.
Technical and Cost Comparison: Sanger Sequencing vs. NGS
The economic viability of Sanger sequencing versus NGS is not absolute but is determined by the project's scale and scope. The following tables summarize the key quantitative and qualitative differentiators.
Table 1: Quantitative Cost and Technical Comparison for DNA Barcoding
| Feature | Sanger Sequencing | Next-Generation Sequencing (NGS) |
|---|---|---|
| Cost per 1,000 bases | ~$500 USD [101] | ~$0.50 USD [101] |
| Cost for a human genome | ~$1.5 million USD [101] | ~$100 - $500 USD [29] |
| Typical Read Length | 500 - 1,000 bp [26] [8] | 50 - 300 bp (Illumina) [26]; 15,000 - 20,000 bp (PacBio) [26] [29] |
| Throughput per Run | Single DNA fragment per reaction [26] | Millions to billions of fragments simultaneously [8] |
| Detection Limit for Variants | ~15-20% of sequences [26] | As low as 1% of sequences (Illumina) [26] |
| Multiplexing Capability | Low [8] | Extremely High (Hundreds of samples) [102] [8] |
Table 2: Qualitative and Infrastructure Considerations
| Consideration | Sanger Sequencing | Next-Generation Sequencing (NGS) |
|---|---|---|
| Best-Suited Projects | Single-gene targets, small sample numbers, validation of known variants [26] [8] | Whole genomes, targeted gene panels, multiplexed amplicon sequencing, metagenomics [49] [102] [8] |
| Data Analysis Complexity | Low; requires basic sequence alignment software [8] | High; requires sophisticated pipelines for read alignment, variant calling, and data storage [8] |
| Instrument Cost | Lower initial capital investment [26] [8] | High initial capital and reagent cost per run [8] |
| Speed for Large Projects | Slow; labor-intensive for large numbers of reactions [89] [8] | Fast; high-throughput data generation for many samples in parallel [89] [8] |
Experimental Protocols for Parasite DNA Barcoding
The following protocols are adapted from published methodologies for DNA barcoding of arthropods, including mosquitoes, which serve as a relevant model for parasite research [49] [102] [53].
Protocol A: Sanger Sequencing for Single-Specimen Barcoding
This protocol is designed for generating barcode sequences from individual parasite specimens, ideal for validating specific identifications or processing a small number of samples [49].
- Specimen Collection and DNA Extraction:
- PCR Amplification:
- Prepare a 25-50 µL PCR reaction containing:
- Amplify the target barcode region (e.g., COI, ITS2) using a thermocycler with a "touchdown" protocol: initial denaturation at 95°C for 2-5 min; 16 cycles of 95°C for 10-30 s, 62°C for 30-45 s (-1°C per cycle), 72°C for 45-60 s; followed by 20-30 cycles of 95°C for 10-30 s, 46-51°C for 30-45 s, and 72°C for 60 s; with a final extension at 72°C for 1-10 min [49] [45].
- PCR Product Purification:
- Verify successful amplification by running the PCR product on a 2% agarose gel.
- Purify the amplicon using enzymatic clean-up or magnetic beads to remove residual primers and dNTPs [49].
- Sanger Sequencing and Analysis:
- Submit the purified PCR product for sequencing in the forward direction using one of the PCR primers.
- Manually assess chromatograms for quality and heterozygous bases. Quality-trim sequences and align them using ClustalW. Calculate sequence divergence and perform phylogenetic analysis with tools like MEGA [49].
Protocol B: NGS Amplicon Sequencing for Multispecimen Barcoding
This high-throughput protocol enables the simultaneous generation of multilocus barcode data from hundreds of parasite specimens by leveraging multiplexing and NGS, dramatically reducing per-sample cost and effort [49] [102].
- Specimen Pooling and Bulk DNA Extraction:
- Presort and morphotype parasite specimens. Pool 4-10 specimens belonging to different taxa into a single tube [102].
- Perform a bulk DNA extraction on the pool of specimens using a kit designed for tissue lysis. Include a mechanical disruption step using a bead beater to ensure complete homogenization [102].
- Multiplex PCR with Inline Barcodes:
- Perform the first round of PCR to amplify the target barcode region(s). Use locus-specific primers that have been modified with a 6-8 bp inline barcode on the 5'-end. This allows multiple pooled samples to be amplified in the same PCR reaction, with the inline barcode identifying the source pool [102].
- Use a multiplex PCR kit and run 25 cycles according to the manufacturer's protocol [102].
- Library Preparation and Indexing:
- Clean the primary PCR products with magnetic beads to remove residual primers.
- In a second, limited-cycle (e.g., 18 cycles) PCR, add universal Illumina adapter sequences and unique 8-10 bp dual indices (i.e., unique combinations of i5 and i7 indexes) to each pool's amplicons. This step enables the simultaneous sequencing of hundreds of pools in a single NGS run [49] [102].
- High-Throughput Sequencing and Bioinformatic Analysis:
- Quantify the final pooled library and sequence on an Illumina MiSeq or similar platform with 2 x 250 bp chemistry [49] [102].
- Bioinformatics Pipeline:
- Demultiplex sequences based on their dual indices and assign reads to their respective specimen pools using the inline barcodes [102].
- Perform quality filtering, dereplication, and cluster sequences by genetic distance within each pool to distinguish true barcode sequences from contaminants and PCR errors [45].
- The highest-frequency unique sequence within a cluster is typically selected as the "true" barcode for that specimen in the pool [45].
Workflow Visualization and Decision Pathway
The following diagram illustrates the key procedural steps for the two main protocols and provides a logical framework for selecting the appropriate methodology.
Diagram: Sequencing Workflow Selection and Process.
The Scientist's Toolkit: Essential Research Reagent Solutions
Table 3: Key Reagents and Materials for DNA Barcoding Experiments
| Item | Function in Protocol | Example Use Case |
|---|---|---|
| Universal COI/ITS2 Primers | Amplifies the standardized DNA barcode region from specimen DNA [49] [45]. | Primary PCR for generating the target amplicon for sequencing. |
| Multiplex PCR Kit | Allows for simultaneous amplification of multiple targets or from multiple pooled samples in a single reaction [102]. | Generating multilocus barcode data or processing many specimen pools efficiently. |
| Magnetic Beads (AMPure XP) | Purifies PCR products by removing primers, dNTPs, and other contaminants [49] [102]. | Clean-up post-PCR and post-ligation for NGS library preparation. |
| Indexed Adapter Primers | Adds unique molecular barcodes (indices) to amplicons from each sample, enabling sample multiplexing in a single NGS run [49] [102]. | Library preparation for NGS, allowing hundreds of samples to be pooled and sequenced together. |
| DNA Extraction Kit (Bead-Based) | Isolates genomic DNA from tissue samples; mechanical beating with beads ensures thorough lysis [49] [102]. | Preparing high-quality DNA from single or pooled parasite specimens for PCR. |
This application note provides a detailed comparison of turnaround times for Sanger sequencing versus Next-Generation Sequencing (NGS) technologies within parasite DNA barcoding research. For researchers requiring rapid results for a limited number of targets, Sanger sequencing offers a proven solution with typical turnaround times of 24-48 hours for sequencing operations once samples are prepared [103]. However, for comprehensive parasite detection, mixed infection identification, or novel pathogen discovery, targeted NGS approaches—particularly using portable nanopore technology—can provide broader data within 24-72 hours while eliminating the need for separate validation steps [104] [41].
The critical determinant in platform selection extends beyond sequencing runtime to include sample preparation complexity, data analysis requirements, and the specific research question. This document provides detailed protocols and comparative data to guide researchers in selecting the optimal approach for their parasite barcoding applications.
Parasite DNA barcoding relies on sequencing specific genetic regions to identify and differentiate species. The 18S ribosomal RNA gene serves as a primary barcode for eukaryotic parasites [104], while the mitochondrial cytochrome c oxidase subunit I (mtCOI) gene is another common target [53]. The choice between Sanger and NGS technologies significantly impacts workflow efficiency, data completeness, and ultimately, research outcomes.
Sanger sequencing employs the dideoxy chain termination method to sequence single DNA fragments, making it ideal for targeted analysis of specific regions [16]. In contrast, NGS technologies like Illumina and Oxford Nanopore enable massively parallel sequencing of millions of fragments simultaneously [16] [41]. This fundamental difference in approach creates distinct workflow patterns and turnaround time profiles that researchers must consider when designing parasite barcoding studies.
Quantitative Turnaround Time Comparison
The following tables summarize key performance metrics and process timing for Sanger versus NGS approaches in parasite DNA barcoding research.
Table 1: Overall Technology Comparison for Parasite DNA Barcoding
| Parameter | Sanger Sequencing | Targeted NGS (Nanopore) | NGS (Illumina) |
|---|---|---|---|
| Sequencing Principle | Dideoxy chain termination [41] | Nanopore sequencing [41] | Massively parallel sequencing [16] |
| Theoretical Sensitivity | 15-20% [16] [41] | <1% [41] | 1% [16] [41] |
| Key Applications | Single species/single gene [53] | Mixed infections, novel pathogen discovery [104] | High-throughput screening, rare variants [16] |
| Multiplexing Capability | Limited [53] | High [104] | High [16] |
| Mixed Infection Detection | Not possible in single run [53] | Excellent [104] | Excellent [67] |
Table 2: Turnaround Time Breakdown by Process Stage
| Process Stage | Sanger Sequencing | Targeted NGS (Nanopore) | Notes |
|---|---|---|---|
| Sample Preparation | 4-8 hours | 4-8 hours | Similar for both methods [104] |
| Library Preparation | Not applicable | 2-4 hours | Additional step required for NGS [104] |
| Sequencing Run | 20 min - 3 hours [41] | 1-48 hours [41] | Nanopore offers real-time data availability [41] |
| Data Analysis | 1-2 hours | 2-6 hours | NGS requires more complex bioinformatics [104] |
| Validation | Often required for NGS findings [12] | Self-validating through coverage | NGS validation rate: ~99.97% [12] |
| Total Hands-On Time | Low | Moderate | |
| Total Project Duration | 3-4 days [41] | 2-3 days [41] | Can be <24 hours for urgent nanopore cases [41] |
Workflow Visualization
The following diagram illustrates the comparative workflows and decision points for Sanger versus NGS approaches in parasite DNA barcoding research:
Figure 1: Comparative workflow for parasite DNA barcoding using Sanger versus targeted NGS approaches. Decision points emphasize project objectives as the primary selection criteria.
Detailed Experimental Protocols
Sanger Sequencing Protocol for Parasite DNA Barcoding
This protocol outlines the mtCOI gene barcoding approach for mosquito identification, adaptable to other parasite systems [53].
Materials & Reagents:
- DNA extraction kit (e.g., innuPREP DNA Mini Kit)
- PCR reagents: primers, dNTPs, DNA polymerase
- Agarose gel electrophoresis equipment
- Sanger sequencing reagents (BigDye terminator chemistry)
- Capillary sequencer (e.g., ABI 3730XL)
Procedure:
- DNA Extraction: Isolate genomic DNA from parasite samples (blood, stool, vectors) using recommended protocols. Quantify DNA using fluorometric methods for accuracy [103].
- PCR Amplification:
- Prepare 25μL reaction containing: 1X PCR buffer, 2.5mM MgCl₂, 0.2mM dNTPs, 0.4μM forward and reverse primers, 1U DNA polymerase, and 50-100ng template DNA.
- Use mtCOI primers: LCO1490 (5'-GGTCAACAAATCATAAAGATATTGG-3') and HCO2198 (5'-TAAACTTCAGGGTGACCAAAAAATCA-3').
- Cycling conditions: 94°C for 3 min; 35 cycles of 94°C for 30s, 48°C for 40s, 72°C for 1 min; final extension at 72°C for 5 min.
- PCR Product Purification: Clean amplicons using exonuclease I and shrimp alkaline phosphatase or commercial cleanup kits.
- Sanger Sequencing:
- Set up sequencing reactions with BigDye Terminator v3.1 Cycle Sequencing Kit.
- Use 5-10ng PCR product per 100bp and 3.2pmol primer per reaction.
- Cycling conditions: 96°C for 1 min; 25 cycles of 96°C for 10s, 50°C for 5s, 60°C for 4 min.
- Purification and Electrophoresis: Remove unincorporated dyes and resolve sequences on capillary sequencer.
- Data Analysis:
- Assemble forward and reverse sequences.
- Perform BLAST analysis against NCBI GenBank or specialized parasite databases.
- Confirm species identification based on ≥97% sequence similarity to reference specimens.
Targeted NGS Protocol for Comprehensive Parasite Detection
This protocol uses 18S rDNA amplification with host blocking primers for sensitive parasite detection in blood samples, adapted from [104].
Materials & Reagents:
- Host blocking primers: C3 spacer-modified oligo and PNA oligo
- Long-range DNA polymerase for >1kb amplicons
- Oxford Nanopore MinION device and flow cells
- Library preparation kit (e.g., SQK-LSK114)
- Bioinformatic tools: BLAST, RDP classifier, custom scripts
Procedure:
- DNA Extraction with Host Depletion:
- Extract total DNA from blood samples using standard methods.
- Optional: Implement host DNA depletion strategies if parasite load is low.
- PCR with Host Blocking:
- Prepare 50μL reaction containing: 1X buffer, 0.3mM dNTPs, 2.5mM MgSO₄, 0.4μM each primer, 0.5μM PNA blocker, 1.0μM C3-spacer blocker, 1U polymerase, and 100ng DNA.
- Use 18S rDNA primers: F566 (5'-CAGCAGCCGCGGTAATTCC-3') and R1776 (5'-TACRGMWACCTTGTTACGAC-3').
- Add PNA blocker (5'-CCCCGCCCCTTGCCTC-3') to inhibit human 18S amplification.
- Cycling conditions: 94°C for 2 min; 35 cycles of 94°C for 30s, 68°C for 45s, 72°C for 2 min; final extension at 72°C for 10 min.
- Library Preparation:
- Repair DNA ends and phosphorylate 5' ends.
- Ligate sequencing adapters according to nanopore protocol.
- Purify library using AMPure XP beads.
- Sequencing:
- Load library onto MinION flow cell (FLO-MIN114).
- Run sequencing for 1-24 hours using MinKNOW software.
- Base calling performed in real-time or post-run.
- Bioinformatic Analysis:
- Demultiplex samples if pooled.
- Quality filter reads (Q-score >7).
- Cluster sequences and remove operational taxonomic units (OTUs).
- BLAST comparison against curated parasite database.
- Assign species based on ≥97% identity and generate abundance reports.
The Scientist's Toolkit: Essential Research Reagents
Table 3: Key Research Reagents for Parasite DNA Barcoding
| Reagent Category | Specific Examples | Function & Application |
|---|---|---|
| Universal Primers | 18S rDNA (V4-V9): F566/R1776 [104] | Amplifies broad-range eukaryotic sequences for comprehensive parasite detection |
| Host Blocking Oligos | PNAHs733F, 3SpC3Hs1829R [104] | Suppresses host (mammalian) DNA amplification to enrich parasite signals |
| Barcoding Regions | mtCOI, 18S rDNA V4-V9, V9 [104] [53] | Standardized genetic markers for species identification and differentiation |
| Library Prep Kits | Oxford Nanopore Ligation kits [41] | Prepares DNA fragments for sequencing with platform-specific adapters |
| Positive Controls | Plasmodium falciparum, Trypanosoma brucei DNA [104] | Validates assay performance and establishes detection limits |
| Bioinformatic Tools | BLAST, RDP classifier, MinKNOW [104] [41] | Processes sequence data, assigns taxonomic classifications |
Critical Implementation Considerations
Sensitivity and Detection Limitations
Sanger sequencing demonstrates limited sensitivity (15-20% variant allele frequency), restricting detection to dominant parasite species in mixed infections [16] [41]. In contrast, targeted NGS achieves sensitivities below 1%, enabling identification of minor parasite populations and low-level infections [104] [41]. For parasite surveillance, this enhanced sensitivity translates to improved detection of emerging threats and more accurate characterization of parasite diversity within hosts.
Data Interpretation and Analysis Complexity
Sanger sequencing generates straightforward electrophoretograms that researchers can interpret with basic bioinformatic skills. NGS data, however, requires specialized computational approaches for demultiplexing, quality filtering, and taxonomic assignment [104]. The bioinformatic pipeline significantly impacts turnaround time, particularly for laboratories without established computational infrastructure. For nanopore sequencing, real-time base calling enables preliminary data assessment during sequencing runs, potentially accelerating the analysis phase [41].
Validation Requirements and Quality Assurance
Traditional approaches require Sanger validation of NGS findings, but recent evidence questions this practice. Large-scale studies demonstrate NGS validation rates of 99.97%, suggesting that Sanger confirmation has limited utility [12]. For diagnostic applications, internal controls and replicate testing provide more efficient quality assurance than orthogonal validation. The self-validating nature of NGS through deep coverage reduces the need for confirmatory testing, potentially shortening overall project timelines [12].
Turnaround time from sample collection to result interpretation represents just one factor in selecting sequencing approaches for parasite DNA barcoding. While Sanger sequencing offers rapid results for focused questions, targeted NGS provides comprehensive data with similar overall turnaround times, eliminating the need for separate validation steps. Researchers should select technologies based on their specific detection sensitivity requirements, need for multiplexing capability, and infrastructure for data analysis. As NGS technologies continue to evolve toward simpler workflows and faster runtimes, they offer increasingly attractive options for comprehensive parasite identification and discovery.
The transition from Sanger Sequencing (SgS) to Next-Generation Sequencing (NGS) represents a paradigm shift in parasite DNA barcoding and genotyping. While Sanger sequencing has been the gold standard for decades, its inability to reliably detect mixed infections and low-frequency variants has led to a significant underestimation of allelic diversity and parasite population complexity [105]. This application note demonstrates, through specific case studies on Cryptosporidium and Giardia, how the massively parallel, high-depth capabilities of NGS uncover a hidden layer of heterogeneity—including mixed subtype infections and intra-assemblage variations—that is routinely missed by Sanger methods [105] [59]. This newly revealed diversity has profound implications for understanding parasite epidemiology, transmission dynamics, and the true genetic complexity of infections.
In the context of a broader thesis comparing Sanger sequencing versus NGS for parasite research, it is crucial to understand the inherent constraints of traditional methods. Sanger sequencing operates on a bulk PCR product, generating a single, consensus sequence from all amplified DNA templates [22]. This approach is fundamentally limiting when analyzing complex biological samples because [105] [59]:
- Inability to Resolve Mixtures: It cannot resolve mixtures of different alleles or subtypes (mixed infections) unless the minor variant is present at a significant proportion (typically >15-20%) [16] [105].
- Sequence Ambiguity: Co-amplification of multiple variants can lead to ambiguous sequencing chromatograms, often resulting in failed sequencing attempts or misinterpretation of data [22].
- Limited Throughput: The low-throughput, single-fragment nature of Sanger sequencing makes it impractical for large-scale, deep surveillance studies [16] [28].
These limitations have directly impacted epidemiological studies of parasites like Cryptosporidium hominis, C. parvum, and Giardia duodenalis, where the prevalence of mixed-strain infections and their associated clinical implications are likely vastly underreported [105] [59].
Quantitative Data Comparison: NGS vs. Sanger
Table 1: Comparative Performance of Sanger Sequencing and NGS in Detecting Parasite Diversity
| Performance Metric | Sanger Sequencing | Next-Generation Sequencing | Experimental Context & Citation |
|---|---|---|---|
| Detection of Mixed Infections | Limited or failed detection; requires cloning [105] | High-resolution detection; identified 100% of spiked mixtures down to 0.1% minority subtype [105] | Cryptosporidium gp60 subtyping; artificial mixtures [105] |
| Sensitivity for Minority Variants | Low sensitivity; limit of detection ~15–20% [16] | High sensitivity; can detect variants at frequencies as low as 1% with sufficient depth [16] [105] | General variant detection theory and Cryptosporidium validation [16] [105] |
| Typing Unambiguity | High rate of ambiguous genotype assignments [106] | 53-58.2% of calls were unambiguous in HLA genotyping [106] | HLA genotyping study (11 loci) as a model for complex diploid systems [106] |
| Concordance with Orthogonal Methods | Used as the gold standard for validation | 98.7% - 100% concordance with Sanger for high-quality variants [107] [106] | Cryptosporidium subtyping and HLA genotyping [105] [106] |
| Throughput | Low; one fragment per reaction [16] [28] | High; millions of fragments sequenced in parallel per run [16] [28] | General technology comparison [16] [28] |
Table 2: Impact of NGS on Revealing True Parasite Diversity in Case Studies
| Parasite / Gene Target | Diversity Revealed by Sanger | Additional Diversity Uncovered by NGS | Citation |
|---|---|---|---|
| Giardia duodenalis / Beta-giardin | Single assemblage per sample (A, B, C, D, E, or F) | Mixed assemblage infections (e.g., A+B, B+C); Low-frequency assemblages; Intra-assemblage sequence variations [59] | [59] |
| Cryptosporidium / gp60 | Single dominant subtype (e.g., IIcA5G3) | Multiple minor subtypes in unmixed samples; Co-circulating subtypes in a single infection; More accurate assessment of subtype diversity in outbreaks [105] | [105] |
| General Eukaryotes / SSU rRNA | Limited diversity, biased towards abundant taxa | Vastly expanded species richness; Detection of rare species; Improved capture of frequency shifts in communities [108] | [108] |
Experimental Protocols
Objective: To detect and characterize Giardia duodenalis assemblages and mixed infections using the beta-giardin gene via NGS.
Sample Preparation:
- DNA Extraction: Extract genomic DNA from purified Giardia cysts or fecal samples using a commercial silica-membrane-based kit (e.g., QIAamp DNA Stool Mini Kit or DNeasy Tissue kit with appropriate modifications for pathogen lysis).
- PCR Amplification:
- Primers: Use primers targeting a ~500-bp fragment of the beta-giardin gene.
- Reaction Setup: Assemble PCR reactions using a high-fidelity DNA polymerase to minimize amplification errors.
- Cycling Conditions: Initial denaturation at 98°C for 1 min; followed by 35 cycles of: 98°C for 10 s, 65°C for 15 s, 72°C for 20 s; final extension at 72°C for 7 min.
Library Preparation for NGS:
- Indexing PCR (2nd Round): Use the first-round PCR product as a template for a second, limited-cycle PCR to attach dual-indexed Illumina sequencing adapters and unique sample barcodes.
- Library Purification: Clean up the final PCR products using magnetic beads (e.g., AMPure XP) to remove primers, dimers, and other contaminants.
- Quantification and Pooling: Quantify libraries using a fluorometric method (e.g., Qubit). Normalize and pool equimolar amounts of each indexed library into a single tube.
- Sequencing: Denature and dilute the pooled library according to Illumina guidelines. Sequence on an Illumina MiSeq or iSeq platform using a 500-cycle or 300-cycle paired-end reagent kit.
Bioinformatic Analysis:
- Demultiplexing: Assign raw sequencing reads to individual samples based on their unique barcode combinations.
- Quality Filtering & Trimming: Use a pipeline like DADA2 or QIIME 2 to filter low-quality reads, remove primers and adapters, and trim reads.
- Variant Calling: Denoise sequences to resolve amplicon sequence variants (ASVs) or cluster reads into operational taxonomic units (OTUs) at a high identity threshold (e.g., 99%).
- Taxonomic Assignment: BLAST query representative sequences for each ASV/OTU against a custom-curated database of known Giardia beta-giardin assemblage sequences. Assign assemblages based on highest identity and query coverage.
Objective: To achieve high-resolution subtyping of C. parvum and C. hominis and detect mixed subtype infections at the gp60 locus.
Sample Preparation and Library Construction:
- DNA Extraction: Extract DNA from stool samples or purified oocysts using a robust pathogen DNA extraction kit (e.g., Nucleospin Tissue kit).
- Amplification and Tagging: Amplify the gp60 gene fragment using a nested or semi-nested PCR approach with standard primers.
- Library Preparation: Utilize the 16S Metagenomics Sequencing Library Preparation (16SMSLP) protocol with modifications for the gp60 target.
- Indexing: Incorporate dual indices and Illumina sequencing adapters during a limited-cycle PCR.
- Library Clean-up and Pooling: Purify the final library with magnetic beads, quantify, normalize, and pool.
Sequencing and Data Analysis:
- Sequencing: Load the pooled library onto an Illumina sequencer (e.g., MiSeq, iSeq). Include a negative control (no-template) and a positive control (known subtype) in every run.
- Bioinformatic Processing: Process raw data through a pipeline (e.g., DADA2) for denoising, error-correction, and production of ASVs.
- Subtype Assignment: Compare ASVs against a reference database of known gp60 subtypes.
- Interpretation and Contamination Thresholding: Establish a data-driven threshold for distinguishing genuine low-abundance subtypes from index-hopping or cross-contamination. A key step is using the maximum number of reads for any subtype found in the negative control as the interpretation threshold. Any subtype in a sample with a read count at or below this threshold should be considered a potential contaminant and discounted [105].
Workflow Visualization
Diagram 1: Comparative workflow of Sanger sequencing versus NGS for parasite barcoding, highlighting the divergent outcomes in detecting allelic diversity.
The Scientist's Toolkit: Essential Research Reagent Solutions
Table 3: Key Reagents and Materials for NGS-based Parasite Barcoding
| Item | Function / Application in Protocol | Example Specifics / Considerations |
|---|---|---|
| High-Fidelity DNA Polymerase | Critical for accurate amplification of target barcode genes (e.g., bg, gp60, COI) with low error rates during PCR. | Phusion High-Fidelity DNA Polymerase [108] or equivalent. |
| Silica-Membrane DNA Extraction Kits | Efficient recovery of pathogen DNA from complex samples like stool. | Nucleospin Tissue Kit [22], DNeasy Tissue Kit [108], QIAamp DNA Stool Mini Kit. |
| Dual-Indexed Sequencing Adapters | Uniquely tag (barcode) amplicons from individual samples for multiplexing in a single NGS run. | Illumina Nextera XT Index Kit or IDT for Illumina Tagmentation Kits. |
| Magnetic Beads for Size Selection | Purification and size-selection of amplicon libraries to remove primers, dimers, and other contaminants. | AMPure XP Beads. |
| Fluorometric Quantification Kits | Accurate quantification of DNA library concentration for equitable pooling prior to sequencing. | Qubit dsDNA HS Assay Kit. |
| NGS Sequencer & Reagent Kits | Platform for massively parallel sequencing of the prepared library. | Illumina MiSeq/iSeq with v2/v3 reagent kits; Ion S5 System with 530 chip [109]. |
| Bioinformatics Software/Pipelines | Processing raw data, denoising, variant calling, and taxonomic assignment. | DADA2 [105], QIIME 2, Mothur, custom scripts. |
The case studies presented herein unequivocally demonstrate that NGS is a superior tool for uncovering the true scale of allelic diversity in parasite populations. The key advantage of NGS lies in its ability to simultaneously sequence millions of individual amplicon molecules, providing a quantitative and granular view of the genetic composition of a sample that Sanger sequencing simply cannot achieve [16] [105] [59]. This has led to the critical realization that mixed parasite infections are far more common than previously documented.
For researchers and drug development professionals, this has direct implications:
- Epidemiology: Accurate tracking of transmission chains and reservoir hosts requires the sensitivity to detect all circulating subtypes, not just the dominant one [105].
- Pathogenesis and Drug Resistance: Associations between specific subtypes or mixed infections and disease severity or treatment failure can now be rigorously investigated.
- Surveillance: NGS enables high-throughput, cost-effective surveillance that provides a more realistic picture of parasite diversity at a population level [16] [28].
In conclusion, while Sanger sequencing remains a valuable tool for validating specific variants or for projects targeting a single gene in a small number of samples [107] [28], NGS has become the definitive method for advanced parasite DNA barcoding research aimed at discovering the full spectrum of genetic diversity.
The accurate identification and characterization of parasites is a cornerstone of epidemiological studies, diagnostics, and drug development. Within this field, DNA barcoding—the use of short, standardized genomic regions for species identification—has become an indispensable tool. The critical choice facing researchers is the selection of an appropriate sequencing technology to generate these barcodes. The core dilemma hinges on the project's scope: is it targeted, focusing on a specific, known genomic region, or discovery-based, aiming to identify novel species or complex mixtures? This application note provides a structured decision matrix to guide researchers in choosing between Sanger sequencing and Next-Generation Sequencing (NGS) for parasite DNA barcoding, framed within a practical context and supported by detailed protocols.
Decision Matrix: Sanger Sequencing vs. NGS
The following table summarizes the key technical and operational differences between Sanger sequencing and NGS, providing a foundation for informed decision-making.
Table 1: Comparative Analysis of Sanger Sequencing and NGS for DNA Barcoding
| Feature | Sanger Sequencing | Next-Generation Sequencing (NGS) |
|---|---|---|
| Fundamental Method | Chain termination using dideoxynucleotides (ddNTPs) [8] [36]. | Massively parallel sequencing (e.g., Sequencing by Synthesis) [8]. |
| Throughput | Low to medium. Processes one fragment per reaction [8]. | Extremely high. Sequences millions to billions of fragments simultaneously [8]. |
| Read Length | Long, contiguous reads (500–1000 base pairs) [8]. | Short reads (50-300 bp for platforms like Illumina) [8] [26]. |
| Per-Base Accuracy | Very high (~99.99%), making it a "gold standard" for validation [36] [26]. | Slightly lower per-read accuracy, but high overall accuracy is achieved through deep coverage [8]. |
| Cost Efficiency | Low cost per run for a few samples; high cost per base [8]. | High capital and per-run cost; very low cost per base [8]. |
| Optimal for Project Type | Targeted projects: confirming known loci, validating NGS findings, sequencing single genes [8] [36]. | Discovery-based projects: identifying novel species, detecting mixed infections, multiplexing hundreds of samples [8] [22]. |
| Variant Detection Limit | Low sensitivity; requires the variant to be present in ~15-20% of the sample [26]. | High sensitivity; can detect variants present at frequencies as low as 1% [26]. |
| Bioinformatics Demand | Low; requires basic sequence alignment software [8]. | High; requires sophisticated pipelines for read alignment, variant calling, and data storage [8]. |
The decision flow for selecting the appropriate technology for a parasite DNA barcoding project can be visualized as follows:
Experimental Protocols for Parasite DNA Barcoding
Protocol 1: Targeted Barcoding via Sanger Sequencing
This protocol is optimized for generating a DNA barcode from a single parasite specimen or a pure, isolated sample, ideal for validating a specific genetic marker.
Workflow Overview:
Detailed Methodology:
Step 1: DNA Extraction
- Use a commercial tissue kit (e.g., Nucleospin Tissue kit) following manufacturer's protocols [22].
- Input: 2–4 mm of parasite tissue or a cell pellet.
- Elute DNA in a suitable buffer and quantify using a spectrophotometer.
Step 2: PCR Amplification of Barcode Region
- Assemble a 25 µL PCR reaction [110]:
- 2 µL DNA template
- 17.5 µL PCR-grade water
- 2.5 µL 10x reaction buffer (with MgCl₂)
- 0.5 µL dNTP mix (10 mM)
- 0.5 µL forward primer (10 µM)
- 0.5 µL reverse primer (10 µM)
- 0.5 µL DNA polymerase (5 U/µL)
- Cycling Conditions (Generic for COI): [110]
- Initial Denaturation: 95°C for 5 min.
- 35 Cycles:
- Denature: 95°C for 60 sec.
- Anneal: 50°C for 60 sec.
- Extend: 72°C for 90 sec.
- Final Extension: 72°C for 7 min.
- Hold: 15°C ∞.
- Primer Selection: The choice of primer pair is critical and depends on the parasite group. Universal primers for the cytochrome c oxidase I (COI) gene, such as LCO1490/HCO2198, are often used as a starting point [22] [110].
- Assemble a 25 µL PCR reaction [110]:
Step 3: PCR Purification
- Purify the PCR amplicon using a PCR cleanup kit to remove excess primers, dNTPs, and enzymes that can interfere with sequencing.
Step 4: Sanger Sequencing
Step 5: Data Analysis
- Analyze the returned chromatogram (electropherogram) using sequence alignment software (e.g., BLAST) to compare against reference barcode databases like the International Barcode of Life (iBOL) [111].
Protocol 2: Discovery-Based Barcoding via NGS
This protocol uses a multiplexed NGS approach to generate DNA barcodes from dozens to hundreds of parasite specimens simultaneously, which is powerful for environmental samples or detecting co-infections [22].
Workflow Overview:
Detailed Methodology:
Step 1: DNA Extraction and Sample Tagging
- Extract DNA from each individual specimen as described in Protocol 1.
Step 2: Library Preparation and Multiplexed PCR
- Tagging: During the PCR amplification of the barcode region, use primers that have two key components [22]:
- The target-specific sequence (e.g., LCO1490/HCO2198).
- A unique 10-mer oligonucleotide tag (Multiple Identifier, MID) assigned to each individual sample.
- This allows all PCR products from hundreds of specimens to be pooled into a single sequencing library, as the unique tag will later allow bioinformatic sorting of sequences back to their source specimen [22].
- Perform PCR with a reduced number of cycles (e.g., 20-30) to minimize amplification bias [25].
- Tagging: During the PCR amplification of the barcode region, use primers that have two key components [22]:
Step 3: NGS Run
Step 4: Bioinformatic Analysis
- Demultiplexing: Assign reads to individual samples based on their unique MID tags [22].
- Quality Filtering: Remove low-quality reads based on Phred quality scores (e.g., Q30) [25].
- Barcode Calling: Extract the barcode sequence from each high-quality read.
- Variant Calling & Identification: Compare consensus barcode sequences from each sample against reference databases to identify known species or flag potential novel species [8] [111].
Research Reagent Solutions
The following table lists key reagents and their functions essential for implementing the DNA barcoding protocols described above.
Table 2: Essential Reagents for DNA Barcoding Workflows
| Reagent / Solution | Function / Explanation |
|---|---|
| DNA Extraction Kit | For isolating high-quality genomic DNA from parasite tissue samples. Kits typically include lysis buffers, proteases, and purification columns [22]. |
| Target-Specific Primers | Short DNA sequences designed to bind to and amplify the standardized barcode region (e.g., COI, ITS). The choice of primer defines the barcode obtained [110]. |
| DNA Polymerase | Enzyme that catalyzes the amplification of the target DNA barcode region during PCR. High-fidelity polymerases are preferred to minimize replication errors [9]. |
| Multiplexing Oligonucleotides (MIDs) | Unique DNA tags (e.g., 10-mer MIDs) attached to PCR primers. They allow multiple samples to be pooled and sequenced together in a single NGS run, with subsequent bioinformatic sorting [22]. |
| Sanger Sequencing Kit | Contains the fluorescently labeled dideoxynucleotides (ddNTPs), DNA polymerase, and buffers required for the chain-termination sequencing reaction [36]. |
| NGS Library Prep Kit | Reagents for converting the amplified, tagged barcode PCR products into a format compatible with a specific NGS platform, which may include steps for adapter ligation and size selection [22]. |
Conclusion
Sanger sequencing remains the undisputed gold standard for high-accuracy sequencing of single DNA fragments and is ideal for confirming known mutations or barcoding individual parasite specimens. However, for parasitology research requiring the detection of mixed infections, cryptic species, or extensive allelic diversity, NGS provides unparalleled depth and throughput. The choice between them is not a question of which technology is superior, but which is optimal for a specific project's goals, scale, and budget. Future directions will see increased integration of long-read third-generation sequencing to resolve complex genomic regions and a continued drive toward lower costs and faster, automated workflows, solidifying DNA barcoding's role in advancing parasite diagnostics, surveillance, and drug development.
References
- 1. DNA barcoding [https://en.wikipedia.org/wiki/DNA_barcoding]
- 2. DNA Barcoding [https://ibol.org/about/dna-barcoding/]
- 3. What Is DNA Barcoding And Why Is It Important? [https://oceanexplorer.noaa.gov/expedition-feature/24skq-ak-seamounts-features-dna-barcoding/]
- 4. DNA barcoding of parasites and invertebrate disease vectors [https://www.sciencedirect.com/science/article/abs/pii/S147149220300271X]
- 5. Advances and challenges in barcoding of microbes ... [https://pubmed.ncbi.nlm.nih.gov/29900810/]
- 6. DNA Barcoding - an overview [https://www.sciencedirect.com/topics/agricultural-and-biological-sciences/dna-barcoding]
- 7. Transforming gastrointestinal helminth parasite ... [https://pubmed.ncbi.nlm.nih.gov/39030625/]
- 8. Next-Generation Sequencers vs. Sanger ... [https://www.labx.com/resources/next-generation-sequencers-vs-sanger-sequencers-key-differences/5597]
- 9. The Future of Sanger Sequencing: Technical Development ... [https://www.cd-genomics.com/blog/sanger-sequencing-technology-innovation/]
- 10. Sanger Sequencing: Introduction, Principle, and Protocol [https://www.cd-genomics.com/blog/sanger-sequencing-introduction-principle-and-protocol/]
- 11. Sanger sequencing: Principles, process and applications [https://www.abcam.com/en-us/knowledge-center/dna-and-rna/sanger-sequencing]
- 12. Systematic Evaluation of Sanger Validation of NextGen ... [https://pmc.ncbi.nlm.nih.gov/articles/PMC4878677/]
- 13. Sanger Sequencing: Principle, Steps, Applications, Diagram [https://microbenotes.com/sanger-sequencing/]
- 14. Sanger Sequencing vs. Next-Generation Sequencing (NGS) [https://www.genscript.com/gene-news/sanger-sequencing-vs-next-generation-sequencing.html]
- 15. Next-Generation Sequencing Technology: Current Trends ... [https://pmc.ncbi.nlm.nih.gov/articles/PMC10376292/]
- 16. NGS vs Sanger Sequencing [https://www.illumina.com/science/technology/next-generation-sequencing/beginners/advantages/ngs-vs-sanger.html]
- 17. Sanger Sequencing vs. Next-Generation Sequencing (NGS) [https://www.cd-genomics.com/resource-sanger-sequencing-vs-next-generation-sequencing.html]
- 18. Next-Generation Sequencing: Principles, Applications, & ... [https://www.excedr.com/blog/next-generation-sequencing-101]
- 19. DNA Sequencing: How to Choose the Right Technology [https://frontlinegenomics.com/dna-sequencing-how-to-choose-the-right-technology/]
- 20. Next-Generation Sequencing (NGS) | Explore the technology [https://www.illumina.com/science/technology/next-generation-sequencing.html]
- 21. Massive parallel sequencing in forensics: advantages, ... [https://pmc.ncbi.nlm.nih.gov/articles/PMC7295846/]
- 22. Next-generation DNA barcoding [https://pmc.ncbi.nlm.nih.gov/articles/PMC4276293/]
- 23. DNA Barcoding Using 18S rRNA Gene Fragments for ... [https://pmc.ncbi.nlm.nih.gov/articles/PMC11597262/]
- 24. DNA Barcoding: Species Detection and High Throughput ... [https://www.the-scientist.com/dna-barcoding-species-detection-and-high-throughput-assays-71860]
- 25. Limitations and challenges of genetic barcode quantification [https://www.nature.com/articles/srep43249]
- 26. Sanger sequencing vs NGS - INTEGRA Biosciences [https://www.integra-biosciences.com/united-states/en/blog/article/sanger-sequencing-vs-ngs]
- 27. The Latest Developments in Sequencing Technologies [https://frontlinegenomics.com/the-latest-developments-in-sequencing-technologies/]
- 28. Next-Generation Sequencing (NGS) vs. Sanger ... [https://www.labmanager.com/next-generation-sequencing-ngs-vs-sanger-sequencing-which-dna-sequencing-method-is-right-for-you-33659]
- 29. Genomics gets faster, cheaper, and more accurate [https://sangerinstitute.blog/2024/02/29/genomics-gets-faster-cheaper-and-more-accurate/]
- 30. A Primer on NGS Technologies and Their Specs (2025) [https://blog.latch.bio/p/a-primer-on-ngs-technologies-and]
- 31. Sanger sequencing [https://en.wikipedia.org/wiki/Sanger_sequencing]
- 32. Challenges with Sanger Sequencing [https://www.news-medical.net/life-sciences/Challenges-with-Sanger-Sequencing.aspx]
- 33. U.S. DNA Barcoding Services Market Size, Report 2030F [https://www.techsciresearch.com/report/united-states-dna-barcoding-services-market/28406.html]
- 34. 2025 Trends: NGS [https://www.genengnews.com/topics/genome-editing/2025-trends-ngs/]
- 35. Roche presents major advances for its sequencing by ... [https://www.roche.com/media/releases/med-cor-2025-10-16]
- 36. Sanger Sequencing: Introduction, Workflow, and Applications - CD Genomics [https://www.cd-genomics.com/resource-sanger-sequencing-introduction-workflow-and-applications.html]
- 37. Sanger Sequencing Workflow | Thermo Fisher Scientific - US [https://www.thermofisher.com/us/en/home/life-science/sequencing/sanger-sequencing/sanger-sequencing-workflow.html]
- 38. Guidelines for Sanger sequencing and molecular assay ... [https://pmc.ncbi.nlm.nih.gov/articles/PMC7649556/]
- 39. Analyzing Sanger Sequencing Data [https://blog.genewiz.com/analyzing-sanger-sequencing-data]
- 40. What is the workflow of the Sanger Sequencing method? | AAT Bioquest [https://www.aatbio.com/resources/faq-frequently-asked-questions/what-is-the-workflow-of-the-sanger-sequencing-method]
- 41. From Sanger to Oxford Nanopore MinION Technology [https://pmc.ncbi.nlm.nih.gov/articles/PMC12153771/]
- 42. DNA Barcoding vs. Metabarcoding: Five Comparing Parts [https://www.cd-genomics.com/microbioseq/resource-dna-barcording-metabarcoding-comparison.html]
- 43. Comparative analysis of targeted next-generation ... [https://www.nature.com/articles/s41598-022-09474-5]
- 44. Getting a Read on NGS Barcodes [https://seqwell.com/getting-a-read-on-ngs-barcodes/]
- 45. Next-Generation DNA Barcoding for Fish Identification ... [https://www.mdpi.com/2073-4441/15/4/774]
- 46. Cellular barcoding of protozoan pathogens reveals the within ... [https://pmc.ncbi.nlm.nih.gov/articles/PMC9421581/]
- 47. Chemistry Technical Document [https://nanoporetech.com/document/chemistry-technical-document]
- 48. NGS Library Preparation [https://www.cd-genomics.com/resource-library-preparation-for-ngs.html]
- 49. Using Next-Generation Sequencing for DNA Barcoding [https://pmc.ncbi.nlm.nih.gov/articles/PMC5217108/]
- 50. High-throughput sequencing of multiple amplicons for ... [https://www.nature.com/articles/srep41948]
- 51. DNA barcoding of Culicoides biting midges (Diptera [https://pmc.ncbi.nlm.nih.gov/articles/PMC12121006/]
- 52. Mitochondrial and ribosomal markers in the identification of ... [https://parasitesandvectors.biomedcentral.com/articles/10.1186/s13071-023-06113-4]
- 53. Comparison of a multiplex PCR with DNA barcoding for ... [https://parasitesandvectors.biomedcentral.com/articles/10.1186/s13071-024-06255-z]
- 54. Metabarcoding in gut protozoology [https://www.sciencedirect.com/science/article/abs/pii/S1471492224003040]
- 55. of Culicoides biting midges (Diptera...) DNA barcoding [https://parasitesandvectors.biomedcentral.com/articles/10.1186/s13071-025-06812-0]
- 56. Standardization of 16S rRNA gene sequencing using ... [https://www.frontiersin.org/journals/cellular-and-infection-microbiology/articles/10.3389/fcimb.2025.1517208/full]
- 57. DNA Metabarcoding: Current Applications and Challenges [https://pubmed.ncbi.nlm.nih.gov/40791109/]
- 58. Using DNA to barcoding host- identify interactions between... parasite [https://pubmed.ncbi.nlm.nih.gov/34810814/]
- 59. Assessment of next generation amplicon sequencing of the ... [https://www.sciencedirect.com/science/article/pii/S2405676620300275]
- 60. Amplicon sequencing detects, identifies, and quantifies ... [https://pmc.ncbi.nlm.nih.gov/articles/PMC12506009/]
- 61. DNA sequencing methods: from Sanger to NGS | INTEGRA [https://www.integra-biosciences.com/united-states/en/blog/article/dna-sequencing-methods-sanger-ngs]
- 62. Comparing Sanger sequencing and high-throughput ... [https://www.nature.com/articles/s41598-018-26947-8]
- 63. Unbiased DNA pathogen detection in tissues: Real-world ... [https://www.sciencedirect.com/science/article/pii/S0023683725001643]
- 64. Utilizing Targeted Next-Generation Sequencing for Rapid ... [https://pmc.ncbi.nlm.nih.gov/articles/PMC11748758/]
- 65. Assessing mitochondrial heteroplasmy using next generation ... [https://pmc.ncbi.nlm.nih.gov/articles/PMC6509278/]
- 66. insights from deep-sequencing of human replicate samples [https://bmcgenomics.biomedcentral.com/articles/10.1186/s12864-024-09963-z]
- 67. Comparison of molecular diagnostic approaches for the ... [https://pmc.ncbi.nlm.nih.gov/articles/PMC9153396/]
- 68. The quality and detection limits of mitochondrial ... [https://www.nature.com/articles/s41598-024-78270-0]
- 69. Comparison of classic Sanger and next generation ... [https://link.springer.com/article/10.1007/s00414-025-03603-1]
- 70. Minor Variant Finder Software [https://www.thermofisher.com/us/en/home/life-science/sequencing/sanger-sequencing/sanger-dna-sequencing/sanger-sequencing-data-analysis/minor-variant-finder-software.html]
- 71. Optimization of 18 S rRNA metabarcoding for the ... [https://www.nature.com/articles/s41598-024-76304-1]
- 72. Application of next-generation sequencing to identify different ... [https://pmc.ncbi.nlm.nih.gov/articles/PMC10859930/]
- 73. Rescue of Low-Yield DNA Samples for Next-Generation ... [https://pmc.ncbi.nlm.nih.gov/articles/PMC12225422/]
- 74. Sanger DNA Sequencing: Troubleshooting [https://dnacore.mgh.harvard.edu/new-cgi-bin/site/pages/sequencing_pages/seq_troubleshooting.jsp]
- 75. Next-Generation Sequencing Costs: The Sub $100 Genome [https://www.completegenomics.com/next-generation-sequencing-costs/]
- 76. Towards accurate indel calling for oncopanel sequencing ... [https://www.nature.com/articles/s41598-024-58573-y]
- 77. INDEL detection, the 'Achilles heel' of precise genome editing [https://pmc.ncbi.nlm.nih.gov/articles/PMC7708060/]
- 78. Sequencing‐based microsatellite instability testing using ... [https://pmc.ncbi.nlm.nih.gov/articles/PMC6973255/]
- 79. Enhanced blood parasite species identification using V4– ... [https://www.nature.com/articles/s41598-025-25108-y]
- 80. PCR Methods - Top Ten Strategies [https://www.thermofisher.com/us/en/home/life-science/cloning/cloning-learning-center/invitrogen-school-of-molecular-biology/pcr-education/pcr-reagents-enzymes/pcr-methods.html]
- 81. Primer Based Approach for PCR Amplification of High GC ... [https://pmc.ncbi.nlm.nih.gov/articles/PMC3982478/]
- 82. Optimization of PCR Conditions for Amplification of GC‐ ... [https://pmc.ncbi.nlm.nih.gov/articles/PMC6807403/]
- 83. Optimizing PCR: Proven Tips and Troubleshooting Tricks [https://www.the-scientist.com/optimizing-pcr-proven-tips-and-troubleshooting-tricks-71660]
- 84. PCR Optimization: Factors Affecting Reaction Specificity ... [https://www.mybiosource.com/learn/pcr-optimization-factors-affecting-reaction-specificity-and-efficien/]
- 85. How to Read a Chromatogram? [https://lab-training.com/how-to-read-a-chromatogram/]
- 86. Protocols - CONSERVATION & MOLECULAR ECOLOGY [https://www.kartzinellab.com/protocols.html]
- 87. How-to: NGS Quality Control [https://frontlinegenomics.com/how-to-ngs-quality-control/]
- 88. Sequencing Sanger Next-Generation Sequencing Versus [https://www.news-medical.net/life-sciences/Sanger-and-next-generation-compared.aspx]
- 89. Is DNA Actually Cheaper and Faster than... | PLOS One Barcoding [https://journals.plos.org/plosone/article?id=10.1371/journal.pone.0095525]
- 90. Sample Multiplexing | Multiplex sequencing with indexes [https://www.illumina.com/techniques/sequencing/ngs-library-prep/multiplexing.html]
- 91. Sequencing 101: How multiplexing with long-read ... [https://www.pacb.com/blog/sequencing-101-how-multiplexing-with-long-read-sequencing-makes-genomic-research-faster-cheaper-and-smarter/]
- 92. Masters: NGS Sequencing of... | Thermo Fisher Scientific - US Multiplex [https://www.thermofisher.com/us/en/home/life-science/sequencing/next-generation-sequencing/ngs-library-preparation-illumina-systems/master-ngs-collibri-library-prep/multiplex-single-dual-libraries.html]
- 93. Sanger Sequencing: Experimental Design and Sample ... [https://www.cd-genomics.com/blog/sanger-sequencing-sample-prepation-experimental-design/]
- 94. Good practices for NGS customization panel [https://www.news-medical.net/whitepaper/20250117/Good-practices-for-NGS-panel-customization.aspx]
- 95. Diagnostic gene sequencing panels: from design to report ... [https://www.sciencedirect.com/science/article/pii/S1098360021012375]
- 96. custom Designing | NGS Tool | Nonacus panels Panel Design [https://nonacus.com/blog-get-great-coverage-for-the-genes-you-care-about/]
- 97. Transforming gastrointestinal helminth parasite ... [https://pmc.ncbi.nlm.nih.gov/articles/PMC11265005/]
- 98. Methods to improve the accuracy of next-generation sequencing [https://pmc.ncbi.nlm.nih.gov/articles/PMC9895957/]
- 99. Ultra-Sensitive Characterization of Commercial DNA ... [https://www.sciencedirect.com/science/article/pii/S0006497118600229]
- 100. VESPA: an optimized protocol for accurate metabarcoding ... [https://pmc.ncbi.nlm.nih.gov/articles/PMC10776621/]
- 101. SUMMARY OF EVIDENCE - Next Generation DNA Sequencing [https://www.ncbi.nlm.nih.gov/books/NBK274076/]
- 102. Rapid and cost-effective generation of single specimen ... [https://www.nature.com/articles/s41598-019-54927-z]
- 103. Sanger Sequencing [https://www.mdanderson.org/research/research-resources/core-facilities/advanced-technology-genomics-core/services-and-fees/sanger-sequencing.html]
- 104. Enhanced blood parasite species identification using V4–V9 ... [https://pmc.ncbi.nlm.nih.gov/articles/PMC12639079/]
- 105. Evaluation of Next-Generation Sequencing Applied to ... [https://pmc.ncbi.nlm.nih.gov/articles/PMC9414878/]
- 106. Very high resolution single pass HLA genotyping using ... [https://pubmed.ncbi.nlm.nih.gov/26037172/]
- 107. Sanger validation of WGS variants - PMC [https://pmc.ncbi.nlm.nih.gov/articles/PMC11779820/]
- 108. Diversity in a hidden world: potential and limitation of next- ... [https://pmc.ncbi.nlm.nih.gov/articles/PMC2953707/]
- 109. The application of next-generation sequence-based DNA ... [https://bmcresnotes.biomedcentral.com/articles/10.1186/s13104-021-05481-3]
- 110. DNA Barcoding PCR Protocol (Primer Pairs) [https://bento.bio/protocol/dna-barcoding/dna-barcoding-pcr-protocol-primer-pairs/]
- 111. Research progress of DNA barcoding in precision ... [https://www.sciencedirect.com/science/article/abs/pii/S0003267025008864]