Overcoming PCR Inhibition in Stool Samples: A Comprehensive Guide for Robust Molecular Diagnostics
Accurate molecular analysis of stool samples is critical for clinical diagnostics, gut microbiome research, and drug development.
Overcoming PCR Inhibition in Stool Samples: A Comprehensive Guide for Robust Molecular Diagnostics
Abstract
Accurate molecular analysis of stool samples is critical for clinical diagnostics, gut microbiome research, and drug development. However, the pervasive challenge of PCR inhibition significantly compromises sensitivity and reliability. This article provides a systematic framework for researchers and scientists to understand, identify, and overcome PCR inhibition. We explore the foundational sources of inhibitors in stool, present optimized methodological approaches for nucleic acid extraction and assay design, detail practical troubleshooting strategies, and review validation techniques for comparative method analysis. By integrating the latest evidence and protocols, this guide aims to empower professionals in achieving consistent and reproducible molecular results from complex fecal specimens.
Understanding the Enemy: Foundational Principles of PCR Inhibitors in Stool
Polymerase chain reaction (PCR) inhibition is a major challenge in molecular diagnostics and research, particularly when analyzing complex samples like stool. Inhibitors are substances that interfere with the biochemical processes of PCR, leading to reduced sensitivity (false negatives) and specificity (false positives or non-specific amplification) [1] [2]. In stool samples, a wide array of organic and inorganic compounds can act as potent inhibitors, compromising the accuracy and reliability of your results [3] [4].
Mechanisms of Action: PCR inhibitors can disrupt amplification through several mechanisms:
- Direct DNA Polymerase Inhibition: Many inhibitors, such as humic substances, bile salts, and complex polysaccharides, bind directly to the DNA polymerase enzyme, degrading it or blocking its active center [1] [4].
- Interaction with Nucleic Acids: Inhibitors like collagen and humic acid can bind to the template DNA, making it unavailable for primer binding and elongation [1] [2].
- Cofactor Chelation: Substances such as EDTA and heparin chelate or compete for magnesium ions (Mg²⁺), an essential co-factor for DNA polymerase activity [1] [3]. Some inhibitors may also quench the fluorescence signals used in real-time qPCR and digital PCR (dPCR) detection systems [1].
Quantitative Impact of Inhibition on Assay Performance
The presence of inhibitors can significantly skew quantitative results and reduce detection sensitivity. The following table summarizes key quantitative findings from research on PCR inhibition in fecal samples.
Table 1: Quantitative Impact of PCR Inhibition in Fecal Samples
| Metric | Impact Without Inhibition Management | Impact With 5-Fold Dilution of DNA Extract | Source |
|---|---|---|---|
| Rate of Inhibition | 19.94% of fecal DNA extracts showed evidence of inhibition | Not Applicable | [3] |
| Test Sensitivity | 55% (compared to fecal culture) | 80% (compared to fecal culture) | [3] |
| DNA Quantification | Underestimation due to suppression of amplification | 3.3-fold average increase in quantified DNA | [3] |
| Predictors of Inhibition | DNA extracts with higher DNA and protein content had significantly higher odds (19.33x and 10.94x, respectively) of showing inhibition | Not Applicable | [3] |
Inhibition rates can vary significantly depending on the sample matrix. One large-scale study of clinical specimens found an overall inhibition rate of 0.87% when the inhibition control was added pre-extraction. However, for certain sample types like urine and formalin-fixed, paraffin-embedded tissue, inhibition rates were notably higher [5].
Frequently Asked Questions (FAQs) and Troubleshooting Guide
FAQ 1: How can I detect PCR inhibition in my experiments? Inhibition can be detected through several methods. The most robust is the use of an Internal Amplification Control (IAC). An IAC is a non-target DNA sequence added to each reaction. If the IAC fails to amplify while a positive external control works, it indicates the presence of an inhibitor in the sample [3]. Other signs include a reduction in amplification efficiency, an increase in quantification cycle (Cq) values in qPCR, complete amplification failure, or inconsistent results between replicates [1] [6] [4].
FAQ 2: What are the most common PCR inhibitors in stool samples? Stool is a complex matrix containing numerous potential inhibitors, including:
- Complex polysaccharides [2] [3]
- Bile salts [5] [3]
- Bacterial metabolites and porphyrins [2]
- Calcium, hemoglobin derivatives, and immunoglobulin G [1] [3]
FAQ 3: My PCR shows no product. Is this always due to inhibition? No. A lack of product can have multiple causes. Before concluding inhibition is the issue, systematically check the following [7] [6]:
- Template DNA: Verify quantity, quality, and integrity.
- Reagent Integrity: Ensure all reagents, especially primers, dNTPs, and polymerase, are active and not degraded.
- Thermal Cycler Programming: Confirm that temperatures and times for denaturation, annealing, and extension are correct.
- Primer Design: Check for specificity and the absence of self-complementarity.
Table 2: Troubleshooting Guide for PCR Inhibition
| Observation | Possible Cause | Recommended Solution |
|---|---|---|
| No amplification, but internal control also fails | Severe PCR inhibition | Dilute the DNA template 1:5 or 1:10 [3]. Add Bovine Serum Albumin (BSA) to a final concentration of 0.1-0.5 μg/μL [2] [4]. Use an inhibitor-tolerant DNA polymerase blend [1] [6]. |
| High Cq value, low yield, or reduced sensitivity | Moderate PCR inhibition | Dilute DNA template [3]. Increase the amount of DNA polymerase in the reaction [7]. Use a PCR additive like BSA or betaine [4]. Switch to digital PCR (dPCR), which is less affected by moderate inhibitors [1]. |
| Non-specific bands or primer-dimer formation | Reaction conditions compromised by inhibitors | Use a hot-start DNA polymerase to prevent non-specific amplification at low temperatures [7] [6] [4]. Optimize Mg²⁺ concentration and annealing temperature [7] [6]. |
| Inaccurate DNA quantification via spectrophotometry | Co-purified inhibitors like humic substances affecting UV absorption | Use a fluorescence-based quantification method (e.g., Picogreen, SYBR Green), which is more specific for DNA and less affected by contaminants [2]. |
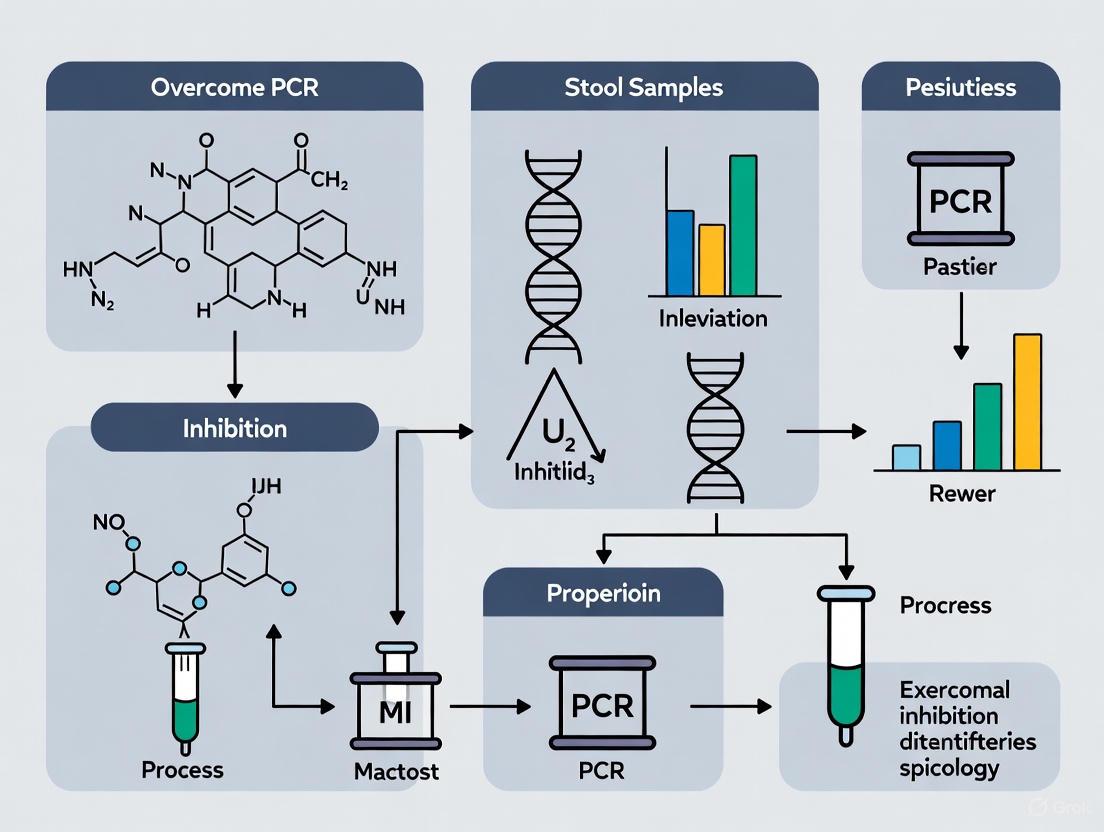
Experimental Workflow to Overcome Inhibition
The diagram below outlines a logical workflow for diagnosing and overcoming PCR inhibition in stool sample analysis.
The Scientist's Toolkit: Key Reagent Solutions
Table 3: Essential Reagents for Overcoming PCR Inhibition
| Reagent / Material | Function / Explanation | Example Use Case |
|---|---|---|
| Bovine Serum Albumin (BSA) | Binds to inhibitors, preventing them from interacting with the DNA polymerase or nucleic acids [2] [4]. | Add to a final concentration of 0.1-0.5 μg/μL in the PCR mix to neutralize a wide range of inhibitors in stool extracts. |
| Inhibitor-Tolerant DNA Polymerase | Specially engineered enzyme blends with high resistance to common PCR inhibitors [1] [6]. | Use as a direct replacement for standard Taq polymerase when working with crude or difficult-to-purify DNA extracts. |
| dPCR Master Mix | Reagents optimized for digital PCR, a technique less affected by inhibitors due to sample partitioning and end-point analysis [1]. | For absolute quantification of target DNA in inhibited samples where qPCR results are unreliable. |
| Polyvinylpyrrolidone (PVP) or Betaine | Additives that can help destabilize secondary structures in DNA and mitigate the effects of some inhibitors [4]. | Can be added to the PCR mix to improve amplification efficiency from inhibitor-rich environmental samples. |
Polymerase chain reaction (PCR) inhibition remains a significant challenge in molecular diagnostics and research, particularly when working with complex biological matrices like human stool. The presence of inhibitors in fecal samples can lead to false-negative results, reduced sensitivity, and unreliable data, ultimately compromising experimental outcomes and diagnostic accuracy. This technical support guide addresses the most common sources of PCR inhibitors in stool samples and provides evidence-based troubleshooting strategies to overcome these challenges. Understanding the chemical nature and origin of these inhibitors is the first step toward developing effective protocols for their removal or neutralization, thereby enhancing the reliability of PCR-based assays in stool research.
Frequently Asked Questions
What are the most common PCR inhibitors found in stool samples?
The primary PCR inhibitors in stool samples include complex polysaccharides, bile salts, and various dietary components. Research has specifically identified:
- Complex polysaccharides: These are frequently derived from plant material in the diet and are a major class of PCR inhibitors in feces [8] [9] [10].
- Bile salts: These digestive components have been specifically studied and shown to partition in aqueous two-phase systems, confirming their role as PCR inhibitors [11].
- Dietary components: The presence of inhibitors correlates with dietary changes. One study found no inhibition in infants younger than 6 months, but inhibition became prevalent in 17% of samples from infants aged 6-24 months who had begun consuming solid foods, suggesting a direct link to diet [12] [13].
How can I detect the presence of PCR inhibitors in my sample?
The most reliable method for detecting inhibitors is to use an internal control. This involves spiking a known quantity of target DNA or RNA (non-competitive control) into the extracted sample nucleic acid and performing amplification. A significant decrease in amplification efficiency or a delay in quantification cycle (Cq) compared to a clean control sample (e.g., spiked water) indicates the presence of inhibitors [12] [13]. Many commercial PCR kits include an internal control for this purpose.
What is the most effective way to remove polysaccharide inhibitors?
A comparative study of DNA extraction methods for intestinal parasite detection found that a commercial kit incorporating a bead-beating step was most effective. The QIAamp PowerFecal Pro DNA Kit (QB) demonstrated a significantly higher PCR detection rate (61.2%) compared to the conventional phenol-chloroform method (8.2%) and a similar kit without bead-beating [14]. This highlights the importance of both chemical lysis and mechanical disruption for efficient removal of inhibitors and access to microbial DNA.
Troubleshooting Guide: Overcoming PCR Inhibition
Problem: Inconsistent or Failed PCR Amplification from Stool DNA
This is a multi-step diagnostic and corrective process. The following workflow outlines a systematic approach to identify and resolve the issue.
Step 1: Confirm Inhibition
As outlined in the FAQ, perform a spike test with an internal control. If inhibition is confirmed, proceed to the following steps.
Step 2: Optimize DNA Extraction
The choice of DNA extraction method is critical. Research demonstrates that methods incorporating silica-based purification and mechanical lysis are highly effective at removing inhibitors.
- Evidence: Silica membranes significantly reduce inhibition rates. One study on respiratory and non-respiratory specimens (including stool) showed that adding a silica membrane purification step reduced the overall PCR inhibition rate from 12.5% to 1.1% [15].
- Protocol: Solid-Phase Extraction with Silica Membranes [16] [15]:
- Cell Lysis: Use a chaotropic salt-based lysis buffer (e.g., containing guanidinium isothiocyanate) to disrupt cells and inactivate nucleases.
- Nucleic Acid Adsorption: Bind the DNA to the silica membrane in the presence of chaotropic salts.
- Washing: Pass wash buffers containing ethanol or competitive agents through the membrane to remove proteins, salts, and other contaminants, including inhibitory polysaccharides.
- Elution: Release the pure nucleic acid in a low-salt buffer or water.
- Recommendation: For stool samples, select a commercial kit designed for fecal DNA extraction that includes a bead-beating step for mechanical disruption of hardy parasite eggs and microbial cells [14].
Step 3: Employ PCR Enhancers
Adding specific compounds to the PCR reaction can neutralize remaining inhibitors.
- Bovine Serum Albumin (BSA): Effectively binds to and neutralizes a range of inhibitors. One study found that the addition of BSA eliminated the effect of inhibitors in stool samples, making all previously inhibited samples positive [12] [13].
- T4 Gene 32 Protein (gp32): This single-stranded DNA-binding protein can stabilize DNA and prevent the action of inhibitors like humic acids [17].
- Other Enhancers: Additives like TWEEN-20 (a detergent), DMSO, and glycerol can also help counteract inhibition by various mechanisms, such as destabilizing secondary structures or protecting the polymerase [17].
The table below summarizes the effectiveness of various enhancers tested in a wastewater study (a similarly complex matrix), providing a reference for expected outcomes [17].
Table 1: Effectiveness of PCR Enhancers in a Complex Matrix
| Enhancer | Concentration Tested | Reported Effect on Cq Value | Mechanism of Action |
|---|---|---|---|
| BSA | 0.1 - 1 µg/µL | No change or slight improvement | Binds to and neutralizes inhibitors |
| T4 gp32 | 50 - 200 ng/µL | No change or slight improvement | Binds single-stranded DNA, stabilizes reaction |
| TWEEN-20 | 0.1 - 1% | No change | Counteracts inhibitory effects on Taq polymerase |
| DMSO | 1 - 10% | No change or slight deterioration | Lowers DNA melting temperature (Tm) |
| Formamide | 1 - 3% | Deterioration | Destabilizes DNA helix |
| Glycerol | 1 - 10% | Deterioration | Protects enzymes from degradation |
Step 4: Dilute the Sample
A simple and often effective strategy is to dilute the extracted nucleic acid. This reduces the concentration of co-eluted inhibitors below their inhibitory threshold.
- Consideration: While a 10-fold dilution is common, it also dilutes the target DNA, which can reduce sensitivity and lead to underestimation of viral or bacterial load, especially when target abundance is low [17]. This method is best used when the target is expected to be at a high concentration.
The Scientist's Toolkit: Key Research Reagent Solutions
Table 2: Essential Reagents for Overcoming PCR Inhibition in Stool
| Reagent / Kit | Function | Key Application Note |
|---|---|---|
| QIAamp PowerFecal Pro DNA Kit | DNA purification via silica membrane & bead-beating | Most effective for diverse intestinal parasites; superior inhibitor removal [14] |
| Bovine Serum Albumin (BSA) | PCR enhancer that binds inhibitors | Easy, cost-effective addition to PCR mix to neutralize inhibitors [12] [13] |
| PEG-Dextran Aqueous Two-Phase System | Sample preparation to partition inhibitors | Separates bacteria (bottom phase) from inhibitors (top phase) [11] |
| Silica Membranes/Columns | Solid-phase nucleic acid extraction | Effectively removes polysaccharides and other contaminants [16] [15] |
| T4 Gene 32 Protein (gp32) | PCR enhancer that binds ssDNA | Protects DNA and counters inhibitors like humic acids [17] |
| Inhibitor Removal Kits | Specifically designed to remove humics, tannins, etc. | Contains column matrix for efficient removal of common environmental inhibitors [17] |
Key Experimental Protocols
This method separates PCR inhibitors from bacterial cells prior to DNA extraction.
- Prepare the System: Create an aqueous two-phase system with final concentrations of 8% (w/w) PEG 4000 and 11% (w/w) Dextran 40 in your fecal sample suspension.
- Mix and Separate: Vortex the mixture thoroughly and then centrifuge it to achieve phase separation.
- Collect Phase: The PEG-rich top phase will concentrate most PCR inhibitors (like bile salts), while the bacterial cells partition to the dextran-rich bottom phase and interface.
- Proceed with DNA Extraction: Use the bottom phase for your standard DNA extraction protocol (e.g., with a silica-based kit). This method has been shown to improve PCR detection sensitivity by 3-5 orders of magnitude for H. pylori in inoculated fecal samples.
This protocol validates your PCR results by detecting the presence of inhibitors.
- Extract Nucleic Acid: Perform your standard DNA/RNA extraction from the stool sample.
- Spike the Sample: Take an aliquot of the eluted nucleic acid and spike it with a known amount of a non-competitive control (e.g., purified virus RNA or a plasmid containing a unique target sequence).
- Run Parallel PCR: Amplify the spiked sample and a positive control (the same amount of spike added to clean water) using the same PCR conditions.
- Analyze Results: A significant increase in Cq value (e.g., >3 cycles) or a failure to amplify in the spiked sample compared to the positive control indicates the presence of PCR inhibitors in the extracted nucleic acid.
Frequently Asked Questions (FAQs)
What are the most common sources of PCR inhibitors in stool samples? Stool samples are particularly challenging as they contain a complex mixture of undigested food, bile salts, bilirubin, complex polysaccharides, and various bacteria. Furthermore, parasites themselves can be a source of inhibition due to their difficult-to-lyse structures, such as strong eggshells and hard, sticky cuticles [14].
What are the core molecular mechanisms by which inhibitors disrupt PCR? PCR inhibitors interfere with amplification through two primary mechanisms:
- Interaction with the DNA Template: Some inhibitors bind directly to single or double-stranded DNA, making the template unavailable for the polymerase [18].
- Interference with DNA Polymerase: Inhibitors can degrade DNA polymerase, bind to it reversibly, or reduce the availability of essential co-factors like Mg2+ ions, which are crucial for polymerase activity [18].
Why can a sample positive by microscopy yield a false-negative PCR result? This is a common issue caused by PCR inhibitors. Even if intact parasites or their DNA are present in the sample (visible under a microscope), co-purified inhibitors can prevent the PCR reaction from proceeding, leading to a false negative. This underscores the importance of effective DNA extraction and inhibitor removal [14].
How can I verify that my PCR failure is due to inhibition? The most reliable method is a spike test (or inhibition test). After extracting DNA, add a known quantity of a control DNA template (e.g., a plasmid with a specific target gene) to your sample's extracted DNA and run a PCR. If the control DNA fails to amplify, it indicates the presence of PCR inhibitors in your sample. If it amplifies successfully, then the original negative result is likely a true negative [14].
Troubleshooting Guide: Resolving PCR Inhibition
Problem: Consistent PCR Failure with Stool Samples
Potential Cause: The DNA extraction method is inefficient at lysing hardy parasite structures (e.g., Ascaris eggs) and/or removing common stool-derived inhibitors.
Solutions:
- Optimize your DNA Extraction Protocol: Incorporate a mechanical disruption step. A study comparing methods found that a phenol-chloroform protocol with a bead-beating step (PB) yielded ~4 times more DNA than a kit without one. However, for the highest detection rates, a specialized kit like the QIAamp PowerFecal Pro DNA Kit (QB), which includes inhibitor removal technology, is recommended [14].
- Use a Kit Designed for Inhibitor-Rich Samples: Commercial kits are optimized for this purpose.
- QIAamp PowerFecal Pro DNA Kit (QB): In a comparative study, this kit showed the highest PCR detection rate (61.2%) for a range of intestinal parasites, outperforming other methods [14].
- PowerClean DNA Clean-Up Kit: Another study specifically evaluating inhibitor removal found this kit and the DNA IQ System to be very effective at removing a wide array of known inhibitors, leading to more complete STR profiles [19] [20].
- Modify the PCR Reaction:
- Increase DNA Polymerase Concentration: Using a higher concentration of a robust, inhibitor-resistant DNA polymerase can sometimes overcome mild inhibition [18].
- Add Bovine Serum Albumin (BSA): BSA is known to mitigate the effects of various PCR inhibitors, particularly in samples like blood, and can be a valuable additive [18].
- Dilute the DNA Template: A simple dilution of the extracted DNA (e.g., 1:5 or 1:10) can reduce the concentration of inhibitors to a level that no longer affects the reaction. However, this also dilutes the target DNA, so it is not suitable for low-copy-number samples [20].
Quantitative Comparison of DNA Extraction Methods for Stool
The following table summarizes key quantitative findings from a study comparing four DNA extraction methods for the PCR detection of intestinal parasites in 85 stool samples [14].
| Method | Description | Relative DNA Yield | PCR Detection Rate | Key Findings |
|---|---|---|---|---|
| P | Phenol-Chloroform | ~4x higher | 8.2% | Lowest detection rate; only detected S. stercoralis. |
| PB | Phenol-Chloroform + Bead-Beating | ~4x higher | Not Specified | High yield, but detection rate lower than QB. |
| Q | QIAamp Fast DNA Stool Mini Kit | Baseline | Not Specified | Standard kit without specialized inhibitor removal. |
| QB | QIAamp PowerFecal Pro DNA Kit | Baseline | 61.2% | Highest detection rate; effective for all parasites tested. |
Experimental Protocol: DNA Extraction with Bead-Beating and Inhibitor Removal
This protocol is adapted from the methods described in the search results for effectively handling tough parasite cysts and inhibitor-rich stool samples [14].
Title: Protocol for DNA Extraction from Stool Samples Using Mechanical Lysis and Silica-Binding
Principle: This method uses mechanical disruption via bead-beating to break down sturdy parasitic structures, followed by chemical lysis and the binding of DNA to a silica membrane in the presence of reagents that wash away PCR inhibitors.
Materials:
- QIAamp PowerFecal Pro DNA Kit (QIAGEN) or equivalent.
- 0.5 mm glass beads (sterile)
- Microcentrifuge tubes (2 mL)
- Vortex mixer with horizontal (tube-lying) attachment
- Microcentrifuge
- Ethanol (96-100%)
- Stool sample preserved in 70% ethanol
Procedure:
- Sample Preparation: Wash approximately 200 mg of stool sample preserved in 70% ethanol three times with sterile distilled water to remove the preservative. Aliquot 200 mg into a 2 mL microcentrifuge tube.
- Mechanical Lysis: Add 250 mg of sterile 0.5 mm glass beads and 400-600 µL of lysis buffer (from the kit, or a standard lysis solution with proteinase K) to the tube.
- Homogenization: Secure the tubes in a horizontal vortex adapter and vortex at maximum speed for 10 minutes, or until the stool sample is fully homogenized.
- Thermal Lysis: Incubate the homogenized mixture at 65°C for 10-30 minutes, then at 95°C for 5-10 minutes to complete the lysis and inactivate proteinase K and other enzymes.
- Inhibitor Removal & DNA Binding: Follow the specific kit instructions. Typically, this involves transferring the supernatant to a new tube, adding a binding solution, and loading the mixture onto a silica membrane spin column. Contaminants and inhibitors are washed away through a series of centrifugation steps with wash buffers containing ethanol.
- DNA Elution: Elute the pure, inhibitor-free DNA from the membrane using a low-salt buffer or nuclease-free water (50-100 µL).
Molecular Pathways of PCR Inhibition
The following diagram illustrates the key pathways through which common inhibitors disrupt the PCR process.
Experimental Workflow for Overcoming Inhibition
This workflow outlines a systematic, evidence-based approach to diagnosing and solving PCR inhibition in stool sample research.
Research Reagent Solutions
The following table details key reagents and kits essential for effective DNA extraction and inhibition removal in stool sample research.
| Reagent / Kit | Function & Rationale |
|---|---|
| QIAamp PowerFecal Pro DNA Kit | A comprehensive solution for simultaneous mechanical and chemical lysis, and removal of PCR inhibitors from difficult stool samples via a silica membrane [14]. |
| PowerClean DNA Clean-Up Kit | Used as a post-extraction clean-up step to specifically remove a wide range of known PCR inhibitors (humic acid, hematin, etc.) from existing DNA extracts [19] [20]. |
| Bovine Serum Albumin (BSA) | An additive to the PCR master mix that binds to and neutralizes certain classes of inhibitors, preventing them from interfering with the DNA polymerase [18]. |
| Proteinase K | A broad-spectrum serine protease used during lysis to degrade contaminating proteins and nucleases, facilitating better DNA release and purity [14]. |
| Glass Beads (0.5 mm) | Used for mechanical disruption (bead-beating) to break open resilient parasitic cysts, spores, and eggshells that are resistant to chemical lysis alone [14]. |
| Inhibitor-Resistant DNA Polymerase | Engineered polymerases that are more tolerant to common inhibitors found in complex samples, providing an additional layer of protection against PCR failure [18]. |
How can I tell if my stool sample PCR is inhibited?
Inhibition in qPCR can be detected by analyzing both the quantitative cycle (Cq) values and the shape of the amplification curves. Key indicators include:
- Delayed Cq Values: A consistent increase in Cq values across samples, including controls, suggests general inhibition. This can be confirmed using an Internal PCR Control (IPC); if the IPC Cq is also delayed, inhibition is likely [21] [22].
- Abnormal Amplification Curves: Curves may appear flattened, lack a clear exponential phase, or fail to cross the detection threshold. This can indicate interference with the DNA polymerase or fluorescence detection [22].
- Reduced Amplification Efficiency: When creating a standard curve from serial dilutions, an efficiency outside the ideal 90–110% range (slope steeper than -3.1 or shallower than -3.6) suggests inhibition is affecting the reaction kinetics [21] [22].
The table below summarizes these key indicators and their interpretations.
Table: Key Indicators of PCR Inhibition in qPCR
| Indicator | Observation | Possible Interpretation |
|---|---|---|
| Cq Shift | Delayed Cq in test samples and Internal PCR Control (IPC) | General inhibition affecting polymerase activity or primer binding [21] [22] |
| Amplification Efficiency | Standard curve slope outside -3.1 to -3.6 range | Inhibition skewing reaction kinetics, leading to underestimation [21] |
| Curve Morphology | Flattened curve, low signal, or failure to reach threshold | Fluorescence quenching or severe polymerase inhibition [22] |
What does the data show about inhibition in stool samples?
Stool samples are a complex matrix known to contain PCR inhibitors. Research specifically on infant stool samples has quantified this challenge.
One study found that inhibitors were present in a significant proportion of samples from 3- to 24-month-old children, with 12% showing complete inhibition and 19% showing partial inhibition [12]. A striking finding was that inhibition was age-related: none of the samples (0/31) from infants younger than 6 months showed inhibition, compared to 17% of samples (13/77) from older infants (6-24 months), suggesting a link to dietary changes away from exclusive breastfeeding [12].
The table below summarizes the quantitative findings from this study.
Table: PCR Inhibition in Infant Stool Samples [12]
| Age Group | Sample Size | Complete Inhibition | Partial Inhibition | No Inhibition |
|---|---|---|---|---|
| < 6 months | 31 | 0% (0) | 0% (0) | 100% (31) |
| 6-24 months | 77 | ~17% (13) | ~19% (21) | ~64% (49) |
| Total | 108 | ~12% (13) | ~19% (21) | ~69% (74) |
What is a proven method to overcome inhibition in stool samples?
The addition of Bovine Serum Albumin (BSA) to the reaction mixture is a well-documented and effective method for relieving inhibition in stool samples and other complex matrices.
- Protocol from Stool Sample Study: In the study of infant stool samples, the addition of BSA directly to the cDNA and PCR reactions completely eliminated the inhibitory effect, making all previously inhibited samples positive [12].
- Mechanism of Action: BSA acts by binding to a variety of inhibitory compounds present in samples, such as phenolics, humic acids, and tannins. It can also serve as a competitive target for proteinases that might degrade the DNA polymerase [23].
- Validation in High-Throughput Settings: The efficacy of BSA is not limited to stool. A recent large-scale study on buccal swab samples, which can also suffer from sporadic inhibition, found that incorporating BSA into the PCR mix significantly improved robustness, lowering the assay failure rate to 0.1% across 1,000,000 samples [24].
Other additives have also been evaluated for relieving inhibition in complex environmental samples like wastewater, which shares some inhibitory components with stool. These include T4 gene 32 protein (gp32), dimethyl sulfoxide (DMSO), and non-ionic detergents like Tween-20 [17] [23].
How do PCR inhibitors actually work?
PCR inhibitors disrupt the amplification process through several distinct mechanisms. The following diagram illustrates the primary points of interference within the PCR workflow.
What are the key reagent solutions for tackling inhibition?
A combination of robust reagents and specific additives is crucial for successful PCR in the presence of inhibitors. The following table lists essential solutions for your toolkit.
Table: Research Reagent Solutions for Overcoming PCR Inhibition
| Solution | Function / Mechanism | Example Context |
|---|---|---|
| Bovine Serum Albumin (BSA) | Binds to a wide range of inhibitors (e.g., phenolics, humic acids); acts as a competitive target for proteinases [12] [23]. | Stool samples [12], buccal swabs [24]. |
| T4 Gene 32 Protein (gp32) | A single-stranded DNA-binding protein that stabilizes DNA and can also relieve inhibition, potentially by protecting the polymerase [17] [23]. | Wastewater samples [17]. |
| Inhibitor-Tolerant Polymerase | Specially engineered or selected DNA polymerases with higher affinity for DNA and inherent resistance to common inhibitors [23] [21]. | Blood, soil, and plant-derived samples [21]. |
| Organic Solvents (DMSO, Formamide) | Destabilize DNA secondary structures, lower melting temperature, and can enhance specificity, helping in complex templates [17] [23]. | Wastewater, GC-rich templates [17]. |
| Non-Ionic Detergents (Tween-20) | Stimulate Taq DNA polymerase activity and can counteract inhibitory substances [17] [23]. | Fecal samples, wastewater [17]. |
Optimized Workflows: From Sample Collection to Amplification
Best Practices in Sample Collection and Storage to Preserve Nucleic Acid Integrity
This technical support guide provides detailed protocols and troubleshooting advice to help researchers overcome challenges in nucleic acid preservation, specifically within the context of preventing PCR inhibition in stool sample research.
Frequently Asked Questions (FAQs)
1. What is the most critical factor to prevent RNA degradation during sample collection? The most critical step is immediate sample stabilization to halt the activity of ubiquitous and stable RNase enzymes. This can be achieved by flash-freezing samples in liquid nitrogen or using commercial stabilization reagents immediately upon collection. For RNA, the single-stranded structure and the presence of a 2'-hydroxyl group make it particularly susceptible to degradation by RNases and hydrolysis, especially at elevated temperatures or humidity [25].
2. How can I prevent the introduction of RNase contamination during extraction? Establishing a dedicated RNase-free workspace is essential. Key practices include:
- Regularly decontaminating work surfaces with RNase-inactivating reagents.
- Using certified RNase-free, disposable plasticware and pipette tips.
- Wearing gloves and replacing them frequently.
- Using nuclease-free water and reagents [25].
3. What are the best long-term storage conditions for purified nucleic acids? For long-term storage, purified DNA and RNA should be stored at -70 °C to -80 °C. It is crucial to divide the nucleic acids into small single-use aliquots to avoid repeated freeze-thaw cycles, which cause degradation. DNA can be stored in TE buffer (Tris-EDTA), where the EDTA chelates metal ions to inhibit nucleases. For even greater long-term stability, especially in the face of equipment failure, storage in the vapor phase of liquid nitrogen (below -150 °C) is optimal [25] [26] [27].
4. My PCR from stool samples shows no product or poor yield. What could be wrong? This is a common symptom of PCR inhibition or poor nucleic acid integrity. Please refer to the troubleshooting table below for a systematic analysis.
Troubleshooting Guide: PCR Failure in Stool Sample Research
Table 1: Common issues, causes, and solutions for PCR amplification from stool samples.
| Observation | Possible Cause | Recommended Solution |
|---|---|---|
| No Product or Weak Yield | Poor DNA/RNA integrity due to degradation during collection/storage. | Flash-freeze or chemically stabilize (e.g., with lysis buffer) samples immediately upon collection [25] [28]. Avoid freeze-thaw cycles. |
| Presence of PCR inhibitors (e.g., complex polysaccharides, bile salts, phenolic compounds) from stool. | Re-purify the DNA. Use ethanol precipitation or a dedicated cleanup kit to remove inhibitors [7] [29]. | |
| Insufficient DNA polymerase activity due to inhibitors. | Use DNA polymerases known for high processivity and tolerance to inhibitors [7]. Increase the amount of polymerase slightly. | |
| Suboptimal primer design or concentration. | Verify primer specificity and recalculate Tm. Optimize primer concentration, typically between 0.1–1 µM [7] [29]. | |
| Multiple or Non-Specific Bands | Primer annealing temperature is too low. | Increase the annealing temperature in 1-2°C increments. Use a hot-start polymerase to prevent activity at room temperature [29]. |
| Excess Mg2+ concentration. | Optimize the Mg2+ concentration in the PCR reaction, testing in 0.2–1 mM increments [29]. | |
| Contamination with exogenous DNA. | Use dedicated pipettes and workspace. Use filter tips and set up reactions in a UV-treated hood [25] [29]. |
Experimental Protocol: Preserving Rumen Microbiome Samples for DNA Analysis
The following protocol, adapted from a high-throughput study on rumen samples, provides a robust method for preserving complex microbial communities (like those in stool) for subsequent DNA extraction and PCR analysis [28].
Objective: To preserve microbial community DNA in complex biological samples at the point of collection, preventing degradation and changes in community profile.
Materials:
- TNx2 Lysis Buffer: 800 mM NaCl, 20 mM Tris HCl, 1.2% SDS, 200 mM EDTA, pH 8.0.
- GHx2 Lysis Buffer: 2 M Guanidine Hydrochloride (GuHCl), 200 mM Tris HCl, 6% Tween-20, 1% Triton X-100, 40 mM EDTA, pH 8.0.
- 100% Ethanol.
- RNase-free, screw-cap vials.
- Personal protective equipment (gloves, lab coat).
Procedure:
- Preparation: Dispense preservative solutions (TNx2, GHx2, or Ethanol) into labeled, sterile screw-cap vials prior to sample collection.
- Sample Collection: Collect the stool (or rumen) sample using a standardized procedure.
- Preservation: Immediately add the sample to the preservative vial at the specified ratio:
- For TNx2 and GHx2, use a 1:1 ratio of sample to preservative.
- For Ethanol, use a 1:2 ratio of sample to preservative [28].
- Mixing: Secure the cap and mix the vial thoroughly by inversion to ensure the sample is fully immersed and homogenous with the preservative.
- Storage: Store the preserved samples at room temperature for transport. For long-term storage, keep at -80°C. The lysis buffers (TNx2, GHx2) will lyse cells and inactivate nucleases upon contact, stabilizing the microbial DNA profile.
Workflow: Sample Collection to PCR
The diagram below illustrates the critical steps from sample collection to successful PCR amplification, highlighting key decision points to preserve nucleic acid integrity.
The Scientist's Toolkit: Essential Reagents for Nucleic Acid Preservation
Table 2: Key reagents and materials for effective sample preservation and handling.
| Reagent/Material | Function | Application Notes |
|---|---|---|
| Lysis Buffers (TNx2/GHx2) | Cell lysis and nuclease inactivation at point of collection. Contains surfactants (SDS) and chaotropic salts (GuHCl) [28]. | Ideal for high-throughput field sampling. Compatible with downstream DNA extraction kits. |
| RNA Stabilization Reagents | Chemically stabilizes RNA immediately, halting degradation. | Crucial for gene expression studies. Products like RNAprotect are sample-specific [25]. |
| Silica Gel | Rapidly desiccates tissue samples by absorbing moisture. | A low-cost method for preserving DNA in plant and tissue samples at room temperature [27]. |
| TE Buffer (Tris-EDTA) | Long-term storage buffer for purified DNA. Tris maintains pH, EDTA chelates divalent cations to inhibit nucleases [25] [26]. | Standard storage buffer for DNA aliquots at -20°C or -80°C. |
| Guanidine Isothiocyanate | Powerful chaotropic salt that denatures proteins and RNases. | A key component in many commercial RNA/DNA extraction kits [25]. |
| EDTA (Ethylenediaminetetraacetic acid) | Chelates divalent cations (e.g., Mg2+), which are co-factors for many nucleases [25]. | Added to storage buffers and lysis solutions to prevent metal-catalyzed degradation. |
Comparative Analysis of DNA/RNA Extraction Kits for Complex Stool Matrices
Molecular analysis of stool samples is fundamental to advancements in genomics, microbiology, and drug development. However, the complex composition of stool, which includes PCR inhibitors like bile salts, complex polysaccharides, and humic substances, poses a significant challenge to obtaining high-quality nucleic acids. This technical support center is designed to help researchers overcome these hurdles by providing evidence-based troubleshooting guides, detailed protocols, and curated reagent solutions to ensure reliable PCR amplification from complex stool matrices.
FAQs: Addressing Common Experimental Challenges
1. Why is my PCR failing even after successful DNA extraction from stool?
PCR failure after extraction is frequently caused by co-purified inhibitors. Stool samples contain organic (e.g., bile pigments, urea, complex polysaccharides) and inorganic (e.g., calcium) compounds that can inhibit DNA polymerases [30]. To resolve this:
- Dilute the Template: A 10- to 100-fold dilution of your DNA template can often reduce inhibitor concentration to a level that no longer affects the reaction [30] [7].
- Re-purify the DNA: Use a DNA clean-up kit or perform ethanol precipitation to remove contaminants [31] [7].
- Use Inhibitor-Tolerant Enzymes: Select polymerases specifically formulated for high tolerance to common inhibitors found in stool, soil, and plants [30] [7].
2. My RNA extracts from stool show low yield and purity. What steps can I take to improve this?
RNA isolation from stool is challenging due to high RNase activity and inhibitory substances.
- Stabilize Immediately: Upon collection, solubilize samples in a dedicated lysis buffer (e.g., TRIzol) or a stabilization reagent (e.g., DNA/RNA Shield) that inactivates RNases. This is critical for preserving RNA integrity [32].
- Ensure Complete Lysis: Pair your lysis buffer with a mechanical lysis step, such as bead beating, to efficiently break down tough microbial cell walls and stool particulates. Incomplete lysis leads to low yield and can cause column clogging [32].
- Eliminate DNA Contamination: Use RNA extraction kits that include an on-column DNase I treatment step. This removes DNA carryover without requiring additional clean-up steps, ensuring your RNA is suitable for sensitive downstream applications like RT-qPCR [32].
3. How does the choice of DNA extraction method affect the detection of diverse intestinal parasites?
Different parasites present different lysis challenges, from the fragile cells of protozoa to the tough eggshells of helminths. The DNA extraction method must be robust enough to handle this variety. A 2022 study compared four methods for extracting DNA from human stool samples infected with various parasites [33]. The key findings are summarized below:
Table 1: Comparison of DNA Extraction Methods for Parasite Detection via PCR
| Extraction Method | Description | Average DNA Yield (ng/μL) | PCR Detection Rate | Key Findings |
|---|---|---|---|---|
| Phenol-Chloroform (P) | Conventional chemical lysis and extraction. | ~200 | 8.2% | Low detection rate; only detected S. stercoralis. |
| Phenol-Chloroform + Bead Beating (PB) | Chemical lysis with mechanical disruption. | ~200 | 45.9% | Significantly improved detection over method P. |
| QIAamp Fast DNA Stool Mini Kit (Q) | Silica-column based kit. | ~50 | 47.1% | Better detection than P, but lower yield. |
| QIAamp PowerFecal Pro DNA Kit (QB) | Silica-column kit with bead-beating step. | ~50 | 61.2% | Highest detection rate; effective for all parasites tested. |
The study concluded that the QIAamp PowerFecal Pro DNA Kit (QB), which incorporates a bead-beating step, was the most effective method for the comprehensive PCR-based diagnosis and monitoring of intestinal parasites [33].
4. For a large-scale ecosystem study requiring DNA from soil, invertebrates, and feces, which single DNA extraction kit is most suitable?
A 2024 study aimed to identify a single kit suitable for diverse sample types from a terrestrial ecosystem [34]. After evaluating five commercial kits across bulk soil, rhizosphere soil, invertebrate, and mammalian feces samples, the NucleoSpin Soil kit (MNS) was associated with the highest alpha diversity estimates and provided the highest contribution to overall sample diversity when compared to computationally assembled reference communities. The study recommended this kit for any large-scale microbiota study of terrestrial ecosystems where multiple sample matrices are processed [34].
Experimental Protocols for Key Cited Studies
Protocol 1: Evaluating DNA Extraction Kits for Wildlife Feces
This protocol is adapted from a 2024 comparative study of extraction kits for wildlife feces collected from the environment [35] [36].
1. Sample Preparation:
- Collect wildlife fecal samples and store them appropriately (e.g., frozen or in stabilization buffer).
- Dry homogenize the samples with physical mixing to create a consistent starting material.
- Split the homogenized sample into 100 mg (± 5 mg) subsamples for parallel extraction with different kits.
2. Nucleic Acid Extraction:
- Select the kits to be compared. The cited study evaluated four DNA kits, two DNA/RNA co-extraction kits, and one RNA-only kit.
- Standardize Bead-Beating: Perform a standardized bead-beating step across all methods to ensure consistent mechanical lysis.
- Follow the manufacturer's recommended protocol for each kit for all subsequent steps.
3. Extraction Success Metrics:
- Concentration: Quantify nucleic acids using a spectrophotometer or fluorometer.
- Integrity: Analyze extracts using a system like Agilent TapeStation to determine the DNA Integrity Number (DIN) or RNA Integrity Number (RIN).
- PCR Inhibition Test: Use a qPCR assay spiked with a synthetic internal control. Compare the Ct values of reactions using sample elutions to a reaction with nuclease-free water. A significant delay in Ct indicates the presence of PCR inhibitors [35].
Protocol 2: Efficient DNA Extraction from Intestinal Parasites in Human Stool
This detailed protocol is based on the 2022 study that identified the QIAamp PowerFecal Pro DNA Kit (QB) as the most effective method [33].
1. Sample Pretreatment:
- Take 200 mg of stool sample preserved in 70% ethanol.
- Wash the sample three times with sterile distilled water to remove ethanol and other soluble inhibitors.
- Aliquot the washed sample into a 2 mL microcentrifuge tube.
2. DNA Extraction using the QIAamp PowerFecal Pro DNA Kit (QB):
- Follow the manufacturer's instructions precisely. The key steps are visualized below:
3. Downstream Analysis:
- Quantification and Purity Check: Measure DNA concentration and purity using a spectrophotometer (e.g., A260/A280 and A260/A230 ratios).
- PCR Amplification: Perform PCR with primers specific to your target parasites (e.g., Blastocystis sp., Ascaris lumbricoides, Strongyloides stercoralis).
- Inhibitor Check via Spike Test: For samples that are PCR-negative, add a known amount of a control plasmid to the extracted DNA and re-run PCR. If the plasmid fails to amplify, it confirms the presence of residual PCR inhibitors [33].
Essential Workflow for Reliable Stool NA Extraction
The following diagram synthesizes the critical steps, from sample collection to downstream analysis, for obtaining reliable nucleic acids from complex stool samples, integrating best practices from the cited literature.
The Scientist's Toolkit: Key Research Reagent Solutions
Table 2: Essential Reagents and Kits for Nucleic Acid Extraction from Stool
| Product Name / Category | Primary Function | Key Application Note |
|---|---|---|
| QIAamp PowerFecal Pro DNA Kit (QB) [33] | DNA extraction from stool and soil. | Highly effective for lysing diverse parasites (helminths and protozoa); includes bead-beating for mechanical lysis. |
| NucleoSpin Soil Kit (MNS) [34] | DNA extraction from soil and environmental samples. | Recommended for large-scale ecosystem studies involving multiple sample types (soil, feces, invertebrates). |
| ZymoBIOMICS DNA/RNA Miniprep Kits [32] | Co-extraction of DNA and RNA from complex samples. | Designed for feces, soil, and biofilm; includes on-column DNase treatment for RNA. |
| DNA/RNA Shield [32] | Sample stabilization reagent. | Inactivates nucleases at collection, allowing ambient transport and storage; preserves nucleic acid integrity. |
| Inhibitor-Tolerant DNA Polymerases [30] [7] | PCR amplification from difficult samples. | Essential for amplifying DNA extracts that may contain residual inhibitors from stool. |
| Silica Magnetic Beads [37] | Solid-phase nucleic acid purification. | Enables rapid, automatable protocols; performance depends on binding/elution pH and mixing mode. |
The Role of Bead-Beating and Mechanical Lysis in Efficient Cell Disruption
Troubleshooting Guides
Common Problems and Solutions in Mechanical Cell Lysis
| Problem | Possible Cause | Solution |
|---|---|---|
| Incomplete Lysis of Resistant Microbes | Insufficient disruption energy or time; inappropriate bead size [38] [39]. | Increase bead-beating time in cycles (e.g., 5 cycles of 1 min with 5 min rest) [40]. Use smaller (e.g., 100-μm) beads for tough Gram-positive bacteria [38]. Validate protocol with a standardized microbial community standard [40]. |
| PCR Inhibition | Co-extraction of inhibitors (e.g., humic acids, bile salts, collagen) from sample matrix [17] [19]. | Use an inhibitor removal kit (e.g., PowerClean DNA Clean-Up Kit or DNA IQ System) [19]. Add PCR enhancers like BSA (0.1-0.5 μg/μL) or TWEEN-20 (0.1-1%) to the reaction [17]. Perform a 10-fold dilution of the DNA extract to dilute inhibitors [17]. |
| Low DNA Yield | Inefficient lysis; excessive heat or shear forces degrading DNA [40] [39]. | Ensure the correct bead-to-sample ratio and use the recommended bead material [40]. Use cooling intervals during bead-beating to prevent heat buildup [40]. Confirm lysis efficiency using a quantitative method like acid/HPLC [41]. |
| Biased Microbiome Profiles | Over-representation of easy-to-lyse microbes (e.g., Gram-negatives) due to non-uniform lysis [40] [39]. | Adopt a stochastic mechanical lysis method (bead-beating) over purely chemical or enzymatic methods [40]. Use a validated, high-intensity bead-beating protocol that is sufficient for tough spores and fungi [40] [39]. |
Optimizing Bead-Beating Protocols for Different Sample Types
| Sample Type | Challenge | Recommended Bead-Beating Parameters | Supported by |
|---|---|---|---|
| Stool Samples | Complex matrix with high levels of PCR inhibitors and diverse microbial community [17] [42]. | Intensity: High (e.g., 40 min total on a Vortex Genie with adapter) [40].Beads: Zirconia/Silica beads.Post-Processing: Use of inhibitor removal columns or enhancers like BSA is critical [17] [19]. | [17] [40] [42] |
| Gram-Positive Bacteria & Spores | Thick, tough cell walls resistant to chemical lysis [38] [39]. | Intensity: High. Protocols for Bacillus spores and Mycobacterium require several minutes of beating [38].Bead Size: 100-μm diameter beads are most effective [38]. | [38] [39] |
| Fungi | Highly resistant cell walls, often leading to severe underrepresentation [40] [39]. | Intensity: Very High. Fungal lysis requires more energy than Gram-negative bacteria [39].Protocol: Consider protocols with multiple cycles of beating and rest (e.g., 5 min on, 5 min rest, repeated 4x) [40]. | [40] [39] |
| General Microbiome Profiling | Avoiding bias between easy-to-lyse and tough-to-lyse organisms [40]. | Intensity: Use benchmarked protocols validated with a microbial community standard [40].Method: Bead-beating is the gold standard for stochastic, unbiased lysis [40]. | [40] |
Frequently Asked Questions (FAQs)
Why is mechanical lysis like bead-beating necessary for stool sample analysis?
Stool samples contain a complex mix of microorganisms, including tough-to-lyse Gram-positive bacteria (e.g., Clostridium spp.) and fungal elements. Purely chemical or enzymatic lysis methods are often insufficient for these resistant cells, leading to a biased microbial profile that over-represents easy-to-lyse Gram-negative bacteria [40] [39]. Bead-beating provides a stochastic mechanical force that ensures more uniform disruption across diverse cell types, which is critical for accurate microbiome analysis [40]. Furthermore, efficient lysis is the first step in liberating enough pure DNA for subsequent PCR, helping to overcome challenges related to PCR inhibition from the complex stool matrix [17].
How does inefficient lysis contribute to PCR inhibition?
Inefficient lysis is a dual-faceted problem. First, it fails to release sufficient nucleic acids from resistant cells, directly reducing the available template for PCR [39] [41]. Second, and perhaps less obviously, it can lead to an over-reliance on harsher chemical treatments or larger sample volumes to compensate for low yield. This increases the probability of co-purifying potent PCR inhibitors present in the sample matrix, such as humic acids, bile salts, and complex polysaccharides [17] [19]. Therefore, efficient and robust mechanical lysis is a key first step in minimizing downstream inhibition.
My PCR results are inconsistent even after bead-beating. What could be wrong?
Inconsistencies can arise from several factors related to the lysis process itself or subsequent steps:
- Non-Uniform Lysis: If the bead-beating protocol is not optimized or validated, it may lyse cells inconsistently across samples, leading to variable DNA template quantities [40] [39].
- Inhibitor Carryover: Bead-beating can liberate intracellular components and release additional inhibitors from the sample matrix. If not properly removed post-lysis, these can cause intermittent PCR failure [17] [19].
- Protocol Variability: Small changes, such as the number and weight of tubes in the bead beater, can significantly impact lysis efficiency and introduce bias [40]. Always follow validated protocols precisely.
Are there methods to quantitatively measure lysis efficiency?
Yes, traditional methods like cell counting or measuring total DNA yield are indirect and can be inaccurate [41]. A more direct method, the acid/HPLC technique, has been developed to precisely assess disruption efficiency. This method involves treating a portion of the bacterial sample with mild acid and alkali to depurinate DNA and hydrolyze RNA. The released purines (adenine and guanine) are then quantified using HPLC. By comparing the amount of DNA released by the lysis method to the total DNA in the sample determined by acid/HPLC, the true efficiency of the DNA extraction procedure can be calculated [41].
The Scientist's Toolkit: Essential Reagents and Kits
| Item | Function in Lysis and Inhibition Control | Examples / Notes |
|---|---|---|
| Zirconia/Silica Beads (100μm) | Optimal for disrupting tough cell walls via high-shear forces during bead-beating [38]. | Acid-washed beads are recommended to minimize contaminating DNA [38]. |
| Inhibitor Removal Kits | Specifically designed to remove common PCR inhibitors (humic acids, collagen, bile salts, etc.) from complex sample extracts [19]. | PowerClean DNA Clean-Up Kit and DNA IQ System have been shown effective for forensic and environmental samples [19]. |
| PCR Enhancers | Compounds added to the PCR reaction to counteract the effects of lingering inhibitors by stabilizing the polymerase or binding inhibitors [17]. | BSA (0.1-0.5 μg/μL): Binds inhibitors [17].TWEEN-20 (0.1-1%): Counteracts inhibitors of Taq polymerase [17].DMSO/Formamide: Lower DNA melting temperature to aid amplification [17]. |
| Standardized Microbial Community | A defined mix of easy-to-lyse and tough-to-lyse microbes used to benchmark and validate lysis protocols for bias [40]. | The ZymoBIOMICS Microbial Community Standard is used to develop validated, unbiased bead-beating protocols [40]. |
| Lysis-Resistant Surrogates | Internal control organisms (e.g., B. subtilis spores, M. bovis BCG) added to samples to monitor lysis efficiency in each run [38]. | Helps distinguish between lysis failure and PCR inhibition as the cause of a negative result [38]. |
Experimental Workflows and Visual Guides
Diagram: Decision Pathway for Lysis and Inhibition Troubleshooting
Diagram: Integrated Workflow for Unbiased Analysis from Stool Samples
Selecting Robust Polymerases and Master Mixes for Inhibitor-Tolerant PCR
FAQ: Understanding PCR Inhibition in Complex Samples
What are the most common PCR inhibitors found in complex samples like stool? In complex samples, PCR inhibitors originate from various sources. Biological samples like blood contain hemoglobin and immunoglobulin G, while plant and food substances contain polysaccharides, polyphenols, and tannins. Environmental samples like soil and wastewater often contain humic and fulvic acids. Laboratory reagents like SDS, EDTA, and ethanol can also be inhibitory if not completely removed [21]. These compounds interfere with PCR through multiple mechanisms: directly inhibiting DNA polymerase activity, degrading or sequestering nucleic acid templates, or chelating essential co-factors like magnesium ions [4] [17].
How can I detect PCR inhibition in my qPCR results? In quantitative PCR, inhibition manifests through several key indicators: delayed quantification cycle (Cq) values across all samples and controls, poor amplification efficiency (outside the ideal 90-110% range), and abnormal amplification curves that may appear flattened or fail to cross the detection threshold [21]. The use of an internal PCR control is particularly valuable for differentiating between true inhibition and simply low target concentration. If the IPC shows delayed Cq values, inhibition is likely present in the reaction [21].
Why are some DNA polymerases more resistant to inhibitors than others? Different DNA polymerases exhibit varying tolerance to PCR inhibitors due to their structural differences and origins [43]. Research has demonstrated that blending DNA polymerases from different sources can create a synergistic effect that significantly enhances inhibitor resistance beyond what any single polymerase can achieve [43]. Additionally, engineered polymerase variants developed through directed evolution approaches contain specific mutations that stabilize the enzyme's structure or enhance nucleotide binding, making them less susceptible to inhibitor interference [44] [45].
Troubleshooting Guide: Overcoming PCR Inhibition
Problem: Complete PCR Failure or Significantly Reduced Yield with Stool Samples
Potential Causes and Solutions:
Cause: Co-purification of potent PCR inhibitors from stool matrix during DNA extraction.
Cause: Insufficient inhibitor tolerance of the DNA polymerase.
- Solution: Select an inhibitor-resistant DNA polymerase blend or engineered variant. Research shows that replacing standard Taq polymerase with specialized blends can increase complete DNA profiles from 82 to 105 out of 114 forensic samples [43]. Novel variants like Taq C-66 (E818V) and Klentaq1 H101 (K738R) show superior resistance to diverse inhibitors including those from plant and food sources [45].
Cause: Suboptimal reaction composition lacking necessary enhancers.
Problem: Inconsistent Results Between Sample Replicates
Potential Causes and Solutions:
Cause: Incomplete removal of inhibitors during extraction leading to variable inhibitor carryover.
Cause: Non-homogeneous master mix components.
- Solution: Mix all reagent stocks thoroughly before use to eliminate density gradients that may have formed during storage. Prepare master mixes in sufficient volume to accommodate all replicates plus excess to ensure consistency [7].
Comparative Performance Data of Inhibitor-Tolerant PCR Solutions
Table 1: Performance Comparison of DNA Polymerases and Blends in Inhibitory Conditions
| Polymerase Type | Key Features | Inhibitor Resistance | Reported Improvement | Source/Reference |
|---|---|---|---|---|
| ExTaq/PicoMaxx Blend | 1:1 blend of two polymerases | Forensic samples (blood, saliva) | Increased complete profiles from 82 to 105/114 samples; Enabled profiling of 21/25 inhibitory blood stains vs. 2/25 with standard polymerase | [43] |
| Engineered Taq C-66 | E818V point mutation | Blood, humic acid, plant extracts, chocolate | Superior resistance to diverse inhibitors compared to wild-type; Structural mapping suggests enhanced nucleotide binding | [44] [45] |
| Engineered Klentaq1 H101 | K738R point mutation | Black pepper, plant tissues, blood | Intrinsic enzymatic tolerance persisting after purification; Stabilized polymerase-DNA complex | [45] |
| Bst DNA Polymerase | Strand displacement activity, isothermal amplification | Point-of-care testing applications | Robust performance in LAMP applications; Engineering efforts focus on enhancing specificity and inhibitor resistance | [47] |
Table 2: Effectiveness of PCR Enhancers Against Various Inhibitors
| Enhancer | Recommended Concentration | Mechanism of Action | Effective Against | Study Results |
|---|---|---|---|---|
| Bovine Serum Albumin (BSA) | 0.1-0.5 μg/μL | Binds inhibitors, stabilizes enzyme | Humic acids, polyphenols, hematin | Significant improvement in detection of SARS-CoV-2 in wastewater samples [17] |
| T4 Gene 32 Protein (gp32) | 0.1-0.5 μM | Binds single-stranded DNA, prevents secondary structure | Complex sample matrices | Enhanced amplification efficiency in inhibitory wastewater samples [17] |
| Tween-20 | 0.1-1% | Counteracts inhibitory effects on Taq | Fecal samples, complex matrices | Effective relief of inhibition in environmental samples [17] |
| Dimethyl Sulfoxide (DMSO) | 1-5% | Lowers DNA melting temperature | GC-rich templates, secondary structures | Moderate improvement in wastewater viral detection [17] |
Experimental Protocols for Inhibitor-Tolerant PCR
Protocol 1: Live Culture PCR Screening for Inhibitor-Resistant Polymerases
This innovative protocol enables rapid screening of polymerase variants for inhibitor resistance without requiring enzyme purification [45].
Materials:
- Randomly mutagenized Taq or Klentaq1 libraries in expression vectors
- Host bacterial cells (E. coli or X7029)
- PCR reagents: buffer, dNTPs, SYBR Green, primers
- PCR inhibitors for screening (e.g., chocolate, black pepper, blood extracts)
- 96-well PCR plates and thermal cycler with real-time detection
Procedure:
- Transform host bacterial cells with mutagenized polymerase libraries
- Plate transformed cells to obtain single colonies and incubate in 96-well plates containing Amp+ media with 1 mM IPTG for 12-16 hours at 37°C
- Transfer 5 μL of culture from each well to a replica PCR plate containing master mix with rDNA primers, SYBR Green, and challenging inhibitor
- Perform real-time PCR with cycling conditions: 94°C for 10 min, then 40-45 cycles of 94°C for 30 s, 54°C for 40 s, and 70°C for 2 min
- Identify positive clones showing amplification in the presence of inhibitors that inhibit control polymerases
- Sequence ORFs of selected mutants and validate phenotype after purification
Diagram 1: Workflow for screening inhibitor-resistant polymerase variants using live culture PCR.
Protocol 2: Systematic Evaluation of PCR Enhancers for Inhibitory Samples
This protocol provides a standardized approach to evaluate different PCR enhancers for challenging sample types like stool extracts.
Materials:
- Inhibitory DNA samples (e.g., extracted from stool)
- Control DNA (inhibitor-free)
- Standard DNA polymerase
- PCR enhancers: BSA, gp32, DMSO, formamide, Tween-20, glycerol
- qPCR reagents: buffer, dNTPs, primers, probes
Procedure:
- Prepare a base master mix containing all standard PCR components except enhancers
- Aliquot the master mix and add different enhancers at various concentrations:
- BSA: 0.1, 0.25, 0.5 μg/μL
- gp32: 0.1, 0.25, 0.5 μM
- DMSO: 1%, 3%, 5%
- Tween-20: 0.1%, 0.5%, 1%
- Glycerol: 1%, 3%, 5%
- Include a negative control with no enhancer and a positive control with inhibitor-free template
- Add the inhibitory DNA template to all reactions
- Run qPCR with appropriate cycling conditions
- Compare Cq values, amplification efficiency, and curve shape across conditions
- Select the enhancer and concentration providing the best performance with minimal background
Strategic Approach to PCR Inhibition Challenges
Diagram 2: Strategic approach combining sample preparation, polymerase selection, and reaction enhancement to overcome PCR inhibition.
Research Reagent Solutions for Inhibitor-Tolerant PCR
Table 3: Essential Research Reagents for Inhibitor-Tolerant PCR
| Reagent Category | Specific Examples | Function/Application | Considerations |
|---|---|---|---|
| Inhibitor-Resistant Polymerases | GoTaq Endure qPCR Master Mix, ExTaq/PicoMaxx blend, Engineered Taq variants (C-66, H101) | Core amplification enzyme with enhanced tolerance to inhibitors | Select based on specific inhibitor profile; blends often outperform single enzymes [43] [21] [45] |
| PCR Enhancers | BSA (0.1-0.5 μg/μL), T4 gp32 (0.1-0.5 μM), Tween-20 (0.1-1%) | Bind inhibitors or stabilize reaction components | Optimize concentration for specific sample type; BSA particularly effective for humic acids [17] |
| Alternative Amplification Methods | Bst DNA polymerase for LAMP, Digital PCR (ddPCR) | Bypass inhibition through isothermal amplification or partitioning | ddPCR shows higher tolerance to inhibitors due to reaction partitioning [47] [17] |
| Specialized Extraction Kits | Inhibitor removal columns, bead-based homogenization systems | Remove co-purified inhibitors during nucleic acid extraction | Systems like Bead Ruptor Elite provide controlled homogenization while minimizing inhibitor release [46] |
In the molecular analysis of complex sample types like stool, Polymerase Chain Reaction (PCR) inhibition presents a significant challenge, often leading to false-negative results and inaccurate data. Inhibitory substances co-extracted with nucleic acids can disrupt enzyme activity and impede amplification. Within this context, designing assays with short amplicon length has emerged as a critical and powerful strategy for overcoming these limitations, ensuring sensitive and reliable detection, particularly when targeting degraded DNA.
Frequently Asked Questions (FAQs)
Why is amplicon length so critical for PCR success in inhibitory samples?
The length of the DNA fragment you are trying to amplify (the amplicon) is directly related to the probability of the polymerase enzyme successfully copying the entire sequence. In the presence of inhibitors, which can reduce enzyme processivity, shorter amplicons have a much higher chance of being fully amplified.
- Mechanism of Inhibition: Inhibitors can bind to the DNA template, sterically hindering polymerase access, or they can partially disable the enzyme itself, reducing its efficiency. These effects become more pronounced with longer DNA fragments.
- Experimental Evidence: Research has conclusively shown that amplicon size is a dominating factor in susceptibility to inhibition. One study demonstrated that as amplicon size increases, amplification efficiency decreases in the presence of inhibitors. The effect of the DNA sequence itself (e.g., GC content) is less significant than the length of the amplicon [48].
How much does amplicon length impact sensitivity in real-world samples like stool?
The impact can be dramatic. A 2025 study on H. pylori detection in stool samples provides a compelling example. Researchers compared a long amplicon (454 bp) to a short amplicon (148 bp) using nested PCR on the same patient samples.
Table 1: Impact of Amplicon Length on Detection Sensitivity in Stool Samples
| Patient Group | Positive with Long Amplicon (454 bp) | Positive with Short Amplicon (148 bp) |
|---|---|---|
| Symptomatic Patients (n=208) | 6.25% | 51.0% |
| Asymptomatic Volunteers (n=100) | 22.0% | 66.6% |
The data shows that the short amplicon was significantly more sensitive, identifying over 8 times more positive samples in the symptomatic group. The study concluded that stool often contains short fragments of degraded H. pylori DNA, making shorter amplicons essential for reliable detection [49].
What is the optimal amplicon length for challenging samples?
While the ideal length can depend on the specific application and sample type, a general guideline is to design amplicons to be as short as possible while still encompassing the unique target sequence. For qPCR assays, many manufacturers and design guides recommend keeping amplicons below 150 base pairs to achieve optimal PCR efficiency, especially when expecting inhibitors or degraded DNA [50]. For heavily degraded samples, such as forensic evidence or ancient DNA, amplicons of 100 bp or less are often targeted.
Besides length, what other assay design factors help overcome inhibition?
A robust assay design incorporates multiple strategies:
- Internal Amplification Controls (IAC): An IAC is a non-target DNA sequence co-amplified in the same reaction tube. It is critical for distinguishing true target-negative results from false negatives caused by PCR inhibition. If the IAC fails to amplify, the test is invalid due to inhibition, regardless of the target signal [50].
- PCR Enhancers: Reagents like Bovine Serum Albumin (BSA) can bind to inhibitors such as humic acids, preventing them from interfering with the DNA polymerase. Other enhancers include TWEEN-20, DMSO, and glycerol, which can help counteract inhibitory effects [17] [21].
- Inhibitor-Tolerant Master Mixes: Using specialized PCR master mixes formulated with inhibitor-resistant polymerases and buffer components can significantly improve robustness in the presence of common inhibitors found in stool, soil, or blood [21].
Experimental Protocol: Designing & Validating a Short-Amplicon Assay
This protocol outlines the key steps for designing and testing a PCR assay optimized for inhibitory samples like stool.
Step 1: In-Silico Primer Design and Amplicon Optimization
Objective: To design primers that generate a short, specific amplicon. Methodology:
- Select Target Region: Identify a unique, conserved region within your gene of interest.
- Use Design Tools: Utilize online primer design tools (e.g., IDT's PrimerQuest Tool, QIAGEN's GeneGlobe). These tools incorporate bioinformatic calculations to manage factors like cross-reactivity and secondary structure [51] [52].
- Set Amplicon Parameters: In the design software, set the desired amplicon size range. For challenging samples, specify a narrow range of 80-150 bp.
- Check Specificity: Always perform an in-silico check for primer specificity using a tool like NCBI BLAST to ensure they do not bind to non-target sequences [51].
Step 2: Wet-Lab Validation with Inhibitor Spike-In
Objective: To experimentally verify that the short-amplicon assay performs well in the presence of inhibitors. Methodology:
- Sample Preparation: Extract DNA from your sample type (e.g., stool using a kit like QIAamp Fast DNA Stool Mini Kit) [49].
- Inhibition Model: Spike a known quantity of your target DNA (e.g., from a cultured organism) into the extracted nucleic acids. Create a dilution series of this sample to test assay sensitivity.
- Compare Amplicons: Test your new short-amplicon assay alongside any existing longer-amplicon assays on the same diluted, inhibitor-containing samples.
- Quantify Performance: Compare the Cycle quantification (Cq) values and endpoint detection rates between the short and long amplicon assays. The short amplicon should demonstrate lower Cq values and reliable detection at higher dilutions (lower target concentrations) [49] [48].
The following workflow diagrams this optimization and validation process:
Research Reagent Solutions
Table 2: Essential Reagents for Developing Inhibition-Resistant PCR Assays
| Reagent / Tool | Function / Application | Key Consideration |
|---|---|---|
| Inhibitor-Tolerant Master Mix (e.g., GoTaq Endure) | Contains specialized polymerases and buffers for robust amplification in complex matrices like stool. | Designed for consistent performance in the presence of common inhibitors [21]. |
| PCR Enhancers (BSA, gp32, TWEEN-20) | Additives that bind to or neutralize inhibitory substances co-extracted from samples. | Requires optimization of concentration; effectiveness can vary by inhibitor type [17]. |
| Internal Amplification Control (IAC) | Non-target DNA sequence to distinguish true negatives from PCR inhibition. | Must be carefully designed to co-amplify without competing excessively with the primary target [50]. |
| Primer Design Software (e.g., IDT PrimerQuest) | Bioinformatics tool for designing primers with optimized parameters for short, specific amplicons. | Allows customization of ~45 parameters including amplicon size and Tm [51]. |
| Predesigned Assay Databases (e.g., QIAGEN GeneGlobe) | Repository of pre-optimized qPCR/dPCR assays, many with short amplicons. | Saves development time; offers wet-lab validated designs for many human, mouse, and rat targets [52]. |
Overcoming PCR inhibition in complex samples is a multi-faceted challenge, but the strategic design of short amplicons is one of the most effective approaches. By reducing the physical distance the polymerase must travel, shorter targets significantly increase the likelihood of successful amplification when inhibitors are present or when the template DNA is degraded. Coupling short amplicon design with the use of internal controls, PCR enhancers, and robust master mixes provides a comprehensive solution for generating reliable, reproducible, and sensitive molecular data from the most challenging sample types.
Practical Strategies for Troubleshooting and Assay Optimization
In the context of a broader thesis on overcoming PCR inhibition in stool sample research, the accurate detection and management of systematic inhibition is paramount. Polymerase chain reaction (PCR) inhibition remains a significant challenge in molecular diagnostics and research, particularly when analyzing complex sample matrices like stool. Inhibitors present in these samples can lead to false-negative results, reduced sensitivity, and compromised data integrity. This technical support guide provides researchers with comprehensive strategies for detecting PCR inhibition through the implementation of internal controls and standard curves, enabling more reliable and reproducible experimental outcomes in stool-based research.
FAQs on PCR Inhibition Detection and Management
Stool samples contain numerous substances that can inhibit PCR amplification, including:
- Complex polysaccharides and bile salts that co-purify with nucleic acids [53]
- Phenolic compounds from dietary sources or bacterial metabolism [54]
- Degraded bacterial cell components from the gut microbiome [54]
- Heavy metals and other environmental contaminants [54]
- Hemoglobin derivatives and immunoglobulin G in certain pathological conditions [54]
The concentration of these inhibitors can vary significantly based on age, diet, health status, and medication use, with studies noting inhibitor presence ranging from 0% in newborn stools to 17% in samples from children aged 6-24 months [54].
How can I design an effective internal control for inhibition detection?
Internal controls are essential for distinguishing true target absence from PCR failure due to inhibition. Two primary approaches are recommended:
Non-competitive Synthetic Controls: Design a synthetic DNA or RNA sequence with the same primer binding regions as your target but with a different internal sequence, allowing differentiation during detection. This control should be added to the reaction mixture at a known, consistent concentration [55].
Spike-In Controls: Introduce a control sequence that is not present in your biological sample. For RNA detection in stool, the cel-miR-39 spike-in from microRNA spike-in kits has been successfully used [56]. The control should be added after the initial homogenization step but prior to nucleic acid extraction to monitor the entire process from extraction through amplification.
What is the optimal method for constructing standard curves to quantify inhibition?
Standard curves serve as critical tools for quantifying amplification efficiency and detecting inhibition. Follow this protocol for reliable standard curve construction:
- Template Preparation: Create a dilution series of your target nucleic acid (typically 5-10-fold dilutions) in the same matrix as your samples (e.g., stool extract from a negative sample) [56].
- Amplification: Amplify each dilution in triplicate alongside your experimental samples.
- Data Analysis: Plot the log of the initial template quantity against the quantification cycle (Cq) value for each dilution.
- Efficiency Calculation: Calculate PCR efficiency using the formula: ( E = (10^{-1/slope} - 1) \times 100\% )
- Interpretation: An ideal reaction has an efficiency of 90-105% (slope of -3.6 to -3.1). Significant deviation from this range indicates potential inhibition affecting reaction efficiency [57].
How can I troubleshoot sporadic PCR inhibition in my stool samples?
Sporadic inhibition can be particularly challenging in high-throughput settings. Implement these strategies:
- Sample Dilution: Dilute template DNA/RNA (1:10 or 1:100) to reduce inhibitor concentration while maintaining detectable target levels [54].
- BSA Enhancement: Incorporate bovine serum albumin (BSA) at 0.1-0.5 μg/μL final concentration in the PCR reaction. BSA binds inhibitors, preventing their interference with the polymerase. This approach reduced PCR failure rates to 0.1% in one large-scale study processing over 1,000,000 samples [24].
- Alternative Polymerases: Use inhibitor-resistant polymerase blends specifically formulated for challenging samples.
- Modified Extraction Protocols: Implement additional purification steps, such as silica-based columns or magnetic bead clean-up, to enhance inhibitor removal [56].
Research Reagent Solutions for Inhibition Management
Table 1: Essential reagents for overcoming PCR inhibition in stool samples
| Reagent | Function | Application Example | Recommended Concentration |
|---|---|---|---|
| Bovine Serum Albumin (BSA) | Binds to PCR inhibitors, preventing their interaction with polymerase | Overcoming sporadic inhibition in buccal swabs and stool samples [24] | 0.1-0.5 μg/μL in PCR reaction |
| cel-miR-39 Spike-in | RNA extraction and reverse transcription control | Monitoring RNA extraction efficiency from stool samples [56] | 3 μL per sample (as per manufacturer) |
| Stool Total RNA Purification Kit | Optimized RNA extraction with inhibitor removal | High-purity RNA extraction from stool for sensitive mRNA detection [56] | As per manufacturer protocol |
| RNase-Free DNase Set | DNA contamination removal | Eliminating genomic DNA contamination from RNA samples [56] | As per manufacturer protocol |
| One-Step RT-PCR Kits | Combined reverse transcription and PCR | Sensitive detection of low-abundance mRNA targets in stool [56] | As per manufacturer protocol |
Experimental Protocol: Systematic Inhibition Detection Workflow
Table 2: Step-by-step protocol for comprehensive inhibition detection
| Step | Procedure | Quality Control Check |
|---|---|---|
| 1. Sample Collection | Preserve stool samples immediately in RNAlater; store at -80°C | Record sample volume and preservation time |
| 2. Nucleic Acid Extraction | Use optimized purification kits (e.g., Norgen Stool Total RNA Kit); add spike-in control before extraction | Measure RNA concentration and purity (A260/280 ratio 1.8-2.0) [56] |
| 3. Internal Control Setup | Add non-competitive internal control to each reaction | Verify control amplification in all samples |
| 4. Standard Curve Preparation | Prepare 5-fold dilution series of target template in negative stool matrix; run in triplicate | Acceptable standard curve: R² > 0.98, efficiency 90-105% [57] |
| 5. PCR Amplification | Include BSA in reaction mix if inhibition suspected; use inhibitor-resistant polymerase | Monitor amplification curves for abnormal kinetics |
| 6. Data Analysis | Compare Cq values of internal control across samples; check standard curve efficiency | Investigate samples with control Cq values >2 cycles above average |
Workflow Visualization
Systematic Inhibition Detection Workflow
Key Performance Metrics for Inhibition Assessment
Table 3: Quantitative benchmarks for inhibition detection methods
| Parameter | Acceptable Range | Indication of Inhibition | Corrective Action |
|---|---|---|---|
| PCR Efficiency | 90-105% [57] | <90% or >105% | Dilute template; add BSA; purify DNA |
| Standard Curve R² | >0.98 [57] | <0.95 | Check pipetting accuracy; prepare fresh dilutions |
| Internal Control Cq Variation | <2 Cq between samples [56] | >2 Cq variation | Inhibitors present; require sample dilution |
| RNA Purity (A260/280) | 1.8-2.0 [56] | <1.8 or >2.0 | Additional purification needed |
| Inhibition Detection Sensitivity | 1.5×10³ cells/g [53] | Higher detection limit | Optimize extraction protocol |
Effective systematic inhibition detection through internal controls and standard curves is essential for generating reliable data in stool sample research. The integration of spike-in controls, rigorous standard curve validation, and strategic application of inhibitor-neutralizing reagents like BSA provides a comprehensive framework for identifying and overcoming PCR inhibition. By implementing these protocols and quality control measures, researchers can significantly enhance the accuracy and reproducibility of their molecular analyses, thereby advancing our understanding of gastrointestinal health and disease through stool-based biomarker studies.
Within the context of a broader thesis on overcoming PCR inhibition in stool samples research, this technical support center addresses a fundamental challenge: the effective removal of PCR inhibitors without significantly diminishing the target DNA/RNA. Stool samples are notoriously complex, with studies indicating that PCR inhibitors can lead to false-negative results in a significant proportion of cases [12] [58]. This guide provides targeted troubleshooting advice and detailed protocols to help researchers navigate the critical balance between inhibitor removal and DNA yield.
FAQs on Sample Dilution and Purification
1. Why is removing PCR inhibitors from stool samples so crucial, and what are the common inhibitors?
PCR inhibitors are substances that can co-purify with nucleic acids and prevent or reduce the efficiency of the polymerase chain reaction, leading to false-negative results or reduced sensitivity [12]. In stool samples, these inhibitors can originate from dietary components, complex polysaccharides, bil salts, and bacteria [12] [59]. One study found that 31% of stool samples from infants aged 6-24 months exhibited partial or complete PCR inhibition [12]. Failure to address these inhibitors can compromise the validity of your experimental results.
2. How does sample dilution help overcome PCR inhibition, and what are the trade-offs?
Diluting a sample is a simple and effective first-line strategy for reducing the concentration of PCR inhibitors below their active threshold [60] [59]. A common approach is a tenfold dilution of the extracted DNA [60]. The primary trade-off is the concomitant dilution of the target nucleic acid. This can be particularly detrimental when working with samples that have low initial target concentrations, such as when detecting low-abundance pathogens, as it risks diluting the target beyond the detection limit of your assay.
3. What purification methods are most effective for removing inhibitors from complex samples like stool?
Robust nucleic acid extraction methods are foundational for eliminating inhibitors. Commercial kits designed specifically to remove inhibitors, such as those incorporating Inhibitor Removal Technology (IRT), are highly effective [20] [60]. A comparative study evaluated four methods for removing common PCR inhibitors (including humic acid, bile salt, and collagen) and found that the PowerClean DNA Clean-Up Kit and the DNA IQ System were the most effective, generating more complete STR profiles than methods like Phenol-Chloroform extraction or Chelex-100 [20] [19]. These kits often use silica-based or paramagnetic particle technologies to separate DNA from inhibitory substances [20] [60].
4. Besides dilution and purification, what additives can help mitigate inhibition during the PCR itself?
Certain additives can be incorporated into the PCR master mix to enhance tolerance to inhibitors. Bovine Serum Albumin (BSA) is a well-documented PCR enhancer. In one study, the addition of BSA to reaction mixtures completely eliminated the inhibitory effect of compounds in stool samples, allowing all previously inhibited samples to test positive [12]. Other strategies include using specialized, inhibitor-tolerant master mixes, such as Environmental Master Mix or TaqMan Fast Virus 1-Step Master Mix, which are formulated for challenging samples [60].
Troubleshooting Guides
Guide 1: Diagnosing PCR Inhibition
| Observation | Possible Cause | Recommended Action |
|---|---|---|
| No amplification in positive control and test samples | General PCR failure (e.g., missing components, incorrect thermocycling) | Check reaction setup and thermal cycler program [7]. |
| Positive control amplifies, but test sample does not | PCR inhibitors present in the sample [59] | Proceed with an inhibition test (see below). |
| Delayed Ct values or reduced signal in real-time PCR | Partial PCR inhibition [60] | Dilute the template DNA 1:10 and re-amplify [59]. |
| Amplification in negative control | Contamination with exogenous DNA | Decontaminate workspace and reagents; use dedicated pre- and post-PCR areas [59]. |
Inhibition Test Protocol:
- Spike your sample: Add a known quantity of exogenous DNA (e.g., a synthetic construct or DNA from an organism absent from your samples) to your sample DNA extract.
- Set up a control: Set up a separate reaction with the same amount of exogenous DNA alone in a clean buffer.
- Amplify: Run both reactions using an assay specific to the exogenous DNA.
- Interpret results: If the Ct value for the exogenous DNA is significantly higher in the presence of the sample DNA than in the control, PCR inhibitors are present in your sample [60].
Guide 2: Choosing a Strategy Based on Sample Type and Target
| Scenario | Recommended Primary Strategy | Alternative or Supplemental Strategy |
|---|---|---|
| Suspected inhibition in a sample with high target concentration | Sample Dilution (e.g., 1:10 or 1:100) [60] [59] | Add PCR enhancers like BSA to the master mix [12]. |
| Suspected inhibition in a sample with low target concentration | Use an inhibitor-resistant DNA polymerase [7] | Purify DNA with a specialized kit (e.g., PowerClean, DNA IQ) [20] [19]. |
| Sample known to be highly inhibitory (e.g., soil, stool) | Robust purification kit with inhibitor removal technology [20] [60] | Combine purification with a subsequent 1:5 dilution and BSA addition. |
| Need for high sensitivity and inhibitor tolerance | Specialized master mixes (e.g., Environmental Master Mix) [60] | Use a two-stage DNA separation process [60]. |
Experimental Protocols for Inhibitor Removal
Protocol 1: Dilution Series to Determine Optimal Template Concentration
This protocol helps find the dilution "sweet spot" where inhibitors are neutralized, and the target is still detectable.
- Extract DNA/RNA from your stool sample using your standard method.
- Prepare Dilutions: In nuclease-free water, prepare a serial dilution of your extracted nucleic acids (e.g., Undiluted, 1:2, 1:5, 1:10, 1:20, 1:50, 1:100). The dilution factor can be adjusted based on the expected level of inhibition [61].
- Amplify: Use a fixed volume from each dilution as a template in your PCR/qPCR assay.
- Analyze: Identify the dilution that yields the strongest amplification signal (lowest Ct in qPCR or brightest band in gel electrophoresis). This represents the optimal balance for that sample.
Protocol 2: Purification Using a Commercial Inhibitor Removal Kit
The following workflow generalizes the procedure for kits like the PowerClean DNA Clean-Up Kit or DNA IQ System, which have been proven effective for forensic and environmental samples containing inhibitors like humic acid and bile salts [20] [19].
Detailed Steps:
- Bind DNA: The sample lysate is combined with a binding solution and a silica-based membrane (in a spin column) or paramagnetic beads (e.g., DNA IQ System). In the presence of a chaotropic salt, DNA binds to the silica/beads while many inhibitors remain in solution [20].
- Wash: The membrane/beads are washed once or twice with an ethanol-based wash buffer. This step is critical for removing residual salts and inhibitory compounds without eluting the DNA [20].
- Elute DNA: Purified DNA is eluted from the membrane/beads using a low-salt buffer or nuclease-free water, resulting in a clean sample ready for amplification [20].
The Scientist's Toolkit: Key Reagent Solutions
The following table details essential reagents and kits for managing PCR inhibition.
| Reagent / Kit | Function / Purpose | Key Context from Literature |
|---|---|---|
| PowerClean DNA Clean-Up Kit | DNA purification designed to remove potent PCR inhibitors (humic acids, polyphenols, dyes) from complex samples. | Effectively removed all tested inhibitors (e.g., humic acid, hematin, bile salt) at various concentrations, enabling full STR profiles [20] [19]. |
| DNA IQ System | Paramagnetic bead-based system for simultaneous DNA extraction and purification, removing a wide range of inhibitors. | Demonstrated effectiveness comparable to PowerClean for removing common inhibitors like melanin and collagen [20] [19]. Convenient due to combined extraction and purification [20]. |
| Bovine Serum Albumin (BSA) | PCR additive that neutralizes inhibitors by binding them or stabilizing the polymerase. | An easy and effective method; addition to reactions eliminated inhibitory effects in all tested stool samples [12]. |
| Inhibitor-Tolerant Polymerase/Master Mix | Specialty enzyme formulations with high processivity and tolerance to common inhibitors carried over from samples. | Recommended for amplifying difficult targets or when inhibitors are present; more tolerant than standard polymerases [7] [60]. |
| Phenol-Chloroform Extraction | Organic extraction method for separating DNA from proteins and other contaminants. | Could only remove some of the eight common PCR inhibitors tested and is less convenient than kit-based methods [20] [19]. |
Workflow: Strategic Approach to Inhibition
The following diagram outlines a logical decision pathway for addressing PCR inhibition in your experiments, integrating the methods discussed above.
In the context of research on stool samples, scientists frequently encounter a significant obstacle: PCR inhibition. Complex compositions of stool samples often contain substances that can impede molecular diagnostics, leading to false-negative results and reduced sensitivity [12]. This technical support center provides targeted FAQs and troubleshooting guides to help you overcome these challenges using chemical enhancers such as Bovine Serum Albumin (BSA) and trehalose.
FAQs: Understanding PCR Enhancers
What are PCR inhibitors and why are they problematic in stool sample research?
PCR inhibitors are substances present in clinical or environmental samples that interfere with the polymerase chain reaction, potentially causing false-negative results [12]. In stool samples, these inhibitors may originate from dietary components, bilirubin, complex polysaccharides, or other compounds. One study found that 12% of stool samples from infants aged 6-24 months showed complete PCR inhibition, while another 19% showed partial inhibition [12]. The problem appears to be age-dependent, with no inhibition observed in samples from infants younger than 6 months, possibly related to dietary differences including breastfeeding prevalence [12].
How does BSA help overcome PCR inhibition?
Bovine Serum Albumin (BSA) enhances PCR amplification through multiple mechanisms. Its high lysine content allows phenolic compounds to bind to it, preventing their interaction with and inactivation of DNA polymerase [62]. BSA also helps stabilize the polymerase enzyme and can relieve interference from inhibitors carried over from complex samples [63]. Research has demonstrated that adding BSA to reaction mixtures completely eliminated PCR inhibition in stool samples, making all previously inhibited samples test positive [12].
What is the role of trehalose in improving PCR efficiency?
Trehalose is a disaccharide that functions as a protein-stabilizing agent and helps reduce the melting temperature (Tm) of DNA, facilitating the denaturation of templates with secondary structures [62]. In isothermal exponential amplification reactions (EXPAR), trehalose has been shown to significantly increase reaction yield, though it may slightly reduce amplification rates at higher concentrations (e.g., 0.4M) [63]. It is particularly effective when combined with other enhancers in formulations like TBT-PAR (Trehalose, BSA, Tween-20 PCR Additive Reagent) [62].
What other chemical enhancers can improve PCR in difficult samples?
Several other chemical additives can enhance PCR performance:
- Tetramethylammonium chloride (TMAC): Increases specificity by eliminating the dependence of DNA melting temperature on base composition, reducing non-specific amplification [63].
- Single-stranded binding (SSB) proteins: Bind non-specifically to single-stranded DNA products, stabilizing them and improving specificity [63].
- Tween-20: A non-ionic detergent that can neutralize the inhibitory effects of SDS (sodium dodecyl sulfate) contamination [62].
- Betaine and DMSO: Helpful for amplifying GC-rich templates by reducing secondary structure formation [7].
Troubleshooting Guide
| Problem | Possible Cause | Solution |
|---|---|---|
| No or low yield | PCR inhibitors from stool samples | Add BSA (1 mg/mL) to the reaction [12] or use TBT-PAR [62] |
| Suboptimal reaction conditions | Include 0.1-0.2 M trehalose to stabilize enzymes and enhance efficiency [63] | |
| Non-specific amplification | Non-specific primer binding | Use TMAC (40 mM) to increase specificity [63] |
| Use hot-start DNA polymerases [7] | ||
| Inhibition not resolved | High inhibitor concentration | Combine BSA and trehalose with sample dilution [12] |
| Re-purify DNA using commercial kits designed for inhibitor removal [7] |
Experimental Protocols
Protocol 1: Using BSA to Overcome Inhibition in Stool Samples
This protocol is adapted from a study on PCR inhibition in infant stool samples [12]:
- Extract total RNA from stool samples using your preferred method.
- Spike the RNA fraction with a standardized amount of control RNA (e.g., Semliki Forest Virus RNA).
- Prepare the cDNA reaction mixture with the following components:
- Template RNA
- Reverse transcriptase and appropriate buffer
- dNTPs
- Primers
- BSA at a concentration of 1 mg/mL [12]
- Incubate according to your standard reverse transcription protocol.
- Prepare the PCR mixture with:
- cDNA product
- DNA polymerase and appropriate buffer
- dNTPs
- Primers
- BSA at a concentration of 1 mg/mL
- Amplify using your standard PCR cycling conditions.
- Compare results with positive controls (spiked water samples) to confirm elimination of inhibition.
Protocol 2: TBT-PAR Additive Reagent for Recalcitrant Samples
This protocol is adapted from plant DNA amplification studies and can be applied to inhibitory stool samples [62]:
Prepare 5× TBT-PAR Stock Solution:
- Dissolve 2.835 g trehalose (Sigma-Aldrich T9531) in 6 mL of 10 mM Tris hydrochloride (pH 8.0)
- Adjust volume to 8.5 mL with the same Tris buffer
- Add 0.5 mL of 20 mg/mL non-acetylated BSA (Sigma-Aldrich B4287)
- Add 0.1 mL of 10% Tween-20
- Mix thoroughly without excessive foaming
- Store at 4°C for frequent use (up to one week) or at -20°C for long-term storage
PCR Setup with TBT-PAR:
- For a 25 μL total reaction volume, use 5 μL of 5× TBT-PAR (1× final concentration)
- Adjust water volume accordingly to maintain proper concentrations of other components
- Proceed with standard amplification protocols
Research Reagent Solutions
| Reagent | Function | Application Notes |
|---|---|---|
| BSA (Bovine Serum Albumin) | Binds inhibitors, stabilizes polymerase | Use non-acetylated form at 1 mg/mL final concentration [12] [62] |
| Trehalose | Lowers DNA Tm, stabilizes enzymes | Effective at 0.1-0.2 M; higher concentrations may slow reaction [63] |
| TMAC | Equalizes Tm across sequences, improves specificity | Use at 40 mM for maximal specificity enhancement [63] |
| Tween-20 | Neutralizes SDS contamination | Use at 0.1-0.2% in final reaction [62] |
| SSB Proteins | Binds ssDNA, prevents secondary structure | Effective at 5-10 μg/mL [63] |
Workflow Visualization
Successfully amplifying DNA from stool samples requires strategic approaches to overcome inherent PCR inhibition. BSA and trehalose serve as effective first-line enhancers, with BSA particularly effective for complete inhibition and trehalose boosting overall yield. For persistent issues, combination approaches like TBT-PAR or the addition of TMAC for specificity provide powerful solutions. By systematically applying these chemical enhancers and following the provided protocols, researchers can significantly improve their molecular diagnostic outcomes in stool sample research.
Troubleshooting Guides and FAQs
How does MgCl₂ concentration specifically affect my PCR when using stool samples?
The concentration of magnesium chloride (MgCl₂) is a critical parameter for PCR success, as it acts as a cofactor for the DNA polymerase enzyme. Its optimal concentration is influenced by the complexity of the DNA template. Stool samples often contain complex genomic DNA from gut microbiota, which necessitates careful optimization.
Quantitative Guidance from Meta-Analysis: A comprehensive meta-analysis of 61 peer-reviewed studies established the following quantitative relationships and recommendations for MgCl₂ optimization [64]:
| Template Type | Recommended MgCl₂ Range | Effect on DNA Melting Temperature |
|---|---|---|
| Genomic DNA (e.g., from stool microbiota) | Higher end of 1.5 - 3.0 mM | Every 0.5 mM increase raises Tm by ~1.2°C |
| Simple templates (e.g., plasmid, purified amplicons) | Lower end of 1.5 - 3.0 mM | Every 0.5 mM increase raises Tm by ~1.2°C |
What is the optimal annealing temperature, and how do I find it?
The annealing temperature (Ta) is primer-specific and must be optimized to ensure specific primer binding, which is crucial for avoiding non-specific amplification in complex samples like stool.
Experimental Protocol for Annealing Temperature Optimization [65]:
- Design and Select Primers: Design multiple primer-probe sets targeting your gene of interest. For complex samples, targeting multi-copy genes (e.g., small subunit rRNA for parasites) can enhance sensitivity [65].
- Set Up a Gradient PCR: Use a thermal cycler with a temperature gradient function. A recommended range is between 59°C and 62°C [65].
- Evaluate Efficiency: Test different primer sets at various annealing temperatures and PCR cycle numbers (e.g., 30 vs. 50 cycles). Assess amplification efficacy using methods like droplet digital PCR (ddPCR) to measure absolute positive droplet counts and mean fluorescence intensity [65].
- Validate Specificity: Confirm that the selected primer-probe set and annealing temperature do not produce false positives with negative controls and can effectively differentiate the target in clinical specimens [65].
My PCR from stool samples shows weak or no amplification. What should I do?
This is a common symptom of PCR inhibition, which is frequently encountered with stool samples. A systematic approach is needed to identify and overcome the issue.
Step-by-Step Diagnostic and Solution Workflow:
How can I logically determine a reliable cut-off Ct value for my qPCR assays on stool samples?
Unclear cycle threshold (Ct) values, often yielding low-titer positive results, are a significant challenge in diagnostic qPCR. A combination of qPCR and droplet digital PCR (ddPCR) can be used to set a logical, primer-probe specific cut-off [65].
Experimental Protocol for Cut-off Determination [65]:
- Generate a Standard Curve: Use a standardized template (e.g., from a reference strain) and perform qPCR with your optimized primer-probe set.
- Correlate with Absolute Quantification: Use ddPCR to measure the Absolute Positive Droplet (APD) count for each point in your standard curve.
- Establish the Relationship: Plot the qPCR Ct values against the square of the APD values. An inverse proportional relationship should be observed.
- Define the Cut-off: From this correlation, define the specific cut-off Ct value. One study targeting Entamoeba histolytica determined a cut-off of 36 cycles using this method [65]. This value is specific to the primers, probe, and reaction conditions used.
The Scientist's Toolkit: Research Reagent Solutions
The following table details key reagents and materials essential for overcoming PCR inhibition in stool sample research.
| Item | Function & Rationale |
|---|---|
| Inhibitor-Tolerant qPCR Buffer, 5x | A specialized buffer containing enhancers, stabilizers, dNTPs, and MgCl₂ designed to be highly resistant to various PCR inhibitors found in crude lysates or inhibitor-rich biological specimens like stool [66]. |
| QIAamp Fast DNA Stool Mini Kit | A widely cited commercial kit for DNA extraction from stools. It includes an inhibitor removal step optimized for PCR analysis, which is crucial for obtaining high-quality template DNA [65] [54] [67]. |
| Phytase Enzyme | An enzyme that degrades phytic acid (inositol hexaphosphate), a known PCR inhibitor prevalent in plant matter and ruminant feces. Treatment with phytase can significantly reduce inhibition in bovine fecal specimens [68]. |
| Bead Ruptor Elite Homogenizer | An instrument for mechanical homogenization of tough samples like stool. It provides precise control over homogenization parameters (speed, cycle duration, temperature) to efficiently lyse microbial cells while minimizing DNA shearing and degradation [46]. |
| Droplet Digital PCR (ddPCR) System | A third-generation PCR method used for absolute quantification. It is highly valuable for evaluating primer-probe amplification efficiency, establishing accurate qPCR cut-off values, and is less affected by inhibitors compared to qPCR [65]. |
The detection of Helicobacter pylori (H. pylori) in stool samples via polymerase chain reaction (PCR) is a powerful, non-invasive tool for diagnosis and antibiotic resistance profiling. However, its accuracy is significantly compromised by PCR inhibitors present in stool, leading to false-negative results and an underestimation of true infection rates [49] [17]. These inhibitors—including complex polysaccharides, lipids, bile salts, and degraded heme compounds—interfere with the DNA polymerase activity, ultimately reducing amplification efficiency [17] [33]. This case study explores the technical challenges and evidence-based solutions for overcoming PCR inhibition to achieve reliable H. pylori detection in stool, a critical concern for clinical diagnostics and research.
The Nature of Stool Matrix Inhibitors
The stool matrix is a complex and heterogeneous environment that introduces multiple substances which can inhibit the PCR process. These inhibitors co-extract with nucleic acids and disrupt amplification through various mechanisms:
- Interaction with DNA Polymerase: Certain compounds can directly bind to the DNA polymerase enzyme, inhibiting its catalytic activity [17].
- Degradation or Sequestration of Target DNA: Some substances can degrade the target DNA or sequester it, making it unavailable for amplification [17].
- Chelation of Essential Metal Ions: Inhibitors may chelate magnesium ions (Mg²⁺), which are essential cofactors for DNA polymerase function [17].
The extent of inhibition can vary significantly between individual stool samples due to differences in diet, gut microbiota, and clinical conditions [33].
The Paradox of H. pylori DNA in Stool
Research has revealed a specific challenge for H. pylori detection: the bacterial DNA in stool is often highly degraded. One study demonstrated that while a nested PCR (NPCR) targeting a long 454 base pair (bp) amplicon identified H. pylori in only 6.25% of patient samples, an NPCR for a shorter 148 bp amplicon detected the bacterium in 51.0% of the same samples [49] [69]. This suggests that stool contains primarily short fragments of H. pylori DNA, likely due to degradation during digestive transit. Consequently, the use of PCR assays designed for long DNA amplicons can result in a significant underestimation of infection prevalence [49].
Troubleshooting Guide: Overcoming Inhibition
Critical Step: Optimal DNA Extraction
The choice of DNA extraction method is the most critical factor in determining the success of downstream PCR amplification. Inefficient extraction can fail to lyse tough microbial cells or remove PCR inhibitors.
Table 1: Comparison of DNA Extraction Methods for Stool Samples
| Extraction Method | Reported Performance | Key Advantages | Considerations |
|---|---|---|---|
| QIAamp PowerFecal Pro DNA Kit (QB) | Highest PCR detection rate (61.2%) for various intestinal parasites; effective for tough helminths [33]. | Incorporates robust mechanical lysis (bead-beating); optimized to remove inhibitors. | Considered one of the most effective for diverse stool organisms. |
| QIAamp Fast DNA Stool Mini Kit (Q) | Capable of detecting 800 spores/mL of Enterocytozoon bieneusi [70]. | Widely used and validated. | May be less effective than PowerFecal Pro for some tough-to-lyse targets [33]. |
| Phenol-Chloroform (P) | Provided high DNA yields but the lowest PCR detection rate (8.2%) [33]. | Traditional method; can yield high DNA quantity. | Poor inhibitor removal; time-consuming; involves hazardous organic solvents. |
| NucleoSpin Soil Kit (MNS) | Associated with high alpha diversity estimates in complex samples; provided good DNA purity [34]. | Effective for gram-positive bacteria and inhibitor-rich samples. |
Strategic PCR Enhancement
Several additives and strategies can be incorporated into the PCR master mix to counteract the effects of residual inhibitors.
Table 2: PCR Enhancers and Strategies to Mitigate Inhibition
| Enhancer/Strategy | Proposed Mechanism of Action | Effectiveness & Application |
|---|---|---|
| Bovine Serum Albumin (BSA) | Binds to inhibitors such as humic acids, preventing them from interfering with the DNA polymerase [17]. | Shown to improve detection in inhibitory wastewater samples; a common and effective additive. |
| T4 Gene 32 Protein (gp32) | Stabilizes single-stranded DNA and can bind inhibitory compounds [17]. | Can improve amplification efficiency in the presence of inhibitors. |
| Tween-20 | A non-ionic detergent that can counteract inhibitory effects on Taq DNA polymerase [17]. | Useful for relieving inhibition, particularly in fecal samples. |
| Sample Dilution | Dilutes the concentration of inhibitors in the reaction to a sub-inhibitory level [17]. | A simple and common strategy; however, it also dilutes the target DNA and can reduce sensitivity. |
| Short Amplicon Assays | Targets a shorter region of the bacterial genome (<150 bp) [49]. | Highly effective for detecting degraded DNA, as often found with H. pylori in stool. |
| Inhibitor-Tolerant Polymerases | Use of specialized enzyme blends designed to resist common PCR inhibitors [17]. | A fundamental first step; many commercial master mixes are now optimized for difficult samples. |
Alternative Amplification Technologies
Droplet Digital PCR (ddPCR) partitions a single PCR reaction into thousands of nanodroplets, effectively diluting inhibitors and enabling absolute quantification of target DNA without a standard curve. This technology has demonstrated higher tolerance to inhibitors compared to conventional qPCR in environmental and clinical samples [17].
Experimental Protocols for Validation
Protocol: Validating an Inhibition-Free Reaction
To confirm that a negative PCR result is due to the absence of the target and not the presence of inhibitors, a spiking control experiment is essential.
- Extract DNA from the stool sample using an optimized method (e.g., QIAamp PowerFecal Pro DNA Kit).
- Divide the extracted DNA into two aliquots.
- Spike one aliquot with a known quantity of a control DNA template (e.g., a plasmid containing a cloned H. pylori gene fragment or a synthetic oligonucleotide).
- Run PCR for both the spiked and unspiked samples using primers specific for the control DNA and for the H. pylori target.
- Interpretation: If the spiked sample fails to amplify the control target, significant PCR inhibitors remain in the DNA extract. If the control amplifies but the H. pylori target does not, the result is a true negative [33].
Protocol: Implementing a Short Amplicon Nested PCR for H. pylori
Based on the methodology that successfully resolved the sensitivity paradox [49] [69]:
- DNA Extraction: Use ~200 mg of stool and the QIAamp PowerFecal Pro DNA Kit, including a bead-beating step for mechanical lysis.
- First Round PCR (Outer Primers):
- Target: 16S rRNA gene of H. pylori.
- Amplicon Size: ~454 bp.
- Use: 1-5 µL of extracted DNA in a 25-50 µL reaction with an inhibitor-tolerant polymerase.
- Second Round PCR (Inner Primers):
- Template: 1-2 µL of the first-round PCR product (diluted 1:10 to 1:100).
- Target: Internal segment of the 454 bp amplicon.
- Amplicon Size: 148 bp.
- Reaction Conditions: Include 0.1-0.4 µg/µL of BSA in the master mix to combat any carry-over inhibitors.
- Specificity Confirmation: Validate positive results by Sanger sequencing of the PCR products to confirm H. pylori origin [49].
Visual Workflow: A Pathway to Reliable Detection
The following diagram summarizes the logical decision-making process for resolving inhibition in H. pylori stool PCR.
The Scientist's Toolkit: Essential Reagent Solutions
Table 3: Key Research Reagents for Overcoming Inhibition
| Reagent / Kit | Function |
|---|---|
| QIAamp PowerFecal Pro DNA Kit | Efficient mechanical and chemical lysis for tough-to-lyse cells and comprehensive removal of stool-derived PCR inhibitors [33]. |
| Inhibitor-Tolerant DNA Polymerase | Specialized enzyme blends that maintain activity in the presence of common inhibitory substances found in stool [17]. |
| Bovine Serum Albumin (BSA) | A protein additive that binds to inhibitors, neutralizing their effect on the PCR reaction [17]. |
| Short Amplicon Primers | Primer sets designed to amplify very short (<150 bp) fragments of the target gene, crucial for detecting degraded DNA [49]. |
| Control Plasmid DNA | A known quantity of non-target DNA used in spiking experiments to validate that the PCR is free from inhibition [33]. |
Frequently Asked Questions (FAQs)
Q1: My PCR works with pure H. pylori cultures but fails with spiked stool samples. What is the first thing I should check? A1: The DNA extraction method is the most likely culprit. Immediately compare your current method against a kit specifically designed for inhibitor-rich stool samples, such as the QIAamp PowerFecal Pro DNA Kit, which includes bead-beating for efficient lysis and columns formulated to remove inhibitors [33].
Q2: I am getting positive results with a stool antigen test (SAT) but negative results with PCR. How is this possible? A2: This apparent contradiction can be explained by two factors. First, the bacterial DNA in stool is often degraded into short fragments. If your PCR assay is targeting a long amplicon, it will fail to detect this degraded DNA. Switching to a short amplicon assay (<150 bp) can resolve this [49]. Second, the SAT detects protein antigens, which may be more stable than DNA in the gut environment, while PCR is highly susceptible to inhibition, which can cause false negatives.
Q3: How can I definitively prove that my negative PCR results are not due to inhibition? A3: You must perform a spiking experiment. After extracting DNA from your stool sample, spike it with a known, amplifiable DNA template (one that is not H. pylori). Then, run a PCR targeting this spiked-in control. If this control PCR is also negative, it confirms that inhibitors are still present in your sample and are causing the negative results [33].
Q4: Are there any advantages to using digital PCR (ddPCR) for this application? A4: Yes. Droplet Digital PCR (ddPCR) partitions the sample into thousands of individual reactions, effectively diluting out PCR inhibitors and reducing their impact. This makes ddPCR inherently more tolerant to inhibitors found in complex matrices like stool and wastewater, often leading to more accurate quantification and detection, especially in low-target scenarios [17].
Ensuring Accuracy: Validation, Comparative Analysis, and Quality Control
FAQ: Sequencing and Specificity in Stool Sample Research
Why is confirming specificity particularly challenging in stool-based assays?
Stool is a complex matrix rich in PCR inhibitors, including phenolic compounds, fats, bile salts, and bacterial cell constituents [71] [54]. These substances can co-purify with nucleic acids, leading to false negatives or altered quantification in PCR-based assays, which ultimately compromises the specificity and sensitivity of your results [71] [56].
How does sequencing serve as a gold standard for specificity?
Next-Generation Sequencing (NGS) provides an unbiased, comprehensive view of all nucleic acids in a sample. By generating millions of reads, it allows you to:
- Verify Target Amplicons: Confirm that your PCR primers are amplifying the intended specific sequence and not non-target regions.
- Detect Off-Target Effects: Identify the presence of any non-specific amplification or contaminating DNA that could lead to false positives [72] [73]. This is especially critical when validating new PCR assays for complex samples like stool, where microbial diversity is high [54].
What NGS approaches are best for validating stool-based assays?
The choice depends on your goal:
- 16S rRNA Sequencing: Ideal for validating assays targeting bacterial community composition. It is a cost-effective method to confirm that your primers are specific to the intended bacterial groups [54].
- Shotgun Metagenomic Sequencing: Provides a broader application for validating assays targeting any genomic region (bacterial, viral, or human host). It sequences all the DNA in a sample, offering the most comprehensive specificity check [72].
- Long-Read Sequencing (e.g., PacBio, Oxford Nanopore): Excellent for resolving complex genomic regions with repeats or for achieving high accuracy with HiFi reads, ensuring confidence in your confirmed targets [73].
My qPCR shows inhibition. How can sequencing help troubleshoot?
If your quantitative PCR (qPCR) shows signs of inhibition (e.g., delayed amplification in positive controls, complete reaction failure), sequencing the affected library can diagnose the problem. A failed NGS run with low yield or abnormal coverage can trace the issue back to inhibited enzymes during library preparation, confirming that the problem lies in sample preparation rather than your assay's design [74].
Troubleshooting Guide: Overcoming PCR Inhibition for Robust Sequencing
Problem: Low Library Yield After Preparation from Stool DNA/RNA
Possible Causes & Solutions
| Cause | Diagnostic Clues | Corrective Actions |
|---|---|---|
| Carryover PCR Inhibitors | Low yield despite good input concentration; poor 260/230 ratio on Nanodrop [56]. | Re-purify nucleic acids using silica column/bead-based kits designed for stools (e.g., Norgen Stool RNA kit, QIAamp Stool Mini kit) [56] [54]. Include additional wash steps. |
| Inefficient Fragmentation/Ligation | Adapter-dimer peaks in Bioanalyzer trace; short fragment skew [74]. | Re-optimize enzymatic fragmentation time for your stool extract. Titrate adapter-to-insert ratio to favor proper ligation. |
| Inaccurate Input Quantification | Discrepancy between fluorometric (Qubit) and UV (NanoDrop) readings [74]. | Use fluorometry for accurate quantification of usable nucleic acids. Dilute the template if inhibitors are suspected [71]. |
Experimental Protocol: Validating Specificity via 16S Amplicon Sequencing
This protocol is adapted from methods used to analyze bacterial diversity in fecal samples from children with diarrhea [54].
1. DNA Extraction Optimized for Stool
- Sample Preservation: Preserve stool samples immediately in a stabilizer like RNAlater.
- Inhibitor Removal: Use a commercial kit validated for stool (e.g., GeneJET kit, Norgen Stool kit). The protocol in [56] successfully used the Stool total RNA Purification Kit (Norgen) for high-purity RNA.
- Optional Step: For challenging samples, separate bacteria from other fecal residues via differential centrifugation before lysis to reduce inhibitor load [54].
- DNase Treatment: Use an RNase-free DNase set (e.g., from Qiagen or Promega) to remove contaminating DNA [56].
- Quality Control: Assess DNA purity spectrophotometrically (260/280 ratio ~1.8, 260/230 > 1.8) and by fluorometry for accurate concentration [56].
2. PCR Amplification with Inhibition Relief
- Target Amplification: Amplify the target region (e.g., V3-V4 of 16S rRNA gene) using locus-specific primers.
- Relief of Inhibition: If PCR efficiency is low, employ these strategies:
- Template Dilution: A five-fold dilution of the DNA extract can relieve inhibition, as shown in a study where it increased MAP DNA detection in feces by 3.3-fold on average [71].
- Polymerase Choice: Use polymerases with high tolerance to inhibitors [7] [75].
- Additives: Include PCR enhancers like bovine serum albumin (BSA) to bind inhibitors [7].
3. Library Preparation & Sequencing
- Prepare sequencing libraries from the purified PCR amplicons following standard NGS library protocols.
- Sequence on an appropriate platform (e.g., Illumina MiSeq for 16S amplicons).
4. Data Analysis for Specificity Confirmation
- Bioinformatic Processing: Process raw sequences (quality filtering, denoising) and cluster into Operational Taxonomic Units (OTUs) or Amplicon Sequence Variants (ASVs).
- Specificity Check: BLAST representative sequences from your dominant clusters against a database (e.g., NCBI, SILVA) to confirm they match the expected targets. This verifies that your PCR assay is specific and not detecting non-target species [54].
This workflow for confirming specificity and overcoming inhibition can be visualized as follows:
The Scientist's Toolkit: Research Reagent Solutions
| Reagent / Kit | Function in Context of Stool Samples |
|---|---|
| QIAamp Stool Mini Kit (Qiagen) | DNA extraction kit identified as producing high quality and quantity of metagenomic DNA from fecal samples [54]. |
| Stool total RNA Purification Kit (Norgen) | RNA extraction kit proven to provide high RNA purity and consistent mRNA detection from stool for gene expression studies [56]. |
| RNase-Free DNase Set (Qiagen) | Treatment used during extraction to remove contaminating genomic DNA, crucial for RNA-based assays and reducing false positives [56]. |
| High-Tolerance DNA Polymerase | Enzymes (e.g., OneTaq, Q5) with high processivity that are less affected by common PCR inhibitors carried over from stool [7] [75]. |
| BSA (Bovine Serum Albumin) | PCR additive that can bind to inhibitors commonly found in stool, relieving inhibition and improving amplification efficiency [7]. |
In molecular diagnostics and research, the choice between commercial kits and in-house developed PCR assays is a critical decision. This technical support center is designed within the context of overcoming PCR inhibition in stool samples, a particularly challenging matrix rich in inhibitors like complex polysaccharides, bile salts, and bacterial components. The following guides and FAQs will help researchers, scientists, and drug development professionals navigate the specific challenges of assay selection, validation, and troubleshooting for reliable results in their experiments.
FAQ: Core Concepts and Selection
1. What are the fundamental differences between commercial and in-house PCR assays?
Commercial PCR assays are pre-developed, optimized, and manufactured as ready-to-use kits by commercial suppliers. They typically come with standardized protocols, proprietary reagents, and quality-controlled components. In-house (or laboratory-developed tests, LDTs) are designed, optimized, and validated by individual laboratories. They offer flexibility in target selection, reaction conditions, and customization but require extensive validation [76].
2. When should I choose a commercial assay over an in-house one?
Choose a commercial assay when you need to rapidly implement a standardized test (e.g., for common pathogens like SARS-CoV-2), require CE marking or FDA approval for clinical diagnostics, lack the resources for extensive in-house development and validation, or need to ensure consistency and comparability of results across multiple sites or studies [76].
3. When is an in-house assay the preferable option?
An in-house assay is preferable when working with rare or emerging pathogens for which no commercial test exists, when investigating novel genetic targets, when specialized sample matrices (like stool) require customized sample preparation, or when cost-effectiveness for large-scale, routine testing of a specific target is a primary concern [76].
4. Why is PCR inhibition a major concern in stool sample research?
Stool samples contain a complex mixture of PCR inhibitors, including complex polysaccharides, bilirubin, bile salts, and various bacterial components. These substances can interfere with the DNA polymerase activity, chelate essential co-factors like Mg²⁺, or interact with the nucleic acids themselves, leading to reduced sensitivity, false-negative results, or an underestimation of the target concentration [17] [77].
FAQ: Troubleshooting Common Experimental Issues
1. I am getting no amplification product from my stool sample DNA. What should I check first?
- Confirm Component Integrity: Ensure all PCR components were included. Always run a positive control with a known template to verify each component is functional [77].
- Check for Inhibitors: Dilute your template DNA (e.g., 10- to 100-fold). If amplification occurs, inhibitors were likely present. Alternatively, re-purify the DNA using a kit designed to remove inhibitors [7] [77].
- Optimize Reaction Conditions: Consider using a DNA polymerase with high tolerance to inhibitors. Slightly increase the number of PCR cycles (e.g., by 3-5, up to 40 cycles) or lower the annealing temperature in 2°C increments [7] [77].
- Verify Template Quality and Quantity: Analyze DNA integrity by gel electrophoresis and ensure sufficient input DNA is used [7] [78].
2. My PCR results show high background or nonspecific bands. How can I improve specificity?
- Increase Stringency: Raise the annealing temperature stepwise in 1-2°C increments. Use a thermal cycler with a gradient function if available [7] [78].
- Use Hot-Start Polymerases: These enzymes remain inactive until the high-temperature denaturation step, preventing non-specific primer extension during reaction setup [7] [78].
- Optimize Primer and Template Concentrations: High primer or template concentrations can promote mis-priming. Reduce their concentrations and ensure primers are well-designed and specific [7] [77].
- Reduce Cycle Number: A high number of cycles can lead to accumulation of non-specific products. Reduce the number of cycles without drastically compromising the yield of the desired product [7] [77].
3. I observe significant quantitative differences when switching between a commercial and an in-house assay for the same target. What could be the cause?
This is a common challenge, as shown in a study comparing EBV DNA assays where the in-house method showed a systematic overestimation of about 2 log units [79]. Key factors include:
- Calibrator DNA Source: The source of DNA used for the standard curve (e.g., genomic DNA vs. plasmid DNA) can significantly influence quantification due to differences in amplification efficiency [79].
- Target Gene Region: Assays targeting multi-copy genes will yield higher estimated loads than those targeting single-copy genes [79].
- PCR Efficiency: Variations in reagent composition, buffer conditions, and primer design can lead to different amplification efficiencies, directly impacting quantitative results [80] [79].
Comparative Performance Data
The table below summarizes key findings from published comparative studies.
Table 1: Direct Comparison of Commercial and In-House PCR Assays from Peer-Reviewed Studies
| Pathogen / Target | Assay Type & Name | Key Performance Finding | Sensitivity (Analytical) | Noted Advantages / Disadvantages |
|---|---|---|---|---|
| Mycoplasma pneumoniae [80] | 2 Commercial (artus, Venor) & 3 In-House (RepMp1, ATPase, CARDS Tx) | All five assays could detect ≤1 CFU/μl. However, the mean crossing points led to a 20-fold difference in calculated genome copies. | All comparable (near 1 CFU/μl) | Highlights that even with similar sensitivity, quantitative results can vary significantly between different assays. |
| Epstein-Barr Virus (EBV) [79] | Commercial (Q-EBV PCR) vs. In-House (EBV RQ-PCR) | Results were correlated (R²=0.78) but the in-house assay showed a systematic overestimation of ~1.9 log. | Commercial kit had higher clinical sensitivity for samples <1,000 copies/ml. | Discrepancy linked to PCR efficiency and the DNA standard source (plasmid vs. genomic). |
| SARS-CoV-2 [81] | 13 Commercial RT-PCR Kits | Analytical sensitivity varied by two orders of magnitude, from 3.3 to 330 RNA copies per reaction. | Wide variation as noted. | Emphasizes the need for independent verification of manufacturer claims, even for commercial kits. |
Experimental Protocols for Key Scenarios
Protocol 1: Basic Workflow for Comparative Assay Validation
This workflow is essential when introducing a new commercial kit or validating a new in-house assay against an existing method.
Table 2: Key Research Reagent Solutions for Assay Validation
| Reagent / Material | Function / Purpose | Example & Notes |
|---|---|---|
| Inhibitor-Tolerant DNA Polymerase | Resists inactivation by common inhibitors in complex samples (stool, blood, wastewater). | Essential for stool samples. Often supplied with specialized buffers [7] [17]. |
| Standard Reference Material | Used to create a standard curve for determining assay linearity, efficiency, and quantification. | Can be quantified culture stock, synthetic oligonucleotide, or linearized plasmid [80] [76]. |
| PCR Enhancers | Compounds that help overcome inhibition or amplify difficult templates (e.g., GC-rich). | BSA, T4 gp32, DMSO, formamide, glycerol, betaine, TWEEN-20 [17]. |
| Internal Control (IC) | Co-amplified control to detect the presence of PCR inhibitors in the sample. | Distinguishes between true target negativity and test failure due to inhibition [76]. |
| Proficiency Panel | Well-characterized samples used to assess a test's accuracy and reproducibility across labs. | e.g., QCMD panels; crucial for external validation [79]. |
Protocol 2: Mitigating PCR Inhibition in Stool Samples
This protocol outlines a strategic approach to overcome inhibition, a critical step for reliable stool sample testing.
Table 3: Common PCR Enhancers and Their Applications
| Enhancer | Proposed Mechanism of Action | Reported Effectiveness | Considerations |
|---|---|---|---|
| BSA (Bovine Serum Albumin) | Binds to inhibitors (e.g., humic acids, polyphenols), preventing them from interacting with polymerase or DNA [17]. | Effective in wastewater and plant samples; likely beneficial for stool. | A common first-choice enhancer due to its effectiveness and low cost. |
| T4 Gene 32 Protein (gp32) | Binds to single-stranded DNA, stabilizing it and preventing the action of inhibitors [17]. | Effective in wastewater samples. | Can be more expensive than other options. |
| DMSO | Destabilizes DNA secondary structure, lowers melting temperature (Tm), particularly useful for GC-rich targets [17]. | Effectiveness can vary; requires concentration optimization. | High concentrations can inhibit the PCR. Test in a range (e.g., 1-10%). |
| TWEEN 20 | A detergent that counteracts inhibitory effects on Taq DNA polymerase [17]. | Reported to relieve inhibition in fecal samples. | As with all additives, optimal concentration must be determined. |
| Sample Dilution | Reduces the concentration of inhibitors below a critical threshold. | A widely used and often effective strategy [17] [77]. | Also dilutes the target DNA, which can reduce sensitivity and lead to underestimation of load [17]. |
Utilizing Digital PCR (ddPCR) for Absolute Quantification and Cut-Off Validation
The analysis of stool samples presents a significant challenge for molecular diagnostics, including digital PCR (dPCR). The complex composition of feces introduces numerous substances known to inhibit polymerase chain reaction (PCR), potentially leading to false-negative results and inaccurate quantification. Compounds such as bile salts, complex proteins, fats, and humic acids can compromise PCR efficiency by binding to template DNA, competing for DNA polymerase, or chelating essential magnesium co-factors [3]. Research indicates that PCR inhibition affects approximately 12-20% of fecal samples [12] [3], posing a substantial barrier to reliable absolute quantification. This technical support resource is framed within a broader thesis on overcoming PCR inhibition in stool samples, providing researchers, scientists, and drug development professionals with practical solutions for validating ddPCR assays and establishing robust cut-off values in the presence of inhibitory substances.
Digital PCR Fundamentals & Stool Sample Applications
Core Principles of Digital PCR
Digital PCR represents a transformative approach to nucleic acid quantification by partitioning a single PCR reaction into thousands of individual compartments and performing end-point PCR amplification in each. This partitioning minimizes template competition for reagents and effectively dilutes potential PCR inhibitors present in the sample, thereby enhancing overall assay sensitivity and reliability [82]. Unlike quantitative PCR (qPCR), dPCR provides absolute quantification without requiring standard curves, as the copy number is calculated based on the proportion of positive to negative partitions using Poisson statistics [83] [82].
Advantages for Complex Matrices like Stool
The partitioning principle of dPCR offers distinct advantages for analyzing challenging sample types such as stool:
- * inhibitor dilution*: Inhibitory substances are distributed across thousands of partitions, reducing their concentration in any single reaction well below inhibitory thresholds [82].
- Enhanced sensitivity: Enables detection of rare mutations and low-abundance targets, with demonstrated sensitivity to detect one mutant molecule in over 4 million wild-type molecules [84].
- Resilience to efficiency variations: Reaction efficiency has minimal impact on quantitation results, making it more robust against partial inhibition [82].
Frequently Asked Questions (FAQs) on ddPCR with Stool Samples
Q1: How does PCR inhibition specifically affect ddPCR results compared to qPCR? While both techniques can be affected by inhibitors, the impact manifests differently. In qPCR, inhibitors cause reduced amplification efficiency observed as higher Cq values and inaccurate quantification. In ddPCR, partial inhibition may reduce the number of positive partitions without necessarily preventing amplification in all partitions, potentially leading to underestimation of target concentration. However, ddPCR's partitioning provides inherent dilution of inhibitors, often making it more resilient than qPCR [82] [3].
Q2: What is the recommended approach to validate a ddPCR assay's limit of detection (LoD) for stool samples? A comprehensive LoD determination should include: (1) Establishing the false-positive rate using wild-type only samples; (2) Running a mutation titration series with known dilution points; (3) Calculating LoD with 95% confidence limits. For example, in EGFR mutation detection, researchers achieved an LoD of one mutant in 180,000 wild-type molecules using 3.3 μg of genomic DNA [84]. This process must be performed specifically with stool samples to account for matrix effects.
Q3: What steps can I take when my ddPCR results show signs of inhibition? Initial troubleshooting should include: (1) Diluting DNA template 5-fold to reduce inhibitor concentration; (2) Adding bovine serum albumin (BSA) to reaction mixtures at 0.1-0.5 μg/μL; (3) Implementing an aqueous two-phase system during sample preparation; (4) Using polymerases known to be inhibitor-resistant [12] [11] [3].
Q4: How can I distinguish between true negative results and inhibition in ddPCR? The implementation of an internal amplification control (IAC) is essential. An IAC should be included in each reaction at a low copy number to verify that amplification can occur. Partitions containing the IAC should be distinguishable from target-positive partitions through different fluorescent channels [3].
Troubleshooting Guide: Common ddPCR Issues with Stool Samples
Table 1: Troubleshooting Common ddPCR Problems with Stool Samples
| Problem | Potential Causes | Solutions | Preventive Measures |
|---|---|---|---|
| Low positive partition count | PCR inhibition, insufficient template, poor partitioning | Dilute DNA extract 5-fold, add BSA (0.1-0.5 μg/μL), verify droplet generation | Implement inhibitor removal during DNA extraction, optimize template input [12] [3] |
| High false-positive rate | Contamination, poor assay specificity, droplet misclassification | Use separate pre-PCR workspace, redesign probes/primers, adjust fluorescence threshold | Include no-template controls, validate assay specificity with wild-type samples [84] |
| Poor partition quality | Viscous samples (undigested genomic DNA), improper oil:sample ratio | Digest genomic DNA with restriction enzymes, optimize droplet generator settings | Fragment DNA before analysis, ensure proper sample viscosity [82] |
| Inconsistent results between replicates | Uneven partitioning, pipetting errors, inhibitor distribution | Use reverse pipetting for droplets, ensure homogeneous mixing, increase replication | Implement consistent droplet handling protocols, use automated dispensers [82] |
| NaN (Not a Number) results | Saturation (too many positive partitions), insufficient negative partitions | Dilute template, increase total partition count, re-analyze with adjusted settings | Determine optimal template concentration range beforehand [85] |
Experimental Protocols for Overcoming PCR Inhibition
BSA Supplementation Protocol
Based on research demonstrating complete elimination of PCR inhibitors in stool samples through BSA addition:
- Prepare DNA extract from stool samples using your preferred extraction method.
- Prepare ddPCR master mix according to manufacturer's instructions.
- Supplement with BSA: Add BSA to a final concentration of 0.1-0.5 μg/μL in the reaction mixture.
- Include controls: Always process a non-supplemented aliquot of the same DNA extract for comparison.
- Proceed with droplet generation and thermal cycling according to established protocols [12].
Validation: Compare results with and without BSA supplementation. Effective inhibition removal is indicated by increased target detection and improved IAC amplification.
Aqueous Two-Phase System for Sample Preparation
This method effectively separates PCR inhibitors from target microorganisms in stool samples:
- Prepare aqueous two-phase system composed of 8% (w/w) PEG 4000 and 11% (w/w) dextran 40.
- Homogenize stool sample in appropriate buffer (e.g., phosphate-buffered saline).
- Mix sample with two-phase system and incubate to allow phase separation.
- Recover bottom phase containing microorganisms while inhibitors partition to the top phase.
- Proceed with DNA extraction from the bottom phase [11].
Efficiency: This approach has been shown to improve PCR detection sensitivity by 3-5 orders of magnitude in inhibitory stool samples [11].
Determining Limits of Detection in Inhibitory Matrices
Adapted from methodologies for EGFR mutation detection:
- Prepare wild-type DNA background resembling sample matrix.
- Spike with known quantities of target sequence covering expected detection range (e.g., 0.0005% to 1% mutant fraction).
- Extract DNA using standardized protocol with inhibition control measures.
- Run ddPCR analysis with multiple replicates (typically N=4 per dilution point).
- Calculate false-positive rate from wild-type only samples (N=58-71 recommended).
- Apply Poisson statistics to determine confidence limits for detection [84].
The Scientist's Toolkit: Essential Reagents & Materials
Table 2: Key Research Reagent Solutions for ddPCR with Stool Samples
| Reagent/Material | Function | Application Notes | References |
|---|---|---|---|
| Bovine Serum Albumin (BSA) | Binds inhibitors, stabilizes enzymes | Add at 0.1-0.5 μg/μL final concentration to relieve inhibition | [12] |
| PEG-Dextran Two-Phase System | Partitioning of inhibitors away from targets | 8% PEG 4000, 11% Dextran 40; effective for complex samples | [11] |
| Inhibitor-Resistant Polymerases | Withstand common stool inhibitors | Not all polymerases equally affected by inhibitors | [3] |
| Droplet Stabilizer Oil | Creates stable water-in-oil emulsions | System-specific formulations required | [82] |
| Internal Amplification Controls (IAC) | Distinguishes true negatives from inhibition | Must be distinguishable from target in different channel | [3] |
| Restriction Enzymes | Fragments genomic DNA for better partitioning | Essential for viscous samples; ensure no cut sites in target | [82] |
Workflow Diagrams for Inhibition Management
Sample Processing and Inhibition Management Workflow
Data Presentation: Quantitative Aspects of ddPCR Performance
Table 3: Quantitative Performance Metrics of ddPCR in Challenging Samples
| Application Context | Reported Sensitivity | Reported Specificity | Key Performance Parameters | Reference |
|---|---|---|---|---|
| Mycobacterium tuberculosis in respiratory specimens | 61.22% (95% CI: 55.00-67.10%) for total PTB | 95.03% (95% CI: 92.20-97.10%) for total PTB | Outperformed Xpert MTB/RIF in smear-negative cases (53.08% vs 28.46%, P=0.020) | [86] |
| EGFR L858R mutation detection | 1 mutant in 180,000 wild-type molecules (95% confidence) | False-positive rate: 1 in 14 million molecules | Enabled detection in 70 million DNA copies processed | [84] |
| EGFR T790M mutation detection | 1 mutant in 13,000 wild-type molecules | Not specifically reported | Limited by assay sensitivity rather than input DNA | [84] |
| MAP detection in cattle feces with 5-fold dilution | Increased from 55% to 80% vs fecal culture | Maintained 99% specificity | 19.94% of extracts showed inhibition; dilution provided 3.3-fold average increase in quantification | [3] |
Advanced Technical Considerations
Poisson Statistics and Data Interpretation
The fundamental principle of digital PCR quantification relies on Poisson statistics, which accounts for the probability of multiple targets residing in a single partition. The actual copy number is calculated from the proportion of negative partitions using the formula:
[ \text{Concentration} = -\ln(1 - p) \times \text{partitions per volume} ]
where ( p ) represents the fraction of positive partitions [82]. This correction becomes increasingly important at higher concentrations where the likelihood of multiple targets per partition rises. When the concentration is too high, indicated by too few negative partitions, the software may return "NaN" (Not a Number) results, requiring template dilution and re-analysis [85].
Establishing Valid Cut-off Values
In the context of stool sample analysis with inherent inhibition challenges, establishing robust cut-off values requires:
- Characterization of false-positive rates using wild-type samples processed through the entire workflow.
- Inhibition-adjusted thresholds that account for variations in sample quality.
- Sample-specific quality controls to identify partially inhibited reactions.
- Statistical confidence limits based on Poisson distribution of positive partitions [84].
For clinical applications, the cut-off should provide optimal diagnostic sensitivity and specificity, as demonstrated in the MTB detection study where ddPCR showed superior performance compared to existing methods for smear-negative pulmonary tuberculosis [86].
Successfully utilizing digital PCR for absolute quantification and cut-off validation in stool sample research requires a comprehensive approach to address PCR inhibition. By implementing the troubleshooting guides, experimental protocols, and reagent solutions outlined in this technical resource, researchers can overcome the challenges posed by inhibitory substances in complex matrices. The integration of appropriate inhibition control measures, including BSA supplementation, aqueous two-phase sample preparation, and internal amplification controls, enables reliable detection and quantification even in the most challenging stool samples. Through methodical validation and application of these strategies, ddPCR emerges as a powerful tool for advancing research and diagnostic applications involving complex sample matrices.
FAQ: What are the typical acceptable ranges for inter-batch and intra-batch CV in stool qPCR?
The acceptable Coefficient of Variation (CV) for reproducible qPCR assays in stool samples is generally below 5% for intra-batch precision and below 10% for inter-batch precision, as demonstrated in optimized systems [87].
The table below summarizes quantitative CV data from studies developing qPCR assays for pathogen detection in stool or fecal samples:
| Study Target | Intra-batch CV | Inter-batch CV | Technical Context |
|---|---|---|---|
| Spirometra mansoni Detection [87] | < 5% | < 5% | qPCR on cat fecal DNA; optimized primers/probe. |
| Enteropathogen nL-qPCR Chip [88] | Reproducible across 15-20 chips, four operators, two facilities. | Standard curves run by multiple operators showed reproducible efficiencies. | |
| Limosilactobacillus reuteri Quantification [89] | qPCR showed almost as good reproducibility as ddPCR with kit-based DNA isolation. | Systematic comparison of qPCR and ddPCR for bacterial strain quantification. |
FAQ: How do I calculate the inter-batch and intra-batch CV for my stool qPCR experiment?
The Coefficient of Variation (CV) is calculated as the standard deviation divided by the mean, expressed as a percentage. For qPCR, this is typically applied to the mean quantification cycle (Cq) or concentration values from replicate runs.
- Intra-batch CV (Repeatability): Calculate the CV of Cq values from multiple replicates (e.g., triplicates) within the same run, using the same batch of reagents, operator, and equipment [87].
- Inter-batch CV (Intermediate Precision): Calculate the CV of results (e.g., mean Cq of replicates) obtained from the same samples across different runs performed on different days, potentially by different operators and/or using different reagent batches [87].
FAQ: My CV values are too high. What are the main causes and solutions for poor reproducibility in stool qPCR?
High CVs often stem from stool-specific challenges and suboptimal protocols. The flowchart below outlines a systematic troubleshooting path.
Detailed Troubleshooting Steps
Problem: Sample Inhomogeneity
- Cause: Stool is a heterogeneous matrix. Spot sampling from a single location can lead to significant variation in target organism concentration [90].
- Solution: Collect a larger volume of feces and take multiple scoops from different locations of the stool. Use rigorous homogenization methods, such as milling devices that grind deep-frozen samples into a fine powder, to reduce variability [90].
Problem: PCR Inhibition
- Cause: Stool contains complex PCR inhibitors (e.g., bile salts, polysaccharides, heme, complex acidic polysaccharides) that co-extract with DNA, leading to inefficient amplification and variable results [91] [92] [93].
- Solutions:
- Use Optimized DNA Kits: Employ kit-based DNA isolation methods specifically validated for stool samples, which are more effective at removing inhibitors than traditional phenol-chloroform methods [89].
- Add PCR Facilitators: Include Bovine Serum Albumin (BSA) or spermidine in the PCR reaction. BSA binds to inhibitors, allowing amplification in the presence of hemoglobin and lactoferrin [91]. Spermidine has been shown to dramatically improve amplification efficiency from stool DNA, acting as a PCR facilitator [93].
Problem: Suboptimal Protocol
- Cause: Unoptimized primer, probe, or Mg2+ concentrations can lead to poor assay efficiency and dimer formation, increasing variability [87] [94].
- Solution: Systematically optimize reaction conditions. For example, test different primer concentrations (e.g., 0.1, 0.2, 0.4 μM), probe concentrations (e.g., 0.25, 0.5, 1 μM), and Mg2+ concentrations (e.g., 1.5, 2.0, 2.5 mM) to find the combination that yields the highest efficiency and lowest baseline noise [87].
Problem: Reagent Variability
- Cause: Inconsistent pipetting, poor-quality reagents, or using different reagent batches across runs.
- Solution: Use a single, large master mix for all reactions in a batch. Calibrate pipettes regularly. When validating an assay, test its performance across different reagent lots to ensure consistency [88].
The Scientist's Toolkit: Key Reagent Solutions
This table lists essential reagents for overcoming reproducibility challenges in stool-based PCR.
| Reagent / Material | Function in Improving Reproducibility |
|---|---|
| Inhibitor-Resistant DNA Kits [89] | Designed to remove complex PCR inhibitors (bile salts, polysaccharides) common in stool, reducing false negatives and Cq variation. |
| Bovine Serum Albumin (BSA) [91] | Acts as an amplification facilitator by binding to PCR inhibitors (e.g., hemoglobin, lactoferrin), relieving inhibition. |
| Spermidine [93] | A polyamine that facilitates PCR amplification from inhibited stool DNA, significantly improving amplification efficiency and detection. |
| Stool Homogenization Mill [90] | Provides thorough homogenization of frozen stool samples, reducing subsampling variability for metabolites, bacteria, and targets. |
| Stable Master Mix | Using a single, large-volume master mix for all reactions in a batch minimizes pipetting error and well-to-well reagent variability. |
Experimental Protocol: Establishing Reproducibility for a New qPCR Assay on Stool
This protocol outlines the key steps for validating the inter-batch and intra-batch CV of a qPCR assay designed for stool samples.
Step 1: Sample Preparation and DNA Extraction
- Homogenization: Thoroughly mix the entire stool sample. For high-quality data, use a milling device to homogenize deep-frozen stool into a fine powder [90].
- DNA Extraction: Extract DNA from multiple aliquots of the homogenized sample using a kit-based method validated for stool. The QIAamp Fast DNA Stool Mini Kit is one example used in reproducible studies [89].
Step 2: qPCR Setup and Intra-batch Assessment
- Reaction Optimization: Prior to reproducibility tests, optimize the qPCR assay. Test different concentrations of primers, probes, and Mg2+ to achieve high amplification efficiency (90–110%) and a strong linear correlation coefficient (R² > 0.990) [87] [95].
- Intra-batch Replication: Within a single run, analyze each sample and control in at least triplicate [88].
- Calculate Intra-batch CV: For a given sample, calculate the mean and standard deviation of the Cq values from the replicates. The CV = (Standard Deviation / Mean Cq) × 100%. The CV should ideally be < 5% [87].
Step 3: Inter-batch Assessment
- Multiple Runs: Repeat the entire qPCR experiment (from the same extracted DNA samples) over at least three separate runs on different days [87].
- Introduce Variability: To rigorously test intermediate precision, use different reagent lots and/or different operators for these runs, if possible [88].
- Calculate Inter-batch CV: For each sample, calculate the mean result (e.g., mean Cq of the triplicates) from each of the three runs. Then, calculate the CV from these three mean values. The inter-batch CV is generally acceptable at < 10%.
Step 4: Data Analysis and Acceptance Criteria
- The assay is considered reproducible if both intra-batch and inter-batch CVs meet the pre-defined acceptance criteria for your study context [87] [95].
- Document all conditions (reagent lot numbers, instrument models, operator IDs) for each batch to aid in troubleshooting.
This technical support center provides targeted troubleshooting guides and FAQs to support researchers validating molecular assays across asymptomatic and symptomatic patient cohorts, with a specific focus on overcoming PCR inhibition in stool samples.
Frequently Asked Questions (FAQs)
PCR inhibitors in stool samples are frequently encountered and represent a significant challenge for diagnostic accuracy. These inhibitors can be both organic and inorganic in origin.
- Organic Inhibitors include complex polysaccharides, bilirubin, bile salts, hemoglobin, immunoglobulins, and metabolic byproducts such as urea [96]. In stool, humic acids are a particularly common inhibitor that can interact with both the DNA template and the DNA polymerase, preventing the enzymatic reaction even at low concentrations [96].
- Inorganic Inhibitors include metal ions that compete with the essential cofactor Magnesium (Mg²⁺), and substances like EDTA that chelate Magnesium, effectively reducing its available concentration in the reaction [96].
The prevalence is significant. One study focusing on infant stool samples found that 19% of samples contained high levels of PCR inhibitors that could lead to false-negative results. This problem was more common in older infants (6-24 months), likely due to dietary changes, compared to none in infants under 6 months who were predominantly breastfed [13] [12].
My assay shows perfect sensitivity with control samples but fails with patient stool samples. What are the first steps to resolve this?
This classic sign of PCR inhibition indicates that your reaction components are functional, but something in the sample preparation is interfering. Your first steps should be:
- Confirm Inhibition: Introduce an internal control (e.g., a known quantity of exogenous DNA or RNA) into your reaction. A reduction or loss of amplification of this control when spiked into the patient sample extract confirms the presence of inhibitors [13].
- Dilute the Template: A simple and effective first intervention is to dilute the extracted nucleic acid template. This can dilute the inhibitor to a concentration below its effective threshold, though it may also dilute the target [96] [4].
- Use a Additive: Add Bovine Serum Albumin (BSA) to your PCR reactions. BSA has been shown to be highly effective at neutralizing a wide range of inhibitors in stool samples. In one study, the addition of BSA eliminated the inhibitory effect in all tested samples, allowing for successful amplification [12].
- Re-optimize DNA Extraction: Ensure you are using a robust, validated DNA extraction method. Automated systems using magnetic bead-based technology (e.g., MagNA Pure 96 System) can provide more consistent results from complex samples like stool [97].
How do I validate an assay for an asymptomatic cohort where viral load may be lower?
Validating assays for asymptomatic cohorts requires a heightened focus on sensitivity and rigorous testing to avoid false negatives.
- Define Clinical Performance: Test your assay against a known set of positive and negative samples from both asymptomatic and symptomatic individuals. A study on SARS-CoV-2 demonstrated that antibody assays showed 100% concordance with PCR in symptomatic patients, but their utility in asymptomatic individuals required careful evaluation of kinetics, with some individuals seroconverting later [98]. This underscores the need to understand the temporal dynamics of your target.
- Use a High-Sensitivity Polymerase: Choose a DNA polymerase known for high sensitivity and robust performance, which can be critical for detecting low-abundance targets [7] [99].
- Adjust Cycling Parameters: Slightly increasing the number of PCR cycles (e.g., up to 40 cycles) can help amplify low-level targets, though care must be taken to avoid increasing background noise [7] [96].
- Incorporate an Internal Control: This is non-negotiable for asymptomatic screening. An internal control verifies that every negative result is a true negative and not a false negative caused by inhibition [13].
My PCR produces nonspecific bands or smears. How can I improve specificity, especially with complex templates?
Nonspecific amplification often arises from suboptimal reaction stringency.
- Increase Annealing Temperature: The most common solution is to increase the annealing temperature in increments of 2°C. Use a gradient thermal cycler to empirically determine the optimal temperature for your primer set [7] [99] [100].
- Employ a Hot-Start Polymerase: Use a hot-start DNA polymerase to prevent enzyme activity during reaction setup at room temperature, which is a common cause of primer-dimer formation and nonspecific amplification [7] [99] [4].
- Optimize Mg²⁺ Concentration: Mg²⁺ concentration is critical. Excess Mg²⁺ can reduce fidelity and promote mispriming. Optimize the concentration in 0.2-1 mM increments [99] [4].
- Check Primer Design: Verify that your primers are specific to the target and do not form stable dimers with themselves or each other. Software tools are available to analyze this [7] [100]. Redesigning primers may be necessary.
- Reduce Template Amount: Too much template DNA can lead to nonspecific binding. Reduce the amount of input DNA by 2- to 5-fold [96].
Troubleshooting Guide: Common PCR Issues in Stool Sample Research
Table 1: Common problems, their causes, and solutions when working with stool samples.
| Observation | Possible Cause | Recommended Solution |
|---|---|---|
| No Amplification or Low Yield | PCR inhibitors from stool (e.g., polysaccharides, humic acids) [13] [96] | Dilute DNA template 1:10 to 1:100; add BSA (0.1-0.5 µg/µL) to the reaction; re-purify DNA using a robust kit [96] [12]. |
| Suboptimal PCR conditions | Optimize Mg²⁺ concentration; increase number of cycles (up to 40); use a DNA polymerase with high processivity and tolerance to inhibitors [7] [99]. | |
| False Negative Results | Inhibition not detected due to lack of control | Implement an internal control in every reaction to detect inhibition [13]. |
| Low pathogen load in asymptomatic carriers | Use a high-sensitivity polymerase; increase sample volume for extraction; increase number of PCR cycles [7] [98]. | |
| Nonspecific Bands/Smearing | Reaction conditions not stringent enough | Increase annealing temperature; use hot-start polymerase; optimize primer concentrations; reduce number of cycles [96] [99]. |
| Poor primer design or degradation | Redesign primers to avoid secondary structures and self-complementarity; aliquot and store primers correctly [7] [100]. | |
| Inconsistent Results Between Cohorts | Differential inhibition levels (e.g., diet-related) | Standardize sample collection and use a validated, automated DNA extraction system to minimize variability [13] [97]. |
| True biological differences in target abundance | Validate assay limit of detection (LOD) specifically for low-load scenarios representative of asymptomatic carriers [98]. |
Quantitative Data on PCR Inhibition in Stool Research
Table 2: Empirical data on the occurrence and impact of PCR inhibition in stool samples.
| Parameter | Finding | Research Context |
|---|---|---|
| Frequency of Complete Inhibition | 12% (13/108 samples) | Stool samples from infants; led to complete amplification failure [12]. |
| Frequency of Partial Inhibition | 19% (21/108 samples) | Stool samples from infants; led to reduced amplification efficiency [12]. |
| Age/Diet Correlation | 0% (0/31) in infants <6 months vs 17% in 6-24 month-olds | Inhibition correlated with introduction of solid food, less common in exclusively breastfed infants [13] [12]. |
| Effectiveness of BSA | 100% success post-treatment | Addition of BSA to the PCR reaction eliminated inhibition, allowing all samples to amplify successfully [12]. |
The Scientist's Toolkit: Key Research Reagent Solutions
Table 3: Essential reagents and their functions for overcoming challenges in stool-based assay validation.
| Reagent | Primary Function | Application Note |
|---|---|---|
| BSA (Bovine Serum Albumin) | Neutralizes a wide range of PCR inhibitors by binding them, preventing their interference with the DNA polymerase [12]. | Add to the PCR mastermix. A cost-effective and highly effective strategy for regaining sensitivity in inhibited samples. |
| Hot-Start DNA Polymerase | Remains inactive at room temperature, preventing non-specific priming and primer-dimer formation during reaction setup [7] [99]. | Essential for improving specificity and yield. Choose enzymes with high processivity for complex templates. |
| Internal Control (IC) | Distinguishes between true target-negative results and false negatives caused by PCR inhibition or reaction failure [13]. | Must be added to each sample during nucleic acid extraction or directly to the PCR reaction. Critical for data integrity. |
| Inhibitor-Resistant Polymerase Blends | Specially formulated polymerases and buffers designed to maintain activity in the presence of common inhibitors found in clinical and environmental samples [96]. | Use when working with particularly challenging sample matrices or when standard optimization fails. |
| Magnetic Bead-Based NA Kits | Automated nucleic acid extraction that provides pure, inhibitor-free DNA/RNA, minimizing carryover of contaminants from the sample [97]. | Crucial for standardizing sample processing in multi-cohort studies and ensuring consistent DNA quality. |
Experimental Workflow for Validating Assays on Multiple Cohorts
The following diagram illustrates a robust experimental workflow for validating molecular assays across both asymptomatic and symptomatic patient cohorts, integrating steps to manage PCR inhibition.
Assay Validation and Inhibition Management Workflow
Detailed Experimental Protocol: Using BSA to Overcome PCR Inhibition
The following protocol is adapted from published research demonstrating the efficacy of BSA in neutralizing PCR inhibitors in stool samples [12].
Objective: To restore PCR amplification efficiency in inhibited stool sample extracts.
Materials:
- PCR master mix (including buffer, dNTPs, primers, Mg²⁺, DNA polymerase)
- Molecular-grade Bovine Serum Albumin (BSA)
- Nucleic acid template extracted from stool samples
- Nuclease-free water
- Positive control template (known to amplify without inhibition)
Method:
- Prepare BSA Stock Solution: Prepare a 10-20 mg/mL stock solution of BSA in nuclease-free water. Aliquot and store at -20°C.
- Set Up PCR Reactions:
- Test Reaction: Add BSA from the stock solution to the PCR master mix to achieve a final concentration of 0.1 - 0.5 µg/µL in the final reaction volume.
- Control Reaction: Set up an identical reaction without BSA.
- Amplify: Add the same volume of inhibited nucleic acid template to both reactions. Run the PCR using your standard cycling parameters.
- Analyze: Compare the amplification results (e.g., on a gel or via qPCR Cq values) between the reaction with BSA and the control reaction without BSA.
Expected Outcome: Successful amplification in the BSA-supplemented reaction, indicated by a strong specific band or a significantly lower Cq value, compared to weak or no amplification in the control reaction.
Conclusion
Overcoming PCR inhibition in stool samples is not a single-step fix but requires an integrated approach spanning sample collection, nucleic acid extraction, and amplification. The key takeaways are that inhibitor-resistant master mixes, optimized DNA extraction protocols, and the use of short amplicons can dramatically improve detection sensitivity. Furthermore, validation with techniques like digital PCR and sequencing is paramount for confirming assay accuracy. Future directions point toward greater standardization of protocols across laboratories and the development of even more robust chemistries capable of handling the diverse inhibitor profiles found in global populations. For biomedical research and clinical diagnostics, mastering these techniques is fundamental to unlocking the full potential of stool-based molecular analysis for disease detection, microbiome studies, and therapeutic development.
References
- 1. in qPCR, dPCR and MPS— PCR and... inhibition mechanisms [https://pmc.ncbi.nlm.nih.gov/articles/PMC7072044/]
- 2. Forensic implications of PCR inhibition—A review [https://www.sciencedirect.com/science/article/abs/pii/S1872497311001797]
- 3. Frontiers | PCR of a Quantitative Inhibition for Detection of... PCR [https://www.frontiersin.org/journals/microbiology/articles/10.3389/fmicb.2017.00115/full]
- 4. PCR Troubleshooting: Common Problems and Solutions [https://www.mybiosource.com/learn/pcr-troubleshooting-common-problems-and-solutions/]
- 5. Inhibition Controls for Qualitative Real-Time PCR Assays [https://pmc.ncbi.nlm.nih.gov/articles/PMC4042775/]
- 6. PCR Troubleshooting Guide [https://www.neb.com/en-us/tools-and-resources/troubleshooting-guides/pcr-troubleshooting-guide?srsltid=AfmBOorB1xzhS7h5oNpjh7bY_h5xnB8ww4zgNVYPrIwzQWAYaXTVjhBX]
- 7. PCR Troubleshooting Guide | Thermo Fisher Scientific - US [https://www.thermofisher.com/us/en/home/life-science/cloning/cloning-learning-center/invitrogen-school-of-molecular-biology/pcr-education/pcr-reagents-enzymes/pcr-troubleshooting.html]
- 8. Complex polysaccharides as PCR inhibitors in feces [https://pmc.ncbi.nlm.nih.gov/articles/PMC229720/]
- 9. Complex polysaccharides as PCR inhibitors in feces [https://pubmed.ncbi.nlm.nih.gov/9157172/]
- 10. Detection of Helicobacter pylori DNA in human feces by PCR [https://www.sciencedirect.com/science/article/abs/pii/S0167701201002251]
- 11. Removal of PCR inhibitors from human faecal samples ... [https://www.sciencedirect.com/science/article/abs/pii/S0167701297009792]
- 12. PCR inhibition in stool samples in relation to age of infants [https://pubmed.ncbi.nlm.nih.gov/19196549/]
- 13. PCR inhibition in stool samples in relation to age of infants [https://www.sciencedirect.com/science/article/abs/pii/S1386653208004757]
- 14. Comparative Study of DNA Extraction Methods for the PCR ... [https://pmc.ncbi.nlm.nih.gov/articles/PMC9689707/]
- 15. Removal of PCR Inhibitors by Silica Membranes [https://pmc.ncbi.nlm.nih.gov/articles/PMC88425/]
- 16. Nucleic Acid Extraction Techniques - PMC [https://pmc.ncbi.nlm.nih.gov/articles/PMC7122149/]
- 17. Evaluation of PCR-enhancing approaches to reduce ... [https://www.sciencedirect.com/science/article/abs/pii/S0048969724069250]
- 18. Polymerase chain reaction inhibitors [https://en.wikipedia.org/wiki/Polymerase_chain_reaction_inhibitors]
- 19. A comparison of four methods for PCR inhibitor removal [https://pubmed.ncbi.nlm.nih.gov/25553520/]
- 20. A comparison of four methods for PCR inhibitor removal [https://www.sciencedirect.com/science/article/pii/S1872497314002762]
- 21. Overcoming qPCR Inhibitors: Strategies for Reliable ... [https://www.promegaconnections.com/overcoming-qpcr-inhibitors-strategies-for-reliable-quantification/]
- 22. Dealing with PCR Inhibitors [https://www.promegaconnections.com/dealing-with-pcr-inhibitors/]
- 23. Inhibit inhibition: PCR inhibition and how to prevent it [https://www.bioecho.com/blog/inhibit-inhibition-pcr-inhibition-and-how-to-prevent-it]
- 24. PCR optimization for buccal swab-derived samples [https://bmcgenomics.biomedcentral.com/articles/10.1186/s12864-025-12350-x]
- 25. Best practices for RNA storage and sample handling [https://www.qiagen.com/us/knowledge-and-support/knowledge-hub/bench-guide/rna/introduction/general-remarks-on-rna-handling-storage-and-stabilization]
- 26. Different Ways Professionals Store DNA Samples [https://www.celestis.com/blog/different-ways-professionals-store-dna-samples/]
- 27. Genetic Tissue Sampling Protocol [https://saveplants.org/best-practices/guidelines-tissue-collection-and-storage-related-genetic-studies-rare-plants/]
- 28. Low-cost sample preservation methods for high-throughput ... [https://pmc.ncbi.nlm.nih.gov/articles/PMC9171989/]
- 29. PCR Troubleshooting Guide [https://www.neb.com/en-us/tools-and-resources/troubleshooting-guides/pcr-troubleshooting-guide?srsltid=AfmBOooeHBKoxoYNtga8xdpG7tawoBYkNB5fCnM6WGJtnYSDXDmYqNT1]
- 30. Troubleshooting your PCR [https://www.takarabio.com/learning-centers/pcr/faq/troubleshooting?srsltid=AfmBOorty3u_bOJCxlYZ44bM9Bo48Utjcva79aqE8-Oic89toMowEaUH]
- 31. PCR Troubleshooting Guide [https://www.genscript.com/pcr-troubleshooting-guide.html]
- 32. Tips & Tricks For RNA Isolation [https://www.zymoresearch.com/blogs/blog/tips-tricks-for-rna-isolation?srsltid=AfmBOorS7DjMQYm5yqkurhU612406tKyZpEGB3kctLpI8uzf3VFpMxAU]
- 33. Comparative Study of DNA Extraction Methods for the PCR ... [https://www.mdpi.com/2075-4418/12/11/2588]
- 34. Comparison of DNA extraction methods on different ... [https://www.nature.com/articles/s41598-024-59086-4]
- 35. Comparison of commercially available DNA and RNA ... [https://pubmed.ncbi.nlm.nih.gov/39268902/]
- 36. Comparison of commercially available DNA and RNA ... [https://doaj.org/article/bf24e9e4f21b46ecb56f2ff01ebbeadd]
- 37. A rapid and high-yield method for nucleic acid extraction [https://www.nature.com/articles/s41598-025-95226-0]
- 38. Mechanical Disruption of Lysis-Resistant Bacterial Cells by ... [https://pmc.ncbi.nlm.nih.gov/articles/PMC3147885/]
- 39. Incomplete cell disruption of resistant microbes [https://www.nature.com/articles/s41598-019-42188-9]
- 40. Microbiome standard used to validate several bead beaters [https://www.zymoresearch.com/blogs/blog/the-lysis-bias-crisis?srsltid=AfmBOoozu_CcqOELakc_KXlhaizIEWBzIlpVsji5cSbu6G-IkK0WtO8Z]
- 41. A method for assessing efficiency of bacterial cell disruption ... [https://bmcmicrobiol.biomedcentral.com/articles/10.1186/s12866-016-0815-3]
- 42. Flotation—A New Method to Circumvent PCR Inhibitors in ... [https://pmc.ncbi.nlm.nih.gov/articles/PMC2777015/]
- 43. Applying a PCR inhibitor tolerant DNA polymerase blend in ... [https://www.sciencedirect.com/science/article/abs/pii/S1875176811001752]
- 44. Live culture-based qPCR screening of Taq DNA ... [https://pubmed.ncbi.nlm.nih.gov/40948961/]
- 45. Live culture-based qPCR screening of Taq DNA ... [https://www.frontiersin.org/journals/bioengineering-and-biotechnology/articles/10.3389/fbioe.2025.1624735/full]
- 46. How to Work with Challenging or Limited Genomic ... [https://blog.omni-inc.com/blog/how-to-work-with-challenging-or-limited-genomic-samples-updated-for-2025]
- 47. Engineering and enhancement of Bst DNA polymerase ... [https://www.sciencedirect.com/science/article/abs/pii/S0141813025092487]
- 48. The effect of internal control sequence and length on ... [https://www.sciencedirect.com/science/article/abs/pii/S1872497313002226]
- 49. Peculiarities of Diagnostic Reliability—Nested PCR Versus ... [https://pmc.ncbi.nlm.nih.gov/articles/PMC12301005/]
- 50. Practical Considerations in Design of Internal Amplification ... [https://pmc.ncbi.nlm.nih.gov/articles/PMC404670/]
- 51. Primer design tools for PCR & qPCR | IDT [https://www.idtdna.com/page/support-and-education/decoded-plus/design-efficient-pcr-and-qpcr-primers-and-probes-using-online-tools/]
- 52. dPCR and qPCR Assays | Predesigned and Custom [https://geneglobe.qiagen.com/us/applications/digital-pcr/dpcr-and-qpcr-assays-portfolio]
- 53. Advancements in analytical methods for studying the ... [https://pmc.ncbi.nlm.nih.gov/articles/PMC11973056/]
- 54. Application of PCR-Based Techniques for the Identification ... [https://www.mdpi.com/2036-7449/16/5/75]
- 55. Branch migration inhibition in PCR-amplified DNA [https://pmc.ncbi.nlm.nih.gov/articles/PMC103315/]
- 56. Selection of optimal extraction and RT-PCR protocols for ... [https://www.nature.com/articles/s41598-024-78680-0]
- 57. Validation of reference genes as an internal control for ... [https://www.nature.com/articles/s41598-022-18746-z]
- 58. PCR inhibition in stool samples in relation to age of infants [https://www.sciencedirect.com/science/article/pii/S1386653208004757]
- 59. Troubleshooting your PCR [https://www.takarabio.com/learning-centers/pcr/faq/troubleshooting?srsltid=AfmBOorwITVbqVr6TUOyXl7Mm-1QJpP7Xybbw1okLheByi7dS-AAuEdu]
- 60. Tips for coping with PCR inhibitors [https://www.npdn.org/newsletter/2020/12/article/3]
- 61. How to do serial dilutions (including calculations) | INTEGRA [https://www.integra-biosciences.com/united-states/en/blog/article/how-do-serial-dilutions-including-calculations]
- 62. Enhancing PCR amplification of DNA from recalcitrant ... [https://pmc.ncbi.nlm.nih.gov/articles/PMC4105354/]
- 63. Comprehensive evaluation of molecular enhancers of the ... [https://www.nature.com/articles/srep37837]
- 64. Investigating concentration effects on reaction efficiency ... [https://pubmed.ncbi.nlm.nih.gov/40436087/]
- 65. Optimization of TaqMan-based quantitative PCR diagnosis ... [https://pmc.ncbi.nlm.nih.gov/articles/PMC12165414/]
- 66. Inhibitor Tolerant qPCR Buffer, 5x [https://www.meridianbioscience.com/lifescience/products/molecular/inhibitor-tolerant-pcr-buffer-5x/]
- 67. Development of loop mediated isothermal amplification ... [https://www.nature.com/articles/s41598-025-93995-2]
- 68. Inhibition of PCR amplification by phytic acid, and ... [https://www.sciencedirect.com/science/article/abs/pii/S0167701204001526]
- 69. Peculiarities of Diagnostic Reliability—Nested PCR Versus ... [https://www.mdpi.com/2076-2607/13/7/1498]
- 70. Evaluation of DNA Extraction and PCR Methods for ... [https://pmc.ncbi.nlm.nih.gov/articles/PMC497608/]
- 71. PCR Inhibition of a Quantitative PCR for Detection ... [https://pmc.ncbi.nlm.nih.gov/articles/PMC5288348/]
- 72. 2025 Trends: NGS [https://www.genengnews.com/topics/genome-editing/2025-trends-ngs/]
- 73. DNA Sequencing: How to Choose the Right Technology [https://frontlinegenomics.com/dna-sequencing-how-to-choose-the-right-technology/]
- 74. How to Troubleshoot Sequencing Preparation Errors (NGS ... [https://www.cd-genomics.com/resource-sequencing-preparation-troubleshooting.html]
- 75. PCR Troubleshooting Guide [https://www.neb.com/en-us/tools-and-resources/troubleshooting-guides/pcr-troubleshooting-guide?srsltid=AfmBOoobxAN1im49u0PMWdMAO9w2vDPSyokBTjhJnUh1EFAMTnSv3elD]
- 76. Validating Real-Time Polymerase Chain Reaction (PCR) Assays [https://pmc.ncbi.nlm.nih.gov/articles/PMC7834634/]
- 77. Troubleshooting your PCR [https://www.takarabio.com/learning-centers/pcr/faq/troubleshooting?srsltid=AfmBOoqt218eotVABfU5mDpM-rB5lS601nUwoFMZxXcTQXh-bwjyouc2]
- 78. PCR Troubleshooting Guide [https://www.neb.com/en-us/tools-and-resources/troubleshooting-guides/pcr-troubleshooting-guide?srsltid=AfmBOoqzxPpKCshbo1JKjGlZEnORbuiDlNHcTX4iAcxYyAB8Pk_t02Oc]
- 79. Comparison of commercial and in-house Real-time PCR ... [https://bmcmicrobiol.biomedcentral.com/articles/10.1186/1471-2180-7-22]
- 80. Comparison of Commercial and In-House Real-Time PCR ... [https://pmc.ncbi.nlm.nih.gov/articles/PMC2643664/]
- 81. Comparison of commercial realtime reverse transcription ... [https://www.sciencedirect.com/science/article/pii/S1386653220302523]
- 82. How to Setup Your First Droplet Digital PCR Experiment [https://bitesizebio.com/34278/droplet-digital-pcr-experiment/]
- 83. Digital PCR: Principles and Applications [https://pubmed.ncbi.nlm.nih.gov/26843045/]
- 84. Determining lower limits of detection of digital PCR assays ... [https://pmc.ncbi.nlm.nih.gov/articles/PMC5129438/]
- 85. QuantStudio Absolute Q Digital PCR System Support ... [https://www.thermofisher.com/us/en/home/technical-resources/technical-reference-library/real-time-digital-PCR-instruments-support-center/quantstudio-absolute-q-system-support/quantstudio-absolute-q-system-support-troubleshooting.html]
- 86. A new droplet digital PCR assay: improving detection of ... [https://www.sciencedirect.com/science/article/pii/S1201971222004374]
- 87. Development of PCR, qPCR and LAMP methods for the ... [https://pmc.ncbi.nlm.nih.gov/articles/PMC12508883/]
- 88. High-Throughput Multiparallel Enteropathogen Detection ... [https://www.frontiersin.org/journals/cellular-and-infection-microbiology/articles/10.3389/fcimb.2020.00351/full]
- 89. Highly accurate and sensitive absolute quantification of ... [https://pmc.ncbi.nlm.nih.gov/articles/PMC11380787/]
- 90. Evaluation of inter- and intra-variability in gut health ... [https://www.nature.com/articles/s41598-024-75477-z]
- 91. Purification and Characterization of PCR-Inhibitory ... [https://pmc.ncbi.nlm.nih.gov/articles/PMC87763/]
- 92. Real-Time PCR Method for Detection of Encephalitozoon ... [https://pmc.ncbi.nlm.nih.gov/articles/PMC139654/]
- 93. Improved amplification efficiency on stool samples by addition ... [https://bmcbiotechnol.biomedcentral.com/articles/10.1186/s12896-015-0148-6]
- 94. Development and evaluation of optimized PCR ... [https://www.frontiersin.org/journals/veterinary-science/articles/10.3389/fvets.2025.1532600/full]
- 95. Recommendations for Method Development and ... [https://link.springer.com/article/10.1208/s12248-023-00880-9]
- 96. Troubleshooting your PCR [https://www.takarabio.com/learning-centers/pcr/faq/troubleshooting?srsltid=AfmBOopBgpo0jfP2w_XhmbsQauTPJQEF3OT4TY6MW2aiH1ktpBw7w4wm]
- 97. Comparative analysis of commercial and “In-House ... [https://parasitesandvectors.biomedcentral.com/articles/10.1186/s13071-025-06879-9]
- 98. Antibodies response in symptomatic and asymptomatic SARS ... [https://journals.plos.org/plosone/article?id=10.1371/journal.pone.0308850]
- 99. PCR Troubleshooting Guide [https://www.neb.com/en-us/tools-and-resources/troubleshooting-guides/pcr-troubleshooting-guide?srsltid=AfmBOopbuwdiNWUTTyyyq2FWWUmnkjldRb6FjhqIbATyJ_a12KbEHXII]
- 100. PCR Assay Optimization and Validation [https://www.sigmaaldrich.com/US/en/technical-documents/technical-article/genomics/pcr/assay-optimization-and-validation?srsltid=AfmBOoqvIk41dbV7nzx2l5Cl6jbdMtnNJn3Sl_TTXJeYFIMkAgMF-aLS]