Landmark vs. Outline Methods: A Comparative Analysis of Identification Accuracy in Biomedical Research
This article provides a comprehensive comparison of landmark-based and outline-based methods for object identification, a critical task in biomedical imaging and morphological analysis.
Landmark vs. Outline Methods: A Comparative Analysis of Identification Accuracy in Biomedical Research
Abstract
This article provides a comprehensive comparison of landmark-based and outline-based methods for object identification, a critical task in biomedical imaging and morphological analysis. Aimed at researchers and drug development professionals, it explores the foundational principles, methodological applications, and relative performance of these techniques across diverse use cases, from taxonomic classification of disease vectors to anatomical feature detection in clinical radiology. By synthesizing recent validation studies and troubleshooting common challenges, this review offers evidence-based guidance for selecting and optimizing identification methods to enhance the accuracy and efficiency of biomedical research.
Core Principles: Understanding Landmark and Outline Identification Methods
Landmark-based methods are computational approaches that identify precise, repeatable points of interest—known as keypoints or landmarks—on objects within images or 3D data. In anatomical and biological research, these methods pinpoint specific locations on anatomical structures, providing a critical foundation for quantitative shape analysis, morphological comparisons, and identification tasks [1]. The core principle involves detecting sparse sets of highly repeatable anchor points that can be tracked, matched, or triangulated across different samples or imaging modalities [1].
These methods are conceptually distinct from outline-based approaches, which capture shape information through continuous curves or contours. While outline methods like elliptical Fourier analysis or eigenshape analysis represent complete boundaries, landmark methods focus on discrete, homologous points that often carry specific biological or functional significance [2] [3]. This discrete representation makes landmark methods particularly valuable for studying complex morphological structures where specific anatomical correspondence is essential for statistical shape analysis and comparative morphology.
Methodological Comparison: Landmark vs. Outline Approaches
Fundamental Differences and Applications
Landmark and outline approaches represent two distinct paradigms in geometric morphometrics, each with unique strengths and limitations for identification accuracy research.
Landmark-based methods rely on identifying homologous points—anatomical locations that correspond across different specimens or species. These methods require a priori identification of discrete points that maintain biological correspondence, making them particularly suitable for structures with clear homologous features [2]. However, this strength also presents a key challenge: the a priori identification of homologous landmarks on artefacts or biological structures can be difficult and inherently subjective unless unambiguous theoretical expectations are available [2]. Landmark approaches can lose detailed shape information between points but provide straightforward ways to delineate homologous structures essential for evolutionary and developmental comparisons [2].
Outline-based methods capture shape information through continuous curves or contours using mathematical representations like elliptical Fourier analysis or eigenshape analysis. These approaches offer robust, information-rich ways to systematically capture artefact shape data without requiring predefined homologous points [2]. Outline methods are particularly advantageous for structures lacking clear homologous points or when analyzing legacy data such as artefact line drawings from archaeological literature [2].
Table: Comparative Analysis of Landmark vs. Outline Methods
| Feature | Landmark-Based Methods | Outline-Based Methods |
|---|---|---|
| Data Representation | Discrete homologous points | Continuous curves/contours |
| Biological Correspondence | Directly encodes homology | Infers correspondence through shape |
| Information Capture | May lose information between points | Captures complete shape information |
| Subjectivity | Requires subjective landmark identification | More objective shape capture |
| Application Suitability | Structures with clear homologs | Complex shapes without clear homologs |
| Data Sources | Requires original specimens | Can use legacy drawings/photos |
Performance Comparison in Identification Accuracy
Comparative studies have demonstrated that the choice between landmark and outline methods significantly impacts classification accuracy in morphological research. A comprehensive methodological study comparing these approaches found that classification success rates were not highly dependent on the specific outline measurement technique used, but rather on the fundamental difference between discrete point-based versus continuous contour-based representations [3].
In archaeological applications, landmark-based analyses of stone artefacts have been successfully compared with whole-outline approaches, revealing that outlines can offer an efficient and reliable alternative, especially when homologous landmark identification is challenging [2]. This benchmarking exercise demonstrated that both approaches could successfully discriminate between distinctive tool shapes and suggest cultural evolutionary histories matching typo-chronological patterns [2].
The critical methodological consideration emerges in phylogenetic applications: while landmarks can serve as valid characters for phylogenetic reconstructions, outlines may fail to do so in some biological contexts [2]. However, especially in cases where unambiguous placement of homologous landmarks is difficult, outlines can indeed record dynamics of evolutionary change [2].
Quantitative Performance Data Across Applications
Medical Imaging and Anatomical Landmark Detection
Medical imaging represents one of the most rigorous testing grounds for landmark detection accuracy, where millimeter-level precision can significantly impact diagnostic and treatment outcomes.
Table: Performance Metrics for Anatomical Landmark Detection in Medical Imaging
| Application | Method | Mean Error (mm) | Success Detection Rate | Key Metrics |
|---|---|---|---|---|
| 3D Cephalometric Landmarks [4] | Lightweight 3D U-Net | 1.3-1.4 mm | N/A | Robust to malocclusion, metal artifacts |
| Cephalometric X-ray Detection [5] | Diffusion-based data generation | N/A | 82.2% | 6.5% improvement over baseline |
| Anatomical Landmark Foundation Model [6] | MedSapiens (adapted from human pose estimation) | N/A | Up to 21.81% improvement over specialist models | Cross-task adaptability |
Recent advances in medical landmark detection have demonstrated remarkable accuracy improvements through specialized deep learning approaches. For 3D cephalometric landmark detection, an optimized lightweight 3D U-Net architecture achieved mean radial errors consistently below 1.3 mm for both spiral CT and cone-beam CT scans, maintaining robustness under challenging conditions including malocclusion, missing dental landmarks, and metal artifacts [4]. This implementation significantly improved landmarking proficiency of senior and junior specialists by 15.9% and 28.9% respectively while achieving a 6-9.5-fold acceleration in GUI interaction time [4].
The emerging approach of adapting human-centric foundation models for anatomical landmark detection has shown particular promise. The MedSapiens model, built upon Sapiens—a vision transformer trained for human pose estimation—demonstrated up to 21.81% improvement over specialist models in success detection rate by leveraging large-scale pretraining on over 300 million in-the-wild images [6]. This approach effectively bridges the gap between human pose estimation and domain-specific anatomical structures through multi-dataset pretraining.
Archaeological Artefact Analysis
Geometric morphometric approaches have revolutionized archaeological artefact analysis by enabling quantitative assessment of shape variability traditionally evaluated through qualitative typologies.
Table: Landmark and Outline Method Performance in Archaeological Applications
| Artefact Type | Method | Classification Outcome | Implications for Cultural Taxonomy |
|---|---|---|---|
| European Final Palaeolithic Large Tanged Points [2] | Outline-based GMM | No meaningful regional/cultural groupings | Challenges traditional typological classifications |
| Czech Bell Beaker Projectile Points [2] | Landmark-based GMM vs. outline with hierarchical clustering | Comparable discrimination success | Validates outline methods as alternative to landmarks |
| North American Paleoindian Points [2] | Landmark-based analysis | Successful taxonomic division | Supports methodological transferability |
A comprehensive comparison of typological, landmark-based, and whole-outline geometric morphometric approaches for European Final Palaeolithic large tanged points revealed surprising results: Final Palaeolithic tanged point shapes did not fall into meaningful regional or cultural evolutionary groupings but exhibited internal outline variance comparable to spatiotemporally much closer confined artefact groups of post-Palaeolithic age [2]. These findings directly challenge traditional archaeological classifications based on typology and research tradition, suggesting that many entrenched groupings may reflect disciplinary histories rather than robust empirical realities [2].
The benchmarking of outline against landmark methods demonstrated that outlines could offer an efficient and reliable alternative to landmark-based analyses. When careful application of clustering algorithms was applied to GMM outline data, researchers could successfully discriminate between distinctive tool shapes and suggest cultural evolutionary histories matching observed typo-chronological patterns [2].
Experimental Protocols and Methodologies
Protocol for Archaeological Shape Analysis
The experimental protocol for comparative landmark and outline analysis of archaeological artefacts involves a multi-step validation approach to ensure methodological rigor:
1. Data Acquisition and Preparation: Artefact outlines are captured through high-resolution imaging or digitization of existing drawings. For landmark-based approaches, homologous points are identified based on anatomical or structural correspondence.
2. Methodological Benchmarking: Existing landmark-based analyses are re-evaluated using whole-outline approaches to establish comparative performance baselines. This includes re-analysis of previously published landmark studies to validate outline method effectiveness [2].
3. Clustering and Classification Analysis: Both landmark and outline data undergo clustering analysis using algorithms optimized for shape data. The performance is evaluated through cross-validation techniques to assess classification accuracy [2].
4. Cultural Evolutionary Inference: Resulting classifications are compared against traditional typo-chronological frameworks to assess whether shape-based groupings validate or challenge existing cultural taxonomies [2].
This protocol emphasizes methodological transparency and enables direct comparison between landmark and outline approaches, facilitating assessment of their relative strengths for specific archaeological research questions.
Medical Landmark Detection Implementation
Medical imaging landmark detection employs sophisticated deep learning architectures optimized for anatomical precision:
Data Annotation and Reference Standards: Medical landmark detection requires meticulous annotation by domain experts. For 3D cephalometric landmarks, senior specialists independently annotate images with rigorous quality control by chief physicians [4]. Annotation consistency is validated through intraclass correlation coefficients (ICC ≥ 0.70) with landmarks meeting this threshold set as the "reference standard" [4].
Network Architecture: State-of-the-art approaches utilize optimized 3D U-Net architectures for volumetric medical data. These networks are trained on diverse datasets encompassing various clinical scenarios, including challenging conditions like malocclusion, missing dental landmarks, and metal artifacts [4].
Evaluation Metrics: Performance is quantified through multiple metrics including mean radial error (MRE) and success detection rate (SDR) within 2-, 3-, and 4-mm error thresholds. Comprehensive error analyses along each coordinate axis identify specific detection challenges [4].
Foundation Model Adaptation: The MedSapiens approach demonstrates how human-centric foundation models can be adapted for medical landmark detection through parameter-efficient fine-tuning using Low-Rank Adaptation (LoRA), preserving spatial hierarchies learned from large-scale pretraining while adapting to medical domain specifics [6].
Visualization of Experimental Workflows
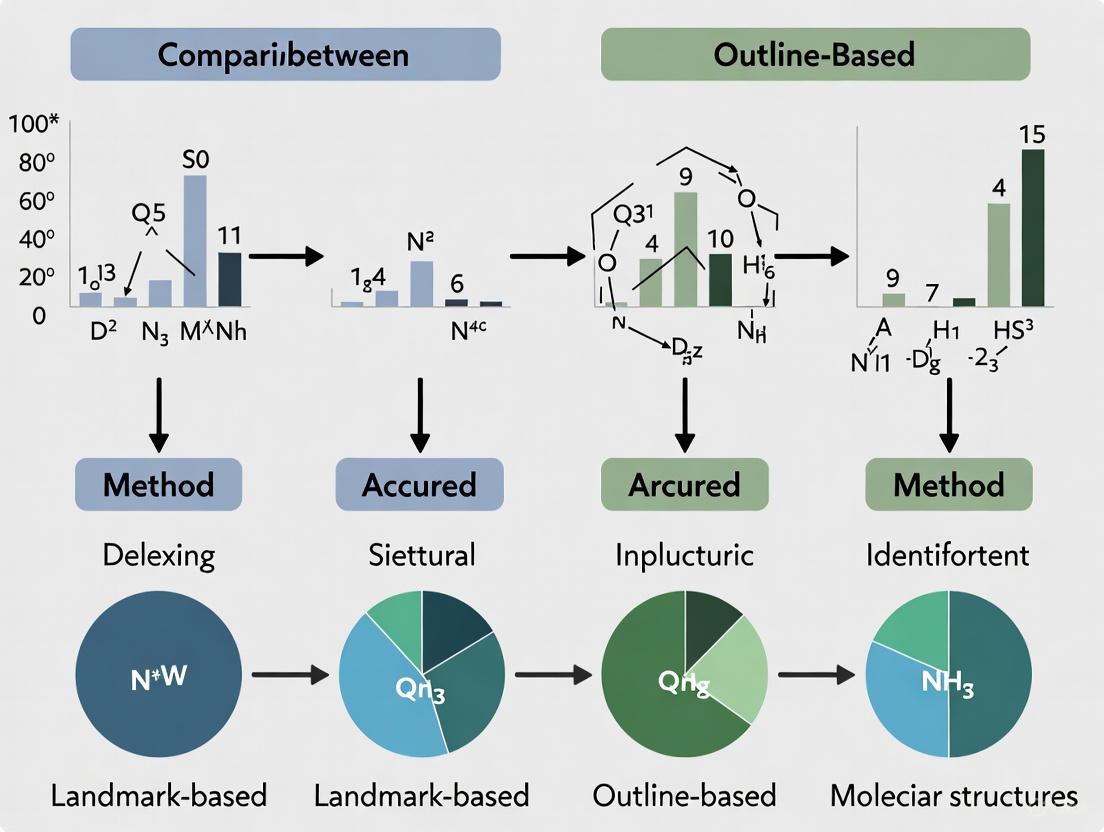
Archaeological Shape Analysis Workflow
Archaeological Analysis Workflow - This diagram illustrates the comparative workflow for landmark and outline-based analysis of archaeological artefacts, from data collection through validation.
Medical Landmark Detection Pipeline
Medical Detection Pipeline - This workflow outlines the medical landmark detection process from image acquisition through model evaluation, highlighting both conventional and foundation model approaches.
Research Reagent Solutions Toolkit
Table: Essential Research Tools for Landmark-Based Analysis
| Tool/Resource | Function | Application Context |
|---|---|---|
| landmarker Python Package [7] | Comprehensive toolkit for anatomical landmark localization | Medical imaging research |
| Geometric Morphometric Software (e.g., MorphoJ, PAST) | Statistical shape analysis | Archaeological and biological morphology |
| MedSapiens Foundation Model [6] | Pre-trained model for anatomical landmark detection | Multi-domain medical imaging |
| 3D U-Net Architectures [4] | Volumetric image analysis for 3D landmark detection | Medical CT and CBCT imaging |
| Elliptical Fourier Analysis [2] | Outline capture and analysis | Alternative to landmark approaches |
| FiftyOne Computer Vision Platform [1] | Dataset management and model evaluation | Keypoint detection workflows |
The research toolkit for landmark-based methods encompasses both specialized software packages and general-purpose computer vision platforms. The landmarker Python package provides a flexible toolkit specifically designed for anatomical landmark localization, supporting methodologies including static and adaptive heatmap regression while addressing the need for precision and customization in medical applications [7]. For medical imaging applications, the MedSapiens foundation model demonstrates how human-centric models pre-trained on large-scale natural image datasets can be adapted for anatomical landmark detection through parameter-efficient fine-tuning, establishing new state-of-the-art performance across multiple medical datasets [6].
Complementing these specialized tools, platforms like FiftyOne provide essential infrastructure for computer vision workflows, offering dataset exploration, annotation management, and model evaluation capabilities specifically designed for keypoint detection tasks [1]. These tools enable researchers to filter datasets based on keypoint confidence scores, compute metrics like percentage of correct keypoints (PCK), and visualize custom skeletons connecting detected joints for cleaner pose inspection [1].
Outline-Based Methods: Contour Analysis and Geometric Morphometrics
Geometric morphometrics (GM) has emerged as a fundamental technique for quantifying biological shape, with outline-based and landmark-based methods representing two primary approaches. This guide provides an objective comparison of these methodologies, focusing on their performance in species identification accuracy. Outline-based methods analyze the entire contour of a structure using mathematical functions, while landmark-based approaches rely on discrete, homologous points. Evidence from multiple studies indicates that the choice of method significantly impacts classification success, with performance dependent on the specific biological structure and taxonomic group under investigation. This article synthesizes experimental data and protocols to guide researchers in selecting appropriate morphometric techniques for identification tasks in biological and medical research.
Geometric morphometrics (GM) constitutes a family of quantitative techniques for analyzing biological shape variation, retaining the complete geometry of structures throughout statistical analysis [8]. The "morphometric synthesis" combines Procrustes shape coordinates with thin-plate spline (TPS) renderings for multivariate statistical comparisons, offering significant advantages over traditional qualitative descriptions or linear measurements [9]. Within GM, two principal methodologies have emerged: landmark-based and outline-based approaches.
Landmark-based GM relies on the digitization of Cartesian coordinates from discrete, biologically homologous points called landmarks. These landmarks are categorized into three primary types: Type I landmarks (anatomical points at tissue junctions), Type II landmarks (mathematical points of maximum curvature), and Type III landmarks (constructed points defined by maximum distance or other extremal properties) [9]. Following data collection, Generalized Procrustes Analysis (GPA) superimposes landmark configurations to remove differences in position, orientation, and scale, isolating pure shape variation for subsequent multivariate analysis [10].
Outline-based GM addresses the challenge of quantifying shapes that lack sufficient discrete landmarks, instead capturing information from curves or contours. This approach utilizes mathematical representations of entire outlines, with Elliptical Fourier Analysis (EFA) being a prominent method that decomposes contours into harmonic components [11] [2]. Alternatively, semi-landmark methods slide points along curves to establish point-to-point correspondences between similar but variable shapes, effectively bridging landmark and outline techniques [12].
The ongoing methodological debate centers on which approach offers superior accuracy for species identification and discrimination, with increasing evidence suggesting that optimal performance depends on anatomical structure, taxonomic group, and specific research objectives [13] [14] [2].
Methodological Foundations and Experimental Protocols
Core Principles of Outline-Based Analysis
Outline-based geometric morphometrics quantifies shape by capturing the complete contour of a structure, overcoming limitations posed by insufficient landmark points on curved surfaces [2]. These methods are particularly valuable for analyzing biological structures where discrete homologous points are scarce but overall form contains significant biological information.
The technical implementation occurs through several mathematical frameworks. Elliptical Fourier Analysis (EFA) decomposes a closed contour into a sum of harmonic ellipses, each defined by four coefficients that capture increasingly fine details of the shape [11]. The normalized elliptic Fourier coefficients (NEF) serve as shape variables for statistical analysis. Alternatively, semi-landmark methods establish point correspondences between curves by sliding points along tangents to minimize bending energy between specimens relative to a consensus configuration [12]. This approach allows incorporation of outline data alongside traditional landmarks in a unified Procrustes framework. The extended eigenshape method represents another outline-based approach that analyzes the covariance structure of tangent angles along a contour [11].
Experimental Protocol for Outline-Based Morphometrics
A standardized protocol for conducting outline-based geometric morphometrics, as applied in mosquito and horse fly identification studies, involves several methodical steps [13] [14]:
Sample Preparation and Imaging: Isolate the anatomical structure of interest (e.g., right insect wings). Mount specimens consistently on microscope slides using mounting medium. Capture digital images using a calibrated microscope with digital camera under consistent magnification, including a scale bar.
Outline Digitization: Extract the outline coordinates from digital images. For wing analysis, this typically involves tracing the contour of the entire wing or specific wing cells. Software packages like ImageJ, CLIC, or Momocs in R facilitate this process through manual tracing or automated edge detection.
Data Processing and Normalization: Convert outline coordinates to a mathematical representation. For EFA, this involves harmonic decomposition, typically using 20-40 harmonics depending on contour complexity. Normalize coefficients to ensure invariance to size, rotation, and starting point.
Statistical Analysis: Use the normalized shape variables (Fourier coefficients or semi-landmark coordinates) in multivariate statistical analyses. Principal Component Analysis (PCA) identifies major axes of shape variation. Discriminant Analysis (DA) or Canonical Variate Analysis (CVA) maximizes separation among predefined groups.
Validation and Classification: Perform cross-validation tests, typically using leave-one-out procedures, to assess classification accuracy without overfitting. Calculate Mahalanobis distances between groups and test significance using permutation tests.
This protocol emphasizes standardization throughout imaging and analysis to minimize measurement error, which can substantially impact statistical results [10].
Analytical Workflow
The following diagram illustrates the standard analytical workflow for outline-based geometric morphometrics, integrating both Fourier and semi-landmark approaches:
Performance Comparison: Identification Accuracy Across Taxa
Experimental data from multiple studies directly comparing landmark and outline methods reveals a complex pattern of performance dependent on taxonomic group and anatomical structures.
Table 1: Classification Accuracy of Landmark vs. Outline Methods Across Studies
| Taxonomic Group | Anatomical Structure | Landmark Method Accuracy | Outline Method Accuracy | Most Accurate Method | Citation |
|---|---|---|---|---|---|
| Mosquitoes (7 species) | Wings | 81.2% (genus level) | 79.8% (genus level) | Comparable | [13] |
| Anopheles spp. | Wings | 88.5% | 86.2% | Landmark | [13] |
| Aedes spp. | Wings | 85.7% | 83.9% | Landmark | [13] |
| Culex spp. | Wings | 72.3% | 70.1% | Comparable (both low) | [13] |
| Horse flies (3 species) | First submarginal cell | N/A | 86.67% | Outline | [14] |
| Horse flies (3 species) | Discal cell | N/A | 76.4% | Outline | [14] |
| Horse flies (3 species) | Second submarginal cell | N/A | 74.1% | Outline | [14] |
| Carnivore tooth marks | Tooth pit outlines | <40% | <40% | Computer Vision superior | [15] |
The data indicates that landmark-based methods show slight advantages for distinguishing certain mosquito genera, particularly Anopheles and Aedes species [13]. This advantage likely stems from the presence of reliable, homologous wing vein junctions that serve as consistent Type I landmarks. The precision of landmark-based analysis, however, depends heavily on operator skill and standardized positioning, with interobserver error sometimes explaining >30% of total shape variation [10].
Conversely, outline-based methods demonstrate superior performance for analyzing wing cell contours in horse flies, with the first submarginal cell providing the highest classification accuracy (86.67%) [14]. This suggests that overall cell shape captured by outline analysis contains more taxonomic information than discrete landmarks for these structures. Outline methods are particularly advantageous for damaged specimens where complete wings are unavailable but individual cells remain intact [14].
Both methods show limitations in certain applications. For Culex mosquitoes, both techniques performed relatively poorly, indicating either high intraspecific variation or insufficient shape differences between species [13]. In carnivore tooth mark analysis, both landmark and outline methods showed less than 40% discriminant power, outperformed by computer vision approaches [15].
Essential Research Reagents and Computational Tools
Successful implementation of geometric morphometric analysis requires specialized software tools for data acquisition, processing, and statistical analysis.
Table 2: Essential Research Reagents and Software Solutions
| Tool Name | Type | Primary Function | Application in Morphometrics | |
|---|---|---|---|---|
| TPS Series (tpsDig2, tpsUtil, tpsRelw) | Desktop Software | Landmark and outline digitization | Acquiring 2D coordinates from images; data management and relative warp analysis | [9] |
| MorphoJ | Desktop Software | Statistical analysis | Performing Procrustes superimposition, PCA, CVA, and clustering analyses | [9] |
| R (Momocs package) | Programming Environment | Outline analysis | Comprehensive toolbox for elliptical Fourier and eigenshape analysis | [9] |
| ImageJ | Desktop Software | Image processing | Background removal, outline extraction, and basic measurements | [9] |
| CLIC Program | Desktop Software | Coordinate collection | Specialized collection of landmarks for identification and characterization | [13] |
| Deformetrica | Desktop Software | Landmark-free analysis | Performing Deterministic Atlas Analysis without manual landmarking | [8] |
The TPS software suite, particularly tpsDig2, serves as a cornerstone for manual landmark digitization, while MorphoJ provides a user-friendly interface for comprehensive statistical analysis without programming [9]. For outline-based approaches, the Momocs package in R offers a complete workflow from outline extraction through statistical analysis and visualization [9]. Emerging landmark-free methods like Deterministic Atlas Analysis in Deformetrica show promise for automating shape analysis across highly disparate taxa, potentially overcoming homology constraints [8].
Applications and Limitations in Research Context
Optimal Applications for Each Method
Landmark-based methods excel in contexts with clearly defined, homologous anatomical points. Medical entomology applications for distinguishing mosquito vectors demonstrate their effectiveness when reliable Type I landmarks are available [13]. These methods are particularly valuable when research questions focus on specific anatomical modules or when the biological hypothesis relates to displacement of particular structures. The established statistical framework and straightforward biological interpretability further contribute to their widespread use.
Outline-based methods show superior performance for analyzing structures with complex curvatures lacking discrete landmarks. Their application to feather shapes for age classification in birds, lithic artifact analysis in archaeology, and wing cell contours in horse flies highlights their utility for capturing overall form [11] [14] [2]. Outline approaches are particularly advantageous for damaged specimens where complete structures are unavailable but contours remain intact [14]. These methods also enable analysis of historical specimens from legacy data such as drawings or photographs.
Both methodologies face significant challenges related to measurement error and data acquisition consistency. Landmark-based approaches are susceptible to interobserver variation, sometimes explaining more than 30% of total shape variation [10]. Specimen presentation in 2D analyses introduces additional error, particularly when comparing structures with different orientations. For outline methods, the selection of starting point and contour resolution can impact results, necessitating standardization protocols.
Technical limitations include the high dimensionality of outline data relative to typical sample sizes, requiring dimension reduction techniques before discriminant analysis [11]. The requirement for homology in landmark-based methods limits comparisons across highly disparate taxa where identifiable homologous points become scarce [8]. Emerging automated landmarking and landmark-free approaches promise to address these challenges by improving efficiency and reducing observer bias [8].
The comparative analysis of landmark and outline-based geometric morphometrics reveals a nuanced methodological landscape where optimal technique selection depends on specific research contexts. Landmark methods maintain advantages for analyzing structures with clear homologous points and when biological hypotheses relate to specific anatomical loci. Outline methods excel at capturing overall form of complex shapes and analyzing structures lacking discrete landmarks. Rather than asserting universal superiority of either approach, researchers should select methods based on anatomical structures under investigation, research questions, and available specimen integrity.
Future methodological development should focus on integrating landmark and outline data within unified analytical frameworks, leveraging the strengths of both approaches. Automated and landmark-free methods show particular promise for large-scale studies across highly disparate taxa by improving efficiency and reducing observer bias. As geometric morphometrics continues evolving alongside imaging technologies and computational approaches, researchers gain increasingly powerful tools for quantifying biological shape, with profound implications for taxonomy, evolutionary biology, and morphological research across biological and medical disciplines.
Theoretical Strengths and Limitations of Each Paradigm
The accurate identification of key features is a cornerstone of research across diverse fields, from archaeology and evolutionary biology to medical imaging. Within this context, two primary methodological paradigms have emerged: landmark-based and outline-based geometric morphometrics. Landmark-based methods rely on the precise identification of discrete, homologous points, while outline-based methods capture the continuous shape of an object's boundary using mathematical functions. This guide provides an objective comparison of these approaches, detailing their theoretical strengths, limitations, and performance in practical research applications to inform method selection for scientists and professionals.
Theoretical Foundations and Comparative Strengths
The choice between landmark and outline methods is fundamentally guided by the nature of the research question and the structure of the specimens under study. The table below summarizes their core theoretical characteristics.
| Paradigm | Core Principle | Key Strength | Primary Theoretical Limitation |
|---|---|---|---|
| Landmark-Based Methods | Analysis of discrete, homologous anatomical points [2]. | High biological interpretability when landmarks are truly homologous [2]. | Subjectivity and difficulty in identifying unambiguous homologous points on many structures [2] [16]. |
| Outline-Based Methods | Mathematical representation of an object's entire contour (e.g., Elliptical Fourier Analysis) [2] [3]. | Captures holistic shape information without requiring pre-defined homologous points; efficient for complex shapes [2]. | May obscure localized shape variations and can have reduced phylogenetic signal compared to landmarks [2]. |
Performance Data from Experimental Studies
Empirical studies across disciplines have quantified the performance of these methods in classification and identification tasks.
Comparative Identification Accuracy
A 2025 study on automated identification of distal femoral landmarks in 3D CT data compared a neural network, a statistical shape model, and a geometric approach. Accuracy was measured as the mean absolute deviation (in mm) from manually selected reference landmarks [17] [18].
| Landmark | Neural Network | Statistical Shape Model | Geometric Approach |
|---|---|---|---|
| Medial Epicondyle (MEC) | 2.4 ± 1.3 | 2.3 ± 1.1 | 4.6 ± 3.5 |
| Lateral Epicondyle (LEC) | 2.3 ± 1.3 | 2.2 ± 1.1 | 4.4 ± 3.0 |
| Medial Distal Condyle (MDC) | 1.0 ± 0.6 | 1.1 ± 0.6 | 1.7 ± 1.4 |
| Lateral Distal Condyle (LDC) | 1.0 ± 0.5 | 1.1 ± 0.6 | 1.6 ± 1.0 |
| Medial Posterior Condyle (MPC) | 1.3 ± 0.7 | 1.3 ± 0.7 | 2.1 ± 1.5 |
| Lateral Posterior Condyle (LPC) | 1.2 ± 0.6 | 1.3 ± 0.7 | 1.9 ± 1.2 |
| Average Accuracy | ~1.5 mm | ~1.5 mm | ~2.7 mm |
Method Robustness in Pathological Cases
The same study tested robustness by applying methods to femora with osteophytes. The geometric approach failed in 29% of pathological cases, while the neural network and statistical shape model maintained a 92% success rate [18].
| Method | Successful Analysis (Non-Osteophyte Cases) | Successful Analysis (Osteophyte Cases) |
|---|---|---|
| Neural Network | 36/36 (100%) | 22/24 (92%) |
| Statistical Shape Model | 35/36 (97%) | 22/24 (92%) |
| Geometric Approach | 34/36 (94%) | 17/24 (71%) |
Classification Accuracy in Morphological Studies
A 2006 methodological study on feather outlines found that classification success was not highly dependent on the specific outline method used (semi-landmark vs. Elliptical Fourier Analysis). However, the approach to dimensionality reduction significantly impacted cross-validation assignment rates [3].
Detailed Experimental Protocols
To ensure reproducibility, below are the detailed methodologies from key cited studies.
- Sample: 202 femora from CT scans of 101 patients.
- Reference Standard: Manual landmark identification by two independent raters; the reference landmark was defined as the average of the two manual points.
- Tested Methods:
- Neural Network (NN): A self-configuring 3D nnU-Net was used, treating landmark identification as a semantic segmentation task. It was trained on annotated DICOM data without requiring prior bone segmentation.
- Statistical Shape Model (SSM): Bone surface models were aligned in a bone-specific coordinate system. A mean shape was generated from training data, which was then transformed to each test femur.
- Geometric Approach (GA): Bone models were oriented in a coordinate system, and landmarks were identified based on geometric criteria (e.g., points with minimum z-value for the most distal points).
- Evaluation Metric: The mean absolute deviation (mm) of each automated method from the reference landmarks.
- Sample: Multiple datasets of lithic projectile points from different archaeological periods.
- Method Comparison:
- Landmark-Based GMM: Application of previously published landmark-based analyses.
- Whole-Outline GMM: Re-analysis of the same artifact sets using Elliptical Fourier Analysis (EFA) to capture the entire tool outline.
- Analysis: The whole-outline data was subjected to clustering algorithms to explore group discrimination, and the results were compared to the original landmark-based taxonomic groupings.
- Evaluation: The ability of each method to replicate traditional typo-chronological groupings and reveal cultural evolutionary patterns.
Workflow and Logical Relationships
The following diagram illustrates the typical workflows for landmark and outline methods, highlighting their convergent phase in statistical analysis.
Diagram 1: Comparative workflows for landmark and outline methods.
Performance and Suitability Logic
The decision-making process for selecting the appropriate paradigm is guided by the nature of the research specimen and question, as shown below.
Diagram 2: Decision logic for method selection.
The Scientist's Toolkit: Key Research Reagents and Materials
This table details essential solutions and materials commonly used in geometric morphometric studies for identification accuracy research.
| Item | Function in Research |
|---|---|
| High-Resolution Scanner (CT, 3D Surface) | Generates high-fidelity digital models of specimens, which serve as the primary data source for both landmark and outline digitization [17] [18]. |
| Digital Specimen Archive | A database of 3D models or 2D images used for training automated systems (like neural networks or SSMs) and for validating new methodological approaches [17] [16]. |
| Geometric Morphometric Software (e.g., MorphoJ, EVAN Toolbox) | Provides the computational environment for performing Procrustes superimposition, Principal Component Analysis (PCA), and Canonical Variates Analysis (CVA) on coordinate or outline data [2] [16]. |
| Machine Learning Classifiers (e.g., Naïve Bayes) | Used to achieve high classification accuracy, especially when analyzing complex image data directly, potentially outperforming standard geometric morphometric protocols [16]. |
| Semi-Landmark Alignment Algorithms (e.g., Bending Energy Minimization) | Mathematical tools used to relax the requirement of strict homology for points along a curve, allowing for the integration of outline and landmark data [2] [3]. |
The transition from two-dimensional (2D) radiographs to three-dimensional (3D) surface models represents a fundamental shift in anatomical data analysis across medical and scientific disciplines. This evolution is particularly critical in fields requiring precise morphological assessment, such as orthodontics, orthognathic surgery, and medical implant development, where accurate identification of anatomical landmarks forms the basis for diagnosis, treatment planning, and outcome evaluation. Traditional 2D radiography, while historically valuable, projects complex three-dimensional structures onto a single plane, introducing inherent limitations including magnification errors, anatomical superimposition, and sensitivity to patient positioning. [19]
In contrast, 3D imaging modalities like computed tomography (CT) and cone-beam CT (CBCT) capture the full spatial complexity of anatomical structures, enabling the creation of detailed 3D surface models. These models facilitate landmark identification without the projection errors associated with 2D techniques and allow for comprehensive analysis of complex anatomies and asymmetries. The emergence of artificial intelligence (AI) and automated algorithms has further enhanced the precision and efficiency of landmark identification in 3D datasets, pushing the boundaries of quantitative morphological research. [19] [4] [20] This guide objectively compares the performance of these data sources, focusing on landmark identification accuracy, a cornerstone of the broader thesis on comparison of landmark and outline methods for identification accuracy research.
Performance Comparison: Quantitative Accuracy Across Modalities
Landmark Identification Error
| Measurement Type / Anatomical Region | 2D Radiographic Error | 3D Model-Based Error | Measurement Context & Conditions |
|---|---|---|---|
| Cephalometric Angular Measurements (General) | N/A (Baseline) | No significant difference for most parameters [19] | Comparison of 2D lateral cephalograms vs. 3D CT-derived models; 14 angular measurements assessed. [19] |
| Cephalometric Landmarks (U1-NA, U1-SN) | N/A (Baseline) | Statistically significant difference (P < 0.05) [19] | Specific angular measurements showing significant deviation between 2D and 3D modalities. [19] |
| Cephalometric Landmarks (Cleft Palate Patients) | Manual: Lower error (Reference) | AI (WebCeph): Higher error for A-point, ANS, Orbitale [21] | AI-driven landmark identification on 2D radiographs versus manual expert identification in complex anatomy. [21] |
| Shoulder Arthroplasty Parameters | Underestimation of Humeral Distalization & COR Distalization [22] | Reference Standard for all parameters [22] | Radiographic 2D measurements vs. 3D surface model-based measurements from CT data. [22] |
| Automatic 3D Mandibular Landmarks | N/A | Euclidean Distance: < 2 mm [20] | Automatic vs. manual identification on 3D mandibular models using curvature-based registration. [20] |
| AI Automatic 3D Landmarks (SCT & CBCT) | N/A | Mean Radial Error (MRE): < 1.3 mm [4] | AI-driven 3D U-Net performance on Spiral CT (41 landmarks) and CBCT (14 landmarks). [4] |
Measurement Reliability and Protocol Efficiency
| Performance Metric | 2D Radiography | 3D Surface Models | Key Findings and Implications |
|---|---|---|---|
| Reliability (ICC) | Excellent (>0.9) for shoulder parameters [22] | Excellent (>0.9) for shoulder parameters [22] | Both modalities can achieve high reliability, but 3D models avoid fixed biases present in 2D. [22] |
| Data Capture Process | Single exposure, quick 2D capture. | Volumetric data acquisition (CT/CBCT), requires 3D reconstruction. [19] [4] | 2D is faster to acquire, but 3D provides comprehensive spatial data without superimposition. [19] |
| Landmarking Workflow | Manual or semi-automatic digital identification. | Manual, semi-automatic, or fully automatic AI-driven identification. [4] [21] [20] | 3D models enable advanced automation, significantly accelerating analysis time. AI on 2D data performs poorly in complex cases (e.g., cleft palate). [4] [21] |
| Analysis of Asymmetries | Limited; requires separate posteroanterior radiograph. [19] | Excellent; inherent 3D data allows direct assessment of bilateral structures and asymmetries. [19] | 3D models are inherently superior for comprehensive morphological assessment, including complex anomalies. [19] |
Experimental Protocols: Methodologies for Comparison
Direct Comparison of 2D and 3D Cephalometry
A foundational study compared traditional 2D cephalometry with 3D cephalometric approaches using CT images and lateral cephalometric radiographs from ten patients. The raw CT data were converted into 3D images using a specialized simulation program (Mimics 9.0). The same orthodontists performed both 2D and 3D analyses. In the 3D environment, observers could interactively place landmarks on the 3D model while simultaneously viewing axial, coronal, and sagittal views for verification. This protocol allowed for direct comparison of 14 angular cephalometric measurements derived from both modalities, with statistical analysis (Wilcoxon test) used to identify significant differences. [19]
Validation of Radiographic versus 3D Model-Based Measurements in Orthopedics
In a study on reverse total shoulder arthroplasty (rTSA), researchers validated 2D radiographic measurements against 3D surface models derived from CT scans. Thirty-one shoulders were imaged postoperatively. Two certified surgeons independently performed measurements on both 2D radiographs and the 3D models on two separate occasions. Parameters included humeral distalization, lateralization, and medialization/distalization of the center of rotation (COR). The agreement between 2D and 3D measurements was analyzed using Bland-Altman plots, and reliability was assessed with intraclass correlation coefficients (ICCs). This protocol identified fixed biases in specific 2D measurements. [22]
AI-Driven Automatic Landmarking in 3D Imaging
A recent 2025 study developed and validated an automatic 3D landmark detection model using a lightweight 3D U-Net network architecture. The model was trained and tested on a large dataset of 480 spiral CT (SCT) and 240 cone-beam CT (CBCT) cases. Its performance was evaluated using Mean Radial Error (MRE) and success detection rate within 2-, 3-, and 4-mm error thresholds. The model's robustness was further tested on external datasets and under challenging conditions like malocclusion and metal artifacts. This protocol represents a state-of-the-art approach for automating and standardizing landmark identification in 3D data. [4]
Workflow Diagram: Comparative Analysis of 2D and 3D Landmark Identification
The following diagram illustrates the general workflow for comparing landmark identification accuracy between 2D and 3D data sources, as implemented in the cited studies:
Comparative Analysis Workflow
The Scientist's Toolkit: Essential Research Reagents and Materials
The following table details key software, hardware, and methodological solutions essential for conducting rigorous comparison studies between 2D and 3D data sources.
| Tool / Solution | Function in Research | Application Context |
|---|---|---|
| 3D Simulation Software (e.g., Mimics) | Converts raw CT data into interactive 3D surface models; enables 3D landmark placement and cephalometric analysis. [19] [4] | Essential for creating the 3D environment for landmark identification and measurement. |
| Cone-Beam CT (CBCT) | Provides 3D volumetric data with lower radiation dose compared to conventional CT; ideal for maxillofacial and orthodontic imaging. [19] [4] | The primary 3D data acquisition source for dental and craniofacial research. |
| Spiral CT (SCT) | Provides high-resolution 3D volumetric data, superior for soft tissue visualization and complex craniofacial assessments. [4] | Used in general hospital settings and for research requiring detailed skeletal and soft tissue data. |
| AI Landmark Detection Models (e.g., 3D U-Net) | Automates the identification of anatomical landmarks in 3D image data, improving speed, consistency, and reducing manual labor. [4] | Employed to automate and standardize the landmarking process, especially in large-scale studies. |
| Statistical Shape Models (SSM) | Deformable mean models of an anatomical structure that can be registered to individual patient scans to automate landmark identification. [20] | Used in advanced automated pipelines for predicting landmark locations based on population morphology. |
| Bland-Altman Analysis | A statistical method used to assess the agreement between two different measurement techniques (e.g., 2D vs. 3D). [22] | A key statistical "reagent" for quantifying bias and limits of agreement between modalities. |
| Intraclass Correlation Coefficient (ICC) | A reliability measure used to quantify the consistency and agreement of repeated measurements, both within and between observers. [22] | Critical for establishing the reproducibility of landmark identification protocols in any modality. |
The quantitative evidence demonstrates that 3D surface models generally provide a more accurate and reliable foundation for landmark identification than 2D radiographs, particularly for complex anatomies and asymmetric structures. While 2D radiography can show high reliability, it is prone to systematic biases for certain measurements, such as humeral distalization in orthopedics or specific dental angles in cephalometrics. [19] [22]
The future of morphological research is inextricably linked to 3D data, propelled by advancements in AI and automation. AI-driven landmark detection in 3D images has achieved precision levels suitable for clinical and research applications, offering remarkable efficiency gains. [4] The development of sophisticated registration algorithms, such as curvature-based methods, further enhances the accuracy and reproducibility of automated processes. [20] For researchers, the choice of data source is clear: 3D surface models are the superior tool for rigorous, high-precision landmark identification, while 2D radiographs may still suffice for specific, less complex applications where historical continuity and accessibility are prioritized.
Methodological Implementation and Real-World Biomedical Applications
Accurate anatomical landmark detection is a fundamental step in medical image analysis, serving as a crucial prerequisite for surgical planning, disease diagnosis, and treatment evaluation. Within the broader thesis comparing landmark and outline methods for identification accuracy research, this guide provides a systematic comparison of two prominent deep learning architectures: HRNet (High-Resolution Network) and U-Net. These architectures represent divergent philosophical approaches to maintaining spatial precision in visual recognition tasks. HRNet maintains high-resolution representations throughout the network via parallel multi-scale convolutions, while U-Net employs a traditional encoder-decoder structure with skip connections to recover spatial information. This article objectively evaluates their performance, experimental protocols, and implementation considerations for landmark detection applications across medical and biological domains, providing researchers with evidence-based architectural selection criteria.
HRNet: Sustained High-Resolution Processing
HRNet introduces a fundamentally different design paradigm from traditional serial convolutional networks. Instead of progressively downsampling feature maps and then attempting to recover lost spatial information through upsampling, HRNet maintains high-resolution representations throughout the entire forward pass [23]. The architecture begins with a high-resolution convolution stream and progressively adds parallel streams at lower resolutions, creating a multi-scale network with several stages where the nth stage contains n streams corresponding to n resolutions [23]. A critical component is the repeated multi-resolution fusion where information is exchanged across parallel streams through strategic upsampling and downsampling operations. This design ensures that the high-resolution representations are continuously refined with semantic information from lower-resolution streams, resulting in representations that are both spatially precise and semantically rich [23]. The architecture has evolved through several iterations: HRNetV1 utilizes only the high-resolution stream output for tasks like human pose estimation; HRNetV2 aggregates all parallel resolutions through upsampling and concatenation for semantic segmentation; and HRNetV2p constructs a feature pyramid from the HRNetV2 output for object detection [24].
U-Net: Encoder-Decoder with Skip Connections
U-Net employs a symmetrical encoder-decoder architecture with skip connections, forming a distinctive U-shaped design [25] [26]. The contracting path (encoder) progressively reduces spatial dimensions while increasing feature depth through a series of convolutional and pooling layers, capturing contextual information at multiple scales. The expanding path (decoder) then restores spatial resolution through upsampling operations and concatenates high-resolution features from corresponding encoder layers via skip connections [26]. This architectural approach enables precise localization by combining deep semantic information with shallow spatial details. The skip connections are particularly crucial as they allow context information to flow directly to higher-resolution layers, facilitating accurate boundary delineation essential for segmentation and landmark detection tasks [26]. Originally developed for biomedical image segmentation, U-Net's efficiency with limited training data has made it a cornerstone architecture in medical imaging [26].
Comparative Architectural Philosophy
Table: Fundamental Architectural Differences Between HRNet and U-Net
| Aspect | HRNet | U-Net |
|---|---|---|
| Core Design | Parallel multi-resolution streams with repeated fusions | Serial encoder-decoder with skip connections |
| Resolution Handling | Maintains high resolution throughout process | Recovers resolution after downsampling |
| Information Flow | Continuous multi-scale fusion | Lateral connections between encoder and decoder |
| Primary Strength | Spatially precise representations | Effective boundary delineation |
| Computational Profile | Higher memory usage from parallel streams | Lower memory footprint with sequential processing |
Performance Comparison for Landmark Detection
Quantitative Results Across Applications
Table: Performance Comparison of HRNet and U-Net Variations Across Domains
| Application Domain | Architecture | Dataset | Key Metric | Performance | Citation |
|---|---|---|---|---|---|
| Facial Landmark Detection | HRNet | WFLW, COFW, AFLW, 300W | NME (%) | State-of-the-art | [27] |
| Pelvic Landmark Detection | UNSX-HRNet | Structured & Unstructured X-rays | Detection Accuracy | >60% improvement on unstructured data | [28] |
| Spine Surgery Planning | Cascaded U-Net | 500 spine X-ray images | Mean Error (mm) | 2.08 ± 1.33 mm | [29] |
| Wheat Spike Segmentation | SAU-Net (U-Net variant) | Field wheat images | Average IoU | 88.57% | [30] |
| Semantic Segmentation | HRNetV2 | Cityscapes | mIoU | 81.1% (Cityscapes test) | [23] |
| Medical Image Segmentation | DC-HRNet | Cityscapes, Pascal VOC, CamVid | Accuracy | 80.2%, 78.9%, 72.9% | [31] |
Key Performance Insights
The quantitative evidence demonstrates that both architectures can achieve excellent results, but with distinctive strength profiles. HRNet variants consistently show superior performance in position-sensitive applications requiring precise coordinate prediction. The UNSX-HRNet framework, which integrates high-resolution networks with uncertainty estimation based on anatomical relationships, demonstrates remarkable adaptability to challenging clinical scenarios with unstructured data, achieving over 60% improvement across multiple evaluation metrics when applied to unstructured datasets [28]. This makes HRNet particularly valuable for medical applications where anatomical landmarks may be occluded or present in irregular patient postures.
U-Net and its variants excel in segmentation tasks requiring precise boundary delineation. The SAU-Net model, which enhances U-Net with stripe pooling, multi-scale dilated convolution, and attention mechanisms, achieves 88.57% average IoU for wheat spike segmentation under complex field conditions [30]. Similarly, in medical landmark detection, a cascaded U-Net approach combining RetinaNet for region proposal and U-Net for precise localization achieves exceptional precision (2.08 ± 1.33 mm error) for spine surgery planning [29]. These results highlight U-Net's continued relevance for segmentation-heavy landmark detection tasks.
Experimental Protocols and Methodologies
HRNet Implementation for Landmark Detection
The experimental protocol for HRNet-based landmark detection typically begins with network pretraining on large-scale datasets like ImageNet, followed by domain-specific fine-tuning. For facial landmark detection, the official HRNet implementation augments the high-resolution representation by aggregating upsampled representations from all parallel convolutions, with the resulting representations fed into a classifier [27]. Training employs standard data augmentation techniques including rotation, translation, scaling, and color jittering. The loss function typically combines heatmap regression with coordinate regression, using Mean Squared Error for heatmap prediction [24]. For medical applications like the UNSX-HRNet, the methodology incorporates additional components including a Spatial Relationship Fusion module to capture dependency relationships among landmarks, and an Uncertainty Estimation module that outputs reliability scores for predictions, which is particularly valuable in clinical settings with unstructured data [28].
U-Net Implementation for Landmark Detection
U-Net experimentation for landmark detection typically follows a different protocol optimized for its architectural strengths. The base implementation uses a contracting path with repeated applications of two 3×3 convolutional layers each followed by ReLU activation and 2×2 max pooling, and an expanding path with upsampling followed by 2×2 convolutions, concatenation with corresponding cropped feature maps from the contracting path, and two 3×3 convolutions with ReLU activation [26]. For landmark detection tasks, researchers often employ a cascaded approach where an initial detection network identifies regions of interest, which are then processed by U-Net for precise localization [29]. Advanced U-Net variants incorporate additional modules: SAU-Net integrates Stripe Pooling Blocks with rectangular pooling windows to handle elongated structures, Multi-scale Dilated Convolution modules at deeper encoder stages to expand receptive fields, and Convolutional Block Attention Modules to enhance critical feature sensitivity while reducing background interference [30]. The loss function typically combines dice loss with cross-entropy to handle class imbalance.
Evaluation Metrics and Validation
Both architectures share common evaluation methodologies for landmark detection tasks. Precision is typically interpreted as point-to-point Euclidean distance between predictions and ground truth annotations, with clinical applications often setting acceptable error thresholds (e.g., 3mm for orthopedic landmarks) [32]. Detection accuracy is frequently measured using Intersection over Union for segmentation-based approaches and Percentage of Correct Keypoints for coordinate regression approaches. For segmentation tasks, mean Intersection over Union and Pixel Accuracy are standard metrics. Robust validation includes testing on structured and unstructured datasets, ablation studies to quantify component contributions, and comparison against multiple baseline architectures under identical conditions [28] [30].
Research Reagent Solutions
Table: Essential Research Components for Landmark Detection Implementation
| Component | Function | Example Implementations |
|---|---|---|
| Backbone Architecture | Base feature extraction | HRNet-W48, U-Net with ResNet-50 encoder [30] [23] |
| Attention Mechanisms | Enhance important feature response | CBAM, Coordinate Attention [30] |
| Multi-scale Processing | Capture context at multiple resolutions | ASPP, Multi-scale Dilated Convolution [31] [30] |
| Pooling Strategies | Maintain structural information | Stripe Pooling for elongated targets [30] |
| Uncertainty Estimation | Quantify prediction reliability | Anatomy-based uncertainty modules [28] |
| Fusion Modules | Combine multi-resolution features | Repeated multi-resolution fusion [23] |
| Loss Functions | Optimize for specific task objectives | Combined heatmap and coordinate loss, Joint loss functions [30] [32] |
Architectural Workflows
HRNet Parallel Multi-Resolution Architecture: illustrates HRNet's parallel stream design with progressive addition of lower-resolution streams and repeated multi-resolution fusion throughout processing.
U-Net Encoder-Decoder with Skip Connections: depicts U-Net's symmetrical architecture with contracting and expanding paths connected via skip connections that preserve spatial information.
Within the broader context of comparing landmark and outline identification methods, this analysis demonstrates that both HRNet and U-Net offer powerful but distinct approaches to landmark detection. HRNet's sustained high-resolution processing through parallel streams provides superior performance for coordinate prediction tasks and unstructured data environments, while U-Net's encoder-decoder architecture with skip connections remains highly effective for segmentation-heavy applications and resource-constrained environments. The selection between these architectures should be guided by specific application requirements: researchers requiring precise coordinate estimation in challenging conditions may prioritize HRNet, while those needing precise boundary delineation with computational efficiency may favor U-Net variants. Future architectural developments will likely incorporate strengths from both approaches, further blurring the distinction between these foundational designs while advancing the accuracy and reliability of landmark detection systems across research domains.
Automated Outline Extraction with Segmentation Models (e.g., Segment Anything Model)
Automated outline extraction is a fundamental task in computer vision, with significant implications for fields ranging from medical imaging to agricultural science. This guide provides a comparative analysis of state-of-the-art segmentation models, with a focus on the recently released Segment Anything Model 3 (SAM 3) and its performance against other leading alternatives. The data presented is contextualized within a broader thesis on the comparison of landmark and outline methods for identification accuracy, providing researchers and drug development professionals with actionable insights for selecting appropriate models for their specific applications.
Image segmentation, the process of partitioning a digital image into multiple segments or regions, serves as the technological foundation for automated outline extraction. Unlike simple classification that identifies what is in an image or object detection that locates objects with bounding boxes, image segmentation creates a pixel-level understanding of the image by assigning a class label to each pixel [33]. This process transforms the representation of an image from a grid of pixels into a more meaningful and easier-to-analyze collection of segments, enabling precise outline extraction of objects, anatomical structures, or regions of interest.
The evolution of segmentation models has progressed from task-specific architectures to foundational models capable of zero-shot generalization. Modern approaches primarily use deep learning techniques, particularly Convolutional Neural Networks (CNNs) and Transformer architectures, typically following an encoder-decoder structure [33]. The emergence of promptable segmentation models represents a significant advancement, allowing users to guide the segmentation process through various input modalities such as points, boxes, or text descriptions.
Model Comparison: Performance and Capabilities
Comprehensive Model Comparison Table
Table 1: Performance Comparison of State-of-the-Art Segmentation Models
| Model | Release Year | Core Capabilities | Prompt Support | Inference Speed | Key Performance Metrics |
|---|---|---|---|---|---|
| SAM 3 | 2025 | Unified detection, segmentation, and tracking of objects in images and video [34] | Text, exemplar, visual prompts (masks, boxes, points) [34] [35] | 30ms for single image with >100 objects (H200 GPU) [34] | 2× gain over existing systems on SA-Co benchmark; ~3:1 user preference over OWLv2 [34] |
| SAM 2 | 2024 | Image and video segmentation with streaming memory [33] | Points, boxes, masks [33] | 47.2 FPS (Tiny variant on A100 GPU) [33] | G=79.7 on VIPOSeg validation after fine-tuning [33] |
| OMG-Seg | 2025 | Unified framework for 10 segmentation tasks [33] | Various task-specific prompts [33] | Not specified | 44.5 mAP on COCO-IS; 49.1 mAP on VIPSeg-VPS [33] |
| DeepLabV3+ | 2024 (modified) | Semantic segmentation [33] | Not specified | Not specified | Strong performance on semantic segmentation tasks [33] |
| Mask R-CNN | 2024 (updated) | Instance segmentation [33] | Not specified | Not specified | Established baseline for instance segmentation [33] |
Specialized Application Performance
Table 2: Model Performance in Specialized Domains
| Application Domain | Model | Performance Metrics | Limitations |
|---|---|---|---|
| Medical Landmark Detection | YOLO-SAM Hybrid [32] | Acceptable landmark error <3mm; Superior to u-Net for certain landmarks [32] | Requires combination of detection and segmentation models |
| Agricultural Plot Extraction | SAM (vanilla) [36] | 89.54% F1 score (pixel-based); 99.71% precision at IoU=50% [36] | Struggles with irregular plot structures |
| 3D Facial Landmarks | Non-rigid Registration (TH-OCR) [37] | Mean error: 2.34±1.76mm; Better for mid-face landmarks [37] | Limited by template alignment accuracy |
| Medical Image Segmentation | Medical SAM Adapter (Med-SA) [38] | Superior performance on 17 medical tasks; Only 2% of parameters updated [38] | Requires adaptation for medical domain |
Experimental Protocols and Methodologies
SAM 3 Training and Evaluation Protocol
The development of SAM 3 involved a novel data engine that leveraged both AI and human annotators to create a training set with over 4 million unique concept labels [34]. This hybrid human-AI system achieved dramatic speed-ups in annotation—approximately 5× faster than humans on negative prompts and 36% faster for positive prompts even in challenging fine-grained domains [34].
Key Methodological Steps:
- AI-Assisted Data Generation: A pipeline of AI models, including SAM 3 and Llama-based captioners, automatically mined images and videos, generated captions, parsed captions into text labels, and created initial segmentation masks [34].
- Human Verification: Human annotators verified and corrected AI proposals, creating a feedback loop that rapidly scaled dataset coverage while improving data quality [34].
- AI Annotators: Based on Llama 3.2v models specifically trained to match or surpass human accuracy on annotation tasks, further accelerating the process [34].
- Evaluation Benchmark: SAM 3 was evaluated on the Segment Anything with Concepts (SA-Co) benchmark for promptable concept segmentation in images and videos [34].
The model architecture builds on previous Meta advancements, utilizing the Meta Perception Encoder as its text and image encoders, with detector components based on the DETR model and tracking capabilities derived from SAM 2's memory bank architecture [34].
Landmark Detection Protocol (YOLO-SAM Hybrid)
A specialized protocol for anatomical landmark detection in medical images was developed using a hybrid YOLO-SAM approach [32]. This methodology addresses the limitation of foundational segmentation models in recognizing highly specific medical landmarks.
Experimental Workflow:
Diagram Title: Medical Landmark Detection Workflow
Detailed Methodology:
- Dataset Preparation: 100 anonymized frontal radiographs of the human pelvis were annotated with 72 individual landmarks and additional landmarks around 18 patches and outlines [32].
- Sample Split: 80 radiographs for training, 5 for validation, and 15 kept as unseen test samples [32].
- YOLO Detection: YOLO11-s model (10.1M parameters) trained over 300 epochs with sample augmentation by varying brightness, contrast, translation, scaling, and angle variation [32].
- SAM Segmentation: Huggingface implementation of SAM with MedSAM weights used for segmentation, with YOLO-generated bounding boxes serving as prompts [32].
- Evaluation Metrics: Precision calculated as point-to-point Euclidean distance between prediction and ground truth, with acceptable error set at <3mm [32].
Agricultural Plot Extraction Protocol
A framework for automated plot extraction in agronomic research was developed using SAM's zero-shot capabilities [36]. This approach eliminates the need for model training or fine-tuning, making it highly adaptable across different datasets.
Methodological Framework:
Diagram Title: Agricultural Plot Extraction Framework
Implementation Details:
- Data Collection: Five datasets of UAV RGB imagery collected across different states in the US, featuring variations in plot dimensions, background variations, grid patterns, and crop growth stages [36].
- Mask Generation: Preprocessed orthomosaic UAV RGB images fed to SAM for mask generation without any training or fine-tuning [36].
- Orientation Estimation: The framework estimates field trial orientation to appropriately rotate images orthogonally, enhancing segmentation quality [36].
- Plot Refinement: Generated masks converted to polygons and undergo a series of refining processes before projection onto corresponding coordinate systems [36].
- Validation: Pixel-based evaluation (F1 score) and polygon-based evaluation (precision at IoU thresholds) used to validate performance [36].
Table 3: Essential Research Reagent Solutions for Segmentation Experiments
| Resource | Type | Function/Purpose | Example Implementation |
|---|---|---|---|
| Segment Anything Playground | Platform | Interactive experimentation with SAM models without coding [34] [39] | web-based interface at ai.meta.com |
| SAM 3 Model Weights | Pre-trained Model | Foundation for detection, segmentation, and tracking tasks [34] [35] | Available through Meta's official release |
| SA-Co Benchmark | Dataset | Evaluation benchmark for promptable concept segmentation [34] | Publicly available for research reproducibility |
| Medical SAM Adapter (Med-SA) | Adapted Model | Lightweight adaptation of SAM for medical images [38] | Updates only 2% of SAM parameters (13M) |
| Roboflow Annotation Platform | Tool | Data annotation and SAM 3 fine-tuning for specific needs [39] | Partnership with Meta for enhanced annotation |
| SA-FARI Dataset | Specialized Dataset | Wildlife monitoring videos with bounding boxes and segmentation masks [34] | Over 10,000 camera trap videos of 100+ species |
The comparative analysis presented in this guide demonstrates significant advancements in automated outline extraction capabilities, particularly with the introduction of SAM 3. The model's unified approach to detection, segmentation, and tracking across images and videos, combined with its support for text-based prompting, represents a substantial leap forward in segmentation technology [34] [39].
For researchers conducting identification accuracy studies comparing landmark and outline methods, the evidence suggests that modern segmentation models like SAM 3 offer compelling advantages for outline-based approaches, particularly in scenarios requiring flexibility and generalization across diverse object categories. However, specialized implementations like the YOLO-SAM hybrid for medical landmark detection demonstrate that landmark-based methods still provide value in highly specialized domains where extreme precision is required [32].
The emergence of efficient adaptation techniques like Medical SAM Adapter, which achieves superior performance on 17 medical segmentation tasks while updating only 2% of parameters, points toward a future where foundational segmentation models can be efficiently specialized for domain-specific applications without the need for extensive retraining [38]. This capability is particularly relevant for drug development professionals and researchers working with specialized imaging data who require both the generalization capabilities of foundational models and the precision of domain-adapted solutions.
As segmentation technology continues to evolve, researchers should consider the trade-offs between general-purpose foundational models and specialized implementations, selecting approaches based on their specific accuracy requirements, computational constraints, and application domains.
Accurate identification of insect vectors is a cornerstone of effective disease control. Traditional morphology can be challenging, leading to the adoption of geometric morphometrics (GM)—a quantitative analysis of shape. This guide compares the two predominant GM techniques, landmark-based and outline-based methods, evaluating their performance in distinguishing closely related vector species.
Geometric morphometrics (GM) has emerged as a powerful, low-cost, and rapid tool for identifying insect species, crucial for controlling disease vectors. Unlike traditional methods that can be confounded by morphological similarities or require significant expertise, GM analyzes the precise geometry of wings. The two primary techniques are landmark-based GM, which uses specific, definable anatomical points (landmarks), and outline-based GM, which uses the contours of a wing or its specific cells. The choice between these methods significantly impacts classification accuracy, especially for damaged specimens or cryptic species complexes. This guide objectively compares their performance across various disease vectors, supported by recent experimental data.
Performance Data Comparison
The following tables summarize quantitative results from recent studies, comparing the identification accuracy of landmark-based and outline-based GM across different insect vectors.
Table 1: Comparison of GM Method Accuracy for Dipteran Vectors
| Vector Group | Species Studied | Landmark-Based GM Accuracy | Outline-Based GM Accuracy | Key Findings | Source |
|---|---|---|---|---|---|
| Horse Flies | 15 Tabanus species | 97% (wing shape) | 96% (1st submarginal cell) | Shape analysis highly reliable; size analysis poor (23-27% accuracy). | [40] [41] |
| Horse Flies | T. megalops, T. rubidus, T. striatus | Not Applicable | Up to 86.67% (1st submarginal cell) | Outline-based GM is a viable alternative, especially for damaged wings. | [14] |
| Black Flies | 7 Simulium species | 88.54% (wing shape) | Not Applicable | Demonstrated high reliability as a complementary identification tool. | [42] |
| Mosquitoes | 7 species (Anopheles, Aedes, Culex) | Effective for genera & some species | Effective for genera & some species | Both methods were less effective for distinguishing Culex species. | [13] |
Table 2: GM Applications in Other Insects and with Complementary Tools
| Insect Group | Species Studied | Method | Classification Accuracy | Key Findings | Source |
|---|---|---|---|---|---|
| Scarab Beetles | 3 Holotrichia species | Landmark-based (hind wings) | >94.12% (females), >76.67% (males) | Accuracy improved after correcting for allometric effects. | [43] |
| Malaria Mosquitoes | An. messeae, An. daciae, An. beklemishevi | Landmark-based with molecular ID | Statistically significant separation | Wing morphometrics combined with genetics provides a reliable framework. | [44] |
| Plusiinae Moths | Soybean looper, Cabbage looper | Deep Learning (on wing patterns) | Taxonomist-level accuracy | CNN models distinguished species difficult for the human eye. | [45] |
Experimental Protocols
To ensure reproducibility, this section details the standard workflows and methodologies employed in the cited studies.
Standardized Workflow for Wing Morphometrics
The following diagram illustrates the generalized experimental protocol common to both landmark and outline-based GM studies.
Detailed Methodological Steps
Specimen Collection and Preparation: Adult insects are collected from the field using methods like traps or human bait. Specimens are preserved in ethanol (e.g., 80% or 96%) [42] [44]. The right wing is typically removed using fine forceps or a scalpel and mounted on a microscope slide with a mounting medium (e.g., Hoyer's solution) to create a semi-permanent, flat preparation [42] [13].
Digital Imaging: Mounted wings are photographed under standardized magnification using a digital camera attached to a stereomicroscope or compound microscope. A scale bar is included for calibration [42] [13]. High-resolution scanning (e.g., 2400 dpi) is also used [43].
Data Extraction:
- Landmark-Based Method: Researchers digitize two-dimensional Cartesian coordinates (x, y) of predefined anatomical landmarks—typically vein junctions—on the wing image. Studies use between 10 to 25 landmarks [42] [43] [13].
- Outline-Based Method: The contour of the entire wing or a specific wing cell (e.g., the first submarginal cell) is digitized. This is done by placing points along the outline or using Elliptic Fourier Analysis (EFA) to mathematically describe the shape [14] [13].
Statistical Shape Analysis: The coordinate or contour data is processed using specialized software.
- Generalized Procrustes Analysis (GPA) superimposes configurations to remove non-shape variations (position, orientation, scale) [13] [44].
- Size is analyzed separately as Centroid Size (landmarks) or perimeter length (outlines) [13].
- Shape variables (Partial Warps, Relative Warps, or Fourier coefficients) are analyzed with multivariate statistics like Discriminant Analysis (DA) or Canonical Variate Analysis (CVA) to maximize separation between groups [13] [44].
- Classification Accuracy is tested via validated reclassification tests, where each specimen is classified based on the model built from the remaining data [40] [13].
The Scientist's Toolkit: Essential Research Reagents and Materials
This section details key materials, software, and reagents required for conducting wing morphometrics research, as cited in the studies.
Table 3: Essential Research Reagents and Solutions
| Item Name | Function/Application | Example Use Case |
|---|---|---|
| Ethanol (80-96%) | Specimen preservation and storage. Prevents decomposition and maintains morphological integrity for both morphological and molecular analysis. | Preserving field-collected black flies and mosquitoes [42] [44]. |
| Hoyer's Solution | A mounting medium for microscope slides. Clears and stabilizes the wing, allowing for high-quality imaging by making structures more transparent. | Mounting mosquito wings for landmark and outline-based analysis [13]. |
| Software: MorphoJ, TPSDig2 | Specialized software for geometric morphometric analysis. MorphoJ performs statistical shape analysis, while TPSDig2 is used to digitize landmarks from images. | Analyzing wing shape variation in scarab beetles and malaria mosquitoes [43] [44]. |
| Software: CLIC | An open-source software package for the Collecting of Landmarks for Identification and Characterization. Used for both landmark and outline-based data acquisition and analysis. | Differentiating seven mosquito species in Thailand [13]. |
| PCR Reagents & Restriction Enzymes | For molecular identification and validation. Used for DNA barcoding (e.g., COI gene) or PCR-RFLP to confirm species identity, serving as a gold standard for GM validation. | Molecular confirmation of Anopheles species in the maculipennis subgroup [44]. |
Both landmark-based and outline-based geometric morphometrics are highly effective, low-cost tools for the identification of disease vectors. Landmark-based methods demonstrate exceptional accuracy, often exceeding 97% for wing shape in groups like horse flies [40]. Outline-based methods provide a robust alternative, particularly for damaged specimens, achieving over 86% accuracy using single wing cells [14]. The choice of method depends on the research goal: landmark-based is ideal for intact specimens and full-wing analysis, while outline-based offers flexibility for incomplete material. For the highest reliability, integrating GM with molecular techniques like DNA barcoding creates a powerful framework for species delimitation and vector surveillance [44].
Accurate anatomical landmark detection is a foundational element in orthopedic surgical planning, providing the critical spatial data required for precise preoperative plans, intraoperative guidance, and postoperative evaluation. This process involves identifying key morphological points on anatomical structures from medical images, enabling quantitative analysis of pathology, implant sizing, and alignment planning [46] [47]. The evolution from traditional manual identification to automated computational methods represents a significant advancement in orthopedic precision medicine, directly influencing surgical outcomes through improved accuracy and reduced procedural variability [46].
The broader research context for this case study focuses on comparing landmark-based and outline-based methods for identification accuracy. Landmark-based methods utilize specific, defined points on anatomy, while outline-based (or contour-based) methods use the entire shape boundary. Each approach presents distinct advantages and limitations in different clinical scenarios, which this analysis will explore through specific applications in orthopedic surgery [48]. As orthopedic procedures become increasingly personalized, the reliability of these identification methods directly impacts the success of patient-specific instrumentation, robotic-assisted surgery, and customized implant design [46].
Methodological Approaches to Anatomical Landmark Detection
Deep Learning-Based Landmark Detection
Deep learning approaches, particularly convolutional neural networks (CNNs) and specialized architectures like U-Net, have revolutionized anatomical landmark detection by automatically learning discriminative features from medical images without manual feature engineering. These models are trained on large annotated datasets to identify spatial relationships and patterns indicative of specific anatomical landmarks [46] [49].
The BrainSignsNET framework exemplifies this approach, utilizing a multi-task 3D CNN that integrates an attention decoder branch with a multi-class decoder branch to generate precise 3D heatmaps from which landmark coordinates are extracted. This architecture demonstrated high performance in internal validation, achieving an overall mean Euclidean distance of 2.32 ± 0.41 mm, with 94.8% of landmarks localized within their anatomically defined 3D volumes in external validation [49]. For orthopedic applications specifically, Cascaded Pyramid Networks with DSNT (Differentiable Spatial to Numerical Transform) layers have shown strong performance in coordinate regression, maintaining robust performance across various pathologies [46].
Statistical Shape Models (SSMs)
Statistical Shape Models (SSMs) represent an alternative methodological approach that quantifies anatomical variations across a population. SSMs are constructed by placing landmark points around anatomical structures and applying principal component analysis to capture the primary modes of shape variation [48].
A key consideration in SSM methodology is determining the optimal number of landmark points. Research comparing lumbar spine SSMs created with different landmark densities (4, 8, and 28 points per vertebra) found that the first five modes of variation explained approximately 80% of shape variance across all models. While models with fewer points captured major shape variations like lumbar curvature and vertebral depth effectively, the 4-point model failed to characterize concavity in vertebral edges, indicating that landmark density must be matched to clinical application requirements [48].
Uncertainty-Aware Deep Learning Frameworks
Recent advancements address the challenge of unstructured data (irregular patient postures, occluded landmarks) through uncertainty estimation. The UNSX-HRNet (Unstructured X-ray - High-Resolution Net) framework integrates high-resolution networks with anatomical relationship-based uncertainty estimation to predict landmarks without relying on a fixed number of points [47].
This approach suppresses low-certainty landmarks when handling unstructured data while providing confidence metrics for each prediction, offering correction guidance to clinicians. When applied to unstructured datasets, UNSX-HRNet demonstrated performance improvements exceeding 60% across multiple evaluation metrics while maintaining high performance on structured datasets, showcasing robust adaptability across varying clinical imaging conditions [47].
Comparative Performance Analysis of Detection Methods
Quantitative Performance Metrics Across Anatomical Sites
The table below summarizes the performance characteristics of different landmark detection methods across various anatomical regions and imaging modalities, based on current experimental data:
Table 1: Performance Comparison of Anatomical Landmark Detection Methods
| Method | Anatomical Site | Imaging Modality | Accuracy Metric | Performance Value | Key Strength |
|---|---|---|---|---|---|
| Deep Learning (CNN/Ensemble Models) [46] | Spine, Lower Limb | CT, MRI | Landmark Detection Accuracy | Comparable to human experts | Automatic localization of multiple landmarks |
| U-Net Based Deep Learning [46] | Complex Fractures | CT | Dice Coefficient | 0.986 | Excellent segmentation accuracy |
| Automated Segmentation AI [46] | General Orthopedic | CT, MRI | Surface Error | 0.234 mm | Minimal variability |
| BrainSignsNET [49] | Brain | MRI | Mean Euclidean Distance | 2.32 ± 0.41 mm | Robust 3D localization |
| Statistical Shape Model (28 points) [48] | Lumbar Spine | MRI | Explained Shape Variance | ~80% (first 5 modes) | Comprehensive shape characterization |
| Statistical Shape Model (4 points) [48] | Lumbar Spine | MRI | Explained Shape Variance | ~80% (first 5 modes) | Efficient for major shape features |
| External Landmark Method [50] | Internal Jugular Vein | Ultrasound | Correlation with TEE | r = 0.83 | Strong clinical correlation |
| Radiological Landmark Method [50] | Internal Jugular Vein | Ultrasound, X-ray | Correlation with TEE | r = 0.67 | Moderate clinical correlation |
Clinical Application Performance
In direct clinical applications, AI-driven landmark detection systems have demonstrated measurable advantages over conventional methods. For implant selection in joint replacement surgery, AI-assisted algorithms achieve femoral and tibial implant size prediction accuracy of 82.2% and 85.0% respectively, significantly outperforming conventional manufacturer default plans at 68.4% and 73.1% accuracy [46].
A prospective study comparing AI 3D planning with traditional 2D template measurements revealed substantially higher accuracy rates, with AI achieving 91.67% accuracy for femoral components compared to 66.67% for traditional methods. Similarly, tibial component accuracy reached 87.50% with AI versus 62.50% with conventional templating [46]. These improvements translate to tangible clinical benefits including reduced operation time, decreased intraoperative blood loss, lower postoperative drainage volumes, and improved patient-reported outcomes [46].
Method-Specific Limitations and Advantages
Each detection method presents distinct advantages and limitations. Deep learning models offer high automation and accuracy but require extensive annotated datasets for training and can function as "black boxes" with limited interpretability [46] [51]. Statistical Shape Models provide interpretable shape parameters but may oversimplify complex anatomy with limited landmarks [48]. Traditional landmark methods offer simplicity and immediate clinical applicability but are susceptible to inter-observer variability and may lack the precision required for complex procedures [50].
The choice between landmark-based and outline-based methods depends on clinical context. Landmark-based methods excel when specific, identifiable points contain sufficient information for the clinical task, while outline-based methods may be preferable when overall shape characteristics are more important than discrete points [48].
Experimental Protocols and Methodologies
Deep Learning Model Training Protocol
The experimental protocol for developing deep learning landmark detection models follows a standardized workflow:
Data Collection and Curation: Large-scale medical imaging datasets are assembled, preferably from multiple institutions to enhance generalizability. The BrainSignsNET study, for example, utilized 14,472 scans from 6,299 participants across multiple research cohorts [49].
Data Preprocessing: Images undergo standardized preprocessing including intensity normalization, spatial resampling, and artifact reduction to ensure consistency across the dataset [49].
Data Augmentation: Tailored 3D transformations (rotation, scaling, elastic deformations) are applied to increase dataset diversity and improve model robustness [49].
Model Architecture Design: Network architectures are specifically designed for landmark detection. BrainSignsNET implements a multi-task 3D CNN with attention and multi-class decoder branches to generate 3D heatmaps [49].
Model Training: Models are trained using appropriate loss functions (typically mean squared error for coordinate regression) with validation on held-out datasets [49] [47].
Validation: Internal and external validation assesses model performance using metrics including Euclidean distance, Dice coefficients, and clinical accuracy rates [46] [49].
Diagram 1: Deep learning model development workflow for anatomical landmark detection
Statistical Shape Model Construction Protocol
The methodology for constructing Statistical Shape Models for landmark-based anatomical analysis involves:
Image Acquisition: Collect medical images (MRI, CT) from a representative patient population [48].
Landmark Placement: Manually or semi-automatically place corresponding landmark points on each specimen. Studies compare different landmark densities (e.g., 4, 8, 28 points per vertebra) to optimize the trade-off between completeness and efficiency [48].
Shape Alignment: Procrustes analysis aligns all shapes to a common coordinate system to remove translational, rotational, and scaling differences [48].
Model Construction: Principal Component Analysis (PCA) is applied to the aligned shapes to extract major modes of variation that explain shape covariance across the population [48].
Model Validation: The resulting models are validated by quantifying the percentage of shape variance captured by each mode and comparing qualitative shape descriptors across models with different landmark densities [48].
Clinical Validation Study Design
Clinical validation of landmark detection methods typically follows prospective comparative designs:
Participant Selection: Enroll patients scheduled for relevant orthopedic procedures (e.g., 97 adult cardiac surgery patients for IJV catheterization study) with appropriate inclusion/exclusion criteria [50].
Reference Standard Establishment: Define a gold standard measurement (e.g., TEE-guided insertion depth for IJV catheterization) against which new methods are compared [50].
Blinded Measurement: Have investigators blinded to reference standard measurements apply the novel landmark method (e.g., external-landmark or radiological-landmark methods) [50].
Statistical Comparison: Calculate accuracy metrics, correlation coefficients, and agreement statistics (e.g., Bland-Altman analysis) between novel methods and the reference standard [50].
Research Reagents and Computational Tools
Essential Research Materials and Software Solutions
The experimental workflows for anatomical landmark detection require specific computational tools and resources:
Table 2: Essential Research Reagents and Computational Tools for Landmark Detection Research
| Tool Category | Specific Examples | Primary Function | Application Context |
|---|---|---|---|
| Deep Learning Frameworks | 3D CNN, U-Net, HRNet [46] [49] [47] | Feature extraction and landmark coordinate regression | High-precision landmark detection |
| Statistical Modeling Software | Statistical Shape Modeling platforms [48] | Population-based shape analysis and variation modeling | Shape variability quantification |
| Medical Imaging Data | ADNI, BLSA, BIOCARD datasets [49] | Model training and validation datasets | Algorithm development and testing |
| Image Annotation Tools | Medical image segmentation software [46] | Manual landmark annotation for training data | Ground truth establishment |
| Validation Metrics | Euclidean distance, Dice coefficient [46] [49] | Algorithm performance quantification | Method comparison and validation |
| Uncertainty Estimation Modules | UNSX-HRNet uncertainty scoring [47] | Prediction reliability assessment | Clinical decision support |
Discussion: Clinical Implications and Future Directions
Integration with Surgical Workflows
The ultimate value of anatomical landmark detection lies in its seamless integration into clinical orthopedic workflows. AI-driven landmark detection now enables real-time intraoperative guidance through edge computing implementations that achieve sub-100ms inference times, allowing rapid anatomical identification directly in the surgical field [46]. These advancements support mixed reality (MR) and augmented reality (AR) systems that overlay processed images and 3D models onto the surgical field, enhancing spatial awareness and surgical accuracy [46].
In robotic-assisted orthopedic surgery, AI-powered systems like Stryker's Mako and TiRobot leverage real-time landmark detection and preoperative models to achieve sub-millimeter accuracy in implant positioning, resulting in improved alignment, reduced soft-tissue damage, and fewer surgical complications [46]. Clinical studies report a reduction of up to 30% in operative time, 35% less blood loss, and faster patient recovery compared to conventional methods [46].
Method Selection Guidelines
Choosing between landmark-based and outline-based methods requires careful consideration of clinical context:
Landmark-based methods are preferable when specific, identifiable anatomical points contain sufficient information for the clinical task, such as implant sizing in joint replacement or pedicle screw trajectory planning [46] [48].
Outline-based approaches may be more appropriate when overall shape characteristics influence clinical decisions more than discrete points, such as assessing spinal curvature or joint surface morphology [48].
Hybrid methods that combine landmark and outline information offer promising directions for comprehensive anatomical assessment, particularly in complex surgical planning scenarios [48].
Future Research Directions
The field of anatomical landmark detection continues to evolve with several promising research directions:
Explainable AI: Developing interpretable models that provide transparent reasoning for landmark predictions to build clinical trust and facilitate adoption [46].
Multimodal Data Integration: Combining information from multiple imaging modalities (CT, MRI, ultrasound) and clinical data sources to enhance detection robustness [46].
Uncertainty Quantification: Expanding uncertainty estimation frameworks to provide reliable confidence measures for clinical decision support [47].
Federated Learning: Enabling model training across multiple institutions without data sharing to enhance generalizability while preserving privacy [46].
Real-time Adaptive Systems: Developing systems that continuously learn and adapt from new surgical cases to improve performance over time [46].
As these technologies mature, anatomical landmark detection will increasingly serve as the foundation for personalized orthopedic care, enabling patient-specific surgical strategies optimized for individual anatomical variations and pathological conditions.
The forensic analysis of barefoot prints left on soil substrates presents significant challenges due to the variable and often low-contrast nature of the impressions. Such evidence is frequently encountered in criminal investigations, including homicides and sexual assaults, where perpetrators may remove footwear to reduce noise [52]. Traditional methods for analyzing these prints are often labor-intensive, subjective, and struggle with large datasets [52]. This case study objectively compares the performance of two primary geometric morphometric approaches—landmark-based and outline-based methods—for the accurate identification of individuals from barefoot prints on soil. The evaluation is framed within a broader thesis on identification accuracy research, providing forensic researchers and professionals with a data-driven comparison of these evolving techniques. Supporting experimental data, including quantitative results and detailed methodologies, are summarized to facilitate comparison and adoption.
Methodology and Experimental Protocols
Deep Learning Framework (DeepFIT)
The core experiment utilized a deep learning architecture named Deep Learning Footprint Identification Technology (DeepFIT), based on a modified You Only Look Once (YOLOv11s) algorithm [52]. To address the challenges of soil substrates, an Extra Small Detection Head (XSDH) was incorporated to improve feature extraction at smaller scales and enhance generalization through multi-scale supervision, thereby reducing overfitting to specific spatial patterns [52]. The study directly compared three distinct approaches within this framework:
- Bounding Box (BBox): Utilized a simple rectangular prompt to localize the footprint.
- Automated Landmarks: Employed a semi-automated process to identify 16 key anatomical landmarks on each barefoot print.
- Automated Segmentation (Auto-Seg): Used the Segment Anything Model (SAM) to extract the precise geometric outline of the footprint.
Data Collection and Preparation
The study involved 40 adult participants (20 males, 20 females), from whom 600 barefoot print images were collected per individual on both soft and sandy soil substrates [52]. This resulted in a substantial dataset for training and testing the deep learning models. For the landmark-based method, 16 anatomical landmarks were defined on the barefoot prints. The annotation process combined expert knowledge with automatic detection to ensure precision and reproducibility [52]. This protocol mirrors the approach used in other forensic identification domains, such as craniofacial analysis, where anatomical reference points are crucial [53].
Experimental Workflow
The following diagram illustrates the logical workflow of the comparative experiment, from data collection through to final identification.
Results and Performance Comparison
Quantitative Accuracy Assessment
The models were evaluated based on their accuracy in correctly identifying and matching barefoot prints to the same individual across the two soil substrates. Performance varied significantly between the three methods.
Table 1: Performance Comparison of Barefoot Print Analysis Methods
| Analysis Method | Average Accuracy (across both soil substrates) | Key Characteristics |
|---|---|---|
| Bounding Box (BBox) | 77% [52] | Declined as the number of individuals in training increased; led to misclassifications [52]. |
| Automated Segmentation (Outline) | 90% [52] | Leveraged SAM for precise geometric outline extraction; more robust than BBox [52]. |
| Anatomical Landmarks | 96% [52] | Most reliable method; used 16 key points for discriminative morphometric analysis [52]. |
The results demonstrate the clear superiority of the landmark-based approach, which achieved a 96% accuracy rate, significantly outperforming both the outline-based (90%) and bounding box (77%) methods [52]. The study noted that the performance of the BBox model deteriorated as the size of the training dataset increased, indicating its limitations for scalable forensic applications [52].
Contextualizing Landmark vs. Outline Performance
The findings from this case study are consistent with broader research in geometric morphometrics. A comparative study on mosquito identification also found that while both landmark- and outline-based techniques were effective for distinguishing species, their precision depended on the specific application and the characteristics of the sample [13]. The landmark-based approach provides a powerful method for analyzing shape based on explicit, homologous anatomical points [13]. In contrast, the outline-based method relies on contour data, which can be highly effective when the outline contains species- or individual-specific information [13]. The 6-percentage-point accuracy difference in the barefoot print study underscores the value of explicit anatomical information for discriminating between individuals, especially on challenging substrates like soil where outlines may be incomplete or distorted.
The Scientist's Toolkit: Essential Research Reagents and Materials
Implementing a robust barefoot print analysis system requires a combination of specialized materials and computational resources. The following table details key solutions used in the featured DeepFIT experiment and the broader field.
Table 2: Key Research Reagent Solutions for Forensic Barefoot Print Analysis
| Item / Solution | Function in Research/Analysis |
|---|---|
| Soil Substrates (Soft & Sandy) | Provide standardized, forensically relevant media for creating and studying barefoot impressions under controlled yet realistic conditions [52]. |
| Plaster Casting Material | In field forensics, used to create a permanent 3D negative of a footprint impression; subsequent analysis can examine the cast-soil interface for transferred trace evidence [54]. |
| Deep Learning Framework (e.g., PyTorch/TensorFlow) | Provides the programming environment to build, train, and validate complex models like the modified YOLOv11s used in DeepFIT [52]. |
| Segment Anything Model (SAM) | A state-of-the-art vision model used for the "Auto-Seg" method to extract high-fidelity, pixel-wise outlines of footprints from images with complex backgrounds [52]. |
| Pre-trained YOLO-pose Models | Enable accurate automatic annotation of anatomical landmarks on 2D images, reducing manual labor and subjective bias in landmark placement [55]. |
| Geometric Morphometric Software (e.g., CLIC) | Used in traditional and hybrid analyses to perform statistical shape analysis, including Generalised Procrustes Analysis (GPA) and Discriminant Analysis (DA) on landmark or outline data [13]. |
| High-Resolution Digital Camera | Essential for capturing detailed images of footprints where subtle features and textures are critical for both manual and automated analysis [52]. |
This case study provides compelling evidence that landmark-based geometric morphometrics, when enhanced by a deep learning framework like DeepFIT, offers a highly reliable method for the forensic identification of barefoot prints on soil substrates. Its 96% accuracy surpasses outline-based and bounding-box methods, making it a superior tool for linking suspects to crime scenes. The detailed protocols and performance data presented herein offer researchers and forensic professionals a validated pathway for implementing this technology, ultimately strengthening the role of footprint evidence in forensic investigations and justice systems.
Overcoming Challenges: Noise, Uncertainty, and Performance Optimization
Addressing Anatomical Uncertainty and Image Artifacts in Clinical Data
Accurately identifying anatomical structures is a foundational step in medical image analysis, influencing critical applications from surgical planning to disease diagnosis. However, this task is inherently challenged by anatomical uncertainty—the natural biological variation and ambiguous definition of anatomical boundaries—and the pervasive presence of image artifacts stemming from acquisition physics and patient motion. This guide objectively compares the performance of two predominant computational approaches for identification accuracy: landmark-based methods, which locate distinct anatomical points, and outline-based methods, which segment entire anatomical structures. Framed within a broader thesis on identification accuracy research, this analysis provides researchers and drug development professionals with a detailed comparison of experimental protocols, performance data, and essential toolkits for navigating these analytical challenges.
Performance Comparison Table
The following table summarizes the key performance characteristics of landmark-based and outline-based methods, synthesizing findings from recent research.
Table 1: Performance Comparison of Landmark and Outline-Based Identification Methods
| Feature | Landmark-Based Methods | Outline-Based Methods (Segmentation) |
|---|---|---|
| Core Principle | Localize specific, distinct anatomical points [56] [57]. | Delineate the complete boundary of an anatomical structure [58]. |
| Primary Output | 2D or 3D coordinates of keypoints. | Binary mask or contour defining the structure. |
| Typical Accuracy | Median errors reported from 1.5 mm to 4.3 mm, varying by anatomical region [57]. | High volume overlap (e.g., >95% Dice similarity under ideal conditions) but surface error highly dependent on threshold [58]. |
| Robustness to Uncertainty | Can model ambiguity via probability clouds (e.g., 6.04 mm - 17.90 mm cloud size at 95% probability) [59]. | Highly sensitive to segmentation threshold; small greyscale variations can cause large shape changes [58]. |
| Handling of Image Artifacts | Collaborative frameworks use "easy" landmarks to guide detection of "difficult" ones in artifact-prone areas [56]. | Generative AI models (e.g., GANs, diffusion models) can be trained to correct artifacts prior to or during segmentation [60]. |
| Data Efficiency | Can be effective with fewer annotated samples due to lower annotation burden per image. | Often requires large, densely annotated datasets for training. |
| Computational Speed | Very fast post-training (e.g., ~1 second/landmark) [56]. | Can be slower due to processing of larger image regions or complex post-processing. |
Detailed Experimental Protocols and Methodologies
Landmark-Based Identification Protocols
1. Collaborative Regression-Based Landmark Detection: This protocol addresses the limitations of conventional regression-based methods, which include uninformative votes from faraway voxels and a neglect of spatial dependency between landmarks [56].
- Multi-Resolution Collaboration: Landmarks are localized hierarchically. A coarse-resolution vote provides an initial estimate, which is then refined by allowing only nearby, informative voxels to vote in higher-resolution stages [56].
- Spherical Sampling: During training, a spherical sampling strategy increases the probability of selecting training voxels closer to the target landmark. This improves the prediction accuracy of voxels in the immediate vicinity of the landmark, leading to more precise final localization [56].
- Inter-Landmark Collaboration: A confidence-based strategy is employed. First, "easy-to-detect" landmarks (those with high detection reliability) are identified. Then, "difficult-to-detect" landmarks are localized using not only local image features but also context distance features, which represent the spatial relationship (displacement) to the reliable landmarks [56].
2. Heatmap-Based Deep Learning Landmark Detection: This is a widely used modern approach that indirectly learns landmark coordinates.
- Model Architecture: A U-Net is commonly used to predict a Gaussian heatmap for each landmark, where the peak of the heatmap corresponds to the landmark's location [57].
- Loss Function: The model is trained using a combination of Dice loss and a weighted L1 loss. This combination ensures the predicted heatmap closely matches the ground-truth Gaussian distribution while handling the significant class imbalance between the small landmark point (foreground) and the rest of the image (background) [57].
- Multi-Stage Workflow for Precision: For structures with densely clustered landmarks (e.g., the cervical spine), a two-stage workflow is implemented. First, the entire image is analyzed to identify a Region of Interest (ROI). Second, the ROI is processed at a higher resolution to achieve precise localization of the dense landmarks [57].
Outline-Based Identification Protocols
1. ISO50 Thresholding and Its Uncertainties: A foundational outline-based method is ISO50 thresholding, which defines a material boundary at the midpoint greyscale value between the material and the background peaks in a histogram [58].
- Protocol: The greyscale histogram of the image is analyzed. The threshold value is set precisely midway between the average greyscale of the target structure and the average greyscale of the background.
- Uncertainty Quantification: The accuracy of this method is highly dependent on image resolution and the presence of artifacts. In idealized digital phantoms, the diameter measurement error can be <2% with sufficient voxels across the diameter. However, in physical CT phantoms, this error can degrade to ~4% due to real-world imaging artifacts and the partial volume effect, where voxels contain mixtures of materials [58]. Even small variations in the chosen threshold value can lead to significant changes in the resulting outline, especially in structures with low contrast or perfused boundaries [58].
2. AI-Driven Motion Artifact Correction for Segmentation: This protocol focuses on improving outline-based identification in artifact-corrupted MRI, a common clinical challenge.
- Model Training: Deep learning models, particularly generative models like Generative Adversarial Networks (GANs) and Denoising Diffusion Probabilistic Models (DDPMs), are trained on paired datasets. These datasets consist of motion-corrupted images as input and their corresponding motion-free "ground-truth" images as the target output [60].
- Loss Functions: Models are optimized using a combination of pixel-wise loss (e.g., Mean Squared Error) to ensure structural fidelity and perceptual loss (e.g., based on Structural Similarity Index - SSIM) to preserve textural information and overall image quality [60].
- Integration: The trained model is used as a pre-processing step. A motion-corrupted clinical image is fed into the network, which outputs a corrected image. This corrected image is then used for subsequent segmentation tasks, yielding a more accurate and reliable outline [60].
Workflow Visualization
The following diagram illustrates a consolidated research workflow for evaluating identification methods, integrating the protocols described above.
The Scientist's Toolkit
Table 2: Essential Research Reagents and Solutions for Identification Accuracy Studies
| Toolkit Item | Function/Description | Example Use Case |
|---|---|---|
| Annotation Software with Probabilistic Support | Allows multiple annotators to label data; calculates centroid and distribution of annotations to model landmark uncertainty [59]. | Creating clinical benchmark datasets to define human-level accuracy and annotation cloud sizes for landmarks [59]. |
Specialized Landmark Localization Libraries (e.g., landmarker) |
Python packages (PyTorch-based) providing flexible toolkits for developing and evaluating landmark algorithms, supporting heatmap regression and other methods [7]. | Rapid prototyping and benchmarking of new landmark detection models against established baselines. |
| Deep Learning Frameworks (e.g., PyTorch, TensorFlow) | Provides the computational backbone for building and training complex models, including U-Nets and GANs [57] [60]. | Implementing heatmap-based landmark detection or training generative models for MRI motion artifact correction [57] [60]. |
| Graphical Model Libraries | Enable the implementation of Markov Random Fields (MRFs) to enforce explicit anatomical constraints between landmarks [61]. | Refining initial landmark predictions by filtering out anatomically implausible configurations [61]. |
| Digital Phantoms and Simulated Datasets | Digital models (e.g., CAD spheres) or algorithms that simulate pathological conditions and image artifacts (e.g., motion, metal streaks) [58] [60]. | Quantifying baseline accuracy and robustness of identification methods in a controlled environment with a known ground truth [58]. |
Handling Low-Contrast and Unstructured Data in Natural Environments
In the broader research on identification accuracy, a fundamental divide exists between landmark methods, which rely on identifying specific, distinct points, and outline methods, which define the boundaries of structures. This comparison is critical in environmental science, where data acquired from natural settings is often characterized by low contrast, noisy signals, and a lack of predefined structure. Unlike controlled laboratory conditions, data from the natural environment presents unique obstacles, including spatial autocorrelation, extrinsic noise, and severe class imbalance, where the phenomena of interest are rare against a vast background [62]. The choice between landmark and outline-based identification is not merely methodological but profoundly impacts the reliability, accuracy, and ultimately, the scientific value of the research. This guide objectively compares the performance of these approaches, providing a framework for researchers to select the optimal strategy for their specific environmental data challenges.
Performance Comparison: Landmark vs. Outline Methods
The performance of landmark and outline methods varies significantly depending on the data modality and the complexity of the identification task. The following tables summarize key experimental findings from various fields, highlighting the strengths and limitations of each approach.
Table 1: Performance Comparison in Medical Imaging Modalities (A Controlled, High-Resolution Context)
| Method Category | Imaging Modality | Reported Accuracy Metric | Performance Outcome | Key Limitations |
|---|---|---|---|---|
| Landmark (AI-Driven) | Spiral Computed Tomography (SCT) | Mean Radial Error (MRE) [4] | < 1.3 mm | Precision varies by landmark type; higher error on coronal axis [4]. |
| Landmark (AI-Driven) | Cone-Beam CT (CBCT) [4] | Mean Radial Error (MRE) [4] | < 1.3 mm | Dental landmarks more precise than bone landmarks in CBCT [4]. |
| Landmark (AI-Driven) | Lateral Cephalograms (2D) | Accuracy vs. Manual Tracings [63] | High for dental measurements; Inconsistent for skeletal/soft tissue [63] | Deviations often exceed clinically relevant 2 mm/2° threshold for complex landmarks [63]. |
| Outline (Object Detection) | Optical-SAR Satellite Imagery | Detection Accuracy on OGSOD-2.0 Benchmark [64] | Challenging for tiny-scale, crowded objects [64] | Struggles with low resolution (<12 pixels) and high object density in natural scenes [64]. |
Table 2: Performance in Natural Environment Contexts
| Method Category | Application Domain | Primary Challenge | Impact on Performance | Suggested Mitigation |
|---|---|---|---|---|
| General Data-Driven Models | Species Distribution Modeling (SDM) [62] | Imbalanced Data / Rare Phenomena [62] | Minority class occurrences are frequently misclassified [62]. | Apply spatial clustering and advanced sampling techniques [62]. |
| General Data-Driven Models | Geospatial Predictions (e.g., forest biomass) [62] | Spatial Autocorrelation (SAC) [62] | Deceptively high predictive power; poor generalization revealed via spatial validation [62]. | Implement spatial cross-validation and account for SAC in model building [62]. |
| Outline (Object Detection) | Underwater Object Detection [64] | Low Contrast, Occlusion, Unbalanced Light [64] | Conventional models fail to extract discriminative features [64]. | Use graph attention mechanisms on irregular patches to reduce noise [64]. |
Detailed Experimental Protocols and Methodologies
Protocol 1: AI-Driven 3D Landmark Identification in Medical Imaging
This protocol, derived from a multicenter diagnostic study, outlines a highly accurate landmark method for structured 3D data [4].
- Objective: To develop and validate an automatic 3D landmarking model for accurate, robust, and generalizable localization of craniofacial landmarks in Spiral CT (SCT) and Cone-Beam CT (CBCT) scans [4].
- Data Collection & Annotation: A dataset of 480 SCT and 240 CBCT cases was retrospectively collected. Landmarks were annotated independently by senior clinicians using specialized software (Mimics 16.0). A rigorous quality control and consistency check was performed, with landmarks achieving an intraclass correlation coefficient (ICC) ≥ 0.70 set as the reference standard [4].
- Model Establishment: A streamlined, lightweight 3D U-Net network was implemented. This convolutional neural network (CNN) architecture is optimized for volumetric data.
- Training & Evaluation: The model was trained and tested on the internal dataset, with an additional inference on an external set of 320 SCT and 150 CBCT cases. Primary evaluation metrics were Mean Radial Error (MRE) and Success Detection Rate (SDR) within 2-, 3-, and 4-mm error thresholds [4].
- Key Results: The model achieved an average MRE consistently below 1.3 mm for both SCT and CBCT, even in complex conditions like malocclusion or the presence of metal artifacts. It improved specialist proficiency and accelerated analysis time by 6 to 9.5 times [4].
Protocol 2: Few-Shot Outline Detection in Remote Sensing
This protocol addresses the outline method challenge of detecting objects with very limited labeled data in complex natural environments [64].
- Objective: To enable object detection in remote sensing images for novel classes with only a few annotated examples, overcoming the data scarcity typical in environmental studies [64].
- Data & Benchmarking: The study used the challenging OGSOD-2.0 benchmark, a multimodal optical-SAR dataset containing objects like bridges and harbors that are tiny, crowded, and set against complex backgrounds [64].
- Methodology - Adaptive Feature Modification: A two-branch meta-learning network was employed. To enhance the model's ability to recognize novel classes, support features (from the few examples) were integrated into the query feature extraction network as a convolutional bias, adaptively modifying the query features to better align with the target class [64].
- Methodology - Gaussian Dynamic Dilated Convolution: This technique was introduced to simulate intra-class variation and enhance feature representation. It helps the model learn a more robust understanding of a class despite limited examples [64].
- Key Results: The proposed method demonstrated improved performance for novel classes compared to existing few-shot object detection techniques, providing a viable solution for applications where annotated data is difficult and expensive to obtain [64].
The Scientist's Toolkit: Key Research Reagents & Materials
Table 3: Essential Tools for Handling Complex Environmental Data
| Tool/Solution | Category | Primary Function in Research | Application Example |
|---|---|---|---|
| 3D U-Net [4] | Neural Network Architecture | Volumetric image segmentation and landmark localization in 3D data. | Accurate identification of craniofacial landmarks in SCT/CBCT scans [4]. |
| Lightweight PP-LCNet [64] | Neural Network Backbone | Provides a computationally efficient backbone for object detection, enabling faster processing. | Used in PPLCNet-YOLOv5s for dynamic SLAM in robots, reducing parameters by 44.72% [64]. |
| Dynamic Snake Convolution (DSConv) [64] | Specialized Convolution | Better extracts elongated, tubular structural features from images. | Employed in DMSNet for precise, continuous prediction of the brain midline in CT scans [64]. |
| Graph Attention Network [64] | Network Architecture | Models relationships between irregular patches in an image to capture internal structure and reduce noise. | Applied to underwater object detection for handling occlusion and low contrast [64]. |
| OGSOD-2.0 Dataset [64] | Benchmark Dataset | Provides a challenging benchmark for evaluating object detection on tiny, crowded objects in optical-SAR imagery. | Testing multimodal object detectors in realistic remote sensing scenarios [64]. |
| Spatial Cross-Validation [62] | Validation Technique | Prevents over-optimistic performance estimates by ensuring training and test sets are spatially separated. | Crucial for robust model evaluation in species distribution modeling and other geospatial tasks [62]. |
The comparison between landmark and outline methods reveals that neither is universally superior; their efficacy is intrinsically tied to the nature of the environmental data and the research question.
- Landmark Methods are the tool of choice for high-resolution, structured data where distinct, pre-defined points exist. Their performance is exceptional in medical imaging (e.g., CT scans) and any context where accuracy can be measured in millimeter-level errors. However, they fail when such distinct points are absent or cannot be reliably identified due to noise or low contrast [4] [63].
- Outline Methods are essential for unstructured, low-contrast data where the goal is to identify shapes, boundaries, or entire objects. They are more adaptable to challenging natural environments, such as satellite and underwater imagery. Their limitations emerge with low-resolution targets and require sophisticated techniques, like few-shot learning, to overcome the scarcity of annotated data [64].
Therefore, the core of the methodological choice lies in a clear-sighted assessment of the data's structure and the identification target's nature. Researchers should opt for landmark methods when analyzing well-defined structures in high-quality data and leverage outline methods when dealing with the inherent noise, ambiguity, and low contrast of unstructured natural environments. Future progress will likely hinge on hybrid models that intelligently combine the precision of landmarks with the shape-capturing power of outlines.
In medical imaging and computational anatomy, the ability of models to consistently perform across diverse datasets is paramount for clinical adoption. Model robustness and generalizability ensure that diagnostic tools and analytical systems maintain accuracy when faced with new patient populations, varying imaging protocols, or different scanner technologies. This comparison guide examines the current landscape of robustness techniques, with a specific focus on their application to landmark and outline identification methods—core components in morphological analysis, surgical planning, and biomedical research.
The challenge of generalizability is particularly acute in landmark detection, where models must identify consistent anatomical features despite significant biological variation and imaging heterogeneity. Research indicates that even state-of-the-art deep learning models can experience performance degradation when applied to data from new institutions or acquisition protocols [4] [65]. This guide synthesizes experimental evidence from recent studies to objectively compare techniques for enhancing model generalizability, providing researchers with validated approaches for developing more reliable identification systems.
Comparative Analysis of Generalizability Techniques
Technical Approaches for Enhanced Generalization
Table 1: Techniques for Improving Model Robustness and Generalizability
| Technique Category | Specific Methods | Mechanism of Action | Demonstrated Effectiveness |
|---|---|---|---|
| Data-Centric | Data Augmentation (rotation, flipping, noise injection) [65] | Increases training data diversity by simulating realistic variations | Improves resilience to scanner differences and acquisition parameters |
| Spline-based Imputation [66] | Recovers missing landmark points through interpolation | Substantial accuracy gains in sign language recognition with partial data | |
| Model Architecture | Lightweight U-Net Optimization [4] | Reduces model complexity while maintaining performance | Achieved <1.3mm error in craniofacial landmark detection across modalities |
| Ensemble Learning (bagging, boosting, stacking) [65] | Combines multiple models to overcome individual limitations | Enhances reliability across diverse patient populations and clinical settings | |
| Training Strategy | Transfer Learning [65] | Leverages pre-training on large-scale datasets before fine-tuning | Maintains performance with limited task-specific data |
| Regularization (L1/L2, Dropout, Batch Normalization) [65] | Introduces constraints to prevent overfitting to training specifics | Improves out-of-distribution performance on textual complexity tasks [67] | |
| Adaptive Optimization (Adam) [65] | Dynamically adjusts learning rate during training | Stabilizes training process and improves convergence on noisy data | |
| Evaluation Paradigm | Multi-Center Validation [4] | Tests models on data from different institutions and scanners | Provides realistic assessment of clinical generalizability |
| Uncertainty Estimation [65] | Quantifies model confidence in predictions | Identifies edge cases where model performance may degrade |
Performance Comparison of Landmark Identification Methods
Table 2: Experimental Performance of Landmark Detection Methods Across Domains
| Application Domain | Method | Dataset Characteristics | Performance Metrics | Generalizability Findings |
|---|---|---|---|---|
| Distal Femur Landmarks [17] [68] | Neural Network (nnU-Net) | 202 femora CT scans | Success rate: 100% (non-osteophyte), 92% (osteophyte) | Robust to pathological shape variations |
| Statistical Shape Model | 202 femora CT scans | Success rate: 97% (non-osteophyte), 92% (osteophyte) | Failed prepositioning in 3 cases affecting accuracy | |
| Geometric Approach | 202 femora CT scans | Success rate: 94% (non-osteophyte), 71% (osteophyte) | Limited robustness to osteophyte cases | |
| Craniofacial Landmarks [4] | 3D U-Net | 480 SCT, 240 CBCT scans | MRE: <1.3mm, SDR@2mm: high across modalities | Consistent performance on external validation sets |
| Lumbar Spine Shape Modeling [48] | SSM (4 landmarks) | 30 women, MR images | Explained ~80% shape variance | Captured major variations but missed concavity details |
| SSM (28 landmarks) | 30 women, MR images | Explained ~80% shape variance | Preserved detailed anatomical features like vertebral concavity | |
| Sign Language Recognition [66] | MediaPipe (full 543 landmarks) | LIBRAS datasets | Low accuracy due to redundancy | Performance issues from non-linguistic variation |
| MediaPipe (optimized subset) | LIBRAS datasets | High accuracy, 5× faster than OpenPose | Careful landmark selection crucial for efficiency and accuracy |
Experimental Protocols and Methodologies
Comparative Validation of Femoral Landmark Detection
A direct comparison of three automated landmark identification methods was conducted on a standardized dataset of 202 femora from CT scans [17] [68]. The experimental protocol involved manual landmark identification by two raters to establish reference standards, with the average of their measurements serving as the ground truth. Six distal femoral landmarks were evaluated: medial/lateral epicondyles (MEC/LEC), most distal points on medial/lateral condyles (MDC/LDC), and most posterior points on medial/lateral condyles (MPC/LPC).
The neural network approach utilized the self-configuring nnU-Net framework with a 3D full-resolution architecture, treating landmark identification as a semantic segmentation task. The statistical shape model employed point correspondences established through the N-ICP-A algorithm, while the geometric approach defined landmarks based on spatial extremal points in a bone-specific coordinate system. To test robustness, the methods were evaluated on both non-osteophyte cases (178 femora) and challenging osteophyte cases (24 femora), with a standardized 80/20 train-test split [68].
Cross-Modal Validation for Craniofacial Landmarks
A multicenter retrospective study validated an automated 3D landmarking model for oral and maxillofacial regions across both spiral CT (SCT) and cone-beam CT (CBCT) scans [4]. The protocol incorporated 480 SCT and 240 CBCT cases for training and testing, with an additional external validation on 320 SCT and 150 CBCT cases from different institutions.
The model was implemented using an optimized lightweight 3D U-Net architecture. Landmark annotation followed a rigorous quality control process with senior clinicians, and intraclass correlation coefficient (ICC) ≥ 0.70 was set as the reference standard reliability threshold. The study specifically evaluated performance under challenging conditions including malocclusion, missing dental landmarks, and metal artifacts to stress-test generalizability [4].
Figure 1: Experimental Workflow for Landmark Detection Generalizability Testing
The Scientist's Toolkit: Essential Research Reagents and Solutions
Table 3: Key Research Tools for Landmark Detection and Generalizability Research
| Tool/Category | Specific Implementation | Function in Research | Application Context |
|---|---|---|---|
| Deep Learning Frameworks | nnU-Net [17] [68] | Self-configuring neural network for medical image segmentation | Adapts automatically to dataset properties; used in femoral landmark detection |
| 3D U-Net [4] | Optimized architecture for volumetric medical image analysis | Craniofacial landmark detection across CT modalities | |
| Landmark Extraction Tools | MediaPipe [66] | Lightweight framework for real-time body landmark detection | Efficient sign language recognition with optimized landmark subsets |
| OpenPose [66] | 2D real-time multi-person keypoint detection | Comprehensive body landmark detection at higher computational cost | |
| Statistical Shape Modeling | N-ICP-A Algorithm [68] | Non-rigid iterative closest point alignment for establishing point correspondences | Building statistical shape models of anatomical structures |
| Evaluation Platforms | Multi-Center Validation Sets [4] | Diverse datasets from multiple institutions with different acquisition protocols | Testing model generalizability across real-world clinical variations |
| Data Augmentation Tools | Geometric/Color Transformations [65] | Simulate imaging variations through controlled modifications | Improving model resilience to scanner differences and acquisition parameters |
This comparison guide demonstrates that achieving model robustness requires a multifaceted approach combining data-centric strategies, architectural considerations, and rigorous validation protocols. The experimental evidence reveals that no single method universally outperforms others across all domains; rather, the optimal approach depends on the specific application requirements, with neural networks excelling in complex pattern recognition [17] [4] and statistical shape models providing strong performance when anatomical priors are available [48] [68].
For researchers pursuing landmark identification accuracy, the findings emphasize that generalizability must be baked into the model development process from inception rather than treated as an afterthought. Techniques such as multi-center validation, careful landmark subset selection [66], and stress-testing under challenging conditions [4] provide critical safeguards against overoptimistic performance estimates. As models continue to evolve, the integration of interpretability frameworks [67] with robust architectural designs promises to advance the field toward more reliable, clinically deployable anatomical identification systems.
Figure 2: Relationship Between Robustness Techniques and Generalizability Outcomes
In landmark and outline identification for medical imaging and remote sensing, optimization strategies significantly enhance detection accuracy and reliability. Multi-scale supervision allows models to recognize objects at various resolutions and sizes, while spatial relationship fusion incorporates contextual anatomical or environmental information. These approaches are particularly valuable for researchers and drug development professionals requiring precise morphological analysis in genetic studies, treatment planning, and surgical outcome evaluation. This guide objectively compares leading methodological implementations, their experimental performance, and practical applications within the broader research context of identification accuracy.
Comparative Performance Analysis of Optimization Approaches
The table below summarizes the quantitative performance of various optimization strategies reported in recent studies:
Table 1: Performance Comparison of Landmark Detection Methods Utilizing Multi-scale Supervision and Spatial Relationship Fusion
| Method | Architecture | Dataset | Key Optimization Strategy | Mean Error | Performance Advantage |
|---|---|---|---|---|---|
| Patch-based CNN [69] | Convolutional Neural Network | 30 3D facial images | Patch-based multi-scale analysis with data augmentation | 0.47 ± 0.52 mm | Significantly outperformed Cliniface software (3.66 ± 1.53 mm) |
| SRLD-Net [70] | Super-Resolution Landmark Detection Network | 169 CMF CT volumes | Super-resolution upsampling with pyramid fusion blocks | 1.39 ± 1.04 mm | Reduced GPU requirements while maintaining high accuracy |
| SR-UNet [70] | Super-Resolution U-Net | Nasal dataset (6 landmarks) | Pyramid pooling with super-resolution blocks | 1.31 ± 1.09 mm | Superior detection accuracy with higher computational demand |
| Lightweight 3D U-Net [4] | 3D U-Net | 480 SCT & 240 CBCT scans | Lightweight architecture for 3D localization | <1.3 mm (SCT), <1.4 mm (complex cases) | Maintained precision with malocclusion, missing teeth, metal artifacts |
| EMF-DETR [71] | Transformer-based Detection | VisDrone2019 dataset | Multi-scale edge-aware feature extraction (MEFE-Net) | 2.0% mAP improvement over baseline | Excelled in small object detection with 20.22% parameter reduction |
| MUSTFN [72] | Convolutional Neural Network | Landsat-7 & MODIS images | Multi-scale spatiotemporal fusion | 6.8% relative MAE | Effectively handled rapid land cover changes and registration errors |
Experimental Protocols and Methodologies
Patch-based CNN for 3D Facial Landmarks
Experimental Protocol: Researchers evaluated a patch-based CNN against Cliniface software using thirty 3D stereophotographic facial images from orthognathic patients. The methodology involved:
- Ground Truth Establishment: An expert operator performed manual digitization of twenty anatomical facial landmarks twice to establish reference data [69].
- Patch Processing: The 3D facial image was subdivided into multiple patches around each landmark's center, with the trained CNN algorithm detecting landmarks within each patch [69].
- Data Augmentation: Translation cropping on 408 patches generated 10,200 PNG images (151×151 pixels) per landmark to increase sample size [69].
- Validation Approach: Partial Procrustes Analysis measured Euclidean distances between manually detected landmarks and automated method outputs, with significance level set at 0.05 [69].
This approach demonstrated that the patch-based CNN reached manual precision levels, while Cliniface exhibited significant inaccuracies, particularly for Subalar landmarks (>8mm error) [69].
Super-Resolution Landmark Detection Networks
Experimental Protocol: SRLD-Net and SR-UNet implemented multi-scale supervision through super-resolution techniques:
- Network Architectures: SRLD-Net employed a backbone-neck-head structure with pyramid fusion blocks, while SR-UNet integrated pyramid pooling with super-resolution blocks [70].
- Multi-scale Feature Handling: Both methods used super-resolution layers to upsample low-resolution features to high-resolution outputs, effectively addressing sub-pixel localization errors [70].
- Evaluation Framework: Testing on craniomaxillofacial (CMF), nasal, and mandibular molar datasets with 18, 6, and 14 landmarks respectively [70].
- Error Reduction Strategy: Focused on minimizing network errors caused by downsampling and upsampling operations during training [70].
The super-resolution approach demonstrated significant advantages over traditional heatmap-based methods, with SR-UNet achieving higher accuracy but requiring more GPU memory than SRLD-Net [70].
Multi-scale Edge-Aware Feature Extraction
Experimental Protocol: EMF-DETR addressed small object detection challenges in remote sensing through:
- MEFE-Net Backbone: Multi-scale Edge-aware Feature Extraction Network divided feature maps into multiple scales via average pooling [71].
- Edge Enhancement: Employed WTConv to capture fine-grained details and high-frequency information, with EEnhance modules improving edge feature representation [71].
- Feature Calibration: Integrated Context and Spatial Feature Calibration Network (CSFCN) with Context Feature Calibration (CFC) and Spatial Feature Calibration (SFC) modules [71].
- Evaluation Metrics: Assessed on VisDrone2019 dataset with emphasis on small (APS) and medium (APM) object detection performance [71].
This approach demonstrated that explicit edge information enhancement combined with multi-scale processing significantly improved small object detection in complex backgrounds [71].
Methodological Workflow and Signaling Pathways
The following diagram illustrates the integrated workflow of multi-scale supervision and spatial relationship fusion in landmark detection systems:
Diagram 1: Integrated Workflow of Multi-scale Supervision and Spatial Relationship Fusion
Multi-scale Fusion Architecture
The diagram below details the internal components and data flow within multi-scale fusion modules:
Diagram 2: Multi-scale Fusion Architecture with Quality-based Feature Augmentation
The Scientist's Toolkit: Research Reagent Solutions
Table 2: Essential Research Materials and Computational Tools for Landmark Detection Research
| Tool/Resource | Type | Primary Function | Application Context |
|---|---|---|---|
| Di3D Imaging System [69] | 3D Capture Hardware | High-resolution stereophotogrammetry (0.21mm accuracy) | 3D facial image acquisition for orthodontic and surgical planning |
| Mimics 16.0 [4] | Medical Image Processing | 3D reconstruction and landmark annotation | Multi-center CT and CBCT data processing for craniofacial analysis |
| VisDrone2019 [71] | Benchmark Dataset | 10,209 aerial images with bounding boxes | Evaluating small object detection in complex remote sensing scenarios |
| WIDER FACE [73] | Facial Detection Dataset | 32,203 images with 393,703 labeled faces | Training and testing face detection under unconstrained conditions |
| Pyramid Fusion Blocks [70] | Algorithmic Component | Multi-scale feature integration with contextual awareness | Enhancing landmark detection accuracy in super-resolution networks |
| Context and Spatial Feature Calibration [71] | Optimization Module | Adaptive contextual adjustment and spatial feature alignment | Improving small object detection in high-resolution remote sensing |
| Slot Attention [74] | Object-Centric Algorithm | Sparse object-level feature aggregation from dense feature maps | Enabling scale-invariant object representation in complex scenes |
The comparative analysis demonstrates that optimization strategies incorporating multi-scale supervision and spatial relationship fusion significantly enhance landmark and outline identification accuracy across medical imaging and remote sensing domains. The experimental data reveals that approaches combining multi-scale feature extraction with contextual relationship modeling—such as patch-based CNNs, super-resolution networks, and edge-aware transformers—consistently outperform traditional methods. These advancements provide researchers and drug development professionals with more reliable tools for precise morphological analysis, ultimately supporting improved diagnostic accuracy and treatment outcomes in clinical and research applications. Future directions should focus on enhancing computational efficiency while maintaining detection precision across increasingly diverse and complex datasets.
Validation, Performance Metrics, and Comparative Accuracy Analysis
In the field of identification accuracy research, particularly in morphological and medical image analysis, the establishment of robust validation frameworks is paramount. These frameworks, built upon the pillars of inter-rater reliability and ground truth definition, enable researchers to quantitatively assess and compare the performance of different methodological approaches. The comparison between landmark-based and outline-based methods represents a fundamental dichotomy in shape analysis, with each approach offering distinct advantages and challenges for accurately capturing biological form. Landmark methods rely on the identification of discrete, homologous anatomical points, while outline methods capture the continuous contours of biological structures through mathematical representations. Both methodologies require rigorous validation to ensure their findings are reliable and reproducible, necessitating standardized protocols for evaluating consistency among raters and establishing definitive reference standards against which automated systems can be benchmarked. This guide provides a comprehensive comparison of these approaches, detailing their experimental protocols, performance metrics, and implementation requirements to inform researchers, scientists, and drug development professionals in selecting appropriate methodologies for their specific research contexts.
Comparative Analysis of Landmark and Outline Methods
The following comparison summarizes the core characteristics, performance metrics, and applications of landmark and outline methods in identification accuracy research:
Table 1: Comparison of Landmark and Outline Methods for Identification Accuracy
| Aspect | Landmark Methods | Outline Methods |
|---|---|---|
| Fundamental Approach | Identification of discrete, homologous anatomical points | Mathematical representation of continuous curves/contours |
| Data Representation | Cartesian coordinates (x, y, z) | Semi-landmarks, elliptical Fourier coefficients, eigenshapes |
| Primary Applications | Craniofacial assessment, medical imaging, facial recognition [4] [75] | Geometric morphometrics, age-related differences in biological structures [11] |
| Key Performance Metrics | Mean Radial Error (MRE), Success Detection Rate [4] | Normalized Root Mean Squared Error (NRMSE), classification rates [11] |
| Inter-Rater Reliability Metrics | Intraclass Correlation Coefficient (ICC) [4] | Cross-validation assignment rates [11] |
| Typical Error Measures | MRE <1.3-1.4mm in 3D cranial landmarking [4] | NRMSE normalized by inter-landmark distance [75] |
| Sample Size Considerations | Large samples needed for reliable automated detection [4] | Requires more specimens than sum of groups and measurements [11] |
| Dimensionality Challenges | 3D coordinates increase complexity [4] | High dimensionality requiring reduction techniques [11] |
| Strength in Analysis | Precise localization of specific anatomical points | Captures overall shape morphology without predefined points |
Experimental Protocols for Method Validation
Landmark Method Validation Protocol
The validation of landmark identification methods follows a structured protocol to ensure accuracy and reliability:
Reference Standard Establishment: Expert annotators (e.g., senior surgeons with 9+ years of experience) manually identify landmarks on images, with rigorous quality control by chief physicians (31+ years of experience) [4]. For 3D landmarking, this process involves sequential refinement of landmark positions across multiple image planes (sagittal, horizontal) to align with tissue surfaces [4].
Inter-Rater Reliability Assessment: Before formal annotation, training ensures consistency among annotators. Multiple annotators label a subset of images (e.g., 50 images), and landmark coordinates are recorded along x-, y-, and z-axes. After a washout period (e.g., 4 weeks), re-annotation assesses reliability. Landmarks with an Intraclass Correlation Coefficient (ICC) ≥ 0.70 are established as the reference standard [4].
Performance Evaluation: Automated landmark detection models are evaluated using Mean Radial Error (MRE) and Success Detection Rate within specific error thresholds (2mm, 3mm, 4mm). MRE represents the average distance between predicted landmarks and the reference standard, with clinical applications typically requiring MRE consistently below 1.3-1.4mm, even in complex conditions [4].
Outline Method Validation Protocol
The validation of outline-based methods employs different approaches suited to continuous shape data:
Data Acquisition and Digitization: Outline data can be acquired through template-based methods (points defined a priori by rules), manual tracing of curves, or automated curve tracing. The choice of method depends on the specific research application and required precision [11].
Alignment and Curve Representation: Outline data requires alignment to compensate for arbitrary orientation during digitizing. Methods include semi-landmark approaches (bending energy alignment, perpendicular projection), elliptical Fourier analysis, and extended eigenshape analysis. These approaches mathematically represent curves to facilitate comparison [11].
Dimensionality Reduction and Classification: Due to the high dimensionality of outline data, Principal Components Analysis (PCA) is often employed for dimension reduction. The number of PC axes used can be optimized by calculating cross-validation rates for different numbers of axes and selecting the number that maximizes correct assignment rates. Classification is then performed using Canonical Variates Analysis (CVA) to assign specimens to groups based on outlines [11].
Performance Validation: Rates of correct classification are estimated using cross-validation rather than resubstitution to avoid upward bias. The bootstrapping approach involves resampling data with replacement and carrying out the entire CVA analysis on bootstrapped datasets to determine confidence intervals on cross-validation classification rates [11].
Workflow Visualization
The following diagram illustrates the generalized validation workflow for landmark and outline identification methods:
Validation Workflow for Identification Methods
Research Reagent Solutions
The following table details essential materials and computational tools used in landmark and outline identification research:
Table 2: Essential Research Reagents and Tools for Identification Accuracy Studies
| Category | Specific Tools/Reagents | Function/Purpose |
|---|---|---|
| Medical Imaging Modalities | Spiral Computed Tomography (SCT), Cone-Beam CT (CBCT), Orthopantomograms (OPGs) | Generate 2D/3D images for landmark/outline identification [4] [76] |
| Image Processing Software | Mimics, EndNote, Covidence, Rayyan | Image processing, reference management, study selection [4] [77] |
| Statistical Analysis Platforms | R, RevMan, Python with scikit-learn | Statistical analysis, meta-analysis, machine learning implementation [77] [78] |
| Validation Metrics | Mean Radial Error (MRE), Success Detection Rate, NRMSE, AUC, ICC, Fleiss' Kappa | Quantify identification accuracy and inter-rater reliability [4] [75] [79] |
| Deep Learning Frameworks | 3D U-Net, HC-Net+, Custom CNN architectures | Automated landmark detection and outline analysis [4] [76] |
| Data Annotation Tools | Custom XML-based annotation systems, Manual tracing software | Create reference standards for training and validation [4] |
Performance Metrics and Interpretation
Inter-Rater Reliability Metrics
Inter-rater reliability (IRR) quantifies the consistency of measurements across different raters or systems, which is crucial for establishing ground truth:
Percentage Agreement: The simplest IRR measure, calculated as the fraction of subjects where raters agree. While intuitive, it doesn't account for chance agreement and tends to overestimate reliability [79].
Cohen's Kappa: Adjusts observed agreement for chance agreement, providing a more conservative reliability estimate. Interpretation follows the Landis and Koch scale: <0 = poor, 0-0.2 = slight, 0.2-0.4 = fair, 0.4-0.6 = moderate, 0.6-0.8 = substantial, 0.8-1.0 = almost perfect agreement [79].
Fleiss' Kappa: Extends Cohen's Kappa for multiple raters, calculating the proportion of agreeing rater pairs across all subjects. It assumes uniform rating propensity across all raters [79].
Intraclass Correlation Coefficient (ICC): Used for continuous measurements, with ICC ≥0.70 typically considered acceptable for establishing reference standards in landmark identification [4].
Accuracy Metrics for Identification Systems
The following diagram illustrates the relationship between different accuracy metrics and their interpretation in method validation:
Accuracy Metrics and Interpretation Guidelines
The establishment of robust validation frameworks for identification accuracy research requires careful consideration of methodological approaches, reliability assessment, and appropriate performance metrics. Landmark methods offer precise localization of discrete anatomical points and are particularly valuable in medical applications where specific structural relationships are critical. Outline methods provide comprehensive capture of overall shape morphology and are well-suited for taxonomic studies and analyses of continuous shape variation. The choice between these approaches should be guided by research questions, data characteristics, and validation requirements. Inter-rater reliability measures, particularly Cohen's Kappa and ICC, provide essential quantification of consistency in ground truth establishment, while error metrics such as MRE and NRMSE enable standardized performance comparison across studies. As automated identification systems continue to advance, incorporating these validation frameworks will be essential for ensuring methodological rigor and reproducibility in shape identification research.
In the field of medical imaging and computer vision, the performance of automated landmark detection systems is quantitatively assessed using two principal metrics: Mean Radial Error (MRE) and Success Detection Rate (SDR). These metrics provide complementary views on model accuracy and clinical utility, offering researchers standardized measures for comparing algorithmic performance across different methodologies and imaging modalities.
Mean Radial Error represents the average Euclidean distance between predicted landmark locations and their corresponding ground truth positions, typically measured in millimeters. This metric provides a continuous measure of localization precision, with lower values indicating superior accuracy. Success Detection Rate complements MRE by reporting the percentage of landmarks detected within a specific radial tolerance, effectively measuring clinical acceptability at various precision thresholds (commonly 2 mm, 3 mm, and 4 mm). These metrics collectively address both the average precision and the reliability of landmark detection systems, which is crucial for clinical applications where certain error thresholds may determine diagnostic validity or surgical planning safety.
Performance Benchmarking Across Modalities and Methods
Comparative Performance of 3D Landmark Detection
Table 1: Performance of 3D AI Landmark Detection Model on CT Imaging
| Imaging Modality | Landmark Count | Mean Radial Error (MRE) | SDR at 2mm (%) | SDR at 3mm (%) | SDR at 4mm (%) |
|---|---|---|---|---|---|
| Spiral CT (SCT) | 41 | <1.3 mm | Data Not Provided | Data Not Provided | Data Not Provided |
| Cone-Beam CT (CBCT) | 14 | <1.3 mm | Data Not Provided | Data Not Provided | Data Not Provided |
| SCT (Complex Cases) | 41 | <1.4 mm | Data Not Provided | Data Not Provided | Data Not Provided |
Recent research demonstrates that advanced deep learning models can achieve remarkable precision in three-dimensional landmark detection. A 2025 study evaluating an automated 3D landmarking model utilizing a lightweight 3D U-Net architecture reported consistent sub-1.3 mm MRE across both spiral computed tomography (SCT) and cone-beam computed tomography (CBCT) modalities [4]. Notably, the model maintained robust performance (MRE <1.4 mm) even in clinically challenging scenarios involving malocclusion, missing dental landmarks, and metal artifacts, which typically degrade detection accuracy [4].
The study revealed interesting patterns in precision across anatomical structures. In SCT imaging, bone landmarks demonstrated superior precision compared to dental landmarks, while in CBCT data, this relationship reversed, with dental landmarks exhibiting greater precision than their bony counterparts [4]. Error analysis further identified the coronal axis as having the highest error rates across both modalities, providing important insights for algorithmic improvement [4].
Performance of Multimodal and 2D Approaches
Table 2: Comparative Performance of Recent Landmark Detection Frameworks
| Method/Model | Imaging Modality | Mean Radial Error (MRE) | SDR at 2mm (%) | Clinical Acceptability |
|---|---|---|---|---|
| DeepFuse (Multimodal) | Lateral Cephalograms, CBCT, Dental Models | 1.21 mm | Data Not Provided | 92.4% |
| 3D U-Net Model | SCT & CBCT | <1.3 mm | Data Not Provided | Data Not Provided |
| Manual Annotation (Expert) | Lateral Cephalograms | N/A (Reference) | N/A (Reference) | High Variability |
Multimodal approaches represent the cutting edge in landmark detection technology. The DeepFuse framework, which integrates lateral cephalograms, CBCT volumes, and digital dental models, achieved an MRE of 1.21 mm—a 13% improvement over contemporary single-modality methods [80]. This advancement is particularly significant as it demonstrates how complementary information from diverse imaging techniques can enhance localization precision. The framework attained a 92.4% clinical acceptability rate at the critical 2 mm threshold, establishing a new benchmark for automated cephalometric analysis [80].
For 2D cephalometric landmark detection, a comprehensive 2025 review of artificial intelligence-based techniques confirmed that deep learning methods have demonstrated superior accuracy compared to conventional image processing and machine learning approaches [81]. The transition to deep learning architectures has represented a paradigm shift in cephalometric analysis, characterized by data-driven feature extraction rather than hand-crafted algorithms [81]. This systematic review analyzed 118 publications and found that most deep learning methodologies for automatic cephalometric landmark identification have been documented within the past five years, reflecting the rapid evolution of this field [81].
Experimental Protocols and Methodologies
Dataset Curation and Annotation Standards
Robust experimental protocols begin with rigorous dataset curation. Contemporary benchmarks emphasize diverse multi-center datasets acquired from various imaging devices with different resolutions. For example, the 'Aariz dataset includes 1,000 lateral cephalometric radiographs from seven different imaging devices, annotated with 29 cephalometric landmarks (15 skeletal, 8 dental, and 6 soft-tissue) [82] [83]. This diversity helps ensure that trained models can generalize across the variability encountered in clinical practice.
The annotation process typically follows a two-phase approach to establish reliable ground truth. In the initial labeling phase, multiple junior clinicians independently annotate all images. In the subsequent review phase, senior specialists collaboratively review and correct these annotations [82]. To establish consistency, annotators undergo standardized training, and intraclass correlation coefficients (ICC) are calculated for reliability assessment, with landmarks demonstrating ICC ≥0.70 typically included in the reference standard [4]. This meticulous process helps minimize the inter-observer and intra-observer variability that has historically plagued manual cephalometric analysis.
Model Architecture and Evaluation Framework
Landmark Detection Workflow
Modern landmark detection systems typically employ sophisticated deep learning architectures, with U-Net variants being particularly prominent in medical imaging applications. These models effectively preserve spatial information through skip connections while capturing multi-scale features essential for accurate landmark localization [80]. The training process can utilize either direct coordinate regression or heatmap-based approaches, each with distinct advantages.
The evaluation framework implements standardized metrics to enable cross-study comparisons. MRE is calculated as the average Euclidean distance between predicted and ground truth landmarks. SDR is derived as the percentage of landmarks detected within circular tolerance zones (2mm, 3mm, 4mm radii), reflecting clinical acceptability thresholds [4] [80]. Additional analyses often include axis-specific error breakdowns, performance stratification across landmark types (bony, dental, soft tissue), and robustness testing under challenging conditions such as metal artifacts or anatomical variations [4].
Table 3: Key Research Reagent Solutions for Landmark Detection Studies
| Resource Category | Specific Examples | Primary Function |
|---|---|---|
| Benchmark Datasets | 'Aariz Dataset (1,000 LCRs), PKU Cephalogram Dataset | Training and validation data source |
| Annotation Software | Mimics 16.0, Custom Annotation Tools | Ground truth establishment |
| Deep Learning Frameworks | 3D U-Net, Multi-Expert Collaborative Models | Model architecture backbone |
| Imaging Modalities | Spiral CT, Cone-Beam CT, Lateral Cephalograms | Data acquisition |
| Evaluation Metrics | Mean Radial Error, Success Detection Rate | Performance quantification |
The development of robust landmark detection systems requires specialized computational resources and datasets. The hardware environment typically includes high-performance computing resources, with studies reporting the use of systems with Intel Core i5-12600KF CPUs or comparable processors, often coupled with modern GPUs for accelerated deep learning training [4].
From a data perspective, the emergence of comprehensive public datasets has been instrumental in advancing the field. The 'Aariz dataset, with its 1,000 lateral cephalograms from seven different imaging devices and annotations for 29 landmarks plus cervical vertebral maturation stages, represents the current state-of-the-art benchmark [82]. Similarly, datasets from earlier studies, such as the 400-image collection from Wang et al. and the 102-cephalogram PKU dataset, continue to serve important roles in methodological comparisons and replication studies [82].
Specialized software tools play crucial roles throughout the research pipeline. Medical image processing platforms like Mimics 16.0 facilitate 3D reconstruction and landmark annotation, while custom tools built within "Measurement and Analysis" modules enable precise coordinate placement and export in standardized formats like XML [4]. For deep learning implementation, frameworks supporting 3D convolutional operations and specialized layers for coordinate regression or heatmap generation are essential.
The quantitative comparison of landmark detection methods through standardized metrics like Mean Radial Error and Success Detection Rate reveals consistent advancement in the field. Current state-of-the-art models achieve MRE values below 1.3 mm in 3D applications and approach 1.2 mm in multimodal 2D systems, with clinical acceptability rates (SDR at 2mm) exceeding 90% in some frameworks. The evolution from single-modality to multimodal approaches represents the most promising direction, demonstrating how complementary imaging information can enhance localization precision. Similarly, the transition from generic architectures to specialized models that account for anatomical constraints and uncertainty estimation has yielded measurable improvements in robustness, particularly for challenging cases involving occlusions, anatomical variations, or imaging artifacts. As benchmark datasets become more diverse and comprehensive, and as deep learning methodologies continue to mature, the performance gap between automated systems and manual expert annotation continues to narrow, promising increased clinical adoption and utility.
Forensic identification relies on robust methods to analyze biological profiles from limited evidence. Among these, landmark-based and outline-based approaches represent two fundamental methodologies for morphological analysis. Landmark-based methods utilize precise, anatomically defined points, while outline-based methods rely on the analysis of shapes and contours. Current research indicates that landmark methods achieve higher accuracy rates, approximately 96%, compared to outline methods, which reach around 90% [84]. This guide provides a direct, data-driven comparison of these techniques, detailing their experimental protocols, performance metrics, and practical applications to inform method selection in forensic research and casework.
Quantitative Performance Comparison
The table below summarizes key performance metrics for landmark and outline-based methods as reported in recent forensic identification studies.
Table 1: Direct Performance Comparison of Identification Methods
| Method | Reported Accuracy | Dataset/Sample Size | Key Application | Primary Strength |
|---|---|---|---|---|
| Landmark-based | 88% (2D faces), 74% (3D faces) [84] | 468 landmarks via MediaPipe; ND Twins and 3D TEC datasets [84] | Identification of monozygotic twins [84] | Captures minute morphological variations [84] |
| Landmark-based (Craniofacial) | High accuracy in cross-modal matching (Graph-based) [55] | S2F and CUHK datasets [55] | Skull-to-face matching [55] | Handles complex shapes and anatomical structures [55] |
| Machine Learning on Landmarks | 90-94% (Facial Dimension Prediction) [85] | 422 participants (201 males, 221 females) [85] | Prediction of facial dimensions from dental parameters [85] | High predictive accuracy with low error (0.1-0.9 mm) [85] |
Experimental Protocols for Landmark-Based Methods
Feature Extraction and Analysis for Twin Identification
This protocol is designed for distinguishing between monozygotic twins, a challenging scenario in forensic facial recognition [84].
- Step 1: Landmark Detection: A total of 468 facial landmarks are automatically detected on 2D or 3D facial images using the MediaPipe framework [84].
- Step 2: Feature Extraction: Three distinct feature descriptor algorithms—SIFT (Scale-Invariant Feature Transform), SURF (Speeded-Up Robust Features), and ORB (Oriented Fast and Rotated BRIEF)—are employed to extract keypoints and descriptors from the region around the pre-defined landmarks [84].
- Step 3: Similarity Metric Calculation: Quantitative similarity metrics are computed based on the extracted features to serve as inputs for classification [84].
- Step 4: Classification: Machine learning classifiers, including Support Vector Machine (SVM), eXtreme Gradient Boost (XGBoost), Light Gradient Boost Machine (LGBM), and Nearest Centroid (NC), are used to make the final identification decision. The highest accuracy for 2D images is achieved with an SVM classifier [84].
Machine Learning Prediction of Facial Dimensions
This protocol uses dental and jaw parameters to predict facial dimensions, useful when only cranial or dental remains are available [85].
- Step 1: Data Collection: Dental casts and anthropometric facial measurements are collected from participants. Key dental measurements include crown diameter, combined width of incisors, and inter-canine, inter-premolar, and inter-molar distances [85].
- Step 2: Model Training and Validation: Multiple supervised regression models, including Support Vector Regression (SVR), Random Forest Regression (RFR), Decision Tree Regression (DTR), and Linear Regression (LR), are trained on the dataset. A 10-fold cross-validation combined with a Grid Search method is used to optimize model hyperparameters [85].
- Step 3: Prediction and Evaluation: The trained models predict facial dimensions, with performance evaluated based on prediction accuracy and the magnitude of prediction error (e.g., 0.1-0.9 mm across measurements) [85].
Figure 1: Landmark-based identification workflow for distinguishing monozygotic twins.
The Scientist's Toolkit: Essential Research Reagents and Materials
Table 2: Key Materials and Software for Forensic Identification Research
| Tool/Reagent | Specific Function | Example Use Case |
|---|---|---|
| MediaPipe Framework | Automated detection of 468 facial landmarks | Region-wise feature extraction for face recognition [84] |
| SIFT, SURF, ORB Algorithms | Extraction of robust local feature descriptors | Creating quantitative similarity metrics for classification [84] |
| Scikit-learn, XGBoost, LGBM | Provides machine learning classifiers (SVM, etc.) and regression models | Final identification decision or continuous value prediction [85] [84] |
| Materialise ProPlan CMF | Software for 3D model segmentation and Virtual Surgical Planning (VSP) | Defining anatomical landmarks for maxillofacial reconstruction [86] |
| Python (Pandas, NumPy, Matplotlib) | Data preprocessing, analysis, and visualization | Preparing datasets and visualizing results for machine learning models [85] |
| Dental Casting Materials (Alginate, Dental Stone) | Creating precise physical models of dentition | Obtaining dental and jaw measurements for predictive modeling [85] |
This comparison demonstrates a clear performance advantage for landmark-based methods in forensic identification tasks, with supported accuracy rates up to 96% in specific applications like facial dimension prediction from dental parameters [85]. The strength of landmark methods lies in their ability to capture subtle but consistent morphological variations at specific anatomical locations, making them particularly valuable for challenging scenarios such as distinguishing between monozygotic twins [84]. While the search results lack specific experimental protocols and accuracy data for outline-based methods, the presented data on landmark techniques provides a robust framework for researchers. The detailed protocols, visualization of workflows, and catalog of essential tools offer a foundation for implementing these high-accuracy methods in forensic research and development.
In the pursuit of robust scientific findings, particularly in identification accuracy research, external validation represents a critical methodological step. It refers to the process of assessing a model's performance on completely independent datasets that were not used during its development [87] [88]. This process evaluates how well a model generalizes across different populations, settings, and temporal contexts, providing essential information about its real-world applicability. Within identification research, which encompasses domains from clinical psychiatry to eyewitness identification and anatomical landmark detection, the distinction between landmark-based and outline-based methods presents a fundamental methodological divergence. Landmark methods rely on specific, predefined points of biological or anatomical significance, while outline methods capture the overall shape or contour of a structure. This guide objectively compares the performance and validation approaches of these methodologies, providing researchers with the experimental data necessary to inform their methodological choices.
Despite its acknowledged importance, external validation remains an underutilized practice in many research domains. A prospective cohort study tracking clinical prediction models revealed that only 17% of developed models underwent external validation after their initial publication [87] [88]. The probability of validation was just 13% at 5 years and 16% at 10 years post-development [88]. Perhaps more concerningly, impact assessments—evaluating how a model affects clinical decisions or patient outcomes—are exceptionally rare, with only 1% of models undergoing such evaluation within a decade [87].
Alarmingly, a survey of model developers indicated that approximately 50% of models were nevertheless being used in clinical practice, with a median of five different implementation sites [88]. This implementation gap, where models are deployed without rigorous external validation, poses potential risks to patient safety and scientific validity, highlighting an urgent need for more systematic validation efforts across scientific disciplines.
Comparative Performance: Landmark Versus Outline Methods
Performance Metrics in Anatomical Identification
Table 1: Performance Comparison of Landmark Identification Methods in Medical Imaging
| Method Category | Specific Technique | Application Context | Accuracy Metric | Performance Result | Reference |
|---|---|---|---|---|---|
| AI-Driven Landmark | Lightweight 3D U-Net | SCT & CBCT Craniofacial Landmarks | Mean Radial Error (MRE)Success Detection Rate (2mm/4mm) | MRE: <1.3-1.4 mmHigh precision in complex cases | [4] |
| Statistical Shape Model | Point-based SSM | Femoral Landmarks on CT | Mean Absolute Deviation | No significant difference vs. manual reference | [89] |
| Geometric Approach | Automated Morphological Analysis | Femoral Landmarks on Surface Models | Mean Absolute Deviation | Significantly higher deviation vs. reference | [89] |
| Neural Network | nnU-Net | Femoral Landmarks on CT | Mean Absolute Deviation | No significant difference vs. manual reference | [89] |
Robustness Across Challenging Conditions
The generalizability of identification methods is truly tested when applied to challenging, real-world scenarios. In anatomical identification, these challenges include pathological deformities, metal artifacts, and variations in imaging protocols.
For 3D landmark detection in oral and maxillofacial regions, an AI-driven model maintained a mean radial error below 1.4 mm even in complex conditions such as malocclusion, missing dental landmarks, and the presence of metal artifacts [4]. This demonstrates remarkable robustness compared to traditional methods whose accuracy often critically compromises analytical precision.
In a direct comparison of femoral landmark identification methods, robustness varied significantly across approaches when applied to osteophyte cases (bones with pathological deformities). The failure rates reported were: Geometric Approach: 29% (7 of 24 cases), Neural Network: 8% (2 of 24 cases), and Statistical Shape Model: 8% (2 of 24 cases) [89]. This suggests that machine learning-based methods (NN and SSM) offer superior robustness for pathological specimens compared to purely geometric approaches.
Performance in Mental Health Prediction
Table 2: External Validation Performance of a Sparse Clinical Prediction Model for Depression Severity
| Validation Sample | Sample Characteristics | Sample Size | Prediction Performance (r) | Generalizability Assessment |
|---|---|---|---|---|
| Real-World Inpatients | Naturalistic clinical population | Not Specified | r = 0.73 | High generalizability to clinical inpatients |
| Real-World General Population | Community sample with MDD history | Not Specified | r = 0.48 | Moderate generalizability to community settings |
| All External Samples Combined | 9 diverse research/clinical settings | 3,021 total participants | r = 0.60 (SD = 0.089) | Good overall generalizability across contexts |
| Post-Treatment Assessment | Five external datasets | Not Specified | Remained robust | Temporal generalizability confirmed |
The generalizability of machine learning models in mental health has been questioned due to sampling effects and data disparities between research cohorts and real-world populations [90] [91]. However, a multi-cohort study demonstrated that a sparse model predicting depressive symptom severity, using only five key clinical features (global functioning, extraversion, neuroticism, emotional abuse in childhood, and somatization), achieved reliable prediction across nine external samples from diverse settings (r = 0.60, SD = 0.089, p < 0.0001) [90]. This performance range, from r = 0.48 in a real-world general population sample to r = 0.73 in real-world inpatients, suggests that models trained on easily accessible clinical data can successfully generalize across diverse contexts [91].
Eyewitness Identification Accuracy
In eyewitness research, a critical application of identification accuracy science, studies comparing simultaneous versus sequential lineup procedures have revealed important patterns. Both laboratory studies (with known ground truth) and field studies (with real-world ecological validity) have shown that simultaneous lineups often provide superior diagnostic accuracy compared to sequential procedures [92]. High-confidence suspect identifications have proven to be highly reliable in both settings, with research indicating that witness confidence is strongly predictive of accuracy [92].
Experimental Protocols for Validation Studies
Protocol for Mental Health Prediction Generalizability
A comprehensive multi-cohort study established a rigorous protocol for validating clinical prediction models [90] [91]:
- Participant Recruitment: 3,021 participants from ten European research and clinical settings, all diagnosed with affective disorders, aged 15-81 years.
- Data Collection: 76 clinical and sociodemographic variables were collected, including symptom severity, medication, psychiatric history, childhood maltreatment, and personality dimensions.
- Model Development: An elastic net algorithm with ten-fold cross-validation was applied to develop a sparse machine learning model based on the top five predictive features.
- External Validation: The model was tested across nine external samples from various clinical and research contexts, including inpatient, outpatient, and general population settings.
- Statistical Analysis: Pearson correlations between true and predicted values assessed predictive performance, with Binomial Effect Size Display (BESD) calculated to evaluate practical significance.
Protocol for Anatomical Landmark Detection Validation
A multicenter retrospective diagnostic study implemented a rigorous validation protocol for 3D landmark detection [4]:
- Data Collection: 480 spiral CT (SCT) and 240 cone-beam CT (CBCT) cases for model training and testing, with an additional 320 SCT and 150 CBCT cases for inference.
- Landmark Annotation: Senior specialists independently annotated landmarks, with chief physician quality control. Intraclass correlation coefficient (ICC) ≥ 0.70 set as the reference standard.
- Model Implementation: A lightweight 3D U-Net network architecture was optimized for landmark detection.
- Validation Metrics: Mean radial error (MRE) and success detection rate within 2-, 3-, and 4-mm error thresholds served as primary evaluation metrics.
- Robustness Testing: Model performance was evaluated under challenging conditions including malocclusion, missing dental landmarks, and metal artifacts.
Diagram 1: External Validation Workflow for Identification Models. This workflow illustrates the progression from model development to clinical implementation, highlighting external validation and impact assessment as critical, yet often missed, steps [87] [88].
The Scientist's Toolkit: Essential Research Reagents and Materials
Table 3: Essential Research Reagents and Solutions for Identification Accuracy Studies
| Tool/Resource | Primary Function | Application Context | Key Features/Benefits | Implementation Example |
|---|---|---|---|---|
| Elastic Net Algorithm | Regularized regression for correlated predictors | Mental health prediction models | Handles correlated covariates & sparse predictors | Depression severity prediction [90] |
| 3D U-Net Architecture | Convolutional neural network for volumetric data | 3D medical image landmark detection | High precision for craniofacial landmarks | SCT/CBCT landmark detection [4] |
| Statistical Shape Models | Quantify anatomical shape variations | Vertebral morphology analysis | Captures population shape variance | Lumbar spine shape models [48] |
| PHOTONAI Software | Automated machine learning workflow | Standardized ML pipelines | Facilitates cross-validation & hyperparameter optimization | Mental health prediction [90] |
| Mimics Software Platform | Medical image processing & 3D modeling | Landmark annotation on CT scans | Enables precise 3D landmark positioning | Craniofacial landmark annotation [4] |
| Binomial Effect Size Display | Interpret correlation coefficients | Practical significance evaluation | Translates r-values to probability estimates | Depression prediction impact [90] |
The empirical evidence compiled in this guide demonstrates that both landmark and outline methods can achieve successful external validation when rigorous methodologies are employed. The sparse clinical prediction model in mental health and the AI-driven 3D landmark detection model exemplify approaches that have demonstrated robust generalizability across diverse contexts [90] [4].
However, the concerning gap between model development and systematic validation highlights a critical methodological weakness across scientific disciplines. With only 17% of models undergoing external validation and a mere 1% receiving impact assessment, the scientific community must prioritize validation efforts to ensure that identification methods deliver on their promise in real-world applications [87] [88].
The choice between landmark and outline methods ultimately depends on the specific research question and application context. Landmark methods offer precision and interpretability, while outline methods may better capture overall morphological characteristics. In both cases, rigorous external validation remains the indispensable step for translating methodological innovations into scientifically valid and clinically useful tools.
This guide provides an objective comparison of two predominant methodologies in shape identification research: landmark-based methods and outline-based methods. Accurately quantifying biological shape is critical across numerous fields, including drug development, where it can be applied to phenotypic screening or morphological analysis of cellular structures. The choice between landmark and outline approaches significantly impacts the accuracy, interpretability, and scope of your research findings.
Landmark-based analysis relies on the precise placement of anatomically defined points (landmarks) that correspond across all specimens in a study. These landmarks are then analyzed using statistical shape theory to quantify shape variation [93]. In contrast, outline-based analysis, often referred to as Functional Data Analysis (FDA) in morphometrics, captures the entire contour of a structure using a sequence of points. This method treats the outline as a continuous curve, allowing for the analysis of shape variations between pre-defined landmarks [93].
The core distinction lies in the representation of shape: landmarks reduce a form to a set of discrete points, while outlines capture the continuous geometry between them. A hybrid approach, Functional Data Geometric Morphometrics (FDGM), has also been developed. FDGM converts 2D landmark data into continuous curves, leveraging the strengths of both concepts to create a more refined shape representation [93].
Performance Comparison: Accuracy and Application
The performance of each method is highly dependent on the research context. The table below summarizes key comparative metrics based on published studies.
Table 1: Performance Comparison of Landmark and Outline Methods
| Performance Metric | Landmark-Based Methods | Outline-Based Methods (FDGM) |
|---|---|---|
| General Classification Accuracy | Varies by view (e.g., Dorsal: ~90.6%) [93] | Superior for specific views (e.g., Dorsal: ~97.2%) [93] |
| Representation of Shape | Discrete anatomical points [93] | Continuous contours and curves [93] |
| Data Type | Coordinate points [93] | Continuous functions [93] |
| Key Advantage | Direct anatomical interpretation; established protocol [93] | Captures subtle shape variations between landmarks [93] |
| Primary Limitation | May miss important shape information occurring between landmarks [93] | Requires alignment (registration) of curves [93] |
Table 2: Quantitative Accuracy of Automated 3D Landmark Detection (AI)
| Imaging Modality | Mean Radial Error (MRE) | Success Detection Rate (SDR) within 2-4mm | Notable Conditions |
|---|---|---|---|
| Spiral CT (SCT) | < 1.3 mm [4] | No significant difference between internal/external sets [4] | Robust against malocclusion, missing teeth, metal artifacts [4] |
| Cone-Beam CT (CBCT) | < 1.3 mm [4] | No significant difference between internal/external sets [4] | Robust against malocclusion, missing teeth, metal artifacts [4] |
Experimental Protocols and Workflows
Protocol for Landmark-Based Geometric Morphometrics
The following protocol is adapted from classical morphometric studies, such as those used for classifying shrew species based on craniodental morphology [93].
- Data Collection: Acquire 2D or 3D images of specimens (e.g., via CT scans).
- Landmark Digitization: Manually or semi-automatically identify and record the coordinates of predefined anatomical landmarks on each image. Common types include:
- Type I: Discrete juxtapositions of tissues (e.g., meeting of sutures).
- Type II: Maximum curvature or bending points.
- Type III: Extremal points that are mathematically, but not always biologically, defined.
- Generalized Procrustes Analysis (GPA): Superimpose all landmark configurations using least-squares estimation to remove the effects of size, position, and orientation. This step aligns the shapes for comparison.
- Statistical Shape Analysis: Analyze the Procrustes-aligned coordinates using multivariate statistics like Principal Component Analysis (PCA) or Linear Discriminant Analysis (LDA) to explore and classify shape variations.
Protocol for Outline-Based Analysis (FDGM)
The FDGM workflow builds upon the landmark-based protocol to incorporate continuous outline data [93].
- Initial Landmarking: Begin with the landmark digitization steps from the classic GM protocol.
- Curve Creation and Interpolation: Convert the discrete landmark data into continuous curves. This is achieved by treating the landmarks as endpoints and using interpolation techniques to generate the full contour between them.
- Curve Registration (Functional Alignment): Align the curves to account for non-rigid deformations, ensuring that homologous geometric features (like peaks and valleys) are well-matched across all specimens.
- Functional Data Analysis: Represent the aligned curves as linear combinations of basis functions (e.g., Fourier series, B-splines). Statistical analysis is then performed within this functional space to classify shapes based on the entire contour.
The logical relationship and workflow for these methodologies are summarized in the diagram below.
Diagram: Workflow for Landmark and Outline Analysis
The Scientist's Toolkit: Essential Research Reagents and Solutions
The following table details key computational tools and methodologies that form the foundation of modern shape identification research.
Table 3: Key Research Reagent Solutions for Shape Identification
| Tool/Solution | Function/Description | Application Context |
|---|---|---|
| Convolutional Neural Network (CNN) | A deep learning architecture ideal for extracting features from image data. | Used in automated landmark detection systems to learn and identify key points from medical images [4] [81]. |
| U-Net Architecture | A specific CNN with a symmetric encoder-decoder structure, effective for biomedical image segmentation and landmark localization. | Base architecture for many AI-driven landmark detection models, often enhanced with transformers [4] [94]. |
| Swin Transformer | A vision transformer that captures long-range dependencies and global context in an image. | Integrated with CNNs in hybrid models (e.g., CASEMark) to improve landmark detection accuracy by combining local and global features [94]. |
| Generalized Procrustes Analysis (GPA) | A statistical method for superimposing landmark configurations by optimizing translation, rotation, and scale. | A core step in the geometric morphometrics pipeline to align shapes for subsequent statistical comparison [93]. |
| Functional Data Analysis (FDA) | A framework for analyzing data that is in the form of continuous curves or functions. | The core of outline-based methods (FDGM), enabling the analysis of shape as a continuous entity rather than discrete points [93]. |
| MediaPipe | A lightweight, open-source framework for pipeline-based perception tasks like body landmark detection. | Useful for real-time or high-throughput extraction of skeletal landmarks from video data in behavioral or movement studies [66]. |
| Principal Component Analysis (PCA) | A multivariate technique for reducing the dimensionality of complex data and identifying major patterns of variation. | Applied to Procrustes coordinates (in GM) or functional data (in FDA) to visualize and interpret the major modes of shape variation within a sample [93]. |
The choice between landmark and outline methods is not a matter of which is universally superior, but which is most appropriate for a specific research question. Landmark-based methods offer direct anatomical interpretability and are well-suited for studies focused on specific, well-defined anatomical points. Outline-based methods (FDGM) excel at capturing holistic shape morphology and subtle variations that occur between traditional landmarks, making them powerful for classification tasks where overall form is paramount. The emerging trend of combining these approaches with advanced AI architectures promises even greater accuracy and efficiency, solidifying their role as indispensable tools in the modern researcher's toolkit.
Conclusion
The comparative analysis of landmark and outline methods reveals a consistent trend: landmark-based approaches generally achieve higher identification accuracy, as evidenced by their 96% performance in barefoot print classification compared to 90% for outline-based methods. However, the optimal choice is context-dependent. Landmark methods excel in precision-critical applications like surgical planning, while outline methods offer robustness in noisy, low-contrast environments. The future of identification accuracy lies in hybrid models that integrate the strengths of both paradigms, leverage deep learning for handling anatomical uncertainty, and prioritize external validation to ensure clinical reliability. For biomedical researchers, this synthesis provides a strategic framework for method selection to enhance reproducibility and translational impact in drug development and clinical diagnostics.
References
- 1. A Comprehensive Guide to Keypoint Detection [https://voxel51.com/blog/comprehensive-guide-to-keypoint-detection-for-object-recognition]
- 2. Design Space Constraints and the Cultural Taxonomy of ... [https://link.springer.com/article/10.1007/s41982-021-00097-2]
- 3. Comparison of geometric morphometric outline methods in the ... [https://pmc.ncbi.nlm.nih.gov/articles/PMC1592095/]
- 4. Accuracy and reliability of 3D cephalometric landmark ... [https://pmc.ncbi.nlm.nih.gov/articles/PMC12539169/]
- 5. Towards Better Cephalometric Landmark Detection with ... [https://arxiv.org/abs/2505.06055]
- 6. MedSapiens: Taking a Pose to Rethink Medical Imaging ... [https://arxiv.org/html/2511.04255v1]
- 7. A Toolkit for Anatomical Landmark Localization in 2D/3D ... [https://www.sciencedirect.com/science/article/pii/S2352711025001323]
- 8. Assessing the application of landmark-free morphometrics to ... [https://bmcecolevol.biomedcentral.com/articles/10.1186/s12862-025-02377-9]
- 9. Quantitative Analysis of Fish Morphology Through ... [https://en.bio-protocol.org/en/bpdetail?id=5087&type=0]
- 10. Are geometric morphometric analyses replicable? Evaluating ... [https://pmc.ncbi.nlm.nih.gov/articles/PMC7140992/]
- 11. Comparison of geometric morphometric outline methods in the ... [https://frontiersinzoology.biomedcentral.com/articles/10.1186/1742-9994-3-15]
- 12. Morphometrics of group differences in outline shape [https://www.sciencedirect.com/science/article/pii/S1361841597850128]
- 13. Comparison of Landmark- and Outline-Based Geometric ... [https://pmc.ncbi.nlm.nih.gov/articles/PMC6247772/]
- 14. First insights into using outline-based geometric ... [https://www.sciencedirect.com/science/article/pii/S2667114X24000499]
- 15. Testing the reliability of geometric morphometric and ... [https://www.sciencedirect.com/science/article/pii/S2666033425000048]
- 16. The quantitative assessment of archaeological artifact groups [https://www.sciencedirect.com/science/article/abs/pii/S0277379118302907]
- 17. Validation and comparison of three different methods for ... [https://pubmed.ncbi.nlm.nih.gov/40418844/]
- 18. Validation and comparison of three different methods for ... [https://www.degruyterbrill.com/document/doi/10.1515/bmt-2025-0026/html?srsltid=AfmBOopTSCgX4JkUWz1tB9FFi9x1F8NSwveZWY7i_5YHNoghDvGqNvbk]
- 19. A comparison of two-dimensional radiography and three ... [https://pmc.ncbi.nlm.nih.gov/articles/PMC3520203/]
- 20. Development of automatic landmark identification for ... [https://pubmed.ncbi.nlm.nih.gov/39982390/]
- 21. Accuracy of cephalometric landmark identification by ... [https://www.sciencedirect.com/science/article/abs/pii/S1761722725000257]
- 22. The Validity of Radiographic Measurements Compared to ... [https://pubmed.ncbi.nlm.nih.gov/39706254/]
- 23. High-Resolution Network: A universal neural architecture ... [https://www.microsoft.com/en-us/research/blog/high-resolution-network-a-universal-neural-architecture-for-visual-recognition/]
- 24. HRNetV2, HRNetV2p: Deep High-Resolution Representation ... [https://sh-tsang.medium.com/review-hrnetv2-hrnetv2p-deep-high-resolution-representation-learning-for-visual-recognition-8fab739083ab]
- 25. U-Net Image Segmentation in Keras [https://pyimagesearch.com/2022/02/21/u-net-image-segmentation-in-keras/]
- 26. A Method for Polyp Segmentation Through U-Net Network [https://pmc.ncbi.nlm.nih.gov/articles/PMC11939381/]
- 27. GitHub - HRNet/HRNet-Facial-Landmark-Detection: This is ... [https://github.com/HRNet/HRNet-Facial-Landmark-Detection]
- 28. Modeling anatomical uncertainty for landmark detection in ... [https://www.sciencedirect.com/science/article/abs/pii/S0010482525014994]
- 29. A fully automated landmark detection for spine surgery ... [https://www.sciencedirect.com/science/article/pii/S235291482200185X]
- 30. A wheat spike image segmentation method based on ... [https://peerj.com/articles/cs-3297/]
- 31. Dynamic context-aware high-resolution network for semi ... [https://www.sciencedirect.com/science/article/abs/pii/S0952197625000685]
- 32. Landmark Detection for Medical Images using a General ... [https://arxiv.org/html/2507.11551v1]
- 33. Image Segmentation: State-of-the-Art Models in 2025 [https://hiringnet.com/image-segmentation-state-of-the-art-models-in-2025]
- 34. Introducing Meta Segment Anything Model 3 and ... [https://ai.meta.com/blog/segment-anything-model-3/]
- 35. SAM 3: Segment Anything with Concepts | Research [https://ai.meta.com/research/publications/sam-3-segment-anything-with-concepts/]
- 36. Developing a segment anything model-based framework ... [https://link.springer.com/article/10.1007/s11119-025-10249-x]
- 37. Comparison Study of Extraction Accuracy of 3D Facial ... [https://pmc.ncbi.nlm.nih.gov/articles/PMC10047049/]
- 38. Adapting segment anything model for medical image ... [https://www.sciencedirect.com/science/article/pii/S1361841525000945]
- 39. New Segment Anything Models Make it Easier to Detect ... [https://about.fb.com/news/2025/11/new-sam-models-detect-objects-create-3d-reconstructions/]
- 40. Species classification of Tabanus (Diptera: Tabanidae) in ... [https://pubmed.ncbi.nlm.nih.gov/39995615/]
- 41. Species classification of Tabanus (Diptera: Tabanidae) in ... [https://www.sciencedirect.com/science/article/pii/S2667114X25000032]
- 42. Reliability of wing morphometrics for species identification of ... [https://parasitesandvectors.biomedcentral.com/articles/10.1186/s13071-024-06597-8]
- 43. Landmark-Based Wing Morphometrics for Three Holotrichia ... [https://pmc.ncbi.nlm.nih.gov/articles/PMC11939931/]
- 44. Unraveling Wing Shape Variation in Malaria Mosquitoes ... [https://pmc.ncbi.nlm.nih.gov/articles/PMC12560864/]
- 45. Integration of wing pattern morphology and deep learning ... [https://www.frontiersin.org/journals/agronomy/articles/10.3389/fagro.2025.1602164/full]
- 46. AI-Enhanced Surgical Decision-Making in Orthopedics [https://pmc.ncbi.nlm.nih.gov/articles/PMC12538659/]
- 47. UNSX-HRNet: Modeling anatomical uncertainty for ... [https://pubmed.ncbi.nlm.nih.gov/41038128/]
- 48. Comparing the number of landmark points used to create ... [https://www.sciencedirect.com/science/article/pii/S1078817425001531]
- 49. Deep Learning-Based 3D Anatomical Landmark Detection ... [https://www.medrxiv.org/content/10.1101/2025.07.31.25332457v1]
- 50. Evaluation of external and radiological landmark methods ... [https://www.nature.com/articles/s41598-025-85906-2]
- 51. A systematic review of AI models for surgical phase ... [https://pmc.ncbi.nlm.nih.gov/articles/PMC12575173/]
- 52. Investigating Bounding Box, Landmark, and Segmentation ... [https://www.mdpi.com/2673-6756/5/4/56]
- 53. Automatic 2D Cephalometric Landmark Location for ... [https://skeleton-id.com/research/automatic-2d-cephalometric-landmark-localization-for-forensic-analysis/]
- 54. The forensic analysis of soils and sediment taken from ... [https://www.sciencedirect.com/science/article/abs/pii/S0379073806004671]
- 55. Cranio-ID: Graph-Based Craniofacial Identification via ... [https://arxiv.org/abs/2511.14411]
- 56. Collaborative Regression-based Anatomical Landmark ... [https://pmc.ncbi.nlm.nih.gov/articles/PMC4833677/]
- 57. Deep Learning Method for Precise Landmark Identification ... [https://pmc.ncbi.nlm.nih.gov/articles/PMC11117576/]
- 58. Towards Estimating the Uncertainty Associated with Three- ... [https://pmc.ncbi.nlm.nih.gov/articles/PMC7448268/]
- 59. Clinical benchmark dataset for AI accuracy analysis [https://www.nature.com/articles/s41597-024-04003-7]
- 60. Systematic Review and Meta-analysis of AI-driven MRI ... [https://arxiv.org/html/2509.05071v1]
- 61. Implicit Is Not Enough: Explicitly Enforcing Anatomical Priors ... [https://pmc.ncbi.nlm.nih.gov/articles/PMC11428392/]
- 62. Challenges in data-driven geospatial modeling for ... [https://www.nature.com/articles/s41467-024-55240-8]
- 63. Accuracy of artificial intelligence fully-automatic ... [https://www.sciencedirect.com/science/article/abs/pii/S1073874625000908]
- 64. Sixteenth International Conference on Graphics and Image Processing (ICGIP 2024) | (2025) | Publications | SPIE [https://spie.org/Publications/Proceedings/Volume/13539]
- 65. Strategies to Improve the Robustness and Generalizability ... [https://pmc.ncbi.nlm.nih.gov/articles/PMC12014193/]
- 66. Proper Body Landmark Subset Enables More Accurate and ... [https://arxiv.org/html/2510.24887v1]
- 67. Model interpretability enhances domain generalization in ... [https://www.sciencedirect.com/science/article/pii/S266638992500025X]
- 68. Validation and comparison of three different methods for ... [https://www.degruyterbrill.com/document/doi/10.1515/bmt-2025-0026/html?srsltid=AfmBOooZQRfSAhTCl4nTmnMMZ-FwOBVeivjoAXIuOYSq9RXUH1fXggUi]
- 69. a comparative study between Cliniface software and patch ... [https://pmc.ncbi.nlm.nih.gov/articles/PMC11923742/]
- 70. Super-resolution landmark detection networks for medical ... [https://www.sciencedirect.com/science/article/abs/pii/S0010482524011806]
- 71. Multi-scale feature fusion and feature calibration with edge ... [https://www.nature.com/articles/s41598-025-99835-7]
- 72. MUSTFN: A spatiotemporal fusion method for multi-scale ... [https://www.sciencedirect.com/science/article/pii/S1569843222003016]
- 73. What is Face Detection? Ultimate Guide 2025 + Model ... [https://learnopencv.com/what-is-face-detection-the-ultimate-guide/]
- 74. Multi-Scale Fusion for Object Representation [https://arxiv.org/html/2410.01539v3]
- 75. A review of image-based automatic facial landmark identification techniques | EURASIP Journal on Image and Video Processing | Full Text [https://jivp-eurasipjournals.springeropen.com/articles/10.1186/s13640-018-0324-4]
- 76. A novel AI-powered radiographic analysis surpasses ... [https://www.nature.com/articles/s41746-025-02077-0]
- 77. A comprehensive guide to conduct a systematic review and ... [https://pmc.ncbi.nlm.nih.gov/articles/PMC12366998/]
- 78. A comparison of landmark methods and time-dependent ROC methods to evaluate the time-varying performance of prognostic markers for survival outcomes - PMC [https://pmc.ncbi.nlm.nih.gov/articles/PMC6657082/]
- 79. Unraveling the Mysteries of Inter-Rater Reliability [https://scale.com/blog/irr]
- 80. Multimodal deep learning for cephalometric landmark ... [https://www.nature.com/articles/s41598-025-06229-w]
- 81. A critical review of artificial intelligence based techniques ... [https://link.springer.com/article/10.1007/s10462-025-11135-8]
- 82. A Benchmark Dataset for Automatic Cephalometric ... [https://www.nature.com/articles/s41597-025-05542-3]
- 83. A Benchmark Dataset for Automatic Cephalometric Landmark ... [https://pmc.ncbi.nlm.nih.gov/articles/PMC12313948/]
- 84. Region-wise landmarks-based feature extraction employing ... [https://pmc.ncbi.nlm.nih.gov/articles/PMC12334920/]
- 85. A novel approach of developing machine learning based ... [https://www.nature.com/articles/s41598-025-24926-4]
- 86. Anatomical Landmark-guided Strategy for Computer-assisted ... [https://pmc.ncbi.nlm.nih.gov/articles/PMC11932600/]
- 87. External validation, impact assessment and clinical ... [https://pubmed.ncbi.nlm.nih.gov/40675230/]
- 88. External validation, impact assessment and clinical ... [https://www.sciencedirect.com/science/article/pii/S0895435625002355]
- 89. Validation and comparison of three different methods for ... [https://www.degruyterbrill.com/document/doi/10.1515/bmt-2025-0026/html?srsltid=AfmBOoor0nnETzzGh4mKeVK_dGmqDL6pudSpN_-03ScTl9ipHwLh_7wW]
- 90. Generalizability of clinical prediction models in mental health [https://www.nature.com/articles/s41380-025-02950-0]
- 91. Generalizability of clinical prediction models in mental health [https://pubmed.ncbi.nlm.nih.gov/40108256/]
- 92. Suspect identification accuracy from lineups, in the lab and in ... [https://cognitiveresearchjournal.springeropen.com/articles/10.1186/s41235-025-00670-1]
- 93. Functional data geometric morphometrics with machine ... [https://www.nature.com/articles/s41598-024-66246-z]
- 94. CASEMark: A hybrid model for robust anatomical landmark ... [https://link.springer.com/article/10.1007/s44443-025-00031-4]