Immunofluorescence vs. ELISA for Giardia Detection: A Comprehensive Analysis of Diagnostic Accuracy for Researchers
This article provides a systematic comparison of Direct Immunofluorescence Assay (DFA/IFA) and Enzyme-Linked Immunosorbent Assay (ELISA) for detecting Giardia duodenalis, a protozoan parasite of significant clinical and zoonotic concern.
Immunofluorescence vs. ELISA for Giardia Detection: A Comprehensive Analysis of Diagnostic Accuracy for Researchers
Abstract
This article provides a systematic comparison of Direct Immunofluorescence Assay (DFA/IFA) and Enzyme-Linked Immunosorbent Assay (ELISA) for detecting Giardia duodenalis, a protozoan parasite of significant clinical and zoonotic concern. Tailored for researchers, scientists, and drug development professionals, we explore the foundational principles, methodological applications, and performance characteristics of these key diagnostic techniques. The analysis synthesizes current evidence on sensitivity, specificity, and operational considerations, addressing troubleshooting and optimization strategies. By integrating validation studies and comparative meta-analyses, this review offers evidence-based guidance for test selection in research settings, clinical trials, and epidemiological studies, ultimately supporting advancements in diagnostic protocol development and public health interventions.
Giardia Diagnostics: Establishing DFA as the Reference Standard and ELISA as a High-Throughput Alternative
The Central Role of Giardia duodenalis in Human and Veterinary Enteric Disease
Giardia duodenalis (also referred to as G. intestinalis or G. lamblia) is a flagellated protozoan parasite with global distribution, capable of infecting humans and a broad range of other mammals [1]. This parasite represents a significant cause of giardiasis worldwide, with recent cross-sectional studies estimating approximately 280 million symptomatic human cases annually [1]. The World Health Organization recognized its significant health and economic impact, particularly in developing countries, by including it in the Neglected Diseases Initiative in 2004 [2] [1]. In developed countries, Giardia infects approximately 2% of adults and 8% of children under five, while prevalence ranges from 20% to 33% in developing nations [1].
The clinical presentation of giardiasis varies widely, from asymptomatic carriage to acute or chronic gastrointestinal disease. Symptomatic cases may include foul-smelling diarrhea, steatorrhea, abdominal cramps, bloating, flatulence, belching, nausea, vomiting, and malabsorption syndrome [1]. Infections tend to be more severe in children and are often associated with malnutrition, growth retardation, and poor hygiene [2] [1]. High-risk groups include infants and young children, the elderly, institutionalized individuals, travelers, and immunocompromised persons [1]. The parasite's life cycle consists of two main stages: the motile, reproducing trophozoites that attach to intestinal epithelial cells, and the infectious, environmentally resistant cysts that are excreted in feces and can persist for months in favorable conditions [1]. Transmission occurs through the fecal-oral route, either by direct contact with infected feces or through ingestion of contaminated food or water, with waterborne transmission implicated in large-scale outbreaks [2] [1].
Comparative Performance of Diagnostic Methods
The accurate diagnosis of Giardia duodenalis infection is crucial for both clinical management and public health control strategies. Multiple diagnostic approaches are available, each with distinct advantages and limitations. This section provides a comprehensive comparison of the most commonly used methods, with particular focus on immunofluorescence assays (IFA) and enzyme-linked immunosorbent assays (ELISA).
Reference Standards: Microscopy and Immunofluorescence Assay (IFA)
Traditional microscopic examination of stool samples for Giardia cysts and trophozoites has been the longstanding diagnostic method in many laboratories. While this approach allows for simultaneous detection of multiple parasites and is relatively low-cost, it suffers from limitations in sensitivity due to intermittent cyst excretion and requires experienced personnel for accurate identification [2] [3]. Concentration methods such as zinc sulfate centrifugal flotation can optimize cyst detection, but examination of multiple samples is often necessary to achieve acceptable sensitivity [2].
The direct immunofluorescence assay has emerged as a highly sensitive and specific reference method for Giardia detection. Several studies have demonstrated its superior performance characteristics, as summarized in Table 1.
Table 1: Performance Characteristics of Direct Immunofluorescence Assay (DFA) for Giardia Detection
| Study Context | Sensitivity | Specificity | Notes | Citation |
|---|---|---|---|---|
| Canine diagnostic evaluation | Not specified | Not specified | Identified as reference standard with high performance | [4] |
| Comparison of four laboratory tests | High performance | High performance | Established as reference standard for laboratory diagnosis | [4] |
| Evaluation in dogs and cats | Benchmark for other tests | Benchmark for other tests | Used as reference method in Bayesian analysis | [3] |
Enzyme-Linked Immunosorbent Assay (ELISA) Platforms
Antigen detection tests, particularly ELISAs, have been developed as valuable alternatives for diagnosing Giardia infections. These immunoassays detect soluble Giardia-specific cyst wall antigens in fecal specimens and offer the advantage of not being dependent on cyst morphology or observer expertise.
Recent studies have evaluated the performance of various ELISA platforms in both human and veterinary settings:
Table 2: Performance of ELISA Platforms for Giardia Detection
| Platform/Study | Sensitivity | Specificity | Context | Citation |
|---|---|---|---|---|
| ProSpecT Microplate ELISA | 94.1% | 97.4% | Comparison to DFA in canine samples | [5] |
| Serazym ELISA Giardia | 90.1% | 100% | Human stool specimens in Iraq | [6] |
| Rida Quick Giardia | 79% | 100% | Human stool specimens in Iraq | [6] |
| Pediatric study | Higher than microscopy | Not specified | Different pediatric groups in Brazil | [2] |
Rapid Diagnostic Tests and In-Clinic Assays
In clinical veterinary practice, several rapid in-clinic immunoassays are available for point-of-care detection of Giardia. A comparative study of four commercially available tests revealed variations in performance characteristics when compared to DFA as the reference standard [5].
Table 3: Performance of In-Clinic Rapid Tests for Giardia Detection in Canine Samples
| Test Name | Sensitivity | Specificity | Prevalence Adjusted Agreement | Citation |
|---|---|---|---|---|
| SNAP Giardia Test | 87.1% | 93.4% | 93.1% | [5] |
| Anigen Rapid Test | 80.2% | 80.3% | 80.3% | [5] |
| Witness Giardia Test | 73.3% | 71.1% | 71.2% | [5] |
| VetScan Rapid Test | 70.0% | 85.5% | 84.7% | [5] |
Another study evaluating commercially available tests in dogs and cats reported that all tests showed sensitivity and specificity ≥82% and ≥90%, respectively, when compared to IFA [3]. When tests were combined with zinc sulfate centrifugal fecal flotation, there was no significant difference in sensitivities, supporting the Companion Animal Parasite Council recommendation to use centrifugal fecal flotation in conjunction with an immunoassay for diagnosing G. duodenalis infections in veterinary practices [3].
Molecular Methods and Other Approaches
Molecular techniques based on parasite DNA amplification, particularly polymerase chain reaction, have been developed as highly sensitive and specific methods that allow detection of Giardia directly from fecal samples and enable identification of assemblages and sub-assemblages [2] [4]. However, a negative PCR result does not necessarily rule out infection, as interference from PCR inhibitors present in feces may hamper DNA amplification [2]. One study noted that PCR performance was relatively low compared to other methods, but it successfully identified zoonotic assemblages in 25% of PCR-positive specimens, with the remaining belonging to dog-specific assemblage C [4].
Other diagnostic approaches include endoscopic biopsy and the Entero-Test, though these are less commonly used in routine practice [1].
Experimental Protocols and Methodologies
Direct Immunofluorescence Assay Protocol
The Merifluor Cryptosporidium/Giardia direct immunofluorescence assay is widely used as a reference method for Giardia detection. The standard protocol involves:
Sample Preparation: 0.1 g of feces is added to 900 μL of 0.02 M sodium phosphate-buffered saline and mixed thoroughly. Serial dilutions may be performed to optimize cyst counting [5].
Staining: An aliquot of the prepared sample is mixed with Merifluor detection reagent containing fluorescein isothiocyanate-labeled antibodies specific to Giardia cysts [5].
Incubation: The mixture is incubated at room temperature for 30 minutes in the dark [5].
Microscopy: A defined volume (typically 10-15 μL) of the stained preparation is examined under a fluorescence microscope. Cysts are identified by their characteristic apple-green fluorescence and morphologic features [5] [3].
Quantification: Cysts are counted, and results can be expressed as cysts per gram of feces for quantitative assessment [5].
The method includes positive and negative controls with each batch to ensure test validity [5].
Microtiter Plate ELISA Protocol
The ProSpecT Giardia/Cryptosporidium Microplate Assay represents a typical ELISA format for Giardia detection:
Sample Preparation: Stool samples are diluted with sample diluent according to manufacturer specifications, typically 1:5 to 1:10 dilutions [5] [6].
Antigen-Antibody Reaction: Diluted samples are added to microplate wells coated with anti-Giardia antibodies and incubated to allow antigen capture [6].
Washing: Unbound components are removed by washing steps [6].
Detection: Enzyme-conjugated antibodies are added, forming an antibody-antigen-antibody complex [6].
Substrate Reaction: Enzyme substrate is added, producing a color change proportional to the amount of captured antigen [6].
Measurement: Optical density is measured spectrophotometrically at appropriate wavelengths (e.g., 450 nm), with results interpreted against a cutoff value [5] [6].
Similar principles apply to the Serazym ELISA Giardia protocol, which specifically targets Giardia cyst wall protein and includes a 60-minute initial incubation followed by a 30-minute conjugate incubation [6].
EPA Method 1623 for Water Testing
For environmental water sampling, the U.S. Environmental Protection Agency Method 1623 provides a standardized protocol:
Filtration: 10 L of water is filtered through an Envirochek HV capsule [7].
Elution: Captured organisms are eluted from the filter [7].
Immunomagnetic Separation: Giardia cysts are separated from debris using antibody-coated magnetic beads [7].
Detection: Cysts are identified using fluorescein isothiocyanate-labeled antibodies and differential interference contrast microscopy [7].
This method allows for detection and quantification of low levels of Giardia contamination in water sources [7].
Research Reagent Solutions Toolkit
Table 4: Essential Research Reagents for Giardia Diagnostic Studies
| Reagent/Kit | Manufacturer | Function/Application | Citation |
|---|---|---|---|
| Merifluor DFA | Meridian Biosciences | Gold standard detection of Giardia cysts by immunofluorescence | [5] [3] |
| ProSpecT Microplate ELISA | Thermo Fisher Scientific | Microplate-based antigen detection in reference laboratories | [5] |
| SNAP Giardia Test | IDEXX Laboratories | Rapid in-clinic immunoassay for veterinary practice | [5] [3] |
| VetScan Giardia Test | Abaxis | Rapid in-clinic immunoassay for canine samples | [5] [3] |
| VETCHEK ELISA | TECHLAB | Plate ELISA optimized for canine and feline specimens | [3] |
| Serazym ELISA Giardia | VIROTECH Diagnostic | Polyclonal antibody-based detection of cyst wall protein | [6] |
| Rida Quick Giardia | r-biopharm | Immunochromatographic lateral-flow rapid test | [6] |
| Envirochek HV Capsules | Pall Corporation | Water filtration for environmental sampling per EPA Method 1623 | [7] |
| Dynabeads GC-Combo | Applied Biosystems | Immunomagnetic separation for concentration of cysts/oocysts | [7] |
Diagnostic Workflow and Method Selection
The following diagram illustrates a strategic approach for selecting appropriate diagnostic methods based on research objectives and available resources:
The comparative analysis of diagnostic methods for Giardia duodenalis reveals a complex landscape where method selection must balance sensitivity, specificity, technical requirements, and practical constraints. Immunofluorescence assays maintain their position as reference standards due to their high sensitivity and specificity, particularly in research settings and for method validation [5] [3] [4]. However, ELISA platforms have demonstrated excellent performance characteristics with sensitivities exceeding 90% in some formats, making them valuable for higher-throughput laboratory settings [2] [5] [6].
For veterinary diagnostics and point-of-care applications, rapid in-clinic tests provide reasonable sensitivity and specificity, with the SNAP Giardia Test showing the highest performance among commercially available options [5]. The combination of fecal flotation with antigen detection tests, as recommended by the Companion Animal Parasite Council, appears to provide optimal sensitivity for clinical veterinary practice [3].
Molecular methods, while not yet dominant in routine diagnosis, offer the distinct advantage of genotyping capabilities, which are crucial for understanding transmission dynamics and zoonotic potential [4]. The identification of both zoonotic assemblages (B) and dog-specific assemblages (C) in clinical samples highlights the importance of molecular characterization in public health risk assessment [4].
Future developments in Giardia diagnostics will likely focus on improving sensitivity and specificity while reducing costs and technical requirements. The integration of multiple methods in a complementary fashion appears to be the most effective approach for accurate detection of this clinically significant parasite across human, veterinary, and environmental contexts.
Direct Immunofluorescence Assay (DFA) stands as a benchmark diagnostic technique in clinical and research laboratories, particularly for the detection of pathogenic organisms. This guide provides a detailed comparison of DFA's performance against other diagnostic methods, with a specific focus on the detection of Giardia duodenalis and Cryptosporidium spp., two enteric protozoan parasites of significant veterinary and public health concern. The precision of DFA is critical for enabling prompt treatment and preventing potential transmission, especially in vulnerable populations [8] [9].
Principles and Techniques of Immunofluorescence
Fundamental Concepts
Immunofluorescence (IF) is an immunochemical technique that allows for the detection and localization of a wide variety of antigens in different types of tissues or cell preparations. The technique provides excellent sensitivity and signal amplification compared to immunohistochemistry, employing various microscopy techniques for visualization. Two primary methods are available: Direct (Primary) and Indirect (Secondary) Immunofluorescence [10].
Direct vs. Indirect Immunofluorescence
Direct Immunofluorescence (DFA) In the direct method, a fluorophore label is conjugated directly to the primary antibody that binds to the target epitope. This method is quicker and involves fewer steps, reducing the potential for non-specific binding [10].
Indirect Immunofluorescence (IIF) The indirect method involves a two-step incubation process: a primary antibody binds to the target epitope, followed by a fluorophore-tagged secondary antibody that recognizes and binds to the primary antibody. Although more time-consuming, the indirect method offers higher sensitivity, significant signal amplification, and the ability to detect multiple targets in the same sample [10] [11].
The Immunofluorescence Workflow
Every immunofluorescence staining protocol consists of four major steps which can be further subdivided [12]:
Experiment Planning and Sample Preparation: Before starting, researchers must determine expression levels and intracellular localization of the target protein. A cell confluence of 70-80% is recommended for immunocytochemistry [12].
Sample Fixation: This essential preliminary step prevents autolysis, mitigates putrefaction, and preserves morphology while maintaining antigenicity. Common fixatives include cross-linking reagents like formaldehyde (4% formalin solution) or organic solvents like methanol and acetone [10] [12].
Cell Permeabilization: For intracellular protein staining, cells require permeabilization using detergents like Triton X-100 or Tween-20 to allow antibody entry through the lipid membrane [12].
Blocking: To minimize background signals, non-specific antigens are blocked by incubating the sample in serum of the host, bovine serum albumin (BSA), or milk. Typical blocking times range from 30 minutes to one hour [12].
Antibody Incubation: Primary antibody selection is the most critical step, requiring optimization of concentration and incubation time. Secondary antibody incubation follows, with fluorophore selection based on the microscopy equipment available [12].
Counterstaining and Microscopy: The final steps involve counterstaining nuclei (often with DAPI) and mounting samples with low-autofluorescence medium before microscopic analysis [12].
DFA as a Diagnostic Gold Standard
The Status of DFA in Giardia and Cryptosporidium Detection
Direct Immunofluorescence Assay has been established as the reference standard for laboratory diagnosis of Giardia and Cryptosporidium in fecal samples from dogs and cats [4]. A 2024 comparative study evaluated the diagnostic performance of conventional and molecular methods for detecting these pathogens, using DFA as the gold standard [8]. The study analyzed 328 fecal samples from different dog (n=225) and cat (n=103) populations, demonstrating that DFA was the most sensitive technique for detecting G. duodenalis in samples from both species (p-value: <0.001) [8] [9].
According to DFA results, the overall prevalence of G. duodenalis was 24.4% (80/328, 95% CI: 19.8-29.4), varying from 11.6% (12/103, 95% CI: 6.2-19.5) in cats to 30.2% (68/225, 95% CI: 24.3-36.7) in dogs. The overall prevalence of Cryptosporidium spp. was 4.0% (13/328, 95% CI: 2.1-6.7), varying from 2.9% (3/103, 95% CI: 0.6-8.3) in cats to 4.4% (10/225, 95% CI: 2.1-8.0) in dogs [8].
Experimental Protocol for DFA in Parasite Detection
The standard DFA protocol for detecting Giardia and Cryptosporidium follows a structured methodology [8] [5]:
Sample Preparation:
- Fecal samples are thoroughly resuspended in PBS (approximately 3-5g in 20ml)
- The homogenate is filtered through a sieve mesh with a 250μm diameter to remove large debris
- The filtered suspension is centrifuged at 1,500 rpm for 10 minutes
- Supernatant is carefully removed after centrifugation
DFA Staining Procedure:
- The commercial kit Crypto/Giardia Cel IF (Cellabs, Brookvale, Australia) is used following manufacturer's instructions
- Processed sample is applied to slides with specific detection reagents
- Slides are incubated at room temperature for 30 minutes in the dark
- Samples are examined on a fluorescence microscope (Nikon Eclipse Ci-S) at 400× magnification
Interpretation of Results:
- Structures round to oval in shape of the correct size (Giardia cysts: 8-12μm; Cryptosporidium oocysts: 4-6μm) stained bright apple green are considered positive
- A positive and negative control are read prior to each test to ensure assay validity [5]
Comparative Performance Analysis
DFA Versus Other Diagnostic Methods
Multiple studies have demonstrated the superior performance of DFA compared to other diagnostic techniques for detecting Giardia and Cryptosporidium.
Comparison of Diagnostic Methods for Giardia Detection (2018 Study) [5] A 2018 study examining 177 fecal samples compared four in-clinic Giardia diagnostic tests against DFA as the gold standard. The performance characteristics are summarized in the table below.
Table 1: Performance of Giardia Diagnostic Tests Compared to DFA (n=177)
| Diagnostic Test | Sensitivity (95% CI) | Specificity (95% CI) | Prevalence Adjusted Agreement |
|---|---|---|---|
| DFA (Gold Standard) | Reference | Reference | Reference |
| SNAP Giardia Test | 87.1% (79.1-92.5) | 93.4% (85.2-97.5) | 93.1% |
| Anigen Rapid Test | 80.2% (71.3-86.9) | 80.3% (69.8-87.8) | 80.3% |
| Witness Giardia Test | 73.3% (63.9-81.0) | 71.1% (60.0-80.1) | 71.2% |
| VetScan Rapid Test | 70.0% (60.4-78.1) | 85.5% (75.7-91.9) | 84.7% |
| Ova & Parasite Test | 81.2% (72.4-87.7) | 93.4% (85.2-97.5) | 92.7% |
| ProSpecT Microplate ELISA | 94.1% (87.4-97.5) | 97.4% (90.4-99.8) | 97.2% |
Comprehensive Method Comparison in Canine and Feline Populations (2024 Study) [8] [9] A 2024 study with 328 fecal samples provided a comprehensive comparison of diagnostic methods for detecting both G. duodenalis and Cryptosporidium spp., using DFA as the gold standard.
Table 2: Performance of Diagnostic Methods for G. duodenalis and Cryptosporidium Detection
| Parasite | Diagnostic Method | Dog Prevalence | Cat Prevalence | Overall Performance |
|---|---|---|---|---|
| G. duodenalis | DFA (Gold Standard) | 30.2% (68/225) | 11.6% (12/103) | Most sensitive technique (p<0.001) |
| Merthiolate-Iodine-Formalin (MIF) | 22.7% | 7.8% | Lower sensitivity than DFA | |
| Real-time PCR | Not specified | Not specified | Second to DFA in sensitivity | |
| Lateral Flow Immunochromatography (ICT) | Not specified | Not specified | Limited diagnostic sensitivity | |
| Cryptosporidium spp. | DFA (Gold Standard) | 4.4% (10/225) | 2.9% (3/103) | Most effective in combination with PCR |
| DFA + PCR Combination | Not specified | Not specified | Optimal detection (p<0.001) |
DFA Versus ELISA: A Comparative Analysis
The comparison between DFA and ELISA demonstrates important trade-offs between sensitivity, specificity, and operational considerations.
Diagnostic Performance for Giardia Detection A 2014 study with 1,680 stool samples comparing ELISA (RIDASCREEN Giardia test) with microscopy found the ELISA test had a sensitivity of 100% and specificity of 91.5% when compared to microscopy [13]. However, it's important to note that microscopy itself has limitations, with sensitivity reported between 50-70% even after multiple examinations [13].
Pattern Recognition Capabilities A key advantage of DFA over ELISA is its ability to provide pattern information. In autoimmune diagnostics, a 2025 study comparing ELISA with Indirect Immunofluorescence (IIF) for anti-nuclear antibody detection found that discordant cases were primarily IIF-positive/ELISA-negative, often involving fluorescence patterns such as nucleolar and peripheral that are less likely to be detected by ELISA [11].
Operational Considerations While DFA demonstrates superior diagnostic performance for many applications, ELISA offers advantages in high-throughput settings. ELISA is amenable to automation, offers better standardization, delivers objective results with minimal operator dependence, and is faster for processing large sample volumes [11].
Essential Research Reagent Solutions
Successful implementation of DFA requires specific research reagents and materials optimized for fluorescence-based detection.
Table 3: Essential Research Reagents for DFA Protocols
| Reagent/Category | Specific Examples | Function/Purpose |
|---|---|---|
| Fixation Reagents | 4% Formalin Solution (in PBS, pH 7.4), 100% Chilled Methanol, Acetone | Preserves cellular architecture and antigen integrity |
| Permeabilization Agents | Triton X-100, Tween-20, Saponin | Enables antibody access to intracellular targets |
| Blocking Solutions | Host Serum, Bovine Serum Albumin (BSA), Non-fat Dry Milk, Commercial Protein-free Buffers | Reduces non-specific antibody binding |
| Fluorophores | FITC (Fluorescein Isothiocyanate), TRITC (Tetramethylrhodamine Isothiocyanate), DAPI | Provides detection signal through fluorescence emission |
| Commercial DFA Kits | Crypto/Giardia Cel IF (Cellabs), Merifluor Giardia/Cryptosporidium | Optimized complete systems for specific pathogen detection |
| Mounting Media | ibidi Mounting Medium (with/without DAPI) | Preserves samples, reduces photobleaching, enables microscopy |
| Microscopy Equipment | Fluorescence Microscope (e.g., Nikon Eclipse Ci-S) | Visualization and interpretation of fluorescence signals |
Direct Immunofluorescence Assay maintains its status as a diagnostic gold standard for detecting pathogens like Giardia and Cryptosporidium, offering superior sensitivity and specificity compared to many alternative methods. The technique's robust performance characteristics, particularly when combined with molecular methods like PCR, make it invaluable in both clinical and research settings.
While newer technologies like ELISA offer advantages in automation and throughput, DFA remains the reference method for accurate detection of these pathogens, especially in cases with low parasite burden or when confirmation of suspicious results is required. The choice between these methods ultimately depends on the specific diagnostic needs, available resources, and required throughput, with DFA representing the optimal choice when diagnostic accuracy is paramount.
Giardia duodenalis (also known as Giardia lamblia and Giardia intestinalis) is a flagellated protozoan parasite responsible for giardiasis, a prevalent form of infectious gastroenteritis worldwide. Accurate diagnosis is critical for effective patient management and outbreak control. Traditional diagnosis relied primarily on the microscopic identification of cysts or trophozoites in stool specimens. However, this method suffers from limitations including intermittent parasite shedding, requirement for skilled technicians, and suboptimal sensitivity [14] [15].
The development of immunoassays, particularly the Enzyme-Linked Immunosorbent Assay (ELISA), has significantly advanced the diagnostic landscape for giardiasis. These tests detect specific Giardia antigens present in fecal samples, offering a standardized, high-throughput alternative to microscopy. This guide provides a detailed comparison of ELISA's performance against other diagnostic methods, particularly immunofluorescence, within the context of ongoing research into comparative assay accuracy.
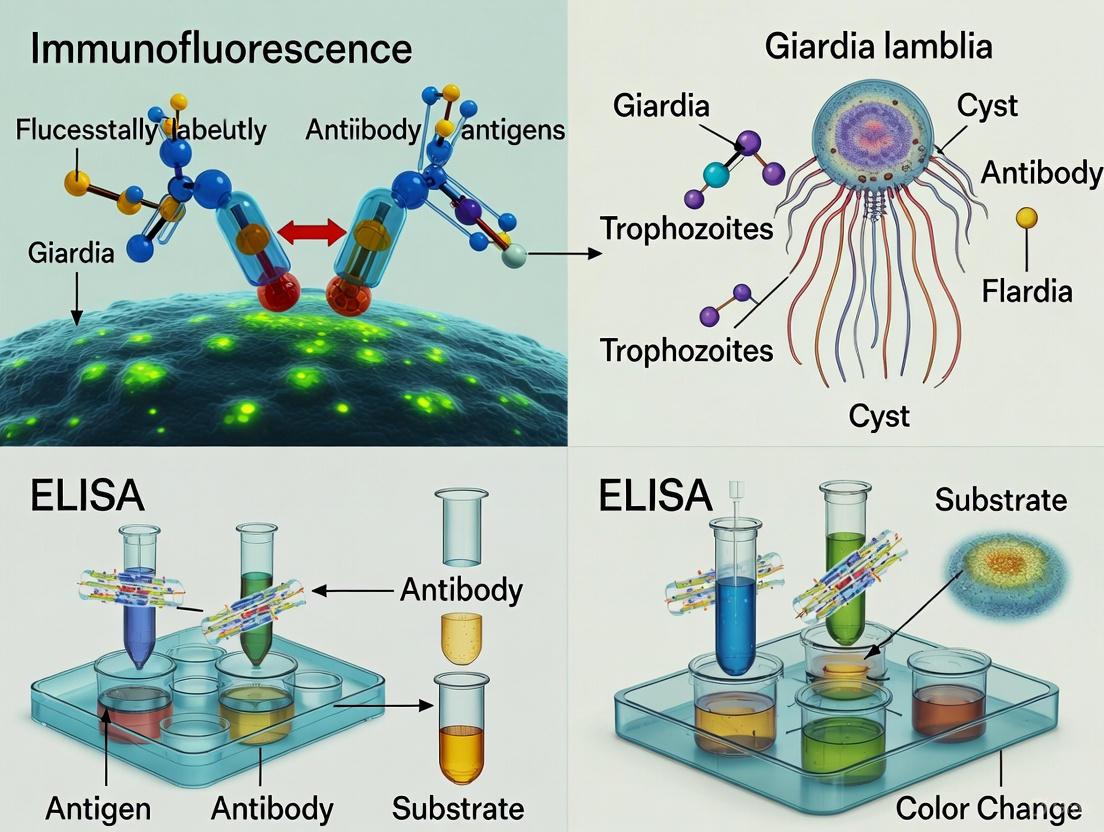
The ELISA Mechanism: A Detailed Breakdown
The fundamental principle behind Giardia antigen detection is the sandwich ELISA. This format employs two antibodies that bind to distinct epitopes on the target Giardia antigen, capturing it from the fecal suspension and facilitating its detection.
Step-by-Step Workflow
The following diagram illustrates the sequential workflow of a sandwich ELISA for Giardia antigen detection:
- Plate Coating: The wells of a microtiter plate are coated with a capture antibody specific to Giardia lamblia antigens [16] [17].
- Sample Addition: A prepared suspension of the patient's stool sample is added to the well. If Giardia antigens are present, they bind to the immobilized capture antibodies during incubation [16].
- Wash Step: Unbound materials from the sample are washed away, leaving only the captured antigen-antibody complexes.
- Detection Antibody Addition: A second, biotin-conjugated antibody specific to Giardia antigens is added. This antibody binds to a different site on the captured antigen, forming a "sandwich" [16].
- Wash Step: A second wash removes any unbound detection antibodies.
- Enzyme Conjugate Addition: Streptavidin linked to an enzyme (usually horseradish peroxidase, HRP) is added. The streptavidin binds with high affinity to the biotin on the detection antibody [16].
- Wash Step: A final wash removes unbound enzyme conjugate.
- Signal Detection: A colorless substrate solution is added to the well. The enzyme HRP catalyzes a reaction that converts the substrate into a colored product. The reaction is stopped with an acid, and the intensity of the color, measured spectrophotometrically, is proportional to the amount of Giardia antigen present in the original sample [16].
Key Advantages of the Mechanism
- Detects Active Infection: Unlike molecular methods that detect genetic material, ELISA detects specific parasite antigens, indicating an active infection.
- Not Dependent on Intact Organisms: The test can be positive even if cysts are ruptured or non-viable, as long as the target antigen is present [17].
- Objective Result: The spectrophotometric reading provides a quantitative or semi-quantitative output, reducing subjectivity.
Comparative Diagnostic Performance: ELISA vs. Alternative Methods
Extensive research has been conducted to evaluate the sensitivity and specificity of ELISA against other standard diagnostic techniques. The tables below summarize key performance metrics from multiple studies.
Table 1: Comparative performance of Giardia diagnostic tests in human medicine
| Diagnostic Method | Sensitivity (%) | Specificity (%) | Positive Predictive Value (%) | Negative Predictive Value (%) | Study/Context |
|---|---|---|---|---|---|
| Microscopy (Gold Standard) | 100 (Reference) | 100 (Reference) | 100 | 100 | [15] |
| ELISA (Coproantigen) | 91 | 91 | 94 | 91 | Human patients, vs. microscopy [15] |
| ELISA (Coproantigen) | 97 | N/R | N/R | N/R | Pediatric groups, vs. composite standard [14] |
| Microscopy | 55 | N/R | N/R | N/R | Pediatric groups, vs. composite standard [14] |
| Direct Immunofluorescence (DFA) | N/R | N/R | N/R | N/R | Considered highly sensitive reference [9] |
Table 2: Performance of commercial immunoassays in veterinary medicine compared to DFA
| Test Name (Species) | Format | Sensitivity vs. DFA (%) | Specificity vs. DFA (%) | Study |
|---|---|---|---|---|
| SNAP Giardia (Dog/Cat) | Rapid In-Clinic | 87.1 | 93.4 | [18] |
| ProSpecT Microplate (Dog) | Microplate ELISA | 94.1 | 97.4 | [18] |
| VetChek (Dog/Cat) | Microplate ELISA | ≥82* | ≥90* | [3] |
| ZnSO4 Fecal Flotation | Microscopy | 81.2 | 93.4 | [18] |
| VetScan (Dog) | Rapid In-Clinic | 70.0 | 93.4 | [18] |
Values derived from Bayesian analysis; DFA=Direct Fluorescent Antibody Test.
Analysis of Comparative Data
- ELISA vs. Microscopy: Consistently, ELISA demonstrates superior sensitivity compared to traditional microscopy. A study in pediatric populations found ELISA to be 97% sensitive, dramatically outperforming microscopy at 55% [14]. This is largely due to ELISA's ability to detect antigen even during intermittent cyst shedding.
- ELISA vs. Immunofluorescence (DFA): DFA is widely regarded as a sensitive and specific reference method [9] [8]. When compared directly to DFA, commercial microplate ELISAs show excellent agreement, with one study reporting 94.1% sensitivity and 97.4% specificity [18]. This validates ELISA as a highly reliable method.
- In-Clinic Rapid Tests vs. Laboratory ELISA: Rapid immunochromatographic tests (ICT) offer convenience but may have variable performance. A comparative study found sensitivities ranging from 70.0% to 87.1% for various in-clinic tests, with the SNAP test performing best [18]. This suggests that laboratory-based microplate ELISAs may offer more consistent and higher sensitivity.
- The Value of Combined Testing: The Companion Animal Parasite Council (CAPC) recommends combining centrifugal fecal flotation with an immunoassay for diagnosing Giardia [3]. Research confirms that this combination mitigates differences in sensitivity between commercial immunoassays and provides the most comprehensive diagnostic picture [3].
Detailed Experimental Protocol for Giardia Coproantigen ELISA
The following protocol is synthesized from manufacturer instructions and methodologies described in the literature [16] [15] [17].
Sample Collection and Preparation
- Collection: Collect fresh stool specimen into a clean, dry, leak-proof container. For optimal results, test the sample within 24-48 hours if stored at 2-8°C. For longer storage, freeze at -20°C or below, avoiding repeated freeze-thaw cycles.
- Preparation:
- For liquid stools: Mix thoroughly before testing.
- For solid/semi-solid stools: Prepare a 1:10 to 1:20 suspension by emulsifying 50-100 mg of feces in the sample dilution buffer provided in the kit.
- Centrifuge the suspension at 2,000-3,000 x g for 10-15 minutes to clarify. The supernatant is used for testing.
Assay Procedure
- Coated Wells: Use the pre-coated antibody strips provided in the kit.
- Controls and Samples: Pipette 100 µL of negative control, positive control, and prepared patient samples into separate designated wells.
- Conjugate: Add 50-100 µL of the biotinylated detection antibody (Conjugate 1) to each well.
- Incubation: Cover the plate and incubate at room temperature (20-25°C) for 60 minutes.
- Wash: Manually or automatically wash the wells 3-5 times with wash buffer to remove unbound materials.
- Enzyme-Reagent: Add 50-100 µL of the streptavidin-peroxidase conjugate (Conjugate 2) to each well.
- Incubation: Cover the plate and incubate at room temperature for 30 minutes.
- Wash: Repeat the washing step as before.
- Substrate: Add 100 µL of Tetramethylbenzidine (TMB) substrate solution to each well.
- Incubation: Incubate the plate at room temperature for 10-15 minutes in the dark. A blue color will develop in positive wells.
- Stop: Add 100 µL of stop solution (e.g., 1N sulfuric acid) to each well. The color will change from blue to yellow.
- Reading: Measure the optical density (OD) of each well at 450 nm using a spectrophotometer within 30 minutes of stopping the reaction.
Interpretation of Results
- Cut-off Calculation: Calculate the cut-off value as per the kit's instructions. This is typically the mean OD value of the negative control plus a predetermined factor (e.g., 0.150 OD units).
- Positive Result: Sample OD value ≥ Cut-off value.
- Negative Result: Sample OD value < Cut-off value.
- Validation: The assay is valid only if the positive control OD is above a specified threshold and the negative control OD is below the cut-off.
The Scientist's Toolkit: Essential Reagents and Materials
Table 3: Key research reagents and materials for Giardia antigen detection by ELISA
| Item | Function/Description | Example Specifications |
|---|---|---|
| Microtiter Plate | Solid phase for antibody immobilization | 96-well polystyrene plates, coated with anti-Giardia capture antibody [16] |
| Capture & Detection Antibodies | Key reagents for specific antigen recognition | Monoclonal or polyclonal antibodies against Giardia cyst/trophozoite antigens [16] |
| Biotin-Streptavidin System | Signal amplification system | Biotinylated detection antibody and Streptavidin-HRP conjugate [16] |
| Sample Dilution Buffer | Medium for stool suspension and antigen extraction | Phosphate-buffered saline (PBS) with protein stabilizers [15] |
| Wash Buffer | Removes unbound components to reduce background | Buffered solution with a detergent (e.g., Tween 20) [16] |
| TMB Substrate | Enzyme substrate for colorimetric detection | Tetramethylbenzidine (TMB), a chromogen for Horseradish Peroxidase (HRP) [16] |
| Stop Solution | Halts enzyme reaction; stabilizes color | 1N Sulfuric Acid (H₂SO₄) [16] |
| Positive & Negative Controls | Validates assay performance | Contains defined Giardia antigen or confirmed negative matrix [18] |
The sandwich ELISA for Giardia antigen detection represents a robust, sensitive, and specific diagnostic tool that has largely supplanted microscopy as the front-line test in many clinical and research laboratories. When framed within the broader thesis of comparative accuracy, the evidence clearly shows that while Direct Immunofluorescence (DFA) remains a highly sensitive "gold standard," ELISA performs with comparable accuracy and offers significant advantages in throughput, objectivity, and ease of standardization [9] [18] [8].
The choice between ELISA, DFA, rapid tests, or PCR ultimately depends on the context—considering factors such as required throughput, available infrastructure, cost, and the need for simultaneous genotype information. For the majority of clinical and epidemiological purposes requiring reliable detection of active Giardia infection, ELISA stands as a proven and powerful technique.
Accurate detection of Giardia duodenalis is a critical concern in both clinical and veterinary medicine. The diagnostic landscape is primarily dominated by two methodological approaches: immunofluorescence assays (IFA) and enzyme-linked immunosorbent assays (ELISA). Evaluating these tests requires a robust understanding of diagnostic accuracy parameters—sensitivity, specificity, predictive values, and the pivotal role of reference standards. These metrics form the essential framework for comparing test performance and guiding appropriate test selection in both research and clinical settings.
The challenge in diagnosing giardiasis stems from the intermittent shedding of cysts in feces, which can lead to false-negative results if testing occurs during non-shedding periods. This biological reality underscores the importance of selecting diagnostic methods with optimal sensitivity and specificity. Within this comparative framework, immunofluorescence assays (IFA) are frequently positioned as the reference standard against which other methods, particularly ELISA, are evaluated [8] [19]. Understanding the statistical measures used in these comparisons is fundamental for researchers and clinicians interpreting diagnostic study results.
Core Concepts in Diagnostic Test Evaluation
Sensitivity, Specificity, and Predictive Values
The accuracy of a diagnostic test is primarily quantified through several inter-related statistical measures. Sensitivity represents the test's ability to correctly identify individuals with the disease (true positive rate), while specificity measures its ability to correctly identify those without the disease (true negative rate) [20]. In practical terms, a highly sensitive test is valuable for ruling out disease when results are negative, whereas a highly specific test is valuable for confirming disease when results are positive.
Beyond these fundamental metrics, predictive values provide clinically relevant information about test performance in specific populations. The Positive Predictive Value (PPV) indicates the probability that a person with a positive test result actually has the disease, while the Negative Predictive Value (NPV) indicates the probability that a person with a negative test result truly does not have the disease [11] [20]. Unlike sensitivity and specificity, which are inherent test characteristics, predictive values are highly dependent on disease prevalence in the tested population.
The relationship between these metrics is characterized by a fundamental trade-off. As sensitivity increases, specificity typically decreases, and vice-versa [20]. This inverse relationship necessitates careful consideration of the clinical context when selecting diagnostic tests and establishing cut-off values. For giardiasis detection, this balance is particularly important given the public health implications and potential for zoonotic transmission.
The Role of Reference Standards
A reference standard (or "gold standard") is defined as the best available method for establishing the presence or absence of the target condition [21]. It serves as the benchmark against which new or alternative diagnostic tests are evaluated. The validity of any diagnostic accuracy study hinges on the appropriateness of its chosen reference standard.
In giardiasis diagnostics, direct immunofluorescence assay (DFA) is often employed as the reference standard in methodological comparisons [8]. For instance, one study evaluating diagnostic performance for detecting Giardia duodenalis and Cryptosporidium spp. in canine and feline fecal samples explicitly used DFA as the gold standard based on published literature recommendations [8]. The designation of a method as a reference standard reflects a consensus within the medical, laboratory, and regulatory communities regarding its status as the "best available method" [21].
However, the selection of an appropriate reference standard presents challenges in many diagnostic domains. In some cases, a perfect reference standard may not exist, or it may be prone to error for a non-negligible percentage of the population. In these situations, researchers must consult with regulatory bodies and rely on established consensus within their field when selecting an appropriate benchmark for test evaluation [21].
Experimental Protocols for Method Comparison
Direct Immunofluorescence Assay (DFA) Protocol
The DFA protocol for Giardia detection follows a standardized procedure utilizing commercially available kits. The following workflow outlines the key steps in this diagnostic method:
Sample Preparation: Fecal samples undergo enrichment using the SAFC (sodium acetate-acetic acid-formalin concentration) sedimentation method, which preserves cyst morphology better than flotation techniques that can damage cysts through high salt content [19]. Approximately 3-5 grams of fecal material are resuspended in phosphate-buffered saline (PBS) and filtered through a sieve mesh to remove large debris.
Staining and Visualization: The commercial DFA kit (such as Crypto/Giardia Cel IF) contains fluorescein isothiocyanate (FITC)-labeled antibodies specific to Giardia cyst wall proteins. The enriched sample is incubated with these antibodies in a moist chamber at room temperature for 30 minutes [8]. After incubation, slides are washed with PBS to remove unbound antibodies and mounted with a suitable medium.
Microscopy and Interpretation: Stained slides are examined under a fluorescence microscope at 400× magnification. Giardia cysts appear as round to oval structures (8-12 μm in diameter) exhibiting bright apple-green fluorescence [8]. The test allows for semi-quantitative assessment of cyst burden, providing additional clinical information beyond mere presence or absence.
Enzyme-Linked Immunosorbent Assay (ELISA) Protocol
The ELISA protocol for Giardia detection focuses on identifying specific antigens rather than visualizing intact cysts, offering a different approach to diagnosis:
Antigen Detection: ELISA kits target the Giardia-specific antigen GSA-65, a heterodimer formed by cyst wall proteins CWP-1 and CWP-2 [19]. This antigen persists in feces even during periods of intermittent cyst shedding, potentially offering diagnostic advantages.
Procedure: Serum or fecal samples are diluted (typically 1:101) with the provided diluent, and 100 μL is added to microtiter wells coated with a mixture of Giardia-specific antigens [11]. After 30 minutes of incubation at room temperature, wells are washed to remove unbound material. Horseradish peroxidase (HRP)-conjugated anti-human or anti-animal IgG is added and incubated for another 30 minutes. Following a second wash, tetramethylbenzidine (TMB) substrate solution is added and incubated for 15 minutes in the dark. The reaction is stopped with stop solution, and absorbance is measured at 450 nm.
Interpretation: Results are interpreted based on the manufacturer's cut-off, classifying samples as positive or negative. The enzymatic amplification of the color reaction contributes to the test's high sensitivity, while the washing steps enhance specificity by reducing non-specific binding [19].
Comparative Performance Data
Diagnostic Accuracy Metrics
The comparative performance of immunofluorescence and ELISA for Giardia detection has been evaluated across multiple studies, with results summarized in the table below:
Table 1: Comparative Diagnostic Performance of IFA and ELISA for Giardia Detection
| Study Population | Reference Standard | Method | Sensitivity (%) | Specificity (%) | PPV (%) | NPV (%) | Overall Accuracy (%) |
|---|---|---|---|---|---|---|---|
| Human patients [15] | Microscopy | ELISA | 91 | 91 | 94 | 91 | - |
| Dogs and Cats [8] | DFA | Microscopy (MIF) | Lower than DFA | Lower than DFA | - | - | - |
| Dogs and Cats [19] | - | ELISA | ~98 | ~98 | - | - | - |
| Human ANA Detection [11] | IIF (HEp-2 cells) | ELISA | 81.4 | 87.1 | 92.3 | 71.0 | 84.4 |
The data reveal important patterns in test performance. ELISA demonstrates consistently high sensitivity and specificity, often exceeding 90% across different study populations [15] [19]. The high PPV (94%) reported in human studies indicates strong reliability of positive results, which is clinically valuable for confirming infection.
It is noteworthy that these metrics are influenced by the choice of reference standard. When indirect immunofluorescence (IIF) was used as a reference standard for antinuclear antibody detection (a different diagnostic context but methodologically relevant), ELISA showed slightly lower sensitivity (81.4%) but maintained good specificity (87.1%) [11]. This pattern suggests that ELISA may miss some true positive cases but has a low rate of false positives.
Advantages and Limitations in Clinical Practice
Beyond the quantitative metrics, each method presents distinctive practical advantages and limitations that influence their suitability for different clinical or research settings:
Table 2: Comparative Advantages and Limitations of IFA and ELISA
| Parameter | Immunofluorescence (IFA) | ELISA |
|---|---|---|
| Detection Target | Whole cysts | Specific antigens (GSA-65) |
| Throughput | Lower throughput, manual process | High throughput, amenable to automation |
| Expertise Required | Requires trained personnel for interpretation | Minimal operator dependence, objective results |
| Additional Information | Provides cyst count and morphological assessment | No morphological information |
| Intermittent Shedding | May miss infections during low shedding periods | Can detect antigen even without intact cysts |
| Cost Considerations | Higher labor costs, microscope required | Lower per-test cost in batch processing |
Immunofluorescence offers the advantage of visualizing cyst morphology and providing semi-quantitative data on cyst burden, which may have clinical relevance for treatment decisions [19]. However, it requires specialized equipment and trained personnel, making it less suitable for high-volume settings.
ELISA provides objective results with minimal operator dependence, excellent for screening large numbers of specimens efficiently [11] [19]. A significant limitation, however, is that ELISA may remain positive after successful treatment as it detects antigens from non-viable organisms, making it less suitable for treatment monitoring [19].
Essential Research Reagents and Materials
The experimental protocols for both IFA and ELISA require specific research reagents and materials that are essential for proper implementation and accurate results:
Table 3: Essential Research Reagents for Giardia Detection Methods
| Reagent/Material | Function | Application in IFA | Application in ELISA |
|---|---|---|---|
| FITC-labeled Antibodies | Binds specifically to cyst wall proteins, enabling fluorescence detection | Critical component | Not used |
| HRP-conjugated Antibodies | Catalyzes color reaction with substrate for detection | Not used | Critical component |
| TMB Substrate | Enzyme substrate that produces measurable color change | Not used | Essential for detection |
| SAFC Solution | Preserves and enriches cysts while maintaining morphology | Essential for sample preparation | Not typically used |
| Antigen-Coated Microplates | Solid phase for antigen-antibody binding | Not used | Essential component |
| Fluorescence Microscope | Visualization of fluorescently-labeled cysts | Essential equipment | Not used |
| Microplate Reader | Measures absorbance for quantitative results | Not used | Essential equipment |
The selection of appropriate reagents is critical for maintaining test performance characteristics. Commercial kits for both methods typically include standardized reagents with quality control measures, ensuring consistency across laboratories. However, researchers should validate each new lot of reagents and maintain proper storage conditions to preserve reactivity.
The comparative analysis of immunofluorescence and ELISA for Giardia detection reveals a complex landscape where methodological selection must align with specific clinical or research objectives. Immunofluorescence assays, particularly DFA, maintain their position as valuable reference standards due to their direct visualization capabilities and established diagnostic accuracy. ELISA emerges as a robust alternative for high-throughput settings, offering excellent sensitivity and specificity with greater efficiency.
The diagnostic framework of sensitivity, specificity, and predictive values provides the necessary structure for meaningful test comparison. However, these statistical measures must be interpreted in conjunction with practical considerations including available infrastructure, expertise, and clinical context. A tiered testing approach, utilizing both methods strategically, may offer the optimal pathway for accurate Giardia detection across diverse scenarios.
Future developments in molecular diagnostics, particularly PCR-based methods, may further refine this comparative landscape. Nevertheless, the fundamental principles of diagnostic test evaluation—centered on appropriate reference standards and rigorous statistical assessment—will continue to guide the evolution of Giardia detection methodologies and their application in clinical practice and research.
Operational Protocols: Implementing DFA and ELISA in Research and Diagnostic Settings
This guide provides a detailed comparison between the Direct Fluorescent Antibody (DFA) assay and Enzyme-Linked Immunosorbent Assay (ELISA) for detecting Giardia duodenalis, a common enteric protozoan parasite. The DFA procedure, often considered the gold standard in clinical and veterinary settings, is outlined from sample preparation to final fluorescence microscopy analysis. We present experimental data from multiple studies to objectively compare the diagnostic performance of these methods, providing researchers and drug development professionals with a clear framework for selecting appropriate detection methodologies based on their specific research needs.
Accurate detection of Giardia duodenalis (also known as G. intestinalis or G. lamblia) is crucial for both clinical diagnosis and research applications. This flagellate protozoan causes giardiasis, a gastrointestinal disease with over 280 million human cases annually worldwide, primarily affecting children in developing countries with poor sanitation [13] [22]. Traditional microscopic examination of stool specimens for Giardia cysts and trophozoites has limitations due to intermittent fecal excretion of the parasite, requiring multiple samples for reasonable sensitivity [13].
Immunological methods have emerged as valuable alternatives, with DFA and ELISA being two prominent techniques. The DFA method is particularly valued in research and clinical reference settings for its high sensitivity and specificity, enabling direct visualization of (oo)cysts while providing morphological confirmation [8] [23]. This guide details the standardized DFA protocol and provides experimental comparisons with ELISA to inform method selection for research and diagnostic applications.
Materials and Methods
Research Reagent Solutions
The following table details essential materials and reagents required for implementing the standardized DFA procedure for Giardia detection:
Table 1: Essential Research Reagents for DFA-based Giardia Detection
| Reagent/Material | Function/Application | Examples/Specifications |
|---|---|---|
| Commercial DFA Kit | Contains fluorescently-labeled anti-Giardia antibodies for specific cyst detection | Crypto/Giardia Cel IF (Cellabs); MERIFLUOR Cryptosporidium/Giardia (Meridian Bioscience) [3] [8] |
| Fluorescence Microscope | Visualization of fluorescently-labeled cysts | Nikon Eclipse Ci-S; requires proper filters for FITC fluorescence (excitation 490 nm, emission 525 nm) [8] |
| Centrifuge | Processing of fecal suspensions | Capable of 1,500-5,000 rpm [13] [8] |
| Sample Dilution Buffer | Dilution and homogenization of stool specimens | Typically phosphate-buffered saline (PBS) or kit-provided buffer [13] |
| Mounting Medium | Preparation of slides for microscopy | Kit-provided or commercial antifade mounting medium |
| Positive Control | Verification of assay performance | Kit-provided Giardia cysts |
| Negative Control | Establishing background fluorescence | Kit-provided negative specimen |
Standardized DFA Procedure
The DFA procedure provides a method for the specific detection of Giardia duodenalis cysts in fecal samples through antibody-mediated fluorescence. The following workflow details the critical steps from sample preparation to final interpretation.
Sample Collection and Preparation
Fecal samples should be collected fresh or stored at 4°C if processing occurs within 72 hours. For long-term storage, samples should be preserved at -20°C [13] [23]. The sample preparation process involves homogenizing 3-5 grams of fecal material in phosphate-buffered saline (PBS) or an appropriate buffer, followed by filtration through a sieve (250μm diameter) to remove large debris. The filtered suspension is centrifuged at 1,500 rpm for 10 minutes, after which the supernatant is carefully removed [8].
Staining and Microscopy
Smears are prepared from the sediment on glass slides and allowed to air dry. Following the specific commercial DFA kit instructions (e.g., Crypto/Giardia Cel IF or MERIFLUOR), the appropriate volume of fluorescein-isothiocyanate (FITC)-labeled anti-Giardia antibody is applied to cover the smear area. Slides are incubated in a humidified chamber at room temperature (typically 30-60 minutes), protected from light. After incubation, unbound antibody is removed by rinsing with wash buffer or distilled water [8] [24]. A mounting medium is applied, followed by a coverslip. Slides are examined using a fluorescence microscope with appropriate filters for FITC (excitation ~490 nm, emission ~525 nm) at 400x magnification. Giardia cysts appear as bright apple-green, oval structures measuring 8-12μm with characteristic morphology [8].
ELISA Procedure for Comparison
For comparative purposes, the ELISA procedure is summarized here. The RIDASCREEN Giardia test serves as a representative example. Briefly, 100 mg of stool is mixed with sample dilution buffer and centrifuged. The supernatant is added to microwells coated with anti-Giardia antibody. After incubation and washing, an enzyme-conjugated antibody is added. Following another incubation and wash, substrate is added. The color change is measured spectrophotometrically at 450 nm after stopping the reaction [13].
Results and Comparative Performance Data
Diagnostic Accuracy of DFA vs. ELISA
Multiple studies have evaluated the diagnostic performance of DFA and ELISA for detecting Giardia duodenalis. The following table summarizes key performance metrics from comparative studies:
Table 2: Comparative Diagnostic Performance of DFA and ELISA for Giardia Detection
| Assay Type | Study Population | Sensitivity (%) | Specificity (%) | Reference Standard | Citation |
|---|---|---|---|---|---|
| DFA | Dogs and Cats (Veterinary) | Most sensitive technique | Not specified | Bayesian Analysis | [8] |
| DFA (IFA) | Young Dogs | Benchmark (41% positivity) | Benchmark | Bayesian Analysis | [23] |
| RIDASCREEN ELISA | Human (Symptomatic) | 93 | 99 | Meta-analysis | [22] |
| RIDASCREEN ELISA | Human (Clinical) | 100 | 91.5 | Microscopy | [13] |
| ImmunoCard STAT (ICT) | Human (Symptomatic) | 84 | 99 | Meta-analysis | [22] |
| Commercial ELISA (Pooled) | Human & Animals | 96 | High | Meta-analysis | [22] |
Test Performance in Symptomatic vs. Asymptomatic Cases
A 2024 meta-analysis revealed that immunoassays, including both DFA and ELISA, demonstrate higher sensitivity in symptomatic patients (92%) compared to asymptomatic individuals (79%) [22]. This difference is clinically significant for researchers designing surveillance studies or screening programs in low-prevalence populations.
Integrated Testing Strategies and Applications
Complementary Testing Approaches
Many diagnostic guidelines, including those from the Companion Animal Parasite Council (CAPC), recommend combining centrifugal fecal flotation with an immunoassay (DFA or ELISA) for optimal Giardia detection sensitivity [3]. Research has demonstrated that combining zinc sulfate centrifugal flotation (ZSCT) with immunoassay results mitigates sensitivity differences between commercial tests [3].
The relationship between different diagnostic approaches and their appropriate applications is summarized in the following diagram:
Discussion
Method Selection Considerations
The choice between DFA and ELISA depends on specific research objectives, laboratory capabilities, and sample characteristics. DFA offers the advantage of direct morphological confirmation of cysts, which is valuable for species verification and training purposes. However, it requires a fluorescence microscope and trained personnel. ELISA platforms, particularly immunochromatographic tests, provide rapid results with less specialized equipment, making them suitable for high-throughput screening [22] [23].
The 2024 meta-analysis by Aziz et al. confirmed that commercial ELISA tests demonstrate higher pooled sensitivity (96%) compared to immunochromatographic tests (88%), explaining the performance difference between tests like RIDASCREEN Giardia (93% sensitivity) and ImmunoCardSTAT (84% sensitivity) [22].
Limitations and Future Directions
While DFA is widely regarded as a gold standard, it is not infallible. Operator expertise in fluorescence microscopy interpretation remains crucial. Additionally, the requirement for specialized equipment may limit implementation in resource-limited settings. ELISA methods, while highly specific, may detect soluble antigen even after successful treatment and parasite clearance [22].
Emerging techniques such as PCR and multiplex Luminex assays offer high sensitivity and genotyping capabilities but remain complex and expensive for routine use [22]. Future research should focus on developing more cost-effective, rapid tests that maintain high sensitivity while providing information on zoonotic potential through genotyping.
Both DFA and ELISA provide highly accurate detection of Giardia duodenalis, with the selection of method dependent on specific research or diagnostic needs. DFA serves as an excellent reference method with high sensitivity and the benefit of morphological confirmation, particularly in research and reference laboratory settings. ELISA formats, especially plate-based ELISAs, offer high throughput and sensitivity suitable for clinical screening programs. For optimal detection, particularly in subclinical infections with low cyst shedding, a combination of diagnostic methods is recommended. Researchers should consider their specific requirements for sensitivity, throughput, equipment availability, and need for morphological confirmation when selecting between these established detection methodologies.
The enzyme-linked immunosorbent assay (ELISA) is a powerful plate-based technique designed for detecting and quantifying soluble substances such as peptides, proteins, antibodies, and hormones within complex mixtures [25] [26]. Since its development in 1971 as a non-radioactive alternative to radioimmunoassays, ELISA has become a cornerstone method in research and diagnostic laboratories worldwide due to its high throughput, quantitative nature, and specificity [27] [26]. The fundamental principle of ELISA relies on the specific interaction between an antigen and an antibody, where the antibody is linked to a reporter enzyme. Detection is accomplished by measuring the activity of this reporter enzyme after incubation with a substrate that produces a measurable product, typically detected by a spectrophotometer [25] [26]. The versatility of ELISA has led to its application across diverse fields including medical diagnostics, pharmaceutical development, and biomedical research, making it an essential tool for quantifying biomarkers, detecting pathogens, and monitoring immune responses.
Core Principles and Assay Formats
Fundamental Workflow
All ELISA variants, despite their format differences, share a common fundamental workflow consisting of four core steps [25]. The process begins with coating or capture, which involves the direct or indirect immobilization of antigens to the surface of polystyrene microplate wells. This is followed by plate blocking, where irrelevant proteins or other molecules are added to cover all unsaturated surface-binding sites of the microplate wells to prevent non-specific binding. The third step is probing or detection, which involves incubation with antigen-specific antibodies that affinity-bind to the target antigens. The final step is signal measurement, where the signal generated via the direct or secondary tag on the specific antibody is detected and quantified [25]. This structured approach enables effective separation of bound and unbound materials throughout the assay, contributing to the technique's renowned specificity and sensitivity.
Comparison of Common ELISA Formats
There are several established formats for performing ELISAs, falling into either direct, indirect, or sandwich capture and detection methods [25] [27]. The key differentiating factor is how the antigen of interest is immobilized and detected.
Table 1: Comparison of Main ELISA Formats
| Format | Principle | Sensitivity | Specificity | Applications | Advantages | Disadvantages |
|---|---|---|---|---|---|---|
| Direct ELISA | Antigen immobilized directly on plate; detected with enzyme-conjugated primary antibody [25] [27] | Low | Moderate | Antigen detection | Quick; fewer steps; eliminates secondary antibody cross-reactivity [25] | Signal amplification limited; primary antibody labeling required [25] |
| Indirect ELISA | Antigen immobilized on plate; detected with unlabeled primary and enzyme-conjugated secondary antibody [25] [27] | Medium | Moderate | Antibody detection, flexible applications | High sensitivity; versatility; wide variety of labeled secondary antibodies available [25] | Potential cross-reactivity; extra incubation step required [25] |
| Sandwich ELISA | Antigen captured between two antibodies (capture and detection); detected directly or indirectly [25] [27] | High | High | Complex samples, low abundance antigens | High sensitivity and specificity; suitable for crude samples [25] | Requires antibody pair optimization; more complex [25] |
| Competitive ELISA | Sample antigen and labeled antigen compete for limited antibody binding sites [25] [27] | Variable | High | Small antigens with single epitope | Effective for small antigens; highly specific [25] | Inverse signal relationship; complex data interpretation [25] |
The most widely used ELISA format is the sandwich assay, which offers exceptional sensitivity and specificity because the target antigen must be bound between two primary antibodies—a capture antibody and a detection antibody—each recognizing a different epitope on the antigen [25] [27]. This dual-antibody requirement significantly reduces non-specific binding compared to direct or indirect formats, making it particularly suitable for analyzing complex sample matrices without extensive purification [27].
Figure 1: Generalized Sandwich ELISA Workflow. This diagram illustrates the sequential steps in a typical sandwich ELISA procedure, from plate preparation to data analysis.
Comparative Analysis: ELISA vs. Immunofluorescence for Giardia Detection
Performance Metrics in Diagnostic Detection
The diagnostic accuracy of ELISA versus direct immunofluorescence assay (DFA) has been extensively evaluated for detecting enteric protozoan parasites such as Giardia duodenalis and Cryptosporidium spp. in clinical samples. A 2024 comparative study analyzing 328 fecal samples from dogs and cats provides compelling data on the relative performance of these techniques [8] [9]. When using DFA as the gold standard, the overall prevalence of G. duodenalis was 24.4% (80/328), with significant variation between cats (11.6%) and dogs (30.2%) [8] [9]. DFA demonstrated superior sensitivity for detecting G. duodenalis in samples from both dogs and cats compared to other methods, followed by real-time PCR [8] [9]. For cryptosporidiosis, the combination of DFA and PCR technique proved most effective for identification [8] [9].
Table 2: Comparative Performance of Diagnostic Methods for Giardia and Cryptosporidium Detection
| Detection Method | Principle | Sensitivity for Giardia | Specificity for Giardia | Relative Cost | Throughput | Remarks |
|---|---|---|---|---|---|---|
| Direct Immunofluorescence (DFA) | Fluorescently labeled antibodies bind to (oo)cysts; visualized by microscopy [8] [9] | High (gold standard) [8] [9] | High (gold standard) [8] [9] | Moderate | Moderate | Allows morphological confirmation; requires specialized equipment [8] |
| ELISA (Coproantigen) | Detects soluble fecal antigens via antibody-enzyme conjugates [28] | 87.5-98.6% [28] | 96.8-100% [28] | Low | High | High throughput; subjective color interpretation [28] |
| Microscopy (MIF) | Concentration and iodine staining of cysts [8] [9] | Lower than DFA and ELISA [8] | Moderate [8] | Low | Low | Low sensitivity; operator-dependent [8] |
| PCR | DNA amplification of parasite-specific sequences [8] [9] | High (second to DFA) [8] [9] | High [8] [9] | High | Moderate | Provides genotype information; requires specialized facilities [8] |
Earlier studies comparing immunofluorescence microscopy and ELISA for detecting Cryptosporidium and Giardia infections in asymptomatic dogs further illuminate the technical differences between these methods [29]. The detection limit of IF was approximately 10⁵ (oo)cysts/g for both parasites, while Giardia ELISA demonstrated greater sensitivity, capable of detecting approximately 2.5 × 10⁴ cysts/g in inoculated fecal samples [29]. This enhanced sensitivity of ELISA comes with a trade-off in specificity, particularly for Cryptosporidium detection, where ELISA may yield false-positive results due to cross-reactivity or non-specific binding [29].
Practical Considerations for Implementation
When selecting between ELISA and DFA for diagnostic or research applications, several practical factors must be considered. DFA is recognized as a highly sensitive and specific benchmark technique in clinical veterinary settings, allowing direct visualization and morphological confirmation of (oo)cysts while providing a cost-effective approach [8] [9]. However, it requires specialized fluorescence microscopy equipment and trained personnel. In contrast, ELISA platforms offer superior throughput capacity, easier automation, and objective spectrophotometric reading, making them suitable for processing large sample volumes efficiently [27] [28]. The simplicity of ELISA procedures has led to their incorporation into rapid immunochromatographic tests, though these may suffer from limited diagnostic sensitivities and false-positive results [8] [9].
Experimental Protocols and Methodologies
Detailed ELISA Protocol for Antigen Detection
The following protocol outlines the standardized procedure for a sandwich ELISA, which can be adapted for various target antigens including Giardia coproantigens [25] [30] [26]:
Day 1: Plate Coating
- Coating Antibody Preparation: Dilute the capture antibody in carbonate-bicarbonate buffer (pH 9.4) or phosphate-buffered saline (PBS, pH 7.4) to a concentration typically between 1-15 μg/mL, depending on antibody source and purity [25] [30].
- Plate Coating: Add 50-100 μL of the antibody solution to each well of a 96-well polystyrene microplate. Clear plates are used for colorimetric detection, while white or black opaque plates are reserved for fluorescent or chemiluminescent signals [25].
- Incubation: Seal the plate and incubate for at least 4 hours at 37°C or overnight at 4°C to allow passive adsorption through hydrophobic interactions between plastic and non-polar protein residues [25].
- Washing: Discard the coating solution and wash the plate three times with PBS or Tris-buffered saline containing 0.05% Tween 20 (TBST) using an automated plate washer or manual pipetting [30] [26].
Day 2: Blocking, Sample Incubation, and Detection
- Blocking: Add 200-300 μL of blocking buffer (1-5% BSA, casein, or non-fat dry milk in PBS) to each well to cover all unsaturated binding sites. Incubate for 1-2 hours at room temperature with gentle shaking [25] [30].
- Sample Preparation: Prepare standards by serial dilution of known antigen concentrations in sample diluent. Dilute test samples (serum, plasma, fecal extracts, or cell culture supernatants) in appropriate diluents [30] [31].
- Sample Incubation: Wash plate three times. Add 50-100 μL of standards and test samples to designated wells. Include appropriate controls (blank, negative, positive). Incubate for 2 hours at room temperature or 37°C [30] [26].
- Detection Antibody Incubation: Wash plate three times. Add detection antibody (typically 0.5-10 μg/mL depending on source and purity) diluted in blocking buffer or sample diluent. Incubate for 1-2 hours at room temperature [30].
- Enzyme Conjugate Incubation: For indirect detection, wash plate and add enzyme-conjugated secondary antibody (e.g., HRP-conjugated anti-IgG at 20-200 ng/mL for colorimetric systems) [30]. Incubate for 1 hour at room temperature.
- Signal Development: Wash plate 3-5 times. Add substrate solution (e.g., TMB for HRP, pNPP for AP). Incubate for 15-30 minutes in the dark while monitoring color development [30] [26].
- Reaction Stopping: Add stop solution (e.g., 0.16M sulfuric acid for TMB, 0.5M NaOH for pNPP) when optimal color intensity is reached [26].
- Signal Measurement: Read absorbance within 30 minutes using a spectrophotometric microplate reader at the appropriate wavelength (e.g., 450 nm for TMB with acid stop, 492 nm for pNPP) [26].
Direct Immunofluorescence Assay Protocol for Giardia
The DFA protocol for Giardia and Cryptosporidium detection follows these essential steps [8] [9]:
- Sample Preparation: Process fresh or preserved fecal samples using appropriate concentration methods. Filter homogenates through sieve mesh to remove large debris.
- Slide Preparation: Apply processed samples to microscope slides and allow to air dry.
- Fixation: Fix samples with methanol or other appropriate fixatives.
- Staining: Add fluorescein-labeled anti-Giardia/Cryptosporidium monoclonal antibodies according to manufacturer's instructions. Incubate in a humidified chamber at room temperature for 30-60 minutes.
- Washing: Rinse slides gently with PBS or wash buffer to remove unbound antibody.
- Mounting: Apply coverslips using aqueous mounting medium.
- Microscopy: Examine slides using epifluorescence microscope with appropriate filters (e.g., FITC filter set at 400× magnification). Giardia cysts appear bright apple green, round to oval structures measuring 8-12 μm, while Cryptosporidium oocysts measure 4-6 μm [8] [9].
- Interpretation: Score samples based on fluorescence intensity and morphological characteristics. Include positive and negative controls in each assay run.
Figure 2: Comparative Detection Pathways: ELISA vs. DFA. This diagram illustrates the distinct signal generation and detection mechanisms in ELISA (spectrophotometric) and Direct Immunofluorescence Assay (fluorescence microscopy).
Essential Reagents and Research Toolkit
Table 3: Essential Research Reagent Solutions for ELISA Workflows
| Reagent/Category | Specific Examples | Function/Purpose | Optimization Considerations |
|---|---|---|---|
| Solid Phase | 96-well polystyrene microplates [25] [26] | Immobilization of capture antibody or antigen | Choose clear plates for colorimetry, white/black for fluorescence/chemiluminescence [25] |
| Coating Buffers | Carbonate-bicarbonate buffer (pH 9.4), PBS (pH 7.4) [25] | Provide optimal pH and ionic conditions for protein adsorption | Alkaline buffers generally enhance protein binding to polystyrene [25] |
| Capture Reagents | Purified antibodies (1-15 μg/mL), antigens [25] [30] | Specifically bind and immobilize target analyte | Concentration must be optimized; avoid "hooking" effect from over-coating [25] |
| Blocking Agents | BSA (1-5%), casein, non-fat dry milk, synthetic blockers [30] [31] | Prevent non-specific binding by saturating unused sites | Test multiple blockers; avoid those that may interfere with antibody binding [30] |
| Detection Antibodies | Primary detection antibodies, enzyme-conjugated secondaries [25] [30] | Bind to target analyte and generate detectable signal | Titrate concentration (typically 0.5-10 μg/mL); consider cross-reactivity [30] |
| Enzyme Conjugates | HRP, Alkaline Phosphatase, β-galactosidase conjugates [25] [26] | Catalyze substrate conversion to detectable product | Use recommended concentrations (HRP: 20-200 ng/mL colorimetric) [30] |
| Substrate Systems | TMB, PNPP, OPD for HRP; BCIP/NBT for AP [30] [26] | Enzyme substrates that generate colored, fluorescent, or luminescent products | Match substrate to detection instrument capabilities and sensitivity needs [30] |
| Wash Buffers | PBS or Tris with 0.05-0.1% Tween 20 [30] [26] | Remove unbound reagents while maintaining assay integrity | Optimize wash cycles (typically 3-5 washes between steps) [30] |
| Signal Stop Solutions | Sulfuric acid (0.16-2M), NaOH [26] | Terminate enzyme-substrate reaction at optimal time | Acid stops preferred for HRP/TMB; alkaline for AP/PNPP [26] |
Assay Validation and Data Analysis
Critical Validation Parameters
To ensure reliable and accurate ELISA results, several validation experiments must be performed [31] [32]. Spike and recovery experiments assess the impact of the sample matrix on the ELISA readout by adding a known amount of analyte to both the sample matrix and the standard diluent, with acceptable recovery typically falling between 80-120% [31] [32]. Dilutional linearity determines the assay's linear range by serially diluting samples and expecting normalized concentrations to remain consistent, with recoveries between 80-120% indicating acceptable linearity [31] [32]. Parallelism evaluates whether antibody binding affinity differs between the endogenous analyte and the standard curve analyte by serially diluting samples with high natural analyte concentrations [31].
Quantitative Data Analysis
ELISA data quantification relies on generating a standard curve from serial dilutions of known analyte concentrations [26] [32]. The optical density (OD) readings from standards are plotted against their concentrations, typically using a 4-parameter logistic (4-PL) regression algorithm for curve fitting [31]. The lower limit of detection, or minimal detectable dose (MDD), is calculated as two standard deviations above the mean of the zero standard replicates [32]. Precision is assessed through intra-assay variability (within experiment, %CV <10% desirable) and inter-assay variability (between experiments, %CV <15% desirable) [32]. Proper background subtraction from all data points and application of dilution factors when calculating final concentrations are essential for accurate results [31].
The comprehensive analysis of ELISA technology reveals a sophisticated yet adaptable platform for biomolecule quantification with distinct advantages and limitations compared to immunofluorescence approaches. While DFA maintains its position as a highly sensitive gold standard for morphological confirmation of pathogens like Giardia and Cryptosporidium in clinical diagnostics [8] [9], ELISA offers superior throughput, quantitative capabilities, and automation potential for large-scale studies [27] [28]. The selection between these techniques ultimately depends on specific research objectives, available resources, and required parameters—with DFA excelling in diagnostic confirmation and ELISA providing robust quantification for comparative studies. As both technologies continue to evolve, their complementary strengths ensure continued relevance in advancing biomedical research and diagnostic capabilities.
Sample Handling and Storage Considerations for Optimal Antigen Preservation
The accurate detection of pathogens like Giardia duodenalis is paramount in both clinical and research settings, with diagnostic outcomes heavily reliant on the integrity of the initial sample. The comparative accuracy of diagnostic techniques, specifically immunofluorescence assays (IFA) and enzyme-linked immunosorbent assays (ELISA), is intrinsically linked to pre-analytical procedures. Optimal antigen preservation begins from the moment of sample collection and is maintained through a chain of standardized handling and storage protocols. This guide examines the critical factors influencing antigen stability and presents experimental data comparing the performance of IFA and ELISA for Giardia detection, providing researchers and drug development professionals with evidence-based best practices to ensure data reliability.
The Critical Impact of Pre-Analytical Variables
The journey of a biological sample from collection to analysis is fraught with potential hazards that can compromise antigen integrity. In the context of Giardia and Cryptosporidium detection, improper handling can lead to false negatives or false positives, directly impacting diagnostic accuracy and subsequent research conclusions or clinical decisions [33] [34].
Sample degradation can occur through several mechanisms:
- Enzymatic Activity: Endogenous proteases and DNases present in samples can degrade protein and nucleic acid targets if not promptly inhibited [34].
- Temperature Excursions: Even brief deviations from recommended storage temperatures can accelerate degradation processes. For instance, slow freezing at -20°C can cause damaging ice crystal formation in cells and tissues [35].
- Repeated Freeze-Thaw Cycles: Each thawing cycle risks protein denaturation and aggregation, leading to a loss of conformational epitopes critical for antibody recognition in immunoassays [34].
The consequences of inadequate storage are severe, leading to inaccurate data, irreproducible results, unexpected delays, and increased costs. For rare or irreplaceable samples, such as patient biopsies, loss of integrity can halt a project entirely [35]. Therefore, a robust sample management system is not just a best practice but a fundamental necessity for reliable scientific outcomes.
Best Practices in Sample Handling and Storage
Adhering to standardized protocols from collection to storage is the most effective strategy for preserving native antigen structures.
Temperature and Preservation Strategies
Choosing the correct storage temperature is fundamental and depends on the sample matrix and intended analysis.
Table 1: Optimal Storage Conditions for Biological Samples
| Storage Temperature | Suitable Sample Types | Key Considerations |
|---|---|---|
| Room Temperature (15–27°C) | Samples in protective solutions (e.g., formalin, paraffin); some DNA/RNA with chemical stabilizers [35] | Requires climate control to avoid fluctuations [35] |
| Refrigeration (2–8°C) | Short-term storage of reagents, buffers, freshly collected tissues, or blood [35] | Ideal for samples accessed frequently; not for long-term preservation |
| Freezer (-20°C) | DNA, RNA, and reagents unstable at higher temperatures [35] | Freezing can be slow, risking ice crystal damage; use small aliquots [35] |
| Ultra-Low Freezer (-80°C) | Long-term storage of tissues, cells, and proteins; ideal for retrospective studies [35] [34] | Effectively stops most enzymatic activity; preferred for proteins/nucleic acids [34] |
| Cryogenic (-150°C or lower) | Complex tissues, stem cells, embryos; long-term storage [35] | Suspends all biological activity; mechanical freezers minimize cross-contamination risk [35] |
For DNA-based analyses, a emerging trend is sample dehydration, which allows for long-term room temperature storage at reduced costs without compromising results [33]. Furthermore, recent research indicates that using a common food additive, EDTA, as a preservative can superiorly preserve DNA in tissue samples compared to traditional ethanol immersion by chelating metal ions required by DNA-degrading enzymes [36].
Sample Handling and Workflow
Proper handling is equally critical:
- Minimize Freeze-Thaw Cycles: Aliquot samples into single-use volumes to avoid repeated thawing of the entire batch [34].
- Rapid Processing: Process and stabilize samples promptly after collection to mitigate degradation.
- Use of Cryoprotectants: For cells and tissues, agents like DMSO or glycerol help prevent ice crystal damage during freezing [34].
- Clear Labeling and Tracking: Use unambiguous, machine-readable labels (barcodes, QR codes, RFID) compatible with storage conditions and maintain a robust electronic system for sample tracking [33].
The diagram below illustrates the recommended workflow for sample handling to ensure optimal antigen preservation.
Comparative Accuracy: Immunofluorescence vs. ELISA for Giardia Detection
The choice of diagnostic method significantly impacts the detection sensitivity for pathogens like Giardia. Direct Fluorescence Assay (DFA) and ELISA are widely used, but their performance varies.
Experimental Data and Performance Comparison
A 2024 comparative study evaluating diagnostic methods for detecting Giardia duodenalis and Cryptosporidium spp. in canine and feline fecal samples used DFA as the gold standard. The results demonstrate clear differences in performance [8].
Table 2: Comparative Diagnostic Performance for Giardia duodenalis Detection
| Diagnostic Method | Principle | Sensitivity | Specificity | Overall Prevalence by this Method |
|---|---|---|---|---|
| Direct Immunofluorescence (DFA) | Fluorescently-labeled antibodies bind (oo)cysts [8] | 100% (Gold Standard) [8] | 100% (Gold Standard) [8] | 24.4% (80/328) [8] |
| Real-time PCR | Detection of pathogen DNA [8] | High (lower than DFA) [8] | High [8] | Not Specified |
| Lateral Flow Immunochromatography (ICT) | Detects coproantigens [8] | Lower than DFA [8] | Lower than DFA; false positives reported [8] | Not Specified |
| Merthiolate-Iodine-Formalin (MIF) | Microscopy of concentrated cysts [8] | Lower than DFA [8] | Lower than DFA [8] | 22.7% in dogs, 7.8% in cats [8] |
Another study from 2023 evaluating a lateral-flow immunochromatography test (QC) for concurrent detection of Giardia and Cryptosporidium reinforced these findings. The QC test showed high specificity (95-98%) for both pathogens, meaning positive results are reliable. However, its sensitivity was low (38-48% for Giardia, 25-40% for Cryptosporidium), indicating a high rate of false negatives [37]. This aligns with the 2024 study's conclusion that DFA is the most sensitive technique for detecting Giardia [8].
A 2017 study comparing five diagnostic tests for Giardia in young dogs found almost perfect agreement between DFA, zinc sulfate centrifugal flotation (ZSCT), and the SNAP Giardia test (an ELISA-based method). It concluded that the SNAP test is a reliable, affordable, and fast option for veterinary clinics [23].
Detailed Experimental Protocols
To ensure reproducibility and understanding of the comparative data, the core methodologies for DFA and ELISA are outlined below.
Direct Immunofluorescence Assay (DFA) Protocol
The following protocol is adapted from the 2024 comparative study [8]:
- Sample Preservation: Fecal samples (approximately 0.1 g) are placed in a microcentrifuge tube containing formalin and stored at room temperature.
- Slide Preparation: A smear is prepared from the preserved sample.
- Staining: The commercial DFA kit (e.g., Crypto/Giardia Cel IF) is used. Fluorescein-isothiocyanate (FITC)-labeled monoclonal antibodies are applied to the smear, which bind specifically to Giardia cysts and Cryptosporidium oocysts.
- Incubation and Washing: The slide is incubated as per manufacturer instructions, then washed to remove unbound antibody.
- Microscopy: The slide is examined using a fluorescence microscope at 400x magnification.
- Interpretation: Giardia cysts (8–12 μm) and Cryptosporidium oocysts (4–6 μm) that are round to oval and stain bright apple green are considered positive.
This method's superiority lies in the specific antibody staining, which makes (oo)cyst identification easier and more accurate than conventional microscopy [23].
Indirect ELISA Protocol
The following general protocol for an indirect ELISA, designed to detect antibodies, is based on established principles [26] and mirrors the development of specific tests like that for bovine herpesvirus [38]:
- Coating: A 96-well microplate is coated with a known purified antigen (e.g., recombinant Giardia protein) diluted in phosphate-buffered saline (PBS). Plates are incubated overnight at 4°C.
- Blocking: After washing with PBS containing a mild detergent (e.g., Tween-20) to remove unbound antigen, the plate is blocked with a protein solution (e.g., 4% skim milk, 5% skim milk powder, or BSA) for 1-2 hours at room temperature to prevent non-specific binding.
- Sample Incubation: The blocking solution is discarded, and the test sample (e.g., serum, plasma) is added to the wells. The plate is incubated to allow specific antibodies, if present, to bind to the immobilized antigen.
- Conjugate Incubation: After washing, an enzyme-labeled secondary antibody (conjugate) specific to the primary antibody (e.g., anti-human IgG) is added. Common enzymes include Horseradish Peroxidase (HRP) or Alkaline Phosphatase (AP).
- Substrate Reaction: Following a final wash, a substrate solution is added. For HRP, Tetramethylbenzidine (TMB) is common, producing a blue color.
- Stop and Read: The enzyme-substrate reaction is stopped after a set time with an acidic solution (e.g., H₂SO₄), which changes the color to yellow. The intensity of the color, measured as optical density (OD) at 450 nm on a spectrophotometer, is proportional to the amount of antibody in the sample.
Essential Research Reagent Solutions
The reliability of any diagnostic assay hinges on the quality of its core components. The following table details key reagents and their critical functions in assays like IFA and ELISA.
Table 3: Key Reagents for Immunofluorescence and ELISA
| Research Reagent | Function in Assay |
|---|---|
| Monoclonal/Polyclonal Antibodies | Primary detection tools that provide specificity by binding to target antigens [34] [38]. |
| Fluorophore-Labeled Conjugates (e.g., FITC) | Used in IFA to tag antibodies, allowing visualization of antigen-antibody complexes under a fluorescence microscope [8] [23]. |
| Enzyme-Labeled Conjugates (e.g., HRP, AP) | Critical for ELISA; the enzyme catalyzes a reaction with a substrate to produce a measurable color change [26] [38]. |
| Chromogenic Substrates (e.g., TMB) | Molecules that react with the enzyme (e.g., HRP) in the conjugate to produce a colored product, enabling quantification [26]. |
| Blocking Agents (e.g., BSA, Skim Milk) | Proteins or solutions used to cover non-specific binding sites on the solid phase (e.g., microplate wells), reducing background noise and improving signal-to-noise ratio [26] [38]. |
| Protein A/G Resins | Used for the purification of antibodies from antiserum, ensuring high-quality reagents for assay development [38]. |
The integrity of diagnostic and research outcomes is fundamentally rooted in the pre-analytical phase. Rigorous adherence to sample handling and storage best practices—including prompt processing, correct temperature maintenance, and minimization of freeze-thaw cycles—is non-negotiable for optimal antigen preservation. Experimental evidence consistently demonstrates that Direct Immunofluorescence Assay (DFA) remains the most sensitive standalone method for the detection of Giardia and Cryptosporidium (oo)cysts. However, ELISA platforms offer valuable, rapid alternatives with high specificity, particularly suited for high-throughput screening. The choice between these techniques should be guided by the specific research or clinical context, available resources, and the paramount requirement for well-preserved samples, which ultimately underpin the accuracy and reproducibility of all subsequent results.
The accurate detection of Giardia duodenalis is a critical concern in both clinical and veterinary diagnostics, influencing patient treatment and public health interventions. The choice of diagnostic method often centers on a fundamental trade-off between directly visualizing the pathogenic structures and quantifying molecular markers of infection. This guide provides a detailed comparison of two principal methodologies: immunofluorescence assays (IFA), which offer direct visualization of cysts, and enzyme-linked immunosorbent assays (ELISA), which provide a quantitative measure of parasitic antigens. Framed within broader research on comparative accuracy, this analysis equips researchers and scientists with the experimental data and protocols necessary to inform their diagnostic choices and assay development.
Methodological Comparison: Core Principles and Workflows
The two techniques operate on distinct principles, from sample preparation to data interpretation. The following workflow outlines the key stages involved in each method, highlighting their fundamental differences.
Immunofluorescence Assay (IFA): Visualizing Cysts
IFA relies on the specific binding of fluorescently-labeled antibodies to surface antigens of Giardia cysts, enabling their direct visualization under a fluorescence microscope. Cysts appear as bright apple-green, oval structures of 8-12 μm [8]. The method's strength lies in providing morphological confirmation, but the results can be subject to interpreter variability [8].
Detailed IFA Protocol
The following protocol is adapted from studies using commercial kits (e.g., Crypto/Giardia Cel IF) for fecal samples [8]:
- Sample Preparation: Emulsify 1-2 grams of fecal sample in 10 mL of phosphate-buffered saline (PBS). Filter the homogenate through a sieve (e.g., 250 μm mesh) to remove large debris. Centrifuge the filtered suspension at 1,500 rpm for 10 minutes and discard the supernatant [8].
- Staining: Apply the resulting sediment to a welled slide. Add the fluorescein-labeled monoclonal antibody specific for Giardia cysts as per the manufacturer's instructions. Incubate in a humidified chamber for the specified time (typically 30-60 minutes) at room temperature, protected from light.
- Washing and Mounting: Gently rinse the slide with PBS to remove unbound antibody. Apply a coverslip with a glycerol-based mounting medium.
- Microscopy and Interpretation: Examine the slide using a fluorescence microscope at 400x magnification. Identify Giardia cysts based on their characteristic size (8-12 μm), shape, and bright apple-green fluorescence [8]. The result is a direct cyst count.
Enzyme-Linked Immunosorbent Assay (ELISA): Quantifying Optical Density
ELISA detects soluble Giardia antigens in fecal samples through an antibody-enzyme reaction, yielding a quantitative Optical Density (OD) value. It does not provide visual confirmation of intact cysts but offers higher throughput and objective quantification [29].
Detailed ELISA Protocol
The following protocol outlines the key steps for a sandwich Ag-ELISA, consistent with methodologies used in parasitic antigen detection [39]:
- Plate Coating: Coat the wells of a 96-well microtiter plate with a capture antibody (e.g., monoclonal anti-Giardia antibody). Incubate for 1 hour at 37°C, then wash with PBS-Tween (0.05%) to remove unbound antibody [40].
- Blocking: Block the wells with a protein-based solution like 10% goat serum in PBS-Tween to prevent non-specific binding. Incubate, then wash [40].
- Sample and Control Addition: Add prepared fecal supernatants (antigen extract), positive controls, and negative controls to the respective wells. Incubate for 1 hour at 4°C to allow antigen-antibody binding, then wash [40].
- Detection Antibody Addition: Add a second, enzyme-conjugated detection antibody (e.g., horseradish peroxidase-conjugated anti-Giardia antibody) to the wells. Incubate for 1 hour at 37°C, then wash thoroughly [40].
- Substrate Reaction and Measurement: Add an enzyme substrate (e.g., Tetramethylbenzidine - TMB). Incubate for a fixed time (e.g., 10 minutes) until color develops. Stop the reaction with 2.5 N sulfuric acid. Measure the intensity of the color change, which is proportional to the antigen concentration, using a plate reader at the appropriate wavelength (e.g., OD405) [40]. The result is a numerical OD value.
Comparative Performance Data
The core difference between visualizing cysts and quantifying OD translates directly into divergent diagnostic performance. The table below summarizes key metrics from comparative studies.
Table 1: Comparative Diagnostic Performance of IFA and ELISA for Giardia Detection
| Diagnostic Metric | Immunofluorescence Assay (IFA) | Enzyme-Linked Immunosorbent Assay (ELISA) |
|---|---|---|
| Overall Sensitivity | 100% (Used as Gold Standard) [8] | 88.9% [29] |
| Overall Specificity | 100% (Used as Gold Standard) [8] | 97.8% [29] |
| Detection Limit | Approximately 10⁵ cysts/g (Sporadic detection at lower levels) [29] | Approximately 2.5x10⁴ cysts/g [29] |
| Key Advantage | Direct visualization and morphological confirmation of cysts; high specificity established as benchmark [8]. | Higher throughput; objective, quantitative result (OD); less reliance on technical expertise [29]. |
| Key Limitation | Subjective interpretation potential; lower throughput; requires skilled personnel [8]. | Cannot differentiate cyst morphology or viability; potential for false positives/negatives [29]. |
| Quantitative Output | Cyst count (semi-quantitative) | Optical Density (OD) value (quantitative) |
The Scientist's Toolkit: Essential Research Reagents
Successful implementation of either IFA or ELISA requires a suite of specific reagents and tools. The following table details essential items for both methodologies.
Table 2: Essential Research Reagents for Giardia Detection Assays
| Item | Function/Description | Example Use Case |
|---|---|---|
| Fluorescein-Labeled Monoclonal Antibody | Binds specifically to Giardia cyst wall antigens, enabling fluorescence under blue light [8]. | Core reagent in IFA for specific cyst staining and visualization [8]. |
| Welled Microscope Slides | Multi-well glass slides for processing multiple samples simultaneously for IFA. | Holding and processing fecal samples during the IFA staining procedure [8]. |
| Fluorescence Microscope | Microscope with appropriate filters to excite the fluorochrome and detect emitted light. | Essential equipment for reading and interpreting IFA slides [8]. |
| Capture and Detection Antibodies (Matched Pair) | A matched pair of monoclonal antibodies that bind to different epitopes of the target antigen in a sandwich ELISA [39]. | Core reagents for coating the plate and detecting the antigen in Ag-ELISA formats [39]. |
| Microtiter Plates | 96-well plates typically made of polystyrene, optimized for protein binding. | Solid phase for the immobilization of capture antibodies and subsequent ELISA reactions [40]. |
| Enzyme Substrate (e.g., TMB) | A chromogenic substrate that produces a color change when cleaved by the conjugated enzyme (e.g., HRP). | Added in the final step of ELISA to generate a measurable signal proportional to antigen concentration [40]. |
| Plate Reader (Spectrophotometer) | Instrument that measures the optical density (OD) of light passing through the solutions in the microtiter plate. | Used to obtain quantitative results from the ELISA by reading the absorbance of the reacted substrate [40]. |
The decision between IFA and ELISA for Giardia detection is not a matter of identifying a universally superior technique but of selecting the right tool for the specific research question and context. IFA, with its direct visualization and high diagnostic accuracy, remains the gold standard for definitive morphological confirmation and is ideal for low-throughput, high-stakes diagnostics [8]. In contrast, ELISA, with its quantitative OD output and capacity for automation, excels in high-throughput screening and epidemiological studies where objective quantification and efficiency are paramount [29]. Understanding the interpretation criteria—visual versus quantitative—enables researchers to make informed decisions that optimize accuracy, throughput, and resource allocation in their pursuit of effective diagnostic and therapeutic solutions.
Enhancing Diagnostic Precision: Overcoming Limitations and Improving Test Performance
Intermittent cyst shedding, a biological process where infected hosts do not consistently release parasites in every stool sample, presents a fundamental challenge in the accurate detection of Giardia duodenalis [41]. This phenomenon, combined with the inherent limitations of diagnostic tests, directly compromises clinical sensitivity—the probability that a test will correctly identify an infected host [41]. Disentangling the effects of intermittent shedding from imperfect test sensitivity is critical for understanding true infection rates, transmission dynamics, and for the rigorous evaluation of diagnostic test performance [41]. Within this context, Direct Immunofluorescence Assay (DFA) and Enzyme-Linked Immunosorbent Assay (ELISA) have emerged as leading techniques, whose comparative accuracy must be evaluated against the backdrop of erratic cyst excretion.
Comparative Performance of DFA and ELISA
Extensive comparative studies have established the performance characteristics of DFA and ELISA for detecting Giardia. The tables below summarize key quantitative findings from recent research.
Table 1: Overall Diagnostic Performance of DFA and ELISA
| Test Method | Sensitivity (%) | Specificity (%) | Notes | Source |
|---|---|---|---|---|
| Direct Immunofluorescence Assay (DFA) | - | - | Considered the gold standard for detection of Giardia cysts in fecal samples [8] [18]. | |
| Microtiter Plate ELISA | 94.1 | 97.4 | Compared to DFA as reference standard [5] [18]. | |
| Rapid In-Clinic ELISA (SNAP Giardia) | 87.1 | 93.4 | Compared to DFA as reference standard [5] [18]. |
Table 2: Performance of Various In-Clinic Rapid Tests (ELISA-based) vs. DFA
| In-Clinic Test | Sensitivity (%) | Specificity (%) | Prevalence Adjusted Agreement (%) |
|---|---|---|---|
| SNAP Giardia Test | 87.1 | 93.4 | 93.1 |
| Anigen Rapid Test | 80.2 | 80.3 | 80.3 |
| Witness Giardia Test | 73.3 | 71.1 | 71.2 |
| VetScan Rapid Test | 70.0 | 85.5 | 84.7 |
Source: Adapted from [5] [18].
The data consistently show that DFA is held as the reference standard against which other tests are validated [8] [18]. Microtiter plate ELISA demonstrates high sensitivity and specificity in a reference lab setting, while among rapid in-clinic tests, the SNAP Giardia test shows the highest agreement with DFA results [5] [18].
The Critical Impact of Intermittent Shedding
Intermittent shedding is not merely a nuisance variable but a core component of detection probability. Research on paediatric Giardia infections has quantified the per-sample probability of cyst shedding (given infection) at approximately θ ≈ 0.44 [41]. This means that even with a hypothetically perfect test (100% sensitivity), the probability of detecting Giardia in a single sample from an infected child would be only about 44% [41].
The overall probability of detection given an infection, known as the clinical sensitivity, is the product of two probabilities: (1) the probability that the target is available in the sample (θ, reflecting shedding), and (2) the probability that the test detects the target when it is available (p, reflecting narrow-sense test sensitivity) [41]. Therefore: Pr(d | i) = θ × p
This relationship explains why simply improving test sensitivity in the lab has limited returns if shedding probability is low. To overcome this, the standard recommendation is to test multiple stool samples collected over several days [42] [43]. Pooling three replicate samples can increase the probability of detecting an infected host to approximately 82% [θ ≈ 1 - (1 - 0.44)^3] [41]. This underscores the necessity of multi-sample protocols for high diagnostic accuracy in both clinical practice and research.
Experimental Protocols for Method Comparison
The following detailed methodologies are representative of protocols used to generate the comparative data cited in this article.
Direct Fluorescence Assay (DFA) Protocol
- Sample Preparation: A 0.1 g aliquot of feces is added to 900 μL of phosphate-buffered saline (PBS) and mixed thoroughly. A serial dilution is performed by transferring 100 μL of this mixture to a second tube containing 900 μL of PBS [5] [18].
- Staining: A 100 μL aliquot from the second tube is mixed with 5 μL of a fluorescein isothiocyanate (FITC)-labeled anti-Giardia monoclonal antibody reagent (e.g., Merifluor) [5] [18].
- Incubation: The mixture is incubated at room temperature for 30 minutes in the dark [5] [18].
- Microscopy: A defined volume (e.g., 10.5 μL) of the stained preparation is placed under a coverslip and examined using a fluorescence microscope at 200x to 400x magnification. Giardia cysts are identified by their characteristic size (8-12 μm), shape, and bright apple-green fluorescence [8] [18].
- Result Interpretation: The sample is considered positive if any fluorescing cysts are identified. The procedure can be quantitative, with results reported as cysts per gram of feces [5] [18].
Microtiter Plate ELISA Protocol
- Sample Preparation: Stool samples are processed according to the manufacturer's instructions for the specific kit (e.g., ProSpecT Giardia/Cryptosporidium Microplate Assay). This typically involves dilution of fecal material in a provided sample diluent [5].
- Antigen Capture: An aliquot of the diluted sample is transferred to a microtiter plate well coated with anti-Giardia antibody and incubated, allowing Giardia cyst wall antigen (GSA-65) to bind [5] [19].
- Detection: After washing, an enzyme-conjugated antibody (e.g., horseradish peroxidase conjugate) is added, which binds to the captured antigen. Following another wash, a substrate solution is added [19].
- Signal Measurement: The enzyme catalyzes a color change in the substrate. The reaction is stopped, and the optical density (OD) is read spectrophotometrically at 450 nm [5].
- Result Interpretation: A sample is considered positive when the net OD (sample OD minus negative control OD) meets or exceeds a pre-defined cutoff value (e.g., ≥ 0.05) [5].
Visualizing Diagnostic Pathways and Shedding Impact
The following diagrams illustrate the core concepts of the diagnostic workflow and the mathematical impact of intermittent shedding.
Diagnostic Workflow for Giardia Detection
Impact of Shedding and Sensitivity on Detection
The Scientist's Toolkit: Key Research Reagent Solutions
The following table details essential materials and reagents used in the featured experiments for Giardia detection.
Table 3: Essential Research Reagents for Giardia Detection
| Reagent / Kit | Function / Application | Key Characteristics |
|---|---|---|
| Merifluor Cryptosporidium/Giardia Kit | Direct Fluorescence Assay (DFA) for (oo)cyst detection [5] [18]. | FITC-labeled monoclonal antibodies; considered reference standard; allows cyst quantification [8]. |
| ProSpecT Giardia Microplate Assay | Microtiter plate ELISA for antigen detection [5] [18]. | Detects Giardia-specific cyst wall antigen (GSA-65); high throughput; spectrophotometric readout [5] [19]. |
| SNAP Giardia Test | Rapid in-clinic ELISA for antigen detection [5] [18]. | Immunochromatographic cartridge; visual or instrument read; results in minutes [5]. |
| ZnSO4 Solution (Specific Gravity 1.18) | Flotation medium for cyst concentration prior to microscopy [3] [5]. | Enriches cysts from fecal debris; used in O&P examinations and can precede DFA staining [42]. |
| SAF (Sodium Acetate-Acetic Acid-Formalin) Solution | Fecal preservative and sediment concentration [19] [42]. | Preserves cyst morphology; suitable for staining, IFA, and concentration procedures [19]. |
The accurate detection of Giardia duodenalis is fundamentally constrained by the biological reality of intermittent cyst shedding. While method-specific performance is critical—with DFA serving as a sensitive gold standard and ELISA offering high-throughput utility—the probability of cyst presence in any single sample remains a powerful confounding variable. Researchers and clinicians must therefore integrate robust multi-sampling protocols with a clear understanding of test performance characteristics to accurately determine infection status, assess drug efficacy, and elucidate the true epidemiology of this pervasive parasite.
The accurate detection of Giardia duodenalis is a critical concern in both veterinary and human medicine, as this protozoan parasite is a common cause of infectious diarrhea [8] [9]. Diagnostic challenges arise from the intermittent shedding of cysts and the presence of non-pathogenic particles that can be mistaken for parasites in fecal samples [19]. No single diagnostic method is perfect, each possessing distinct advantages and limitations in sensitivity, specificity, technical requirements, and cost-effectiveness [19] [37].
This guide objectively compares the performance of three cornerstone diagnostic techniques—Direct Immunofluorescence Assay (DFA), Enzyme-Linked Immunosorbent Assay (ELISA), and Fecal Flotation. Within the broader thesis on the comparative accuracy of immunofluorescence versus ELISA for Giardia detection, we provide researchers and scientists with experimental data and protocols to inform strategic test selection and combination. The optimal integration of these methods maximizes detection sensitivity and specificity, crucial for effective clinical management, drug development efficacy trials, and public health surveillance.
Comparative Performance Analysis of Diagnostic Methods
Quantitative Performance Metrics
Extensive comparative studies have evaluated the diagnostic performance of DFA, ELISA, and fecal flotation, using DFA as the benchmark gold standard in many investigations due to its high sensitivity and specificity [8] [9].
Table 1: Performance Characteristics of Giardia Diagnostic Methods Compared to DFA
| Diagnostic Method | Sensitivity (%) | Specificity (%) | Overall Agreement with DFA (%) | Key Advantages | Major Limitations |
|---|---|---|---|---|---|
| Direct Immunofluorescence Assay (DFA) | ~100 (Gold Standard) | ~100 (Gold Standard) | 100 | High sensitivity & specificity; visual confirmation of (oo)cysts; cost-effective [8] [9]. | Requires fluorescent microscope; trained personnel [5] [18]. |
| Reference ELISA (Microplate) | 94.1 [5] [18] | 97.4 [5] [18] | High | High throughput; objective spectrophotometric reading [5] [19]. | Detects antigen even post-treatment; requires lab equipment [19]. |
| In-Clinic Rapid Tests (e.g., SNAP Giardia) | 87.1 [5] [18] | 93.4 [5] [18] | 93.1 [5] [18] | Rapid results (minutes); easy to use in-clinic [5]. | Lower sensitivity than DFA/ELISA; visual interpretation [5] [37]. |
| Fecal Flotation (O&P) | 81.2 [5] [18] | 93.4 [5] [18] | 92.7 [5] | Low cost; detects other parasites simultaneously [19]. | Low sensitivity; intermittent shedding; expertise needed [8] [19]. |
Analysis of Performance Data
The data reveals a clear hierarchy in test performance. DFA consistently demonstrates superior accuracy, reaffirming its position as the gold standard in comparative studies [8] [9]. Laboratory-based ELISA tests show excellent agreement with DFA, making them a robust high-throughput alternative for reference laboratories [5] [19]. However, a study evaluating a rapid ELISA for use in sheep reported 0% sensitivity, highlighting that test performance can vary significantly across species and that assays must be validated for their intended use [44].
In-clinic rapid tests, while convenient, exhibit variable performance. Among the tests evaluated, the SNAP Giardia test showed the highest sensitivity (87.1%) and specificity (93.4%), whereas other tests like the Witness Giardia test demonstrated lower sensitivity (73.3%) and specificity (71.1%) [5]. This underscores the importance of selecting a well-validated in-clinic test and understanding that a negative result does not definitively rule out infection, especially in high-prevalence settings [37].
Conventional fecal flotation via microscopy demonstrates the lowest sensitivity among the methods, as it is highly dependent on examiner expertise and suffers from the intermittent shedding of cysts [5] [8]. Its specificity is also not absolute, as yeast and debris can be misidentified as Giardia cysts [19].
Detailed Experimental Protocols
To ensure reproducibility and standardization of results across different laboratories, detailed methodologies for key experiments are provided below.
Direct Immunofluorescence Assay (DFA) Protocol
Principle: This method uses fluorescently labeled monoclonal antibodies that specifically bind to surface antigens on Giardia cysts and Cryptosporidium oocysts, allowing for their visualization and enumeration under a fluorescence microscope [5] [8].
Materials:
- Commercial DFA kit (e.g., Merifluor Cryptosporidium/Giardia, Crypto/Giardia Cel IF)
- Fluorescence microscope with appropriate filters
- Micropipettes and tips
- Glass slides and coverslips
- Centrifuge and centrifuge tubes
- Phosphate-Buffered Saline (PBS)
Procedure:
- Sample Preparation: Emulsify 0.1 to 0.5 g of feces in 1-5 mL of PBS. Filter the suspension through a sieve to remove large debris [8].
- Sample Dilution: Prepare a serial dilution in PBS. For example, add 100 µL of the initial suspension to 900 µL of PBS and mix thoroughly [5].
- Staining: Combine an aliquot of the diluted sample (e.g., 100 µL) with the fluorescent antibody reagent (e.g., 5 µL of Merifluor detection reagent). Incubate at room temperature for 30-45 minutes in the dark [5] [37].
- Microscopy: After incubation, place a portion of the mixture (e.g., 10-15 µL) on a microscope slide, apply a coverslip, and examine under 200-400x magnification using a fluorescence microscope [8] [37].
- Interpretation: Giardia cysts (8-12 µm) and Cryptosporidium oocysts (4-6 µm) will appear as bright apple-green, spherical or oval structures. A sample is considered positive if at least one cyst/oocyst is identified [8].
Microtiter Plate ELISA Protocol
Principle: This assay detects soluble Giardia-specific antigens (e.g., CWP-1) present in fecal samples using antibodies immobilized in a microtiter plate [5] [19].
Materials:
- Commercial microtiter plate ELISA kit (e.g., ProSpecT Giardia Microplate Assay)
- Microplate washer and reader (spectrophotometer capable of reading 450 nm)
- Micropipettes and tips
- Incubator
Procedure:
- Sample Preparation: Dilute fecal samples according to the manufacturer's instructions (typically 1:5 to 1:10 in a provided diluent) [44].
- Plate Preparation: Add 100 µL of diluted sample, positive control, and negative control into respective wells of the antibody-coated plate.
- Incubation and Washing: Incubate the plate at room temperature for 60 minutes. Wash the plate thoroughly several times to remove unbound material.
- Conjugate Incubation: Add enzyme-conjugated detection antibody to each well. Incubate for 30-60 minutes, followed by another wash cycle.
- Substrate Reaction: Add enzyme substrate (e.g., TMB) to each well and incubate for 10-30 minutes in the dark for color development.
- Stop and Read: Add stop solution to terminate the reaction. Read the optical density (OD) at 450 nm within 30 minutes.
- Interpretation: Calculate a cutoff value as per the kit instructions (e.g., mean OD of negative controls + 0.05). Samples with an OD above the cutoff are considered positive [5].
Fecal Flotation Protocol (Zinc Sulfate Centrifugation)
Principle: This technique uses a high-specific-gravity solution (zinc sulfate, ZnSO₄) to separate parasite cysts and ova from fecal debris through centrifugation, floating them to the surface for microscopic examination [5] [18].
Materials:
- Zinc sulfate solution (specific gravity 1.18-1.20)
- Centrifuge and centrifuge tubes (with round bottoms)
- Fecal loops or applicator sticks
- Microscope slides and coverslips
- Microscope
Procedure:
- Sample Preparation: Emulsify 1-5 g of feces in 10-15 mL of tap water or saline. Filter the suspension through a sieve or gauze into a cup.
- Centrifugation: Pour the filtered suspension into a centrifuge tube. Centrifuge at 500-650 x g for 5-10 minutes. Decant the supernatant.
- Flotation: Re-suspend the pellet in zinc sulfate solution to fill the tube, forming a positive meniscus. Place a coverslip on top of the tube.
- Second Centrifugation: Centrifuge at 500-650 x g for 5-10 minutes. Carefully remove the coverslip and place it on a microscope slide.
- Microscopy: Examine the entire area under the coverslip systematically at 100x and 400x magnification.
- Interpretation: Identify Giardia cysts based on their characteristic size (8-12 µm), oval shape, and internal structures (axostyles, median bodies) [19]. Note that cysts can be distorted by flotation solutions [19].
Strategic Test Combination Workflow
A strategic combination of diagnostic tests, rather than reliance on a single method, significantly enhances detection sensitivity and specificity. The following workflow is recommended for maximum detection efficiency.
This integrated diagnostic algorithm leverages the strengths of each method. Fecal flotation provides a broad, low-cost initial screen for a range of parasites, while the antigen test (ELISA or a validated rapid test) offers high sensitivity for Giardia-specific antigen detection [5] [19]. In cases of discordance between these two initial tests—for example, a positive antigen test with a negative flotation, which can occur due to intermittent cyst shedding or antigen presence without intact cysts—the sample is referred for definitive confirmation by DFA [8] [9]. For research purposes or in cases of public health concern, a positive result can be further investigated with PCR to determine the Giardia assemblage, providing critical information on zoonotic potential [19].
Research Reagent Solutions Toolkit
Table 2: Essential Research Reagents and Materials for Giardia Detection
| Item | Specific Example | Function in Experiment |
|---|---|---|
| Commercial DFA Kit | Merifluor Cryptosporidium/Giardia (Meridian Biosciences) [5] [37] | Provides fluorescently-labeled antibodies and controls for specific detection and visualization of cysts/oocysts. |
| Commercial ELISA Kit | ProSpecT Giardia Microplate Assay (Thermo Fisher Scientific) [5] [44] | Contains pre-coated plates, antibodies, and reagents for high-throughput, instrument-based antigen detection. |
| In-Clinic Rapid Test | SNAP Giardia Test (IDEXX) [5] [18] | Offers a single-use, rapid immunochromatographic assay for in-clinic antigen detection. |
| Flotation Solution | Zinc Sulfate (ZnSO₄, sp. gr. 1.18-1.20) [5] [18] | A high-specific-gravity solution used to float parasite elements to the surface for microscopy. |
| Fluorescence Microscope | Nikon Eclipse Ci-S [8] | Essential equipment for reading DFA tests, requiring specific filters to visualize fluorescent antibodies. |
| Microplate Reader | Spectrophotometer (450 nm) [5] | Instrument for objectively measuring colorimetric change in ELISA tests to determine positive/negative results. |
The strategic combination of DFA, ELISA, and fecal flotation creates a powerful diagnostic framework that overcomes the limitations of any single method. Experimental data consistently shows that while DFA stands as the most accurate single test, its combination with antigen detection methods like ELISA significantly enhances diagnostic workflows, especially in cases of low-level or intermittent shedding [5] [8] [9].
For researchers and drug development professionals, the choice and combination of tests should be guided by the specific objectives of the study—whether it is maximum diagnostic certainty, high-throughput screening, or genotyping for zoonotic potential assessment. The protocols and workflow provided herein offer a robust foundation for designing studies that require highly accurate Giardia detection, ensuring reliable data for clinical trials and epidemiological research.
In the field of diagnostic test evaluation, the absence of a perfect gold standard presents a significant methodological challenge. Bayesian statistical analysis has emerged as a powerful solution, enabling researchers to estimate test accuracy and disease prevalence without relying on error-free reference tests. This approach is particularly valuable in parasitology, where it has shed new light on the comparative performance of diagnostic techniques for detecting pathogens like Giardia duodenalis. This review explores the foundational concepts of Bayesian analysis in diagnostic medicine, provides a detailed comparison of immunofluorescence assay (IFA) and enzyme-linked immunosorbent assay (ELISA) for Giardia detection, and outlines experimental protocols for implementing this advanced statistical methodology. By synthesizing findings from multiple veterinary and human medical studies, we demonstrate how Bayesian methods provide more realistic accuracy estimates that account for the inherent imperfections in all diagnostic tools.
Traditional approaches to diagnostic test evaluation typically require comparison against a gold standard test that is assumed to be 100% accurate. However, in many practical scenarios, no such perfect reference test exists. This limitation is particularly evident in parasitology, where even the most sophisticated detection methods have inherent limitations in sensitivity and specificity. Bayesian analysis offers a paradigm shift by allowing all tests to be considered imperfect simultaneously, thus providing a more realistic framework for diagnostic accuracy assessment [45].
The fundamental principle of Bayesian analysis in diagnostic medicine involves estimating the posterior probability distributions of key parameters—including test sensitivity, specificity, and disease prevalence—by combining prior knowledge with newly collected test data. This approach employs computational methods, typically Markov Chain Monte Carlo (MCMC) simulation, to generate probability distributions for these parameters without requiring a gold standard [45] [46]. The Bayesian framework explicitly acknowledges and quantifies the uncertainty in diagnostic test results, providing more robust estimates that better reflect real-world conditions where all diagnostic tools have inherent limitations.
The problem of imperfect reference standards is particularly relevant for detecting Giardia duodenalis, an intestinal protozoan parasite that affects humans, domestic animals, and wildlife. The intermittent shedding of cysts, varying cyst concentrations in fecal samples, and technical challenges in detection have made it difficult to establish a definitive gold standard for giardiasis diagnosis [47] [48]. Bayesian approaches have therefore become increasingly important for providing more accurate assessments of diagnostic test performance and true prevalence estimates for this pathogen.
Fundamental Statistical Concepts
Basic Measures of Diagnostic Test Accuracy
Diagnostic test accuracy is primarily characterized through several key parameters. Sensitivity (true positive fraction) represents the probability that a test correctly identifies diseased individuals, while specificity (true negative fraction) represents the probability that a test correctly identifies non-diseased individuals [45]. These are formally defined as:
- Sensitivity (Se) = P(T+ | D+) = Number of true positives / Total number of diseased individuals
- Specificity (Sp) = P(T- | D-) = Number of true negatives / Total number of non-diseased individuals
In conventional diagnostic test evaluation, these parameters are estimated using a 2×2 contingency table comparing the test results against a gold standard. However, when no gold standard exists, this approach becomes problematic as the misclassification errors of the reference test will bias the accuracy estimates of the test being evaluated [45] [46].
Bayesian Framework for Diagnostic Test Evaluation
Bayesian analysis provides a different paradigm for diagnostic test evaluation by treating all parameters as random variables with probability distributions. The core of the Bayesian approach involves calculating the posterior distribution of parameters (sensitivity, specificity, prevalence) by combining prior distributions with the observed data through the likelihood function [45]. This relationship is expressed through Bayes' theorem:
P(θ | data) ∝ P(data | θ) × P(θ)
Where θ represents the parameters of interest (sensitivity, specificity, prevalence), P(θ | data) is the posterior distribution, P(data | θ) is the likelihood function, and P(θ) is the prior distribution.
When applied to diagnostic test evaluation in the absence of a gold standard, the Bayesian model incorporates results from multiple tests applied to the same individuals, acknowledging that all tests are imperfect. The model then simultaneously estimates the true disease status of each individual, the accuracy parameters of each test, and the population prevalence [3] [46]. This approach effectively disentangles the interdependent uncertainties of multiple imperfect tests through computational methods.
Comparative Analysis: Immunofluorescence Assay vs. ELISA for Giardia Detection
Experimental Data Comparison
Multiple studies have directly compared the performance of IFA and ELISA for detecting Giardia duodenalis using Bayesian methods to account for the absence of a perfect gold standard. The following table synthesizes findings from key studies across different host species:
Table 1: Bayesian Analysis of IFA and ELISA for Giardia Detection Across Species
| Host Species | Test Method | Sensitivity (%) | Specificity (%) | Prevalence (%) | Study Reference |
|---|---|---|---|---|---|
| Dairy Calves | IFA | 77 | 95 | 19 | [47] |
| Dairy Calves | ELISA | 89 | 90 | 19 | [47] |
| Dairy Calves | Microscopy | 56 | 87 | 19 | [47] |
| Dogs & Cats | IFA | 83-95* | 95-100* | - | [3] |
| Dogs & Cats | ELISA (SNAP) | 83-95* | 95-100* | - | [3] |
| Dogs & Cats | Fecal Flotation | 83-95* | 95-100* | - | [3] |
*Ranges represent combined Bayesian estimates across multiple commercial tests
The data from dairy calves reveals important differences between diagnostic approaches. The ELISA demonstrated higher sensitivity (89%) compared to IFA (77%), while IFA showed marginally better specificity (95% vs. 90%) [47]. Both methods substantially outperformed conventional microscopy, which had markedly lower sensitivity (56%). This study established a true prevalence of Giardia duodenalis in dairy calves in Belgium at 19%, with 42% of farms having positive calves [47] [48].
In companion animals, Bayesian analysis of multiple diagnostic tests for Giardia detection validated the use of IFA as a reference standard while providing more accurate estimates of test performance [3] [49]. The analysis demonstrated that all commercial tests had sensitivity ≥83% and specificity ≥95% when assessed through Bayesian methods, which was generally higher than when IFA was considered a perfect gold standard [3]. This highlights how conventional evaluation methods can underestimate test accuracy when using an imperfect reference standard.
Advantages of Bayesian Analysis in Test Comparison
Bayesian analysis provides several distinct advantages when comparing diagnostic tests like IFA and ELISA:
Elimination of Incorporation Bias: By not designating any single test as perfect, Bayesian methods prevent the underestimation of test accuracy that occurs when an imperfect test is used as a reference standard [3] [46].
More Accurate Prevalence Estimation: Traditional methods often produce prevalence estimates that require truncation at 0 or 1 when apparent prevalence falls outside plausible ranges, whereas Bayesian methods naturally constrain estimates to valid ranges without artificial truncation [46].
Incorporation of Prior Knowledge: Bayesian approaches can incorporate existing information about test performance from previous studies, leading to more precise estimates, particularly when sample sizes are limited [45] [46].
Comprehensive Uncertainty Quantification: The Bayesian framework provides complete posterior distributions for all parameters, allowing for more nuanced interpretation of confidence bounds compared to frequentist methods [46].
A comparative study of Bayesian and frequentist methods for prevalence estimation under misclassification found that Bayesian point estimates produced similar error distributions to the traditional Rogan-Gladen estimator but without the truncation problem at zero or unity [46]. Additionally, Bayesian credible intervals demonstrated superior coverage performance compared to traditional frequentist confidence intervals, which exhibited strong under-coverage [46].
Experimental Protocols and Methodologies
Sample Collection and Testing Procedures
Studies comparing IFA and ELISA for Giardia detection have followed standardized protocols for sample collection and testing. In veterinary studies, fecal samples are typically collected rectally from animals or from fresh environmental samples, transported to the laboratory under refrigeration, and processed promptly or stored frozen until analysis [47] [3] [18].
The IFA protocol generally follows the procedure described in studies evaluating Giardia in canine feces [18]. Briefly, approximately 0.1g of feces is suspended in phosphate-buffered saline (PBS) and subjected to serial dilution. An aliquot is mixed with a Giardia-specific fluorescent antibody detection reagent, incubated for 30 minutes at room temperature in the dark, and then examined using a fluorescence microscope. Samples are considered positive if any Giardia cysts are detected, and quantification can be performed by counting cysts in a defined volume [18].
ELISA procedures vary by commercial kit but generally follow a similar protocol. For example, the SNAP Giardia test (IDEXX Laboratories) is performed by adding processed fecal sample to the sample well, allowing the sample to migrate across the assay device, and then activating the activator solution to initiate the enzymatic reaction [3]. Results are interpreted visually after a defined incubation period. Plate-based ELISA formats, such as the ProSpecT Giardia Microplate Assay (Thermo Fisher Scientific), use spectrophotometric reading at 450nm with a defined cutoff value (typically net optical density ≥0.05) for determining positive results [18].
Bayesian Analysis Implementation
The implementation of Bayesian analysis for diagnostic test evaluation typically involves the following steps:
Data Collection: Apply multiple diagnostic tests (at least three) to the same set of samples to generate cross-classified results [47] [3].
Model Specification: Define a statistical model that relates the observed test results to the latent true disease status and the accuracy parameters of each test.
Prior Selection: Specify appropriate prior distributions for prevalence, sensitivity, and specificity of each test based on previous knowledge or use non-informative priors when such knowledge is limited [45].
Posterior Computation: Use computational methods such as MCMC simulation to generate samples from the joint posterior distribution of all parameters.
Convergence Assessment: Verify that the MCMC algorithm has converged to the target posterior distribution using diagnostic statistics such as the Gelman-Rubin statistic.
Result Interpretation: Summarize the posterior distributions of parameters of interest using means, medians, standard deviations, and credible intervals.
Software implementation typically involves specialized Bayesian analysis tools such as WinBUGS, JAGS, or Stan [45] [46]. These platforms provide flexible environments for specifying complex Bayesian models and performing the necessary computations.
Figure 1: Workflow for Bayesian Analysis of Diagnostic Test Accuracy
Research Reagent Solutions and Essential Materials
The implementation of diagnostic tests for Giardia detection and their evaluation through Bayesian analysis requires specific reagents and materials. The following table catalogues essential research tools and their applications in this field:
Table 2: Essential Research Reagents and Materials for Giardia Diagnostic Studies
| Category | Specific Product/Kit | Manufacturer | Primary Application |
|---|---|---|---|
| Immunofluorescence Assays | Merifluor Cryptosporidium/Giardia | Meridian Biosciences | Direct detection of Giardia cysts by fluorescence microscopy [3] [18] |
| ELISA Kits | ProSpecT Giardia Microplate Assay | Thermo Fisher Scientific | Reference laboratory Giardia antigen detection [18] |
| SNAP Giardia Test | IDEXX Laboratories | In-clinic rapid Giardia antigen detection [3] [18] | |
| VetScan Giardia Test | Abaxis | In-clinic rapid Giardia antigen detection (canine-specific) [3] | |
| Traditional Methods | Zinc Sulfate Solution | Various | Fecal flotation for microscopic cyst detection [3] |
| Statistical Software | WinBUGS | MRC Biostatistics Unit | Bayesian analysis using MCMC methods [45] |
| JAGS | Plummer | Just Another Gibbs Sampler for Bayesian analysis [46] | |
| Laboratory Equipment | Fluorescence Microscope | Various | Reading IFA test results [18] |
| Spectrophotometer | Various | Reading microplate ELISA results [18] |
The selection of specific diagnostic tests should be guided by research objectives, target species, and available resources. For reference laboratory settings with appropriate equipment, IFA provides a robust detection method with the advantage of cyst quantification [18]. For high-throughput screening or field applications, ELISA formats offer practical advantages despite potential slight compromises in sensitivity [47] [18]. Bayesian analysis enables the harmonization of results across these different testing modalities while accounting for their complementary strengths and limitations.
Implications for Research and Diagnostic Practice
The application of Bayesian analysis to diagnostic test evaluation has profound implications for both research and clinical practice. In research settings, this approach allows for more accurate estimation of disease prevalence and test performance characteristics, leading to better-informed public health interventions and resource allocation [46]. For diagnostic test development, Bayesian methods provide a more rigorous framework for establishing true performance metrics compared to traditional validation studies that rely on imperfect reference standards.
In veterinary clinical practice, Bayesian analyses have demonstrated that combining diagnostic approaches can enhance overall detection capability. For instance, one study found that when zinc sulfate centrifugal fecal flotation results were combined with immunoassay results, there was no longer a significant difference between the sensitivities of commercial in-clinic immunoassays [3] [49]. This supports the Companion Animal Parasite Council recommendation to use centrifugal fecal flotation in conjunction with an immunoassay for diagnosing Giardia infections in veterinary practices [3].
The Bayesian approach also highlights the context-dependent nature of diagnostic test performance. Test characteristics may vary between populations with different disease prevalence or in different host species [48]. Bayesian methods naturally accommodate these variations through their probabilistic framework, providing more customized accuracy estimates that reflect specific usage conditions.
Figure 2: Conceptual Model of Bayesian Diagnostic Test Evaluation
Bayesian analysis represents a significant advancement in diagnostic test evaluation, particularly for applications where no perfect gold standard exists. The comparative assessment of IFA and ELISA for Giardia duodenalis detection illustrates how this statistical approach provides more realistic accuracy estimates by acknowledging the imperfections inherent in all diagnostic tests. Through the synthesis of multiple studies across different host species, we have demonstrated that Bayesian methods not only offer technical solutions to statistical challenges but also provide practical insights for optimizing diagnostic strategies.
The implementation of Bayesian analysis requires careful attention to experimental design, model specification, and computational methods, but offers substantial rewards in the form of more accurate prevalence estimates and test characteristic determinations. As diagnostic technologies continue to evolve, Bayesian approaches will play an increasingly important role in validating new tests and establishing their clinical utility relative to existing methods. Researchers and clinicians working in parasitology and other fields with diagnostic challenges would benefit from incorporating these methods into their evaluation frameworks.
Mitigating Cross-Reactivity and False Positives in Immunoassays
Immunoassays are indispensable tools in clinical and research laboratories for quantifying a vast array of analytes, from hormones and drugs to infectious disease antigens. Despite their widespread use, these assays are susceptible to interference, which can lead to inaccurate results, misdiagnosis, and inappropriate treatment. Cross-reactivity represents a major form of interference, occurring when an antibody binds to non-target molecules that share structural similarities with the intended antigen [50] [51]. This phenomenon, along with other interferents, can cause both false-positive and false-negative results, compromising the assay's analytical specificity [50].
The clinical implications are significant. For instance, in drug of abuse testing, cross-reactivity from prescription or over-the-counter medications can yield false positives for illicit substances [51]. In hormone testing, structurally similar endogenous molecules or administered drugs can cross-react, leading to falsely elevated or suppressed values [50]. The expanding structural diversity of drugs and endogenous compounds presents an ongoing challenge for assay developers, making the mitigation of interference a critical aspect of immunoassay development, validation, and application [51]. Understanding the sources and mechanisms of interference is the first step toward implementing effective strategies to minimize their impact.
Types of Interfering Substances
Immunoassay interference can be broadly categorized based on its origin and mechanism. The primary sources include:
- Endogenous Antibodies: Heterophile antibodies, human anti-animal antibodies (HAAA), and rheumatoid factors are endogenous proteins that can bind to assay antibodies, interfering with the antigen-antibody reaction [50]. These can form bridge complexes in immunometric assays or block antibody binding sites.
- Cross-Reacting Molecules: Structurally similar compounds, such as drug metabolites, endogenous hormones with shared epitopes, or concurrently administered medications, can compete with the target analyte for antibody binding sites [50] [51]. This is a common issue in multiplex drug screening and steroid hormone assays.
- Matrix Effects: The sample matrix itself (e.g., serum, plasma, urine) can interfere. Lipemia (high lipid content), hemolysis (red blood cell breakdown), icterus (high bilirubin), and variations in protein content or ionic strength can alter antibody binding or the physical measurement of the signal [50].
- Pre-analytical Variables: Sample collection tube additives (e.g., EDTA, heparin), inadequate sample storage, or the presence of fibrin in plasma can change the measurable analyte concentration or physically mask antibody binding sites [50].
Impact on Assay Format
The format of the immunoassay influences the type and prevalence of interference. In reagent-excess assays like two-site immunometric (sandwich) assays, there is an increased likelihood of heterophile antibodies forming a bridge between the capture and detection antibodies, leading to false positives [50]. In competitive assays, which are often used for small molecules, the primary risk is from cross-reactants that displace the labeled analyte, leading to either over- or under-estimation depending on the assay design [52].
Table 1: Common Sources of Interference in Immunoassays
| Interference Type | Source Examples | Potential Effect on Results |
|---|---|---|
| Cross-reactivity | Drug metabolites, structurally similar endogenous compounds (e.g., digoxin-like immunoreactive factors) [50] | False positives or overestimation |
| Endogenous Antibodies | Heterophile antibodies, human anti-animal antibodies, rheumatoid factors [50] | False elevation or suppression |
| Matrix Effects | Lipemia, hemolysis, unusual protein levels [50] | Altered binding kinetics and signal |
| High-Dose Hook Effect | Extremely high analyte concentrations [50] | Falsely low results |
Figure 1: A conceptual map illustrating the primary mechanisms and sources of interference in immunoassays, highlighting the pathways that lead to inaccurate results.
Comparative Analysis: Immunofluorescence vs. ELISA for Giardia Detection
The accurate detection of the enteric parasite Giardia duodenalis is a common diagnostic challenge where method choice significantly impacts accuracy. Direct comparison of immunofluorescence (DFA) and enzyme-linked immunosorbent assay (ELISA) reveals critical differences in performance.
Diagnostic Performance Data
Studies directly comparing these methods for Giardia detection consistently show that DFA exhibits superior sensitivity. In a study of 328 dog and cat fecal samples, DFA was identified as the most sensitive technique for detecting G. duodenalis, followed by real-time PCR [9]. Another study involving 1680 human patient samples evaluated a commercial RIDASCREEN Giardia ELISA kit against direct microscopy. While the ELISA showed high sensitivity, it was not 100% when compared to a composite standard, and its specificity was 91.5%, indicating a potential for false positives [13]. This suggests that while ELISA is a valuable screening tool, DFA may provide a more definitive result.
Table 2: Comparison of Diagnostic Methods for Giardia duodenalis Detection
| Method | Principle | Reported Sensitivity | Reported Specificity | Advantages | Disadvantages |
|---|---|---|---|---|---|
| Direct Immunofluorescence (DFA) | Fluorescently labelled antibodies bind to (oo)cysts; visual counting with microscopy [9] | Highest among compared methods [9] | High [9] | Considered a gold standard; cost-effective; direct visualization of (oo)cysts [9] | Subjective; requires fluorescent microscope |
| ELISA (Sandwich) | Detects soluble Giardia antigens in stool using capture and detection antibodies [13] | 100% (in one study vs. microscopy) [13] | 91.5% (in one study vs. microscopy) [13] | High-throughput; objective spectrophotometric reading [13] | Potential for cross-reactivity; cannot confirm (oo)cyst morphology |
| Microscopy (Direct Wet Mount) | Direct visual identification of trophozoites/cysts [13] | Low (46-70% for a single sample) [13] | High (dependent on technician skill) | Low cost; provides immediate results | Low sensitivity; labor-intensive; requires skilled technician [13] |
| Real-Time PCR | Detection of parasite-specific DNA sequences [9] | High (second to DFA in one study) [9] | Very High | Highest specificity; can identify genotypes | High cost; complex; not for routine practice [9] |
Experimental Protocols for Giardia Detection
Protocol for DFA (as used in comparative studies):
- Sample Preparation: Fecal samples are diluted and homogenized in a buffer solution. The suspension is typically filtered to remove large debris [9].
- Staining: A specific volume of the processed sample is applied to a microscope slide and allowed to air-dry. Fluorescein-labelled anti-Giardia antibodies are added to the slide and incubated in a humidified chamber [9].
- Washing and Mounting: Unbound antibody is removed by rinsing with a buffer. The slide is then mounted with a coverslip using a non-fluorescent mounting medium.
- Microscopy and Reading: The slide is examined using an epifluorescence microscope with appropriate filters. Giardia cysts appear as bright, apple-green fluorescent oval structures. The result is based on the visualization and counting of these specific structures [9].
Protocol for Sandwich ELISA (RIDASCREEN Example):
- Sample Preparation: Approximately 100 mg of stool is mixed with 1 ml of sample dilution buffer and centrifuged. The supernatant is used for the test [13].
- Capture: The microwells are pre-coated with a Giardia-specific capture antibody. 100 µl of the sample supernatant and controls are pipetted into the wells and incubated, allowing Giardia antigens to bind to the immobilized antibodies [13].
- Detection and Washing: After washing to remove unbound material, an enzyme-conjugated detection antibody (specific to a different epitope on the Giardia antigen) is added and incubated. A second wash removes unbound conjugate.
- Signal Development and Reading: A substrate solution (e.g., TMB for HRP) is added. In a positive test, the enzyme converts the substrate, producing a blue color. The reaction is stopped with an acid, turning the solution yellow. The absorbance is measured spectrophotometrically at 450 nm, and the antigen concentration is determined by comparison to a standard curve [13].
Figure 2: A comparative workflow of Direct Immunofluorescence (DFA) and Sandwich ELISA protocols for the detection of Giardia, highlighting key steps where interference may occur.
Strategies to Minimize Cross-Reactivity and Interference
Assay Development and Reagent Selection
The foundation for a specific immunoassay is laid during the development and reagent selection phase.
- Antibody Choice: Using high-affinity monoclonal antibodies as the capture antibody provides high specificity for a single epitope, reducing the risk of cross-reactivity with unrelated molecules [52] [53]. For detection, high-affinity polyclonal antibodies can offer increased sensitivity, or a second monoclonal can be used for ultimate specificity [53].
- Immunoassay Format: Sandwich ELISA formats are inherently more specific than competitive or indirect formats for larger antigens because they require two distinct antibodies to bind the analyte simultaneously. This double recognition significantly reduces the chance of cross-reactivity from molecules that share only one epitope [52].
- Epitope Mapping: Carefully selecting antibodies that target epitopes unique to the analyte of interest, and not shared by known cross-reactants, is a powerful strategy. This requires thorough characterization of antibody specificity during development [54].
Technical and Methodological Optimizations
Once an assay is developed, several technical adjustments can be implemented to minimize interference.
- Sample Pre-treatment: Isolating the analyte before immunoassay can remove many interferents. Techniques include precipitation, extraction, or chromatography to separate the target from the complex matrix [54].
- Blocking Agents: Adding non-specific proteins (e.g., BSA, animal serums) or commercial blocking reagents to the sample or assay buffer can neutralize heterophile antibodies and other interfering proteins by occupying their binding sites non-specifically [50] [53].
- Dilution and Linearity: Interference is often concentration-dependent. Demonstrating linearity upon sample dilution (parallelism) can help identify its presence. Diluting the sample can reduce the concentration of interferents below a threshold where they cause significant effect, though this may also reduce sensitivity [53].
- Checkerboard Titration: Systematically optimizing the concentrations of the capture antibody, detection antibody, and enzyme conjugate using a checkerboard titration is crucial for maximizing the signal-to-noise ratio and identifying conditions that minimize background and interference [30].
- Reduced Contact Time: Utilizing platforms with flow-through technology that minimizes the contact time between the sample matrix and assay reagents can favor the specific, high-affinity antibody-antigen interactions while reducing non-specific, low-affinity binding that causes interference [53].
Validation and Verification Procedures
Rigorous validation is essential to characterize and document an assay's susceptibility to interference.
- Cross-Reactivity Testing: A critical validation experiment involves testing the assay against a panel of structurally related compounds, common concomitant medications, and known endogenous interferents. The percentage cross-reactivity is calculated to confirm the assay's specificity [52] [53].
- Spike-and-Recovery and Linearity-of-Dilution: These experiments assess matrix effects. A pure analyte is spiked into patient samples, and the recovery is measured. Ideally, diluted samples should show a linear response, and recoveries should be within acceptable limits (e.g., 80-120%). Poor recovery or non-linearity indicates matrix interference [30] [53].
- Use of Confirmatory Methods: For critical results, especially those that are clinically discordant, confirmation with an alternative method based on a different analytical principle (e.g., GC-MS, LC-MS/MS, or in the case of Giardia, DFA or PCR) is the gold standard for identifying false positives due to interference [50] [51].
Table 3: Research Reagent Solutions for Mitigating Interference
| Reagent / Solution | Function | Role in Mitigating Interference |
|---|---|---|
| High-Affinity Monoclonal Antibodies | Capture and/or detect a single, specific epitope on the target analyte. | Reduces cross-reactivity with structurally similar molecules that do not share the exact epitope [52] [53]. |
| Blocking Buffers | Contain non-specific proteins (e.g., BSA, animal serums) or proprietary formulations. | Saturate non-specific binding sites on the solid phase and neutralize heterophile antibodies in the sample [30]. |
| Biotin-Streptavidin Systems | Amplification system where a biotinylated detection antibody is bound by enzyme-labelled streptavidin. | Improves sensitivity, allowing for greater sample dilution which can reduce interferent concentration [52]. |
| Sample Dilution Buffer | Matrix-matching buffer used to dilute patient samples. | Helps minimize matrix effects by making the sample matrix more closely resemble the standard curve matrix [30]. |
| Solid Phase (e.g., Microplates) | The surface to which the capture antibody is immobilized. | A high-binding, consistent surface ensures uniform antibody coating, reducing well-to-well variability that can mimic interference. |
Mitigating cross-reactivity and false positives in immunoassays is a multi-faceted challenge that requires a proactive and thorough approach. The choice of diagnostic platform, as illustrated by the comparison between immunofluorescence and ELISA for Giardia detection, involves a trade-off between throughput, objectivity, and ultimate specificity. There is no universal solution; the optimal strategy depends on the clinical or research context.
A robust defense against interference is built on three pillars: strategic assay design with highly specific reagents, systematic technical optimization of the protocol, and rigorous validation against a comprehensive panel of potential interferents. By integrating these practices, researchers and clinicians can significantly enhance the reliability of their immunoassay data, leading to more accurate diagnoses, better patient outcomes, and more confident data-driven decisions in drug development.
Head-to-Head Performance: Meta-Analysis of DFA and ELISA Across Clinical Studies
The accurate detection of Giardia duodenalis is paramount in both clinical and veterinary settings due to its status as a common cause of parasitic diarrheal disease. This review synthesizes evidence from recent comparative studies to evaluate the sensitivity and specificity profiles of two primary diagnostic methodologies: immunofluorescence assays (IFA, including DFA) and enzyme-linked immunosorbent assays (ELISA). Data indicate that while both techniques offer significant advantages over traditional microscopy, immunofluorescence is consistently validated as the gold standard, though certain ELISA platforms demonstrate comparable performance in specific contexts. The synthesis of this evidence provides a critical resource for researchers and clinicians in selecting optimal diagnostic strategies.
Giardia duodenalis (also known as G. lamblia or G. intestinalis) is a protozoan parasite infecting the gastrointestinal tract of humans and various animals, leading to giardiasis, characterized by diarrhea, abdominal cramps, and malabsorption [3] [8]. Accurate and early diagnosis is crucial for initiating prompt treatment, improving patient outcomes, and understanding transmission epidemiology. For decades, diagnosis relied on microscopic examination of stool samples for cysts or trophozoites. However, the intermittent shedding of cysts and the requirement for expert microscopy limit its sensitivity and practicality [3] [23].
The development of immunoassay-based technologies marked a significant advancement in diagnostic precision. Among these, immunofluorescence assays (IFA), also referred to as direct immunofluorescence assays (DFA), and enzyme-linked immunosorbent assays (ELISA) have become cornerstone techniques. IFA utilizes fluorescence-labeled, parasite-specific antibodies to stain (oo)cysts, enabling specific visualization under a fluorescence microscope [8] [23]. In contrast, ELISA detects soluble Giardia antigens in fecal specimens through an enzyme-mediated colorimetric reaction [55].
Despite their widespread adoption, a clear consensus on their comparative performance, underpinned by robust sensitivity and specificity data, is essential for evidence-based laboratory practice. This article provides a systematic synthesis of recent comparative studies to delineate the sensitivity and specificity profiles of IFA versus ELISA for the detection of Giardia duodenalis, framing this analysis within the broader thesis of comparative diagnostic accuracy.
Comparative Analysis of Diagnostic Performance
A comprehensive review of the literature reveals consistent trends in the performance of IFA and ELISA techniques. The table below summarizes key quantitative findings from recent comparative studies, using IFA as the reference standard in most cases.
Table 1: Comparative Sensitivity and Specificity of IFA and ELISA for Giardia Detection
| Study (Context) | Diagnostic Test | Sensitivity (%) | Specificity (%) | Reference Standard |
|---|---|---|---|---|
| Carlin et al., 2007 (Cats) [56] | ProSpecT Giardia ELISA | 91.2 | 99.4 | MeriFluor IFA |
| SNAP Giardia ELISA | 85.3 | 100 | MeriFluor IFA | |
| Fecal Flotation | 82.4 | 99.7 | MeriFluor IFA | |
| Uehlinger et al., 2017 (Dogs) [23] | SNAP Giardia ELISA | 93.8 | 99.1 | IFA |
| Zinc Sulfate Flotation | 91.7 | 100 | IFA | |
| ProSpecT Giardia ELISA | 89.6 | 98.1 | IFA | |
| BMC Veterinary Research, 2024 (Dogs & Cats) [8] | DFA (alone) | Highest (precise values not stated) | Highest (precise values not stated) | Used as Gold Standard |
| Real-time PCR | High (less than DFA) | High (less than DFA) | DFA | |
| Lateral Flow ICT (ELISA variant) | Limited sensitivity, false positives | Limited specificity | DFA | |
| Iturriza-Gómara et al., 2016 (Human) [57] | IFA | Used as reference | Used as reference | N/A |
| qPCR | 91.0 | 95.1 | IFA | |
| Microscopy (FEA) | Significantly lower | N/S | IFA |
Key: IFA/DFA: Immunofluorescence Assay/Direct Immunofluorescence Assay; ICT: Immunochromatographic Test; N/S: Not Stated.
The data uniformly establishes IFA as a highly reliable benchmark. In a 2024 study, DFA was identified as "the most accurate and cost-effective method," demonstrating superior sensitivity for detecting G. duodenalis in dogs and cats compared to other methods [8]. Similarly, a 2016 human study concluded that IFA and PCR were significantly more sensitive than conventional microscopy [57].
When evaluated against IFA, commercial ELISA kits show variable but generally high performance. The ProSpecT Giardia Microplate Assay has shown excellent sensitivity (91.2%) and specificity (99.4%) in feline samples [56]. The SNAP Giardia test, designed for in-clinic use in veterinary medicine, also demonstrates strong performance, with one study in dogs reporting 93.8% sensitivity and 99.1% specificity [23]. The SNAP test was noted for being "easier to use and equally sensitive... to fecal flotation" [56]. However, caution is advised with some human-adapted ELISA kits used in veterinary settings, as they may be suboptimal for detecting animal-specific species or genotypes [29] [56].
Experimental Protocols and Methodologies
A critical understanding of the comparative data requires an examination of the underlying experimental protocols. The following workflow and methodology descriptions are synthesized from the cited studies.
Diagram 1: Generalized Experimental Workflow for Comparative Diagnostic Studies
Core Protocol: Direct Immunofluorescence Assay (IFA/DFA)
In the studies reviewed, the IFA procedure typically used commercial kits (e.g., MERIFLUOR Cryptosporidium/Giardia, Crypto/Giardia Cel IF) [3] [8] [56]. The standard protocol is as follows:
- Sample Preparation: A fecal suspension is prepared by emulsifying 1-2 grams of feces in phosphate-buffered saline (PBS) or a proprietary solution. The suspension is often filtered to remove large particulate debris.
- Staining: The filtered sample is centrifuged, and the pellet is applied to a welled slide. A fluorescein-isothiocyanate (FITC) labeled monoclonal antibody specific to Giardia cyst wall antigen (and often Cryptosporidium) is added to the sample.
- Incubation and Washing: The slide is incubated in a humidified chamber (typically 30-37°C for 15-30 minutes) to allow antigen-antibody binding, followed by a washing step to remove unbound antibody.
- Microscopy: The slide is examined using a fluorescence microscope at 200-400x magnification. Giardia cysts are identified as oval or round structures (8-12 μm) exhibiting bright apple-green fluorescence [8]. The presence of any clearly defined fluorescent cyst is considered a positive result.
Core Protocol: Enzyme-Linked Immunosorbent Assay (ELISA)
Various ELISA formats were evaluated, including well-plate assays (e.g., ProSpecT Giardia EZ Microplate Assay, VetChek ELISA) and rapid immunochromatographic tests (e.g., SNAP Giardia, ImmunoCard STAT!) [3] [55] [56]. A generalized protocol for a sandwich ELISA is:
- Sample Preparation: Fecal samples are diluted in a specific buffer provided with the kit. The mixture is vortexed and centrifuged to clarify.
- Antigen Capture: The supernatant is added to microwells or a test device that are pre-coated with a capture antibody against a soluble Giardia antigen (e.g., GSA-65).
- Detection Antibody Incubation: A second antibody, conjugated to an enzyme (e.g., horseradish peroxidase), is added. This antibody binds to a different epitope on the target antigen, forming an antibody-antigen-antibody "sandwich."
- Substrate Reaction and Reading: A chromogenic substrate is added. The enzyme catalyzes a reaction that produces a color change. The intensity of the color (measured spectrophotometrically for plates or visually for rapid tests) is proportional to the amount of antigen present in the sample. The result is interpreted as positive or negative based on a pre-defined cutoff value [55] [23].
Statistical and Analytical Methods
To address the lack of a perfect "gold standard," several studies employed advanced statistical models. Bayesian analysis was used in multiple veterinary studies to estimate the sensitivity and specificity of all tests, including the IFA, without assuming any single test is perfect [3] [23]. This approach provides a more robust evaluation of test performance in the absence of an infallible reference. Furthermore, standard statistical measures like sensitivity, specificity, and positive and negative predictive values were calculated by comparing results to the IFA as the reference standard. McNemar's test was applied to determine if differences in sensitivity and specificity between paired tests were statistically significant [3].
The Scientist's Toolkit: Essential Research Reagents and Materials
The execution of these diagnostic protocols relies on a suite of specific reagents and tools. The following table details key solutions and their functions in the context of IFA and ELISA for Giardia detection.
Table 2: Key Research Reagent Solutions for Giardia Detection Assays
| Reagent / Material | Primary Function in Assay | Example Product / Citation |
|---|---|---|
| FITC-Labeled Monoclonal Antibody | Core detection reagent for IFA; binds specifically to Giardia cyst wall antigen, enabling visualization under fluorescence microscopy. | MERIFLUOR Cryptosporidium/Giardia [3] [56]; Crypto/Giardia Cel IF [8] |
| Capture & Detection Antibody Pair | Essential for sandwich ELISA; capture antibody immobilizes target antigen, while enzyme-conjugated detection antibody enables signal generation. | ProSpecT Giardia EZ Microplate Assay [23] [56]; TECHLAB VETCHEK ELISA [3] |
| Enzyme Substrate (Chromogenic) | Critical for signal generation in ELISA; the enzyme conjugated to the detection antibody catalyzes a reaction with this substrate, producing a measurable color change. | TMB (3,3',5,5'-Tetramethylbenzidine) is a common substrate [55] |
| Fecal Flotation Solution | Used in parallel diagnostic methods; a solution of specific density (e.g., Zinc Sulfate, specific gravity 1.18) to separate and concentrate parasite cysts from fecal debris for microscopy. | Zinc Sulfate (ZnSO₄) solution [3] [23] |
| Blocking Buffer (e.g., BSA, Skim Milk) | Used in ELISA to block non-specific binding sites on the microplate well surface, thereby reducing background noise and improving assay specificity. | A standard component of ELISA kits [55] |
| Wash Buffers (PBS with Detergent) | Used in both IFA and ELISA to remove unbound antibodies and other reagents after incubation steps, minimizing non-specific signal and reducing false positives. | Phosphate-Buffered Saline (PBS) with Tween 20 [8] |
The synthesis of recent comparative studies clearly delineates the performance profiles of IFA and ELISA for Giardia detection. Immunofluorescence assays maintain their position as the gold standard, offering high sensitivity and specificity, and are consistently used as the reference method in evaluative studies. Consequently, IFA is the recommended benchmark for clinical trials and definitive diagnosis where resources permit.
However, certain ELISA platforms, particularly the ProSpecT and SNAP Giardia tests, demonstrate performance characteristics that are comparable to IFA in specific settings. The choice between these methods ultimately depends on the context. IFA provides the highest accuracy and allows for cyst visualization but requires specialized, costly equipment and technical expertise. ELISA, especially rapid tests, offers an excellent balance of performance, speed, and ease-of-use, making it ideal for in-clinic veterinary diagnostics or high-throughput human screening. The evidence strongly supports the continued use and development of both technologies, with the optimal diagnostic strategy often involving a combination of methods to maximize detection accuracy and inform public health and clinical decisions.
The accurate detection of pathogens like Giardia duodenalis and rabies virus is a critical concern in both veterinary and human medicine, directly impacting public health outcomes, treatment protocols, and disease surveillance. Among the available diagnostic tools, the Direct Fluorescent Antibody (DFA) test has maintained its status as a reference method for decades. This guide provides a systematic comparison of the performance of DFA against alternative diagnostic technologies, including enzyme-linked immunosorbent assays (ELISA), rapid immunochromatographic tests (ICT), and molecular methods like PCR. Designed for researchers, scientists, and drug development professionals, this analysis synthesizes recent experimental data to objectively quantify the sensitivity, specificity, and operational characteristics of these methods within the specific context of detecting Giardia in canine samples and rabies in both canine and human clinical contexts. The focus is on providing supporting experimental data to inform laboratory protocol development and diagnostic investment decisions.
Performance Data Comparison
Giardia Detection in Canine Fecal Samples
The table below summarizes the performance of various diagnostic tests for detecting Giardia in canine fecal samples, as compared to the DFA gold standard.
Table 1: Performance of Giardia Diagnostic Tests in Canine Fecal Samples
| Diagnostic Method | Sensitivity (%) | Specificity (%) | Positive Predictive Value (PPV) | Negative Predictive Value (NPV) | Reference |
|---|---|---|---|---|---|
| Direct Fluorescent Antibody (DFA) | 100 (Gold Standard) | 100 (Gold Standard) | 100 | 100 | [8] |
| Zinc Sulfate Flotation (ZnSO4) | High Performance (Precise metrics not given) | High Performance (Precise metrics not given) | Not Provided | Not Provided | [4] |
| Rapid Diagnostic Test (RDT) / ICT | Variable: 70.0 - 87.1 | Variable: 71.1 - 93.4 | Not Provided | Not Provided | [18] |
| Enzyme-Linked Immunosorbent Assay (ELISA) | 94.1 | 97.4 | Not Provided | Not Provided | [18] |
| Polymerase Chain Reaction (PCR) | Lower than DFA and ZnSO4 | Not Provided | Not Provided | Not Provided | [4] |
Rabies Virus Detection in Canine Brain Tissue
The following table compares the performance of various rabies diagnostic tests on canine brain samples, using DFA as the reference standard.
Table 2: Performance of Rabies Diagnostic Tests in Canine Brain Samples
| Diagnostic Method | Sensitivity (%) | Specificity (%) | Key Advantage | Reference |
|---|---|---|---|---|
| Direct Fluorescent Antibody (DFA) | 100 (Gold Standard) | 100 (Gold Standard) | WHO/OIE gold standard; visual confirmation of antigen | [58] |
| Lateral Flow Assay (LFA) | 100 | 100 | Rapid results (10 min); no specialized equipment needed | [58] |
| Direct Rapid Immunohistochemistry Test (dRIT) | 100 | 100 | Suitable for field settings; results in <1 hour | [58] |
| Reverse Transcriptase-PCR (RT-PCR) | 100 | 100 | High sensitivity; useful for variant characterization | [58] |
Experimental Protocols
Detailed Protocol: DFA for Giardia duodenalis Detection
The following protocol is adapted from comparative studies evaluating Giardia detection in canine and feline fecal samples [8] [18].
- Sample Preparation: Approximately 0.1 gram of feces is added to 900 μL of 0.02 M phosphate-buffered saline (PBS) at a pH of 7.4 and mixed thoroughly. A 1:100 dilution is then prepared by adding 100 μL of the initial mixture to a second tube containing 900 μL of PBS.
- Staining: An aliquot of 100 μL from the diluted sample is mixed with 5 μL of a commercially available fluorescein isothiocyanate (FITC)-labeled anti-Giardia antibody detection reagent.
- Incubation: The mixture is incubated at room temperature for 30 minutes in the dark to prevent photobleaching of the fluorescent dye.
- Microscopy: After incubation, a 10.5 μL volume of the stained preparation is placed on a microscope slide and examined under a fluorescence microscope at 400x magnification.
- Interpretation: Samples are considered positive for Giardia if structures that are round to oval in shape, of the correct size (8–12 μm for Giardia cysts), and stained bright apple-green are observed. The entire smear is examined for a definitive result.
Detailed Protocol: DFA for Rabies Virus Antigen Detection
This protocol is based on the standard method used for post-mortem rabies diagnosis in brain tissue from dogs and other animals [58].
- Smear Preparation: Impression smears approximately 10 mm in diameter are prepared from at least two regions of the brain, typically the brainstem and cerebellum, on clean, acetone-rinsed glass slides. Simultaneously, control slides are prepared using known negative and positive brain samples.
- Fixation: The smears are air-dried at room temperature for 10–15 minutes and then fixed in pre-chilled acetone (at -80°C) for one hour. After fixation, the slides are air-dried again.
- Staining: Each smear is incubated with 40 μL of FITC-labeled anti-rabies nucleoprotein conjugate (diluted 1:100 in PBS, pH 7.4) at 37°C for 60 minutes in a high-humency chamber.
- Washing: After incubation, the excess conjugate is drained off. The slides are rinsed and then soaked in PBS for 3–5 minutes to remove any unbound antibody.
- Interpretation: Slides are observed under an inverted fluorescence microscope at 400 nm within two hours of staining. The test is confirmed positive by the presence of granular, intra-cytoplasmic apple-green fluorescence indicating the presence of aggregated viral nucleocapsids.
Workflow and Signaling Pathways
DFA Test Workflow Visualization
The following diagram illustrates the generalized procedural workflow for a Direct Fluorescent Antibody (DFA) test, which is consistent for both Giardia and rabies detection.
The Scientist's Toolkit: Research Reagent Solutions
Table 3: Essential Reagents and Materials for DFA-Based Diagnostics
| Item | Function / Description | Example Application |
|---|---|---|
| FITC-Labeled Antibody Conjugate | The core detection reagent; a monoclonal or polyclonal antibody specific to the target antigen (e.g., Giardia cyst wall, rabies nucleoprotein) that is conjugated to the fluorescein isothiocyanate (FITC) fluorochrome. | Giardia DFA [18], Rabies DFA [58] |
| Direct Immunofluorescence Assay Kit | A commercially available kit providing standardized reagents, including antibodies, buffers, and controls, ensuring consistency and reliability. | Crypto/Giardia Cel IF kit [8] |
| Fluorescence Microscope | Essential equipment for visualizing the fluorescently-labeled antigen-antibody complexes. Requires appropriate filters for FITC fluorescence (excitation ~495 nm, emission ~519 nm). | Nikon Eclipse Ci-S [8], Carl Zeiss AG microscope [58] |
| Phosphate-Buffered Saline (PBS) | A universal buffer used for sample dilution, reagent preparation, and washing steps to maintain a stable pH and osmotic pressure. | Sample dilution and washing [18] |
| Acetone (Pre-Chilled) | A fixative agent used to permeabilize cells and stabilize the target antigen on the microscope slide, preventing degradation and wash-off. | Slide fixation at -80°C [58] |
| Positive & Negative Control Slides | Quality control materials essential for validating the test procedure. The positive control confirms test functionality, while the negative control checks for non-specific binding or contamination. | Included in standard DFA protocols [58] |
The Enzyme-Linked Immunosorbent Assay (ELISA) represents a cornerstone technique in immunology and diagnostics, known for its sensitivity and specificity in detecting a wide range of biomolecules [26]. Despite its widespread use, the performance of commercial ELISA kits varies significantly between manufacturers and formats, creating a critical need for systematic comparison to guide researcher selection [3] [18]. This variability is particularly consequential in diagnostic applications where accuracy directly impacts clinical decision-making. Within veterinary parasitology, this challenge is exemplified in the detection of Giardia duodenalis, where ELISA kits must compete with established reference methods like direct immunofluorescence assay (DFA) and fecal flotation [59] [3]. The selection of an appropriate diagnostic tool hinges on understanding the performance characteristics of available tests, including their sensitivity, specificity, and operational practicality within specific research or clinical contexts.
This guide objectively compares the performance of various commercial ELISA kits and alternative diagnostic methods for Giardia detection, presenting quantitative data from controlled studies to inform researchers, scientists, and drug development professionals. The analysis is framed within the broader context of comparative accuracy between immunofluorescence and ELISA methodologies, drawing upon experimental data to highlight strengths and limitations of each approach. By synthesizing evidence from multiple performance evaluations, this guide aims to provide a evidence-based resource for selecting optimal detection strategies based on specific research requirements, sample types, and accuracy priorities.
Experimental Protocols for Comparative Studies
Sample Collection and Preparation Methods
The comparative studies analyzed in this guide employed standardized methodologies to ensure valid performance assessments. For Giardia detection evaluations, researchers typically collected fresh fecal samples from dogs and cats, with sample sizes ranging from 100 to 388 animals across different studies [59] [3]. Samples were often obtained from multiple sites including veterinary hospitals, animal shelters, and rescue organizations to ensure diverse representation. Upon collection, specimens were typically refrigerated and shipped with ice packs to central testing facilities, with careful attention to maintaining sample integrity throughout transport [3]. Before analysis, samples were homogenized and divided for parallel testing across different diagnostic platforms, with each aliquot processed according to the specific requirements of the respective test method being evaluated.
Reference Standard Methodologies
The performance of ELISA kits was evaluated against established reference standards, with the Direct Immunofluorescence Assay (DFA) frequently serving as the gold standard for Giardia detection [3] [18]. The DFA protocol involved mixing fecal samples with phosphate-buffered saline (PBS) in serial dilutions, followed by addition of a fluorescent antibody detection reagent (Merifluor, Meridian Biosciences) [18]. After incubation at room temperature for 30 minutes in the dark, samples were examined using a fluorescence microscope where Giardia cysts were counted and calculated per gram of feces [18]. This method is considered reference standard due to its high sensitivity and specificity, though it requires specialized equipment and technical expertise typically available only in reference laboratories [3].
ELISA Test Procedures
Commercial ELISA kits were implemented strictly according to manufacturers' instructions. For the ProSpecT Giardia Microplate Assay, procedures involved adding prepared fecal samples to antibody-coated microtiter plates, followed by incubation, washing, and addition of enzyme conjugate [59]. After further incubation and washing, substrate was added and the reaction stopped before reading optical density at 450nm spectrophotometrically [59]. For in-clinic rapid tests like the SNAP Giardia Test (IDEXX) and VetScan Canine Giardia Rapid Test (Abaxis), procedures involved applying diluted fecal samples to test devices, allowing lateral flow, and interpreting visual results within specified timeframes [3] [18]. All comparative studies implemented blinding procedures where technicians performing tests were unaware of reference standard results to minimize bias [18].
Statistical Analysis Approaches
Data analysis in the cited studies employed rigorous statistical methods. Sensitivity and specificity of each diagnostic test were calculated by comparison to DFA results using standard formulas [3]. McNemar's test was used to determine statistical significance of differences in sensitivity and specificity between tests [3]. To address limitations of using an imperfect reference standard, some studies implemented Bayesian analysis, which allows diagnostic test evaluation without a perfect gold standard by estimating true prevalence and test characteristics simultaneously [3]. Statistical analyses were performed using specialized software including SAS version 9.4, with confidence intervals calculated using Agresti-Coull or similar methods [3] [18].
Performance Comparison of Giardia Detection Methods
Comparative Sensitivity and Specificity Data
Table 1: Performance Characteristics of Giardia Detection Tests Compared to DFA
| Test Method | Species | Sensitivity (%) | Specificity (%) | Reference |
|---|---|---|---|---|
| ProSpecT ELISA | Dogs | 94.1 | 97.4 | [18] |
| ProSpecT ELISA | Cats | 94.1 | 97.4 | [18] |
| SNAP Giardia Test | Dogs | 87.1 | 93.4 | [18] |
| SNAP Giardia Test | Cats | ≥82 | ≥90 | [3] |
| ZnSO4 Flotation | Dogs | 81.2 | 93.4 | [18] |
| ZnSO4 Flotation | Cats | 81.2 | 93.4 | [18] |
| VetScan Rapid Test | Dogs | 70.0 | 93.4 | [18] |
| Witness Giardia Test | Dogs | 76.2 | 71.1 | [18] |
The performance data reveal substantial variability between different commercial tests for Giardia detection. The laboratory-based ProSpecT ELISA demonstrated the highest sensitivity (94.1%) and specificity (97.4%) when compared to DFA as reference standard [18]. Among rapid in-clinic tests, the SNAP Giardia Test showed superior performance with 87.1% sensitivity and 93.4% specificity in canine samples [18]. Conventional zinc sulfate centrifugal flotation exhibited moderate sensitivity (81.2%) despite high specificity (93.4%), highlighting the limitation of microscopy-based methods for detecting intermittent cyst shedding [18]. These findings underscore the importance of test selection based on performance requirements, with ELISA formats generally offering enhanced sensitivity compared to traditional flotation methods.
Test Agreement with Reference Standards
Table 2: Agreement Between Giardia Diagnostic Tests and Reference Methods
| Test Method | Comparison Standard | Positive Agreement (%) | Negative Agreement (%) | Overall Agreement (%) | |
|---|---|---|---|---|---|
| SNAP Giardia | Microplate ELISA | 89.5 | 96.1 | 94.0 | [18] |
| VetScan | Microplate ELISA | 73.7 | 90.8 | 85.8 | [18] |
| Anigen Rapid | Microplate ELISA | 76.3 | 85.5 | 83.1 | [18] |
| Witness | Microplate ELISA | 78.9 | 81.6 | 80.8 | [18] |
| ZnSO4 Flotation + SNAP | DFA | - | - | Significant improvement vs. either test alone | [3] |
When compared to the microplate ELISA as a reference standard, the SNAP Giardia test demonstrated the highest positive (89.5%) and negative (96.1%) agreement among rapid tests [18]. This strong correlation with laboratory-based ELISA methods supports the utility of certain rapid formats as practical alternatives when reference laboratory testing is unavailable. Importantly, research indicates that combining diagnostic approaches enhances overall detection capability. The Companion Animal Parasite Council (CAPC) recommends using centrifugal fecal flotation in conjunction with immunoassay for diagnosing G. duodenalis infections, as this combination mitigates differences in commercial immunoassay sensitivities [3]. This synergistic approach leverages the strengths of multiple methodologies to optimize detection accuracy.
Bayesian Analysis of Test Performance
To address limitations inherent in using an imperfect reference standard, some studies employed Bayesian analysis, which does not require assumption of a perfect gold standard [3]. This statistical approach validated the use of IFA as a reference test while providing adjusted estimates of test performance [3]. When analyzed via Bayesian methods, sensitivity and specificity values for all Giardia diagnostic tests were ≥83% and ≥95%, respectively [3]. This sophisticated analytical approach strengthens confidence in reported performance characteristics by accounting for the inherent imperfections in reference standards, providing a more realistic assessment of actual test performance in field conditions.
Technical and Operational Considerations
ELISA Methodology and Variability Factors
The performance variability observed among commercial ELISA kits stems from fundamental methodological differences in assay design and implementation. Several ELISA formats exist, each with distinct detection mechanisms and applications:
Sandwich ELISA: Utilizes two antibodies binding to different epitopes on the target antigen, providing high sensitivity and specificity ideal for quantifying proteins or cytokines [26] [60]. Signal intensity increases proportionally with target concentration [60].
Competitive ELISA: Employed for small molecules or hormones where the target analyte competes with a labeled version for limited binding sites [26] [60]. Signal decreases as analyte concentration increases, providing inverse correlation [60].
Indirect ELISA: Primarily used for antibody detection where signal increases with antibody presence, though it may demonstrate less linearity than sandwich formats [26] [60].
The critical components influencing ELISA performance include the solid phase matrix (typically 96-well microplates), enzyme-labelled conjugates (commonly horseradish peroxidase or alkaline phosphatase), substrates that generate colorimetric signals, and wash buffers that remove unbound materials [26]. Each component contributes to assay variability, with key performance differentiators including antibody pair specificity in sandwich ELISA, enzyme-substrate combination sensitivity, and incubation condition optimization [26] [60].
Diagram: ELISA Format Applications and Signal Correlations. Different ELISA formats exhibit distinct signal-concentration relationships and are optimized for specific applications, impacting their performance characteristics.
Key Research Reagent Solutions
Table 3: Essential Research Reagents for ELISA Implementation
| Reagent/Category | Specific Examples | Function & Importance |
|---|---|---|
| Solid Phase Matrix | 96-well microplates (polystyrene, polyvinyl) | Provides surface for antigen/antibody immobilization; plate quality affects binding efficiency and reproducibility [26]. |
| Detection Enzymes | Horseradish peroxidase (HRP), Alkaline phosphatase (AP) | Catalyzes substrate conversion to measurable signal; enzyme choice affects sensitivity and detection limits [26]. |
| Chromogenic Substrates | TMB (3,3',5,5'-Tetramethylbenzidine), BCIP/NBT | Produces color change measurable spectrophotometrically; substrate selection influences signal intensity and background [26]. |
| Wash Buffers | PBS (Phosphate-buffered saline) | Removes unbound reagents between steps; critical for reducing background signal and non-specific binding [26]. |
| Stop Solutions | HCl, H₂SO₄, NaOH | Terminates enzyme-substrate reaction; ensures reaction measurement at optimal timepoint [26]. |
| Reference Standards | Recombinant proteins, purified antigens | Enables standard curve generation for quantification; purity and stability essential for accurate calibration [60]. |
The quality and consistency of research reagents significantly influence ELISA performance characteristics. High-quality antibodies with validated specificity form the foundation of reliable assays, with recombinant antibodies demonstrating particular advantages in batch-to-batch consistency [61]. Optimal reagent combinations must be determined through systematic validation for each target and sample matrix, as performance varies substantially based on application requirements and experimental conditions [26] [60].
Data Analysis and Calculation Methods
Accurate interpretation of ELISA results requires appropriate data analysis methodologies that account for the specific assay format and dynamic range. The relationship between optical density (OD) and analyte concentration differs fundamentally between ELISA formats:
Positive Correlation: In sandwich, indirect, and direct ELISAs, OD values increase proportionally with target concentration due to more enzyme-linked detection antibody binding [60].
Negative Correlation: In competitive ELISA, OD values decrease as analyte concentration increases because sample analyte competes with labeled antigen for limited binding sites [60].
For quantitative analysis, standard curves are typically generated using serial dilutions of known concentrations, with curve fitting employing 4-parameter logistic (4PL) or 5-parameter logistic (5PL) models most appropriate for sigmoidal response curves across wide dynamic ranges [60]. Quality control measures should include calculation of coefficient of variation (CV%) for replicates (<10-15% intra-assay CV), and standard curves with R² values >0.98 indicate adequate fitting [60].
Diagram: ELISA Data Analysis Workflow. Quantitative ELISA analysis requires systematic processing from raw OD measurements to final concentration values, with quality control checkpoints to ensure reliability.
The performance spectrum of commercial ELISA kits reflects substantial variability in sensitivity, specificity, and operational characteristics that researchers must consider when selecting diagnostic methodologies. The comparative data presented demonstrate that while laboratory-based ELISA formats like the ProSpecT assay achieve high sensitivity (94.1%) and specificity (97.4%) for Giardia detection [18], rapid in-clinic tests show more variable performance, with the SNAP test representing the best-performing rapid option (87.1% sensitivity, 93.4% specificity) [18]. These performance differences have practical implications for research and diagnostic applications, particularly when balancing accuracy requirements with operational constraints.
The comparative data between immunofluorescence and ELISA methodologies reveals a nuanced landscape where test selection depends on specific application requirements. While DFA remains the reference standard for Giardia detection with superior sensitivity and specificity [3] [18], ELISA platforms offer practical advantages in throughput, standardization, and accessibility [26] [60]. The emerging trend of combining diagnostic approaches, such as simultaneous use of fecal flotation with immunoassay, demonstrates enhanced detection capability that mitigates limitations of individual methods [3]. For researchers and drug development professionals, these findings highlight the importance of validating ELISA performance within specific experimental contexts and considering hybrid approaches that leverage the complementary strengths of multiple diagnostic methodologies to achieve optimal detection accuracy for specific research objectives.
The accurate detection of Giardia duodenalis is a critical objective in parasitology and public health research, driving the need for diagnostic methods that are not only reliable but also operationally efficient for large-scale studies. Within this context, a central thesis has emerged, positing that immunofluorescence assays provide superior diagnostic accuracy for giardiasis, while alternative methods may offer advantages in specific operational scenarios. This guide provides an objective comparison of the cost-effectiveness, throughput, and performance of key diagnostic techniques, including Direct Fluorescence Antibody (DFA) tests, enzyme-linked immunosorbent assays (ELISA), fecal flotation, and polymerase chain reaction (PCR). We present synthesized experimental data and detailed protocols to aid researchers, scientists, and drug development professionals in selecting the most appropriate methodology based on the specific constraints and objectives of their studies.
Comparative Analysis of Diagnostic Methods
Performance and Operational Metrics
The selection of a diagnostic method for large-scale studies requires a careful balance of accuracy, cost, and processing time. The table below summarizes the comparative performance of different techniques based on published studies.
Table 1: Comparative Performance of Giardia Diagnostic Methods
| Diagnostic Method | Sensitivity (%) | Specificity (%) | Relative Cost per Sample | Approx. Processing Time | Key Applications |
|---|---|---|---|---|---|
| Direct Fluorescence Assay (DFA) | 95–100 [62] [8] | 95–100 [62] [8] | Moderate | 40–50 minutes [62] | Gold standard; high-precision studies [8] |
| ZnSO4 Flotation (Centrifugal) | 82–100 [4] [3] | >90 [3] | Low | 12–15 minutes [62] | Routine screening; cost-sensitive studies [4] |
| Rapid ELISA/Immunoassay | 83–98.75 [62] [3] | 90–100 [62] [3] | Moderate-High | 11–12 minutes [62] | In-clinic rapid testing; high-throughput screening |
| FLOTAC Technique | 100 [62] | 100 [62] | Very Low (Lowest) [62] | 12–15 minutes [62] | Large-scale surveys with budget constraints [62] |
| PCR (Conventional) | Variable (Can be low) [4] | High [8] | High | Several hours | Genotyping; assemblage identification [4] |
Cost-Effectiveness Analysis
A critical component of operational efficiency is the direct and indirect costs associated with each diagnostic method. A dedicated cost-effectiveness analysis highlights significant financial differences.
Table 2: Cost-Effectiveness Analysis of Giardia Immunoassays and FLOTAC
| Parameter | FLOTAC | ELISA | IFA/DFA |
|---|---|---|---|
| Mean Cost per Sample (US$) | 1.00 [62] | 11.40 [62] | 9.80 [62] |
| Cost Range (US$) | 0.50 - 1.50 [62] | 8.71 - 16.30 [62] | 7.20 - 14.60 [62] |
| Diagnostic Accuracy | 100% [62] | 98.75% [62] | ~100% [62] |
| Overall Cost-Effectiveness | Highest [62] | Lower [62] | Moderate [62] |
Experimental Protocols for Key Methods
Direct Immunofluorescence Assay (DFA)
The DFA is widely considered the reference standard for Giardia detection [8]. The following protocol is adapted from studies using commercial kits (e.g., MeriFluor Cryptosporidium/Giardia or Crypto/Giardia Cel IF).
Workflow Diagram: Direct Immunofluorescence Assay (DFA)
Key Steps:
- Specimen Preparation: Emulsify 1-2 grams of fecal sample in phosphate-buffered saline (PBS) or formalin. Filter the suspension through a sieve to remove large debris and concentrate by centrifugation [8].
- Slide Preparation: Apply the concentrated sample to a microscope slide, spread into a thin smear, and allow to air dry completely.
- Fixation: Flood the slide with absolute methanol for 5-10 minutes to fix the specimen. Allow to air dry again.
- Staining: Apply the working dilution of fluorescein isothiocyanate (FITC)-labeled anti-Giardia monoclonal antibody to completely cover the smear.
- Incubation: Place the slide in a humidified chamber and incubate at 30-37°C for 30 minutes to allow antibody-antigen binding.
- Rinsing: Gently rinse the slide with PBS or distilled water to remove unbound antibody. Air dry in the dark.
- Mounting: Add a drop of glycerol-based mounting medium and apply a coverslip.
- Microscopy: Examine using an epifluorescence microscope with a FITC filter set (excitation ~495 nm, emission ~515 nm). Giardia cysts appear as bright, apple-green, oval structures (8-12 μm) [8].
Zinc Sulfate Flotation Technique
The zinc sulfate centrifugal flotation is a common microscopic technique that leverages differences in specific gravity to separate cysts from fecal debris.
Workflow Diagram: Zinc Sulfate Flotation Technique
Key Steps:
- Homogenization: Mix 2-4 grams of feces with 10-15 mL of zinc sulfate solution (specific gravity 1.18-1.20) [3].
- Filtration and Centrifugation: Strain the mixture through a sieve into a centrifuge tube. Top off with more ZnSO4 solution if needed, and centrifuge at 200 x g for 5 minutes [3].
- Form Meniscus: Without disturbing the pellet, add more ZnSO4 solution down the side of the tube to form a positive meniscus at the top.
- Coverslip Placement: Carefully place a clean coverslip on top of the tube, ensuring contact with the meniscus.
- Standing Time: Allow the tube to stand for 10-15 minutes to let the cysts float to the surface and adhere to the coverslip.
- Sample Transfer: Vertically and carefully remove the coverslip and place it on a glass slide for microscopic examination.
- Microscopy: Systematically scan the entire coverslip area under 100x, 200x, and 400x magnification. Giardia cysts appear as refractile, oval structures [4].
Enzyme-Linked Immunosorbent Assay (ELISA)
Antigen-capture ELISAs are popular for their ease of use and suitability for batch processing.
Key Steps:
- Coating: Microplate wells are pre-coated with a capture antibody specific for a Giardia surface antigen.
- Blocking: Add a blocking agent (e.g., bovine serum albumin) to prevent non-specific binding.
- Specimen Addition: Add prepared fecal supernatant to the wells. Incubate to allow antigen-antibody binding.
- Washing: Wash wells thoroughly to remove unbound material.
- Detection Antibody Addition: Add an enzyme-conjugated detection antibody (e.g., horseradish peroxidase conjugate) specific to a different epitope on the Giardia antigen. Incubate and wash again.
- Substrate Addition: Add a chromogenic enzyme substrate (e.g., TMB).
- Signal Detection: Measure the color development spectrophotometrically. The intensity of color is proportional to the amount of antigen present in the sample.
The Scientist's Toolkit: Essential Research Reagents
Successful implementation of the described protocols requires specific reagents and equipment. The following table details key solutions and their functions.
Table 3: Essential Research Reagent Solutions for Giardia Detection
| Reagent / Solution | Composition / Type | Primary Function in Protocol |
|---|---|---|
| Fluorescent-Labeled Monoclonal Antibody | FITC-conjugated anti-Giardia antibody (e.g., MeriFluor) | Specific detection and staining of Giardia cysts in DFA [8] [63] |
| Zinc Sulfate Flotation Solution | ZnSO₄ in distilled water (Specific Gravity 1.18-1.35) | Creates a density gradient for parasite cyst flotation and concentration [62] [3] |
| Fecal Antigen Capture ELISA Kit | Pre-coated microplate, detection antibodies, conjugates, substrates (e.g., TECHLAB VETCHEK, IDEXX SNAP) | Detection of soluble Giardia cyst wall protein (GSA-65) antigens in fecal samples [3] [55] |
| Phosphate-Buffered Saline (PBS) | Sodium chloride, phosphate buffers | Washing and dilution buffer for sample preparation and DFA rinsing [8] |
| Merthiolate-Iodine-Formalin (MIF) | Thimerosal, formaldehyde, glycerin, potassium iodide | Fecal preservation, fixation, and staining for direct microscopic examination [8] |
Discussion and Future Directions
The data presented supports the thesis that DFA remains the benchmark for diagnostic accuracy in Giardia detection, with high sensitivity and specificity across multiple studies [8] [63]. However, for large-scale studies where budget is a primary constraint, the FLOTAC technique demonstrates superior cost-effectiveness with minimal compromise on accuracy [62]. Rapid ELISA tests offer a compelling balance of speed and acceptable performance, ideal for high-throughput screening where results are needed quickly [62] [3].
Emerging technologies, particularly deep learning-based classification of microscopic images, present a promising future direction. One recent study achieved an accuracy of 96.29% in classifying Giardia cysts and trophozoites from stool images using an EfficientNet-B0 model [64]. While currently a research tool, this approach has the potential to revolutionize large-scale studies by drastically increasing throughput and standardizing diagnosis.
For the highest detection rates, especially in subclinical infections with low cyst shedding, the combination of a fecal flotation technique with an immunoassay is recommended by expert bodies like the Companion Animal Parasite Council (CAPC) [3]. This integrated approach mitigates the individual limitations of each method and provides the most robust data for critical research applications.
Conclusion
The comparative analysis solidifies Direct Immunofluorescence Assay (DFA) as the reference standard for Giardia detection, offering superior sensitivity and reliable cyst visualization, which is critical for definitive diagnosis and genotyping studies. Meanwhile, ELISA presents a valuable high-throughput alternative with strong performance, particularly suitable for large-scale screening and research settings where processing efficiency is paramount. The optimal diagnostic strategy often involves a complementary approach, leveraging the strengths of both techniques, sometimes in conjunction with traditional flotation methods, to maximize detection accuracy. Future directions for biomedical research should focus on the development of next-generation multiplexed assays, refinement of point-of-care testing platforms, and the integration of molecular techniques like PCR for simultaneous detection and assemblage typing to better understand zoonotic transmission dynamics and inform public health interventions.
References
- 1. A decade-long bibliometric analysis of global research on ... [https://www.sciencedirect.com/science/article/abs/pii/S3050475925002519]
- 2. Performance of microscopy and ELISA for diagnosing ... [https://www.sciencedirect.com/science/article/abs/pii/S1383576916303063]
- 3. Comparison of diagnostic techniques for detection ... [https://pmc.ncbi.nlm.nih.gov/articles/PMC6524394/]
- 4. Comparative performance evaluation of four different ... [https://www.sciencedirect.com/science/article/pii/S0304401724000803]
- 5. Comparative performance of reference laboratory tests and in ... [https://pmc.ncbi.nlm.nih.gov/articles/PMC6090814/]
- 6. Diagnosis of Giardia Species by Comparison of Two ... [https://www.scholarsliterature.com/journals/la-prensa-medica/fulltext/diagnosis-of-giardia-species-by-comparison-of-two-enzyme-linked-immuno-sorbent-tests]
- 7. Detection of Giardia and Cryptosporidium in surface water ... [https://pmc.ncbi.nlm.nih.gov/articles/PMC12032176/]
- 8. Direct immunofluorescence assay as the gold standard for ... [https://bmcvetres.biomedcentral.com/articles/10.1186/s12917-024-04297-0]
- 9. Enhancing diagnostic accuracy [https://pmc.ncbi.nlm.nih.gov/articles/PMC11445881/]
- 10. An introduction to Performing Immunofluorescence Staining [https://pmc.ncbi.nlm.nih.gov/articles/PMC6918834/]
- 11. Diagnostic Accuracy of ELISA versus Indirect ... [https://jccpractice.com/article/diagnostic-accuracy-of-elisa-versus-indirect-immunofluorescence-in-detecting-anti-nuclear-antibodies-among-suspected-connective-tissue-disorder-patients-1011/]
- 12. Immunofluorescence Staining | A Typical Workflow [https://ibidi.com/content/365-immunofluorescence-staining-a-typical-workflow]
- 13. A Comparison of Microscopy and Enzyme Linked ... [https://pmc.ncbi.nlm.nih.gov/articles/PMC4290233/]
- 14. Performance of microscopy and ELISA for diagnosing ... [https://pubmed.ncbi.nlm.nih.gov/27586394/]
- 15. Frequency, diagnostic performance of coproantigen ... [https://pmc.ncbi.nlm.nih.gov/articles/PMC5189869/]
- 16. Giardia Lamblia ELISA Kit [https://www.alpco.com/giardia-lamblia-elisa.html?srsltid=AfmBOoqTXbiBFzk9j6Uej_qS4lJugNe54ETHt6edLy8bZP6VYc9HjzT_]
- 17. KTR-838 | Fecal Giardia lamblia Antigen ELISA Kit [https://www.epitopediagnostics.com/products/ktr-838-fecal-giardia-lamblia-antigen-elisa-kit]
- 18. Comparative performance of reference laboratory tests and in ... [https://parasitesandvectors.biomedcentral.com/articles/10.1186/s13071-018-2990-6]
- 19. Giardia – Advantages and Disadvantages of Various ... [https://battlab.com/giardia-advantages-and-disadvantages-of-various-detection-methods/]
- 20. Methods for Evaluating the Accuracy of Diagnostic Tests [https://www.e-jcpp.org/journal/view.php?doi=10.36011/cpp.2021.3.e2]
- 21. Reporting Results from Studies Evaluating Diagnostic Tests [https://www.fda.gov/regulatory-information/search-fda-guidance-documents/statistical-guidance-reporting-results-studies-evaluating-diagnostic-tests-guidance-industry-and-fda]
- 22. Giardia lamblia Immunoassay: Systematic review and meta ... [https://www.sciencedirect.com/science/article/abs/pii/S0009898124020916]
- 23. Comparison of five diagnostic tests for Giardia duodenalis ... [https://www.sciencedirect.com/science/article/abs/pii/S0304401717303308]
- 24. 21.5 Fluorescent Antibody Techniques – Microbiology [https://ecampusontario.pressbooks.pub/microbio/chapter/fluorescent-antibody-techniques/]
- 25. ELISA Assay Technique | Thermo Fisher Scientific - US [https://www.thermofisher.com/us/en/home/life-science/protein-biology/protein-biology-learning-center/protein-biology-resource-library/pierce-protein-methods/overview-elisa.html]
- 26. An overview of ELISA: a review and update on best laboratory ... [https://pmc.ncbi.nlm.nih.gov/articles/PMC11808753/]
- 27. ELISA: The Complete Guide [https://www.antibodies.com/applications/elisa]
- 28. Laboratory diagnosis for Giardia lamblia infection [https://pmc.ncbi.nlm.nih.gov/articles/PMC3327334/]
- 29. Evaluation of immunofluorescence microscopy and ... [https://www.sciencedirect.com/science/article/abs/pii/S0304401707000313]
- 30. ELISA Development and Optimization [https://www.thermofisher.com/us/en/home/life-science/protein-biology/protein-biology-learning-center/protein-biology-resource-library/pierce-protein-methods/overview-elisa/elisa-development-optimization.html]
- 31. ELISA Guide; Part 3: ELISA Optimization [https://www.jacksonimmuno.com/secondary-antibody-resource/immuno-techniques/elisa-guide-part-3-elisa-optimization/]
- 32. ELISA Data Analysis Infographic [https://www.bio-techne.com/applications/immunoassays/elisa-infographic]
- 33. Best practices and new trends in biological sample ... [https://www.clinigengroup.com/insight/insights/2025/best-practices-and-new-trends-in-biological-sample-management/]
- 34. what happens to your samples after storage [https://www.abcam.com/en-us/stories/articles/freezer-storage-samples]
- 35. Key Considerations for Reliable Biological Sample Storage [https://www.phchd.com/us/biomedical/blog/key-considerations-for-reliable-biological-sample-storage]
- 36. Preserving biological specimens for DNA analysis just got easier [https://news.northeastern.edu/2025/10/14/dna-preservation-breakthrough-sample-storage/]
- 37. Comparison of 3 Diagnostic Tests for the Detection ... [https://pmc.ncbi.nlm.nih.gov/articles/PMC10078926/]
- 38. Develop an indirect ELISA utilizing gD protein to detect ... [https://www.frontiersin.org/journals/cellular-and-infection-microbiology/articles/10.3389/fcimb.2025.1591304/full]
- 39. Concordance between two monoclonal antibody-based ... [https://parasitesandvectors.biomedcentral.com/articles/10.1186/s13071-024-06197-6]
- 40. Comparison of Enzyme-Linked Immunosorbent Assay ... [https://pmc.ncbi.nlm.nih.gov/articles/PMC524736/]
- 41. Disentangling the effects of intermittent faecal shedding and ... [https://pmc.ncbi.nlm.nih.gov/articles/PMC11717355/]
- 42. Giardia lamblia infection: review of current diagnostic strategies [https://pmc.ncbi.nlm.nih.gov/articles/PMC6441489/]
- 43. Giardiasis [https://www.infectiousdiseaseadvisor.com/ddi/giardiasis/]
- 44. Evaluation of an Inhouse Rapid ELISA Test for Detection of ... [https://pmc.ncbi.nlm.nih.gov/articles/PMC2994047/]
- 45. Bayesian Methods for Medical Test Accuracy - PMC [https://pmc.ncbi.nlm.nih.gov/articles/PMC4665459/]
- 46. Comparison of Bayesian and frequentist methods for ... [https://bmcpublichealth.biomedcentral.com/articles/10.1186/s12889-020-09177-4]
- 47. Estimation of diagnostic test characteristics and prevalence ... [https://pubmed.ncbi.nlm.nih.gov/15380683/]
- 48. Estimation of diagnostic test characteristics and prevalence ... [https://www.sciencedirect.com/science/article/abs/pii/S0020751904001286]
- 49. Comparison of diagnostic techniques for detection ... [https://pubmed.ncbi.nlm.nih.gov/30982235/]
- 50. Interferences in Immunoassay - PMC - PubMed Central - NIH [https://pmc.ncbi.nlm.nih.gov/articles/PMC1904417/]
- 51. Using molecular similarity to highlight the challenges of ... [https://pmc.ncbi.nlm.nih.gov/articles/PMC2688477/]
- 52. Why are Sensitivity and Specificity Important Parameters ... [https://www.enzo.com/note/why-are-sensitivity-and-specificity-important-parameters-for-an-elisa/]
- 53. Solutions to immunoassay interference, cross reactivity and ... [https://www.gyrosproteintechnologies.com/spinblog/immunoassay-interference-crossreactivity-challenges]
- 54. Approaches to minimizing interference by cross-reacting ... [https://pubmed.ncbi.nlm.nih.gov/1993317/]
- 55. Evaluation of a commercially available ELISA assay for ... [https://www.sciencedirect.com/science/article/pii/073288939400142J]
- 56. Comparison of direct immunofluorescence, immunoassays, ... [https://pubmed.ncbi.nlm.nih.gov/17939549/]
- 57. Comparison of sensitivity and specificity of ... [https://pubmed.ncbi.nlm.nih.gov/26707069/]
- 58. First report on dog bite epidemiology and Rabies diagnosis ... [https://pmc.ncbi.nlm.nih.gov/articles/PMC12434624/]
- 59. of conventional coproscopical methods and commercial... Comparison [https://pubmed.ncbi.nlm.nih.gov/15495932/]
- 60. How to Analyze ELISA Data and Calculate Results [https://www.bosterbio.com/blog/post/how-to-analyze-elisa-data-and-calculate-results-step-by-step-guide-with-troubleshooting-tips?srsltid=AfmBOopux-VRKStX00eALto97cxcQqKvWFU8kugCwGISv52WGvu7fr_q]
- 61. ELISA testing gets faster and more reproducible [https://www.nature.com/articles/d42473-025-00230-7]
- 62. Comparative cost-effectiveness of immunoassays and ... [https://pmc.ncbi.nlm.nih.gov/articles/PMC6454601/]
- 63. Prospective comparison of direct immunofluorescence and ... [https://pmc.ncbi.nlm.nih.gov/articles/PMC228230/]
- 64. Automatic classification of Giardia infection from stool ... [https://pmc.ncbi.nlm.nih.gov/articles/PMC11954735/]