Immunochromatographic Tests for Giardia and Cryptosporidium: A Comprehensive Review for Researchers and Developers
This article provides a detailed analysis of immunochromatographic (ICT) lateral flow assays for the detection of Giardia lamblia and Cryptosporidium spp., two major protozoan pathogens causing diarrheal diseases worldwide.
Immunochromatographic Tests for Giardia and Cryptosporidium: A Comprehensive Review for Researchers and Developers
Abstract
This article provides a detailed analysis of immunochromatographic (ICT) lateral flow assays for the detection of Giardia lamblia and Cryptosporidium spp., two major protozoan pathogens causing diarrheal diseases worldwide. Tailored for researchers, scientists, and drug development professionals, it covers the foundational principles of ICT technology, methodological applications in clinical and field settings, troubleshooting for performance optimization, and comprehensive validation against reference standards like microscopy, ELISA, and PCR. The review synthesizes current performance data, identifies key challenges including variable sensitivity and limitations in detecting low parasite burdens, and explores emerging technological advancements that aim to enhance point-of-care diagnostics for these significant public health threats.
Giardia and Cryptosporidium ICT Fundamentals: Principles, Targets, and Clinical Need
Epidemiology and Global Health Burden of Giardiasis and Cryptosporidiosis
Global Epidemiology and Public Health Burden
Giardiasis
Giardiasis, caused by the protozoan parasite Giardia duodenalis (also known as G. lamblia or G. intestinalis), represents the most prevalent enteric protozoal infection globally [1]. The parasite demonstrates a cosmopolitan distribution, with an estimated 280 million symptomatic human cases occurring annually worldwide [2]. Epidemiological patterns reveal significant disparities between developed and developing nations, with giardiasis affecting approximately 2-5% of the population in industrialized countries and 20-30% in developing regions [2] [1]. Within the United States, the estimated prevalence reaches approximately 1.2 million cases, though many remain asymptomatic [1]. The Centers for Disease Control and Prevention (CDC) documented 15,223 reported cases in 2012, with highest incidence among children aged 0-4 years [1]. Similarly, Minnesota reported 445 cases in 2023 (7.8 per 100,000 population), reflecting a 26% decrease from the previous decade's median [3].
Table: Global Epidemiological Profile of Giardiasis
| Parameter | Global Burden | Developed Countries | Developing Countries |
|---|---|---|---|
| Symptomatic Cases | 280 million annually [2] | - | - |
| Population Prevalence | - | 2-5% [2] [1] | 20-30% [2] [1] |
| US Prevalence | 1.2 million estimated cases [1] | - | - |
| US Reported Cases (2012) | 15,223 [1] | - | - |
| High-Risk Groups | Children, international travelers, wilderness enthusiasts, daycare workers, immunocompromised individuals [1] | - | - |
| Seasonality | Late summer/early fall peak (correlating with outdoor water activities) [1] | - | - |
Cryptosporidiosis
Cryptosporidiosis has emerged as a significant global health concern, ranking as the fifth leading diarrheal etiology in children under 5 years worldwide [4]. Acute Cryptosporidium infection caused more than 48,000 deaths and over 4.2 million disability-adjusted life-years (DALYs) lost in this vulnerable age group in 2016 alone [4]. The disease burden demonstrates pronounced geographical disparities, with prevalence rates below 1% in high-income countries compared to 8% in low- and middle-income nations [4]. In the United States, approximately 750,000 cryptosporidiosis cases occur annually [5], while the CDC estimates 823,000 cases each year, with 9.9% attributed to international travel [4].
The Global Enteric Multicenter Study (GEMS) identified Cryptosporidium as responsible for an astounding 7.5 million annual cases in regions with highest mortality among children under 5 years [6]. Recent data from Denmark challenges previous assumptions about cryptosporidiosis being primarily travel-associated in industrialized nations. Following implementation of molecular diagnostic methods, Denmark identified Cryptosporidium as an endemic pathogen, with detection rates exceeding 2% of tested patients during seasonal peaks (August-October) [7]. This underscores significant historical underdiagnosis and highlights the importance of advanced diagnostic approaches.
Table: Global Epidemiological Profile of Cryptosporidiosis
| Parameter | Global Burden | Regional Variations | Special Populations |
|---|---|---|---|
| Global Ranking | 5th leading diarrheal etiology in children <5 years [4] | - | - |
| Mortality (children <5) | >48,000 deaths annually [4] | - | - |
| DALYs Lost | >4.2 million (children <5) [4] | - | - |
| US Cases | ≈750,000 annually [5] | - | - |
| Prevalence Disparities | - | <1% in high-income countries; 8% in low-middle income countries [4] | - |
| High-Risk Groups | Children <5 years, immunocompromised individuals (e.g., AIDS patients), malnourished children [5] [6] [4] | - | - |
| Notable Statistics | 7.5 million annual cases in high-mortality regions (GEMS) [6]; Hospitalization rate >10% in recent Danish cases [7] | - | - |
Diagnostic Landscape and Immunochromatographic Tests
Current Diagnostic Methodologies
Accurate diagnosis of giardiasis and cryptosporidiosis presents considerable challenges due to non-specific clinical presentations and limitations of conventional diagnostic methods. The diagnostic landscape encompasses several approaches with varying sensitivities and specificities:
Traditional Methods: Microscopy-based techniques including wet mount preparations, concentration methods (formalin-ethyl acetate, merthiolate-iodine-formalin), and specialized staining (Ziehl-Neelsen for Cryptosporidium) have been widely used but suffer from limitations in sensitivity and technical expertise requirements [8]. Microscopic identification of Giardia is particularly challenging due to intermittent shedding of cysts, with sensitivity improvements requiring collection of three stool samples on different days [1].
Advanced Detection Methods: Molecular methods including nucleic acid amplification techniques (NAATs), particularly polymerase chain reaction (PCR), offer enhanced sensitivity and specificity, enabling detection of as few as 10 Giardia parasites per 100 microliters [1]. Real-time PCR proves effective for detecting both mild and asymptomatic infections [1]. Direct immunofluorescence assay (DFA) has emerged as a gold standard in many clinical settings, providing cost-effective detection with high sensitivity and specificity [8]. A recent comparative study evaluating diagnostic performance for Giardia duodenalis and Cryptosporidium spp. detection in canine and feline fecal samples identified DFA as the most sensitive technique, followed by real-time PCR [8].
Immunochromatographic Tests: Performance and Applications
Immunochromatographic tests (ICT) represent rapid diagnostic platforms that detect parasite-specific antigens in fecal samples. These assays utilize specific antibodies to capture and immobilize antigens on a substrate, with positive results visualized as visible lines typically within 10-15 minutes [9]. The ImmunoCard STAT! Cryptosporidium/Giardia rapid assay (Meridian Bioscience, Inc.) exemplifies this technology, detecting and distinguishing between Giardia lamblia and Cryptosporidium parvum in aqueous extracts of human fecal specimens within approximately 12 minutes [9].
Performance evaluation of the ImmunoCard STAT! assay demonstrated sensitivities of 93.5% for G. lamblia and 98.8% for C. parvum, with specificities of 100% for both parasites [9]. However, comparative studies note limitations in diagnostic sensitivities for some ICT platforms and undesired high rates of false-positive results [8]. The ImmunoCard STAT! assay showed false-negative results for Giardia primarily with specimens containing low parasite numbers or trophozoites only [9].
Table: Performance Comparison of Diagnostic Methods for Giardia and Cryptosporidium
| Diagnostic Method | Principles | Time Requirements | Relative Sensitivity | Advantages | Limitations |
|---|---|---|---|---|---|
| Microscopy | Direct visualization of (oo)cysts | 30-60 minutes | Low to moderate [1] [8] | Low cost, identifies multiple parasites | Requires expertise, intermittent shedding affects sensitivity [1] |
| Immunochromatographic Test (ICT) | Antigen detection by lateral flow | 10-15 minutes [9] | Moderate (93.5% Giardia, 98.8% Crypto) [9] | Rapid, easy to perform, minimal training | Limited sensitivity, false positives reported [8] |
| Direct Immunofluorescence (DFA) | Fluorescently-labeled antibodies | 60-90 minutes | High (gold standard) [8] | High sensitivity and specificity, cost-effective | Requires fluorescence microscope |
| PCR/Molecular | DNA amplification | Several hours | High [1] [8] | Highest sensitivity, species/genotyping | Complex, higher cost, specialized equipment |
Experimental Protocols
Immunochromatographic Testing Protocol
Principle: This protocol utilizes the ImmunoCard STAT! Cryptosporidium/Giardia Rapid Assay for simultaneous detection and differentiation of Giardia and Cryptosporidium antigens in human fecal specimens. The assay employs specific antibodies that capture and immobilize antigens on a membrane substrate, with results visualized through a colloidal carbon-conjugated detection system [9].
Materials:
- ImmunoCard STAT! test devices (Meridian Bioscience, Inc.)
- Sample treatment buffer
- Conjugate A (Giardia capture antibody conjugate)
- Conjugate B (colloidal carbon-conjugated detection reagent)
- Disposable transfer pipettes
- Timer
Procedure:
- Sample Preparation: Add 2 drops of sample treatment buffer to a provided tube. Pipette 60μl of uncentrifuged, preserved stool specimen (fresh, frozen, unfixed, or fixed in formalin-based fixatives) into the same tube [9].
- Conjugate Addition: Add 2 drops of Giardia capture antibody conjugate (Conjugate A) to the tube, followed by 2 drops of colloidal carbon-conjugated detection reagent (Conjugate B) [9].
- Test Activation: Mix the sample thoroughly and immediately pour the entire mixture into the sample well of the test device.
- Incubation: Allow the test to develop for 10 minutes at room temperature.
- Result Interpretation: Visually inspect the result window for gray-black color bars next to the printed organism names. Any visible intensity constitutes a positive result. A control bar must appear for valid tests [9].
Quality Control: The test device includes an internal control. Failure of the control bar to appear invalidates the test. For quality assurance, laboratories should implement external controls with known positive and negative samples.
Limitations:
- False-negative results may occur with specimens containing low parasite numbers or trophozoites only [9].
- Patients remaining symptomatic after negative results should be evaluated with additional diagnostic methods including ova and parasite examination and special stains for other coccidia and microsporidia [9].
- No cross-reactivity observed with 10 different protozoa, 9 helminths, or human cells, but clinical correlation remains essential [9].
Direct Immunofluorescence Assay (Gold Standard Protocol)
Principle: This protocol uses fluorescently-labeled monoclonal antibodies specific to cell wall antigens of Giardia cysts and Cryptosporidium oocysts, allowing direct visualization by fluorescence microscopy. DFA serves as the reference method for detecting these parasites in fecal samples [8].
Materials:
- Crypto/Giardia Cel IF commercial kit (CeLLabs, Brookvale, Australia) or equivalent
- Fluorescence microscope with appropriate filters (e.g., Nikon Eclipse Ci-S)
- Glass slides and coverslips
- Phosphate-buffered saline (PBS)
- Centrifuge and centrifuge tubes
- Pipettes and disposable tips
Procedure:
- Sample Processing: Thoroughly resuspend 3-5g of fecal material in 20ml of PBS. Filter homogenate through a sieve mesh (250μm diameter) to remove large debris [8].
- Concentration: Centrifuge filtered suspension at 1,500 rpm for 10 minutes. Carefully decant supernatant.
- Staining: Apply processed sample to well of microscope slide. Add appropriate volume of fluorescent antibody reagent according to manufacturer's instructions.
- Incubation: Incubate in a humidified chamber at room temperature for 30 minutes protected from light.
- Washing: Gently rinse slide with PBS to remove unbound antibody.
- Mounting: Apply coverslip using mounting medium if required.
- Microscopy: Examine slides at 400× magnification using a fluorescence microscope [8].
- Interpretation: Giardia cysts (8-12μm) and Cryptosporidium oocysts (4-6μm) appear bright apple green, round to oval in shape [8].
Quality Assurance: Include positive and negative controls with each batch. For morphological confirmation, examine size, shape, and staining characteristics.
Research Reagent Solutions
Table: Essential Research Reagents for Giardia and Cryptosporidium Detection
| Reagent/Category | Specific Examples | Research Application | Performance Notes |
|---|---|---|---|
| Immunochromatographic Tests | ImmunoCard STAT! Cryptosporidium/Giardia Rapid Assay (Meridian Bioscience, Inc.) [9] | Rapid clinical diagnosis, outbreak investigations | Sensitivity: 93.5% Giardia, 98.8% Cryptosporidium; Specificity: 100% both [9] |
| Direct Immunofluorescence Assays | Crypto/Giardia Cel IF (CeLLabs, Australia) [8] | Gold standard detection, method validation studies | High sensitivity and specificity; requires fluorescence microscopy [8] |
| Molecular Detection Kits | Various commercial DNA extraction kits; PCR master mixes; QIAstat-Dx Gastrointestinal Panel (QIAGEN) [7] | Species identification, genotyping, epidemiological studies | High sensitivity; enables syndromic testing; identifies multiple pathogens simultaneously [7] |
| Microscopy Reagents | Merthiolate-iodine-formalin (MIF) [8], Modified acid-fast stains [9] | Basic parasitology, resource-limited settings | Lower sensitivity but cost-effective; allows detection of multiple parasites [8] |
| Antibody Reagents | Monoclonal antibodies against cyst/ oocyst wall antigens | Development of novel diagnostic tests, basic research | Key components for immunoassays; variable specificity and affinity affect performance |
Signaling Pathways and Experimental Workflows
Diagnostic Pathway for Parasite Detection
This workflow illustrates the diagnostic pathway for Giardia and Cryptosporidium detection, highlighting the positioning of immunochromatographic tests within the broader testing algorithm. The diagram emphasizes the relationship between different diagnostic methodologies and their respective time requirements, enabling researchers to contextualize ICT applications within comprehensive diagnostic strategies.
Research Methodology Framework
This research methodology framework outlines the experimental approaches for studying Giardia and Cryptosporidium, demonstrating how immunochromatographic tests integrate into broader research strategies. The diagram connects research objectives with appropriate detection methodologies, highlighting the complementary nature of different diagnostic platforms in addressing specific research questions.
Core Principles of Immunochromatographic Lateral-Flow Technology
Immunochromatographic lateral-flow assays (LFAs) represent a cornerstone technology in rapid diagnostic testing for enteric protozoan parasites. Within the context of a broader thesis on immunochromatographic tests for Giardia and Cryptosporidium detection, this document details the core principles, applications, and protocols. These tests are critically important for the rapid, point-of-care diagnosis of giardiasis and cryptosporidiosis, diseases that cause significant global morbidity and mortality, particularly in children and immunocompromised individuals [10] [11]. The single-step format and visual readout of LFAs make them indispensable tools for researchers and clinicians working in both resource-limited and advanced laboratory settings, enabling timely public health interventions and patient management [12] [13].
Core Technological Principles
The fundamental operation of a lateral-flow immunoassay is based on the capillary movement of a liquid sample along a strip of porous membrane and the specific recognition of target analytes by antibodies.
Mechanism of Action
The assay employs a monoclonal antibody sandwich design to detect specific parasite antigens, such as the Cryptosporidium oocyst wall antigen [10]. The process begins when a diluted fecal specimen is applied to the sample pad. The liquid is drawn up via capillary action, hydrating the conjugate pad and liberating membrane-embedded gold particles conjugated with anti-Cryptosporidium or anti-Giardia antibodies. This mixture migrates along the strip to the reaction window where capture antibodies are immobilized in specific lines (test and control). If the target antigen is present, it forms an antigen-antibody-gold complex with the capture antibody, resulting in a visible colored line. A control line must always appear to validate the test result [10].
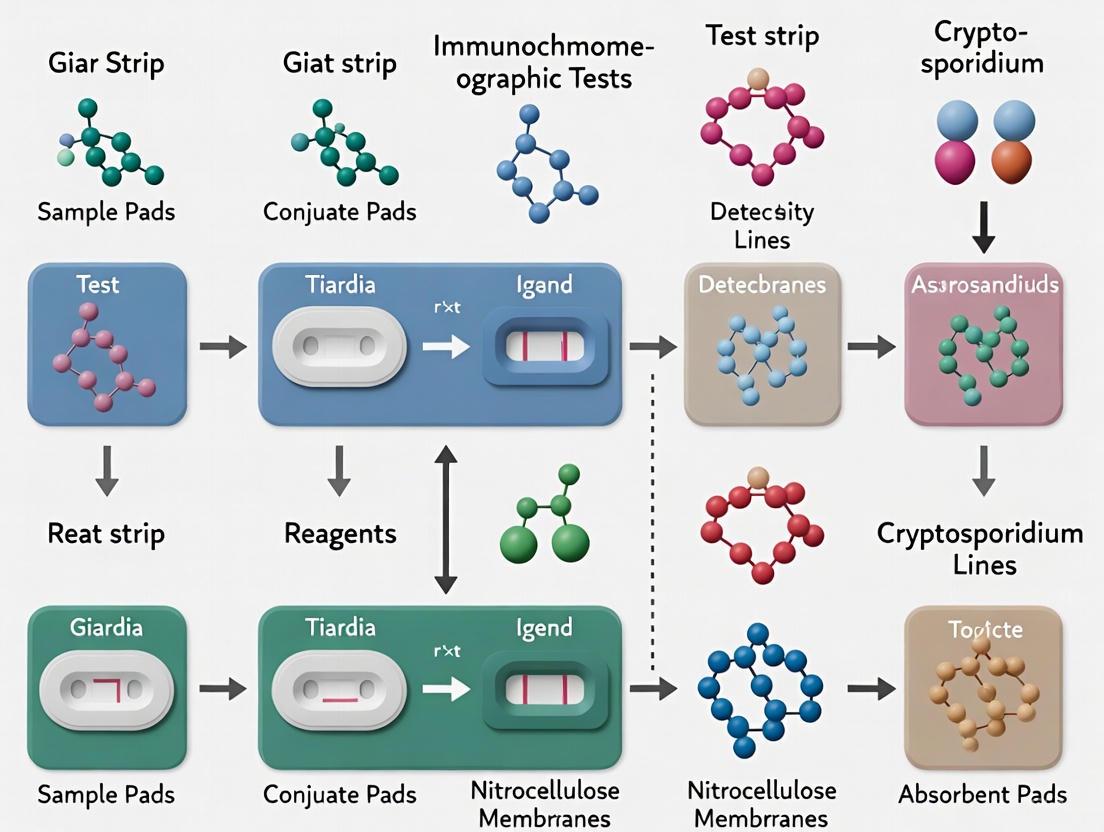
Workflow Visualization
The following diagram illustrates the typical workflow and components of a lateral-flow assay for Giardia and Cryptosporidium detection.
Diagram Title: Lateral Flow Assay Component Workflow
Performance Data and Comparative Analysis
The diagnostic performance of LFAs for Giardia and Cryptosporidium has been extensively evaluated against reference standards such as microscopy, enzyme-linked immunosorbent assay (ELISA), and polymerase chain reaction (PCR). The following tables summarize key quantitative data from multiple studies.
Table 1: Performance of LFA for Giardia lamblia Detection in Human Stool Samples [12]
| Diagnostic Metric | LFA Performance (%) | Microscopic Stool Examination (%) |
|---|---|---|
| Sensitivity | 91.6 | 94.5 |
| Specificity | 98.4 | 100 |
| Positive Predictive Value (PPV) | 97.0 | 100 |
| Negative Predictive Value (NPV) | 95.4 | 96.9 |
Table 2: Performance of LFA for Cryptosporidium spp. Detection
| Study / Reference Standard | Sensitivity (%) | Specificity (%) | PPV (%) | NPV (%) |
|---|---|---|---|---|
| Compared to ELISA [10] | 100 | 94 | 89 | 100 |
| Compared to Microscopy [12] | 91.6 | 100 | 100 | 98.8 |
| In a Multi-Method Comparison [11] | 15* | 18* | - | - |
Note: [11] reported detection rates, not traditional sensitivity/specificity. The detection rates for 205 stool samples were: PCR (18%), ICT (15%), Modified Kinyoun's Stain (7%), and Routine Microscopy (6%).
Table 3: Comparative Diagnostic Method Overview [11] [8] [14]
| Method | Principle | Key Advantage | Key Limitation |
|---|---|---|---|
| Lateral Flow (ICT) | Antigen detection via immunochromatography | Rapid (10-15 min), easy use, suitable for point-of-care | Variable sensitivity, dependent on parasite burden |
| Microscopy | Visual identification of (oo)cysts | Low cost, can detect multiple parasites | Requires skilled technician, low sensitivity |
| Direct Fluorescent Antibody (DFA) | Fluorescently labelled antibodies for (oo)cyst detection | High sensitivity and specificity, considered a gold standard | Requires fluorescence microscope |
| PCR | Amplification of parasite DNA | Highest sensitivity, species identification | High cost, requires specialized lab and personnel |
| Modified Kinyoun's Stain | Acid-fast staining of oocysts | Does not require specific antibodies | Low sensitivity and specificity, time-consuming |
Detailed Experimental Protocols
This protocol is adapted from studies evaluating the TechLab Crypto/Giardia Lateral Flow test and the RIDAQUICK Cryptosporidium/Giardia Combi test.
I. Materials and Reagents
- LFA Cassette/Dipstick: TechLab Crypto/Giardia Lateral Flow or RIDAQUICK Crypto/Giardia Combi.
- Specimen Dilution Tube: Containing buffered protein solution.
- Pipette and tips (capable of dispensing 50-120 µL).
- Timer.
- Fecal Sample: Unpreserved, stored at 2-8°C if processed within 1-3 days, or at -20°C for longer storage.
II. Procedure
- Sample Preparation: Bring the fecal sample and all test components to room temperature.
- Homogenization: Mix the fecal specimen thoroughly.
- Aliquot: Transfer 50 µL of specimen (or 125 µL for liquid stool) into the specimen dilution tube containing the provided diluent.
- Application: Insert the sample end of the test strip into the specimen dilution tube.
- Incubation: Allow the test to develop at room temperature for 10 minutes.
- Result Interpretation:
- Positive: Both a control line and a test line are visible. The color intensity can vary from dark red to light pink and does not correlate with the antigen concentration.
- Negative: Only the control line is visible.
- Invalid: If the control line is absent, the test is invalid and must be repeated.
For enhanced specificity, a two-step algorithm can be employed where LFA-positive samples are confirmed by a secondary method.
I. Materials and Reagents
- All materials from the basic LFA protocol.
- AlcorFix or similar fixative.
- Mini Parasep SF solvent-free collection tube.
- Auramine Aerospray TB fluorescent stain.
- Fluorescence Microscope.
II. Procedure
- LFA Screening: Perform the LFA test as described in Protocol 4.1. Record all positive results.
- Sample Fixation: Fix LFA-positive stool samples in AlcorFix and prepare a concentrate using the Mini Parasep SF system according to the manufacturer's instructions, which includes centrifugation at 1500 rpm for 2 minutes.
- Slide Preparation: Smear the resulting sediment onto a glass slide and allow it to air-dry.
- Staining: Stain the smear using auramine following the manufacturer's protocol.
- Microscopy: Examine the stained slide under a fluorescence microscope. Cryptosporidium oocysts will appear as brilliant green-yellow spheres.
- Confirmation: A sample is considered a confirmed positive only if it is positive by both LFA and auramine staining.
The Scientist's Toolkit: Essential Research Reagent Solutions
Table 4: Key Reagents and Materials for LFA-Based Giardia/Cryptosporidium Research
| Item | Function/Application | Example Brands/Assays |
|---|---|---|
| Lateral Flow Cassettes | Core device for rapid antigen detection; contains immobilized antibodies. | RIDAQUICK Crypto/Giardia (R-Biopharm), TechLab Crypto/Giardia Lateral Flow, Crypto/Giardia ICT (Biotech, Spain) |
| Monoclonal Antibodies | Target-specific antibodies conjugated to gold particles or used as capture lines. | TechLab, Meridian Biosciences (MERIFLUOR) |
| Specimen Dilution Buffer | Buffered protein solution to prepare liquid sample for capillary flow. | Included in commercial LFA kits |
| Auramine-Rhodamine Stain | Fluorescent dye for confirmatory microscopy of acid-fast oocysts. | Auramine Aerospray TB (Elitech) |
| Immunomagnetic Separation (IMS) Kits | Concentration and purification of (oo)cysts from complex matrices like water. | TCS Biosciences Isolate system, Dynabeads |
| DNA Extraction Kits | Molecular confirmation and genotyping; extraction from swabs/buffer is possible. | DNeasy Blood & Tissue Kit (Qiagen) |
| Real-Time PCR Kits | Highly sensitive detection and species identification; gold standard for molecular studies. | CeeramTOOLS (bioMérieux), Multiplex real-time PCR assays |
Immunochromatographic lateral-flow technology provides a robust, rapid, and user-friendly platform for the detection of Giardia and Cryptosporidium antigens. Its strong performance characteristics, with sensitivities and specificities often exceeding 90% compared to ELISA and microscopy, support its utility in both clinical and research settings [12] [10]. The integration of LFAs into two-step diagnostic algorithms, which may include fluorescent staining or PCR confirmation, offers a powerful approach that balances speed with accuracy [11] [13]. For researchers and drug development professionals, a deep understanding of the core principles, performance metrics, and detailed protocols outlined in these application notes is essential for the effective deployment, evaluation, and advancement of these critical diagnostic tools in the ongoing fight against parasitic diseases.
This document provides detailed application notes and protocols for researchers and scientists focused on the development of immunochromatographic tests (ICTs) for the detection of Giardia duodenalis (also known as Giardia lamblia) and Cryptosporidium spp. The identification of highly immunogenic and abundantly expressed proteins is a critical prerequisite for designing sensitive and specific diagnostic assays. This paper focuses on the characterization and utilization of two key antigenic targets: Alpha-1 giardin in Giardia and specific Oocyst Wall Proteins in Cryptosporidium. The protocols herein are framed within a broader research context aimed at improving rapid diagnostic tools for these significant waterborne and zoonotic pathogens.
Key Antigenic Targets in Giardia duodenalis
Alpha-1 Giardin: An Immunodominant Annexin
Alpha-1 giardin is a well-characterized, immunodominant protein in Giardia duodenalis [15]. It belongs to the annexin superfamily and is expressed in both major human-infective assemblages (A and B) of the parasite [16]. Its significance in diagnostics stems from several key characteristics:
- High Immunoreactivity: The protein is a major target of the human humoral immune response during infection. Epitopes located between amino acids 160 and 200 are particularly immunogenic and are recognized by commercial diagnostic tests like the Triage Parasite Panel [15].
- Surface Localization: Immunofluorescence studies confirm that alpha-1 giardin is associated with the plasma membrane of trophozoites and is displayed on the surface of recently excysted cells, making it accessible for antibody binding in diagnostic assays [15] [16].
- Functional Role: Like other annexins, recombinant alpha-1 giardin exhibits Ca²⁺-dependent binding to glycosaminoglycans (GAGs), particularly heparan sulphate, which is abundant in the intestinal tract. This interaction suggests a key role in host-parasite attachment [15].
Table 1: Characteristics of Key Giardia Antigenic Targets
| Antigen | Protein Family | Localization | Expression in Assemblages A & B | Key Diagnostic Feature |
|---|---|---|---|---|
| Alpha-1 Giardin | Annexin | Plasma Membrane, Surface | Yes [16] | Immunodominant; GAG-binding activity [15] |
| Beta-Giardin | Striated Fiber-Assemblin | Ventral Disc | Yes (localization differences exist) [16] | Structural protein; used for immunomagnetic enrichment [17] |
| CWP1 / CWP2 | Cyst Wall Protein | Cyst Wall | Yes | Forms a 65 kDa complex; target of many commercial ICTs [18] |
Other Relevant Giardia Antigens
While alpha-1 giardin is a major target, other structural and cyst wall proteins are also critical for detection:
- Beta-Giardin: A ventral disc protein recently identified as a component of the cyst outer wall. Immunomagnetic beads targeting β-giardin have demonstrated an enrichment efficiency of 65% for G. duodenalis cysts from fecal samples, confirming its utility in sample preparation and detection methodologies [17].
- Cyst Wall Proteins (CWPs): CWP1 and CWP2 are the established targets for many commercial rapid tests. These proteins form a 65 kDa complex within the cyst wall, which is the primary target for antibodies in several immunochromatographic assays [18].
Key Antigenic Targets in Cryptosporidium
Oocyst Wall Antigens
The detection of Cryptosporidium primarily relies on identifying antigens associated with the robust oocyst wall, which allows the parasite to survive in the environment. Unlike Giardia, the specific protein identities targeted by commercial Cryptosporidium ICTs are often proprietary. However, diagnostic methods universally exploit the antigenicity of the oocyst wall.
- Microscopy with Staining: Traditional methods use modified acid-fast staining, which dyes the oocyst wall a pinkish-red color, allowing for visualization against a counterstained background [19].
- Immunofluorescence (DFA): The gold standard method uses fluorescently labelled monoclonal antibodies that bind to cell wall antigens of Cryptosporidium oocysts, providing high sensitivity and specificity [19] [8]. The oocysts, measuring 4-6 μm, appear bright apple-green under a fluorescence microscope [8].
- Antigen Detection: Enzyme immunoassays (EIA) and ICTs detect soluble Cryptosporidium antigens shed from the oocyst wall in fecal specimens [19] [20]. These tests are highly specific and do not cross-react with other parasites or human cells [20].
Table 2: Performance of Antigen-Detection Methods for Cryptosporidium & Giardia
| Method Format | Example Product | Total Time | Sensitivity | Specificity | Reference |
|---|---|---|---|---|---|
| Immunochromatography (ICT) | ColorPAC Giardia/Cryptosporidium | ~12 min | Crypto: 97.6%; Giardia: 100% | 100% for both | [20] |
| Immunochromatography (ICT) | ImmunoCard STAT! | ~12 min | Crypto: 98.8%; Giardia: 93.5% | 100% for both | [9] |
| Direct Fluorescent Antibody (DFA) | Merifluor | Varies | Gold Standard | Gold Standard | [19] [8] |
| Enzyme Immunoassay (EIA) | ProSpecT Microplate | Several hours | Variable, high | Variable, high | [19] [14] |
Experimental Protocols for Antigen Characterization and Assay Development
Protocol: Immunofluorescence Localization of Alpha-1 Giardin
This protocol is adapted from studies characterizing the subcellular localization of giardins in different G. lamblia assemblages [16].
1. Trophozoite Preparation:
- Cultivate G. lamblia trophozoites (e.g., WB strain for Assemblage A, GS strain for Assemblage B) in modified TYI-S-33 medium for 72 hours at 37°C.
- Harvest trophozoites by chilling cultures on ice and dislodging attached cells. Centrifuge at 500 × g for 10 min at 4°C and wash the pellet three times with phosphate-buffered saline (PBS).
2. Cell Fixation and Staining:
- Allow washed trophozoites to attach to multi-well slides in a humidified chamber at 37°C for 1 hour.
- Fix cells with a 1:1 acetone/methanol solution at -20°C for 30 minutes.
- Rehydrate with PBS and block with 3% Bovine Serum Albumin (BSA) in PBS for 30 minutes.
- Incubate with a primary monoclonal antibody against alpha-1 giardin (undiluted hybridoma supernatant) at 37°C for 1 hour.
- Wash three times with PBS.
- Incubate with a FITC-conjugated goat anti-mouse secondary antibody in the dark for 1 hour.
- Wash, mount, and visualize using a confocal fluorescence microscope.
Key Finding: This protocol confirms that alpha-1 giardin localizes to the plasma membrane in both Assemblage A and B trophozoites, validating its broad suitability as a diagnostic target [16].
Protocol: Development of an Immunomagnetic Bead Enrichment System for Giardia Cysts
This protocol outlines the steps for creating an immunomagnetic separation system targeting cyst wall proteins, based on a recent study using β-giardin [17] [21].
1. Cyst Purification and Protein Biotinylation:
- Purify G. duodenalis cysts from infected gerbil feces using sequential sieving, centrifugation, and sucrose density gradient purification.
- Resuspend purified cysts (1 × 10⁸ cysts/mL) in PBS with 1 mM PMSF (protease inhibitor).
- Label cyst surface proteins by adding 2 mM NHS-biotin and incubating at 4°C on a rotator for 2 hours.
- Wash cysts with cold PBS to remove unbound biotin.
2. Protein Purification and Antibody Production:
- Lyse biotin-labeled cysts using ultrasonication.
- Incubate the lysate with streptavidin magnetic beads at 37°C for 90 minutes to capture biotinylated outer wall proteins.
- Purify the bead-bound proteins and use them to immunize BALB/c mice for polyclonal antibody production.
3. Immunomagnetic Bead Preparation and Cyst Enrichment:
- Couple the generated anti-β-giardin polyclonal antibodies to magnetic beads.
- To enrich cysts from a fecal sample, mix the sample with the immunomagnetic beads.
- Use a magnetic rack to separate the bead-bound cysts from the fecal debris.
- The enriched cysts can be used for downstream detection, such as PCR or microscopy.
Efficiency: This method achieved a 65% cyst enrichment efficiency from fecal samples, demonstrating its utility as a sample concentration step prior to final detection [17].
Protocol: Evaluating a Commercial Immunochromatographic Test
This is a standard operating procedure for validating a rapid test against reference methods, as used in multiple evaluation studies [20] [9].
1. Sample Preparation:
- Use fresh, frozen, or formalin-fixed stool specimens. For fixed specimens, ensure compatibility with the test (e.g., 5 or 10% formalin, SAF).
- For unconcentrated testing, pipette 60 μL of stool directly into the sample treatment buffer tube provided in the kit.
2. Test Procedure:
- Add the specified volume of conjugate and detection reagents to the sample tube.
- Mix thoroughly and immediately pour the mixture into the test device well.
- Read the results after 10 minutes. A positive result is indicated by a gray-black line in the appropriate test zone ("Giardia" or "Cryptosporidium"), regardless of intensity.
3. Quality Control:
- Include a positive control to validate the test result.
- For discrepant results (ICT negative but microscopy positive), retest using a more sensitive method like Direct Fluorescent Antibody (DFA) or PCR.
The Scientist's Toolkit: Research Reagent Solutions
Table 3: Essential Research Reagents for Antigen Detection Development
| Reagent / Material | Function / Application | Example Use Case |
|---|---|---|
| Monoclonal Antibodies (anti-α-1 giardin) | Precise localization and characterization of target antigen; core component of capture/detection systems. | Determining plasma membrane localization in WB vs. GS trophozoites [16]. |
| Streptavidin Magnetic Beads | Purification of biotin-labeled proteins or immunomagnetic enrichment of target cells from complex samples. | Isolation of biotinylated cyst outer wall proteins for proteomics [17] [21]. |
| NHS-Biotin | Labels primary amines (e.g., lysine residues) on proteins for purification or detection via streptavidin. | Surface biotinylation of G. duodenalis cysts [17]. |
| Direct Fluorescent Antibody (DFA) Kit | Gold standard method for detecting (oo)cysts; used for validating new assays and resolving discrepancies. | Used as a reference method to evaluate the performance of ICTs [20] [8]. |
| Immunochromatographic Test Device | Solid-phase membrane for conducting rapid, qualitative antigen detection tests. | ColorPAC, ImmunoCard STAT! for detecting and distinguishing Giardia and Crypto [20] [9]. |
Workflow and Pathway Diagrams
The following diagram illustrates the logical workflow for developing an immunodetection assay, from target identification to clinical validation.
Diagram 1: Immunoassay Development Workflow
This second diagram summarizes the key antigenic targets in Giardia and their primary localizations, which dictates their suitability for different diagnostic approaches.
Diagram 2: Giardia Antigen Localization by Stage
The continuous development and refinement of immunochromatographic tests for Giardia and Cryptosporidium rely on a deep understanding of key antigenic targets. Alpha-1 giardin stands out for Giardia due to its immunodominance and surface accessibility, while the oocyst wall antigens remain the primary focus for Cryptosporidium detection. The experimental protocols provided—ranging from protein localization and immunomagnetic enrichment to test evaluation—offer a framework for researchers to validate existing assays and innovate new ones. Future work should aim to identify even more specific and sensitive targets, combine them in multiplex formats, and adapt these technologies for point-of-care use in both clinical and field settings to better control these pervasive parasitic infections.
In the diagnostic landscape for enteric parasites such as Giardia lamblia and Cryptosporidium parvum, a significant gap has persisted between the need for rapid, accurate results and the limitations of traditional methods. For decades, microscopic examination of stool specimens has been the cornerstone of diagnosis, yet it is hampered by requirements for skilled microscopists, variable sensitivity, and time-intensive procedures [20] [9]. The emergence of rapid immunochromatographic tests (ICTs) represents a paradigm shift in diagnostic approach, leveraging antibody-antigen interactions to deliver precise results in minutes rather than hours. This application note details the technical superiority of antigen detection assays over traditional microscopy, providing structured experimental data and standardized protocols to guide researchers and development professionals in advancing this critical diagnostic field. The transition to immunochromatographic methods addresses not only diagnostic accuracy concerns but also broader challenges in healthcare delivery, including resource limitations in various settings and the urgent need for rapid results in outbreak situations [20].
Comparative Performance Data
The diagnostic performance of immunochromatographic tests for Giardia and Cryptosporidium significantly surpasses traditional microscopy, particularly in clinical settings where rapid turnaround times impact patient management and infection control.
Table 1: Comparative Performance of Microscopy vs. Rapid Immunochromatographic Tests
| Detection Method | Target Organism | Sensitivity (%) | Specificity (%) | Time to Result | Remarks |
|---|---|---|---|---|---|
| Traditional Microscopy [9] | Giardia lamblia | Variable (depends on parasite load) | Variable | 60+ minutes | Requires skilled microscopist; sensitivity drops with low parasite numbers |
| Traditional Microscopy [9] | Cryptosporidium parvum | Variable (depends on parasite load) | Variable | 60+ minutes | Requires special stains (e.g., modified acid-fast); sensitivity drops with low oocyst numbers |
| ColorPAC Rapid ICT [20] | Giardia lamblia | 100 | 100 | ~12 minutes | No cross-reactivity with other parasites or human cells |
| ColorPAC Rapid ICT [20] | Cryptosporidium parvum | 97.6 | 100 | ~12 minutes | One false-negative result was confirmed positive by immunofluorescence |
| ImmunoCard STAT! Rapid ICT [9] | Giardia lamblia | 93.5 | 100 | ~12 minutes | False-negatives occurred with low parasite numbers or trophozoites only |
| ImmunoCard STAT! Rapid ICT [9] | Cryptosporidium parvum | 98.8 | 100 | ~12 minutes | One false-negative result was confirmed positive by immunofluorescence |
The structured data demonstrates a consistent pattern of high specificity across immunochromatographic tests, a critical factor in preventing false positives and unnecessary treatments. The sensitivity of these rapid tests, while generally high, shows some variability contingent on parasite load within specimens. Notably, false-negative results are predominantly associated with specimens containing low parasite numbers or, in the case of Giardia, specimens containing only trophozoites [9]. This underscores a fundamental diagnostic principle: no single test is infallible. For patients who remain symptomatic following a negative rapid test result, additional diagnostic procedures including comprehensive ova and parasite examination and special stains for other coccidia and microsporidia should be pursued [9].
Experimental Protocol: ImmunoCard STAT! Rapid Assay
This section provides a detailed step-by-step protocol for performing the ImmunoCard STAT! Cryptosporidium/Giardia Rapid Assay, representative of modern immunochromatographic tests for these pathogens.
Principle
The ImmunoCard STAT! is a solid-phase qualitative immunochromatographic assay that detects and distinguishes between Giardia lamblia and Cryptosporidium parvum specific antigens in aqueous extracts of human fecal specimens [9]. The test uses specific antibodies to capture and immobilize antigens on a membrane. A colloidal carbon-conjugated detection reagent provides a visual signal (a gray-black line) in the result area for a positive test.
Specimen Collection and Preparation
- Specimen Type: Human fecal specimens.
- Acceptable Fixatives: Fresh, frozen, unfixed, or fixed in 5 or 10% formalin or sodium acetate-acetic acid-formalin (SAF) [9].
- Specimen Processing: Tests are performed using unconcentrated, preserved stool specimens. No centrifugation or additional processing is required prior to the test.
Materials and Reagents Provided
- Test devices
- Sample treatment buffer
- Giardia capture antibody conjugate
- Colloidal carbon-conjugated detection reagent
- Tubes and pipettes
Step-by-Step Procedure
- Tube Preparation: Add 2 drops of sample treatment buffer to the provided tube.
- Sample Addition: Pipette 60 µl of uncentrifuged, preserved stool specimen into the same tube.
- Conjugate Addition: Add 2 drops of the Giardia capture antibody conjugate to the tube.
- Detection Reagent Addition: Add 2 drops of the colloidal carbon-conjugated detection reagent for Giardia and Cryptosporidium to the tube.
- Mixing: Mix the sample thoroughly within the tube. Note that none of these reagent addition steps are timed, and reagents can be pipetted sequentially one after the other.
- Application: Immediately pour the mixed sample into the sample well of the test device.
- Incubation and Reading: Allow the test device to stand for 10 minutes at room temperature. Read the results visually after this incubation period.
Interpretation of Results
- Positive for Giardia: A gray-black line (of any intensity) appears in the "Giardia" zone.
- Positive for Cryptosporidium: A gray-black line (of any intensity) appears in the "Cryptosporidium" zone.
- Negative: No lines appear in either the Giardia or Cryptosporidium zones.
- Control: A control line should appear in the control zone to validate the test. If the control line does not appear, the test is considered invalid and must be repeated with a new device.
- Note: The test is designed to detect and distinguish between the two organisms simultaneously. It is possible to have a positive result for one, both, or neither organism.
Quality Control
- The built-in control line serves as an internal procedural control.
- It is recommended that positive and external controls be tested according to local laboratory accreditation requirements to ensure reagent and assay performance.
The Scientist's Toolkit: Research Reagent Solutions
The successful implementation and development of immunochromatographic tests for enteric parasites rely on a core set of reagents and materials. The following table details these essential components and their functions within the assay system.
Table 2: Essential Research Reagents for Immunochromatographic Test Development
| Reagent/Material | Function | Application Example |
|---|---|---|
| Capture Antibodies | Immobilized on the test membrane to bind specific target antigens from the sample. | Anti-Giardia and anti-Cryptosporidium monoclonal antibodies fixed at distinct test lines on the nitrocellulose strip [9]. |
| Detection Antibody Conjugates | Antibodies linked to a reporter molecule that bind to the target antigen, forming a sandwich complex. | Giardia-specific antibody conjugated to colloidal carbon or other markers [9]. |
| Colloidal Carbon/Latex Beads | Visual reporter particles that create a visible line upon accumulation at the test zone. | Colloidal carbon-conjugated detection reagent provides a gray-black positive line [20] [9]. |
| Nitrogen-Vacancy (NV) Nanodiamonds | Advanced fluorescent labels with spin-dependent fluorescence; offer potential for ultra-high sensitivity by removing background interference [22]. | Used in next-generation lateral flow tests for SARS-CoV-2; potential application for parasitic antigens to lower detection limits. |
| Nitrocellulose Membrane | Porous matrix that facilitates capillary flow of the sample and contains immobilized capture reagents. | The solid-phase substrate on which the immunochromatographic separation and reaction occur [22]. |
| Sample Treatment Buffer | Medium for homogenizing the stool specimen and optimizing pH and ionic strength for antigen-antibody binding. | Contains buffers and surfactants to release antigens and ensure consistent flow and reaction [9]. |
| Conjugate Release Pad | Reservoir that stores the detection antibody conjugates in a dry state, releasing them upon sample application. | Pre-loaded with colloidal carbon- or nanodiamond-conjugated antibodies that solubilize upon contact with the liquid sample [22]. |
Technological Advancements and Future Directions
The evolution of immunochromatographic tests continues with the integration of advanced materials and detection technologies. Quantum biosensors, particularly those utilizing nitrogen-vacancy (NV) centers in nanodiamonds, represent a cutting-edge development. These spin-enhanced fluorescent nanodiamonds offer remarkable sensitivity and robustness by controlling spin-dependent fluorescence to eliminate background autofluorescence, a common limitation in complex clinical samples like stool specimens [22]. The technological principle involves optically detected magnetic resonance (ODMR), where the fluorescence intensity of NV centers can be selectively modulated, providing a specific mechanism for lock-in detection that is highly resistant to background interference [22].
While initially demonstrated for SARS-CoV-2 antigen detection with 95.1% sensitivity and 100% specificity, this platform is target-agnostic and holds significant promise for parasitic disease diagnostics where sensitivity remains a challenge [22]. The application of such advanced materials could potentially bridge the remaining sensitivity gaps in low parasite load specimens, further widening the diagnostic advantage over traditional microscopy.
The diagnostic gap between traditional microscopy and rapid antigen detection for Giardia lamblia and Cryptosporidium parvum is both significant and consequential. Immunochromatographic tests close this gap by delivering high sensitivity and exceptional specificity in minutes rather than hours, with minimal technical training required [20] [9]. This application note has detailed the quantitative performance advantages, provided a reproducible experimental protocol for one such test, and highlighted emerging technologies that promise to further enhance diagnostic capabilities. For researchers and drug development professionals, these assays represent not merely an incremental improvement but a fundamental advancement in diagnostic philosophy—shifting from operator-dependent morphological identification to standardized, accessible molecular detection. As the diagnostic landscape evolves, the integration of these rapid platforms into clinical and public health practice will be crucial for improving patient outcomes and strengthening global health security.
This document outlines the ideal use cases and detailed protocols for immunochromatographic tests (ICTs) in the detection of Giardia and Cryptosporidium. These rapid diagnostic tests are particularly suited for outbreak investigations, field studies, and resource-limited settings where traditional laboratory infrastructure is unavailable or impractical. The speed, ease of use, and minimal equipment requirements of ICTs enable public health and research professionals to perform rapid screening and initiate timely control measures.
Table 1: Performance Characteristics of Immunochromatographic Tests (ICTs) for Giardia and Cryptosporidium
| Test Metric | Giardia Detection | Cryptosporidium Detection | Notes |
|---|---|---|---|
| Reported Sensitivity | 93.5% [9] | 98.8% [9] | Compared to reference methods (microscopy, DFA). |
| Reported Specificity | 100% [9] | 100% [9] | No cross-reactivity with other common intestinal parasites [9]. |
| Time to Result | ~10-15 minutes [9] | ~10-15 minutes [9] | Significantly faster than PCR, microscopy, or ELISA. |
| Comparative Detection Rate | Information Missing | 15% (vs. 18% for PCR, 7% for MKS, 6% for routine microscopy) [11] | ICT demonstrated superior sensitivity to conventional methods but lower than PCR. |
| Sample Type | Aqueous extracts of human fecal specimens (fresh, frozen, or fixed in formalin-based fixatives) [9] | Aqueous extracts of human fecal specimens (fresh, frozen, or fixed in formalin-based fixatives) [9] | Unpreserved stool samples can also be used, stored at 2-8°C for 1-3 days or frozen [11]. |
Experimental Protocols
Protocol 1: Rapid Detection ofGiardiaandCryptosporidiumfrom Stool Samples Using a Commercial ICT Cassette
This protocol is adapted from established commercial kit procedures and validation studies [9] [23]. It is designed for use with devices that detect and distinguish between Giardia lamblia and Cryptosporidium parvum antigens.
Research Reagent Solutions & Materials
| Item | Function/Description |
|---|---|
| ImmunoCard STAT! or Equivalent Combo Test | Solid-phase qualitative immunochromatographic cassette that detects and distinguishes Giardia and Cryptosporidium antigens [9]. |
| Sample Treatment Buffer | Diluent provided with the kit to prepare the stool sample. |
| Giardia Capture Antibody Conjugate | Antibody conjugate specific for Giardia antigens. |
| Colloidal Carbon-Conjugated Detection Reagent | Detection reagent for both Giardia and Cryptosporidium [9]. |
| Disposable Pipettes & Test Tubes | Supplied with the kit for precise liquid handling. |
| Timer | To accurately monitor the development time. |
Step-by-Step Procedure
- Sample Preparation: Add 2 drops of the provided Sample Treatment Buffer into a clean test tube.
- Specimen Addition: Pipette 60 µL of uncentrifuged, preserved (e.g., formalin-fixed) or unpreserved stool specimen into the same tube.
- Conjugate Addition: Add 2 drops of the Giardia Capture Antibody Conjugate to the tube.
- Detection Reagent Addition: Add 2 drops of the Colloidal Carbon-Conjugated Detection Reagent to the tube. No precise timing is required between these reagent addition steps.
- Mix and Load: Mix the solution in the tube thoroughly and immediately pour the entire contents into the sample well of the test device (cassette).
- Incubation and Reading: Allow the test device to stand at room temperature for 10 minutes. After 10 minutes, visually read the results. A positive result is indicated by the appearance of a gray-black line (of any intensity) in the section corresponding to "C" for Cryptosporidium and/or "G" for Giardia. A control line must appear for the test to be valid [9].
Protocol 2: In-House ICT Workflow for Antigen Detection
This generalized protocol, inspired by the development of custom lateral flow tests for other pathogens, illustrates the key steps in preparing and running an ICT strip [24]. It is useful for researchers developing or validating in-house assays.
Workflow for Antigen Detection
Research Reagent Solutions & Materials
| Item | Function/Description |
|---|---|
| Custom ICT Strip | Assembled strip with sample, conjugate, and absorbent pads on a backing card [24]. |
| Nitrocellulose Membrane | Membrane with pre-sprayed test and control lines. |
| Colloidal Gold-Conjugated mAb | Detection antibody conjugated to colloidal gold, dried on the conjugate pad [24]. |
| BSA-based Sample Running Buffer | Buffer to ensure optimal flow and interaction of the sample with the conjugate [24]. |
| Cassette Housing | Plastic casing to hold the strip for clean sample application and reading. |
Step-by-Step Procedure
- Strip Assembly (Pre-test): The test strip is assembled from a backing card onto which a sample pad, conjugate pad (pre-treated and sprayed with colloidal gold-conjugated monoclonal antibody), nitrocellulose membrane (pre-sprayed with the capture ligand at the test line and a control antibody at the control line), and an absorbent pad are sequentially overlapped and attached [24].
- Sample Preparation: Mix approximately 40 µL of the liquid stool sample with an equal volume (40 µL) of BSA-based Sample Running Buffer in a test tube.
- Test Execution: Load the entire mixture into the sample well of the cassette housing the strip. Alternatively, the strip can be dipped directly into the tube containing the prepared sample.
- Result Interpretation: Read the results visually after 10-15 minutes. A positive result is indicated by bands on both the test and control lines. A negative result is indicated by a single band on the control line only. The intensity of the test line can be graded (e.g., + to +++) for semi-quantitative assessment [24].
The Scientist's Toolkit
Table 2: Essential Research Reagent Solutions for ICT-Based Detection
| Reagent/Material | Critical Function | Technical Notes |
|---|---|---|
| Capture Ligand (Test Line) | Immobilized on the membrane to specifically bind the target antigen. | Can be a specific monoclonal antibody (mAb) [24] or a recombinant protein receptor (e.g., ephrin B2 for henipaviruses) [24]. |
| Detection Conjugate | Binds to the target antigen to generate a visual signal. | Typically a specific mAb conjugated to a visual label like colloidal gold [24] or colloidal carbon [9]. |
| Nitrocellulose Membrane | The matrix that supports capillary flow and where the immunochromatographic reaction occurs. | The pore size and flow rate are critical parameters for assay performance. |
| Control Line Antibody | Binds the detection conjugate to confirm proper liquid flow and reagent functionality. | Often an anti-species antibody (e.g., anti-mouse IgG) that captures the labeled mAb [24]. |
| Sample Running Buffer | Optimizes sample pH, ionic strength, and viscosity to ensure consistent antigen-antibody binding and flow. | Often contains proteins like BSA to block non-specific binding and surfactants [24]. |
| Conjugate Pad Pretreatment Solution | Stabilizes the colloidal gold-conjugated mAb and promotes its release upon contact with the sample. | A common solution contains sucrose (as a stabilizer), BSA (a blocking agent), and Tween 20 (a surfactant) [24]. |
Methodology in Practice: Protocols, Workflows, and Real-World Application of ICTs
This Standard Operating Procedure (SOP) outlines the methodology for the detection and differentiation of Giardia lamblia and Cryptosporidium parvum antigens in human fecal specimens using a rapid immunochromatographic assay. This protocol is designed for use in clinical and research settings to support studies on enteric parasites, particularly within the broader context of developing and improving immunochromatographic tests for these pathogens. The procedure is based on the ImmunoCard STAT! Cryptosporidium/Giardia rapid assay, a solid-phase qualitative test that utilizes specific antibodies to capture and immobilize antigens on a membrane [9]. The result is visualized by the appearance of a gray-black color bar on the test device, providing a distinction between the two organisms in approximately 12 minutes [9].
Scope and Applicability
This SOP applies to the analysis of fresh, frozen, unfixed, or fixed (in 5-10% formalin or sodium acetate-acetic acid-formalin) human fecal specimens [9]. It is intended for use by trained researchers, scientists, and laboratory technicians involved in the diagnosis of parasitic infections, validation of diagnostic assays, or drug development projects targeting giardiasis and cryptosporidiosis.
Experimental Protocols and Detailed Methodologies
Specimen Collection and Handling
- Collection: Collect fecal specimens in clean, leak-proof containers. For fixed specimens, immediately add a sufficient volume of 5% or 10% formalin or sodium acetate-acetic acid-formalin (SAF) to the specimen [9].
- Storage and Transport: Store specimens at 2-8°C if testing is to be performed within 24 hours. For preserved specimens or if testing is delayed, samples can be stored frozen or at 2-8°C for longer periods. Transport to the laboratory under chilled conditions [14] [9].
- Note: For optimal diagnostic accuracy, testing of at least three consecutive fecal specimens is recommended, as the shedding of cysts can be sporadic [14].
Sample Preparation
Materials: Sample treatment buffer, test tube (provided in kit), pipette. Procedure:
- Add 2 drops of the provided sample treatment buffer into a clean test tube from the kit [9].
- Pipette 60 µl of a well-mixed, uncentrifuged stool specimen into the same tube [9].
- Add 2 drops of the Giardia capture antibody conjugate to the tube [9].
- Add 2 drops of the colloidal carbon-conjugated detection reagent (for both Giardia and Cryptosporidium) to the tube [9].
- Mix the contents thoroughly. There are no specific timing requirements between these reagent addition steps [9].
Test Procedure and Chromatography
Materials: Prepared sample mixture, test device. Procedure:
- Immediately pour the entire mixed sample from the test tube into the sample well of the test device [9].
- Allow the test device to sit undisturbed at room temperature for 10 minutes [9].
- Read the results visually at the 10-minute mark. Do not interpret results after 12 minutes [9].
Result Interpretation
Interpret the results by observing the appearance of gray-black color bars in the results window of the test device, regardless of the intensity of the bar [9].
- Positive for Giardia: A color bar appears next to the "Giardia" label.
- Positive for Cryptosporidium: A color bar appears next to the "Cryptosporidium" label.
- Positive for Both: Color bars appear next to both labels.
- Negative: No color bar appears in either test area. A color bar must appear in the "Control" area for the test to be considered valid.
- Invalid: If no color bar appears in the "Control" area, the test is invalid and must be repeated with a new device and sample.
The following diagram illustrates the complete experimental workflow:
Clinical performance of the ImmunoCard STAT! assay was evaluated against reference methods (microscopy with staining or immunofluorescence). The summarized data below provides key quantitative metrics for researcher assessment [9].
Table 1: Performance Characteristics of the ImmunoCard STAT! Rapid Assay
| Organism | Sensitivity (%) | Specificity (%) | Positive Predictive Value (%) | Negative Predictive Value (%) |
|---|---|---|---|---|
| Giardia lamblia | 93.5 | 100 | 100 | 95.5 |
| Cryptosporidium parvum | 98.8 | 100 | 100 | 99.7 |
Table 2: Analysis of False-Negative Results for Giardia
| Cause of False-Negative Result | Number of Specimens |
|---|---|
| Low parasite numbers | 7 |
| Presence of trophozoites only | 3 |
| Numerous cysts (one specimen) | 1 |
The assay demonstrated no cross-reactivity with a panel of other organisms, including 10 different protozoa (152 challenges), nine different helminths (35 challenges), or human cells (4 challenges) [9].
The Scientist's Toolkit: Research Reagent Solutions
The following table details essential materials and their functions for executing this protocol.
Table 3: Essential Research Reagents and Materials
| Item | Function / Description |
|---|---|
| ImmunoCard STAT! Test Device | Solid-phase membrane containing immobilized specific antibodies for antigen capture and visualization [9]. |
| Sample Treatment Buffer | Prepares the sample matrix for optimal flow and interaction with conjugated antibodies [9]. |
| Giardia Capture Antibody Conjugate | Antibody specific to Giardia antigens, conjugated for the capture step in the test [9]. |
| Colloidal Carbon-Conjugated Detection Reagent | Detection antibody that binds to captured antigen-antibody complexes, producing a visible gray-black line [9]. |
| Reference Control Materials | For quality control; positive and negative controls to verify test performance. In water testing, products like EasySeed or ColorSeed are used as global reference standards [14]. |
| Immunomagnetic Separation (IMS) Kits | For complex samples (e.g., water), IMS systems like the TCS Biosciences Isolate system can concentrate and purify oocysts/cysts prior to testing [14]. |
| Monoclonal Antibody Staining Kits | Alternative detection methods (e.g., MERIFLUOR, EasyStain) used in reference methods for FA microscopy or PCR analysis [14]. |
Troubleshooting and Quality Control
- Quality Control: Each test device contains an internal control. Failure of the control line to appear invalidates the test run [9].
- False-Negative Results: Be aware that false-negative results can occur with Giardia, particularly in specimens with low parasite numbers or those containing only trophozoites (see Table 2) [9]. For patients who remain symptomatic after a negative result, additional testing via ova and parasite examination and special stains for other coccidia and microsporidia should be considered [9].
- Sample Considerations: The test is optimized for unconcentrated stool specimens preserved in formalin-based fixatives [9]. Performance may vary with other sample types.
Immunochromatographic tests (ICTs), or lateral flow assays, have become indispensable tools in clinical and research settings for the rapid detection of specific antigens, antibodies, or other biomarkers. Their value is particularly pronounced in the diagnosis of gastrointestinal protozoan infections, such as Giardia duodenalis (Giardia) and Cryptosporidium parvum (Cryptosporidium), where traditional diagnostic methods like microscopy require significant expertise, are time-consuming, and can lack sensitivity, especially when parasite loads are low [20] [25]. These rapid assays provide a cost-effective, user-friendly alternative that can deliver results in minutes, facilitating timely diagnosis and patient management. This review focuses on evaluating several commercial assay platforms, including ImmunoCard STAT! EHEC, Triage, RIDAQUICK, and ColorPAC, with a specific emphasis on their application in Giardia and Cryptosporidium detection research. We will summarize their key characteristics, provide detailed experimental protocols, and discuss their performance within the context of current scientific literature.
Several commercial platforms offer robust immunochromatographic tests for the detection of enteric pathogens. The table below summarizes the key characteristics of several relevant assays and platforms as identified in the current literature and manufacturer specifications.
Table 1: Key Characteristics of Selected Commercial Immunochromatographic Assay Platforms
| Platform/Test Name | Manufacturer | Detected Analyte(s) | Sample Type | Time to Result | Sensitivity / Specificity (as reported) |
|---|---|---|---|---|---|
| ColorPAC Giardia/Cryptosporidium | Becton Dickinson (Genzyme) | Giardia lamblia and Cryptosporidium parvum antigens [20] | Human stool (formalin-fixed, SAF, or unfixed) [20] | ~12 minutes [20] | G. lamblia: 100% / 100%; C. parvum: 97.6% / 100% vs. direct fluorescence [20] |
| Xpect Giardia/Cryptosporidium | Thermo Fisher Scientific | Giardia and Cryptosporidium antigens [26] | Human fecal specimens (fresh, frozen, or preserved) [26] | 15 minutes [26] | 95.8% to 97.9% sensitivity [26] |
| Crypto-Giardia-Entamoeba Rapid Test | Operon | Cryptosporidium sp., Giardia lamblia, and Entamoeba histolytica antigens [18] | Human stool [18] | ≤15 minutes [18] | Information not specified in search results |
| ImmunoCard STAT! EHEC | Meridian Bioscience | Shiga toxins produced by E. coli [27] | Not specified | 20 minutes [27] | 93.8% sensitivity / 99.7% specificity [27] |
| RIDAQUICK T-2/HT-2 RQS ECO | R-Biopharm | Sum of T-2 / HT-2 toxin (mycotoxins) [28] | Oats, wheat, corn [28] | 5 minutes incubation [28] | LOD: 50 μg/kg (ppb) [28] |
| Quidel Triage BNP Test | QuidelOrtho | B-type Natriuretic Peptide (BNP) [29] | EDTA whole blood or plasma [29] | ~15-20 minutes [29] | Information not specified in search results |
It is critical to note that the Quidel Triage Cardiac Panel, a related product from the same manufacturer as the Triage BNP Test, is currently subject to an FDA Class I recall due to reports of inaccurate, lower-than-expected troponin results, which could lead to a failure to diagnose myocardial infarction [30]. This highlights the importance of verifying the regulatory status and performance of all assay lots before use in research or clinical practice.
Table 2: Performance of Immunochromatographic Assays (ICAs) for Giardia Detection in a Hyperendemic Setting
| Diagnostic Method | Sensitivity in Rwandan Child Cohort (n=558) | Key Finding | Citation |
|---|---|---|---|
| Polymerase Chain Reaction (PCR) | Reference Standard (100%) | Considered the most sensitive method in this study. | [25] |
| Immunochromatographic Assay (ICA) | 50.4% | Superior to microscopy but missed half of the PCR-confirmed infections. | [25] |
| Light Microscopy | 29.5% | Significantly less sensitive than both ICA and PCR (p <0.0001). | [25] |
Detailed Experimental Protocols
To ensure reproducibility and reliability in research, standardized protocols for these assays are essential. Below are detailed methodologies for key tests based on manufacturer instructions and peer-reviewed publications.
Protocol for ColorPAC Giardia/Cryptosporidium Rapid Assay
The following protocol is adapted from the procedure used in the evaluation by Garcia et al. (2000) [20].
Principle: This is a solid-phase qualitative immunochromatographic assay that uses antibody-coated colloidal carbon-conjugated detection reagents. The complex migrates along a membrane and is captured at specific test lines for Giardia and Cryptosporidium.
Materials:
- ColorPAC Giardia/Cryptosporidium test kit (includes test devices, sample treatment buffer, Giardia capture antibody conjugate, and colloidal carbon detection reagent) [20].
- Uncentrifuged, preserved stool specimen (5% or 10% formalin, or SAF) [20].
- Timer and micropipette.
Procedure:
- Add 2 drops of the provided sample treatment buffer into a clean tube.
- Pipette 60 μL of the uncentrifuged, preserved stool specimen into the same tube.
- Add 2 drops of the Giardia capture antibody conjugate and 2 drops of the colloidal carbon-conjugated detection reagent to the tube.
- Mix the contents thoroughly by gently swirling the tube.
- Immediately pour the entire mixture into the sample well of the test device.
- Start the timer and allow the test to develop for 10 minutes.
- After 10 minutes, read the results visually. Positive results are indicated by gray-black lines in the respective Giardia (G) and Cryptosporidium (C) positions in the results window. A control line must appear for the test to be valid [20].
Protocol for Xpect Giardia/Cryptosporidium Test
Principle: This is a lateral flow immunoassay that uses antibody-coated color particles. The antigen-antibody complex is captured at the test region, producing a colored line.
Materials:
- Xpect Giardia/Cryptosporidium test device [26].
- Specimen dilution buffer and conjugate [26].
- Disposable transfer pipettes and dilution tubes [26].
Procedure:
- Add the required number of drops of conjugate into a dilution tube (exact volume as per kit insert).
- Add a specified volume of stool specimen (fresh, frozen, or preserved) into the same dilution tube using a provided transfer pipette.
- Mix the solution by vortexing or inverting the tube several times.
- Using a new transfer pipette, draw up the diluted sample and add the specified number of drops into the sample well (S) of the test device.
- Start the timer and read the results after 15 minutes. A blue line indicates Giardia antigen, and a red line indicates Cryptosporidium antigen. A control line must form for the test to be valid [26].
Workflow for Giardia/Cryptosporidium Immunochromatographic Testing
The following diagram illustrates the general logical workflow for performing and interpreting a typical immunochromatographic test for Giardia and Cryptosporidium, synthesizing the steps from the protocols above.
The Scientist's Toolkit: Essential Research Reagents and Materials
For researchers conducting studies on Giardia and Cryptosporidium using immunochromatographic tests, a standardized set of materials and reagents is required. The following table details key components of the research toolkit.
Table 3: Essential Research Reagent Solutions for Giardia/Cryptosporidium ICT Research
| Item | Function / Application | Example from Search Results |
|---|---|---|
| Immunochromatographic Test Kits | Core device for antigen detection; contains the strip, conjugate, and sample buffer. | ColorPAC Giardia/Cryptosporidium [20]; Xpect Giardia/Cryptosporidium Test [26]; Operon Crypto-Giardia-Entamoeba combo test [18]. |
| Positive Control Materials | Used to validate test performance and ensure reagents are functioning correctly. | RIDAQUICK ADM Monitoring Control Set [31] (example of a control set for a different test, illustrating the concept). |
| Specimen Preservation Media | For storage and transport of stool samples while maintaining antigen integrity. | 10% Formalin, SAF (Sodium Acetate-Acetic Acid-Formalin) [20]; Modified Cary-Blair w/Indicator [26]. |
| Reference Standard Tests | Gold-standard methods for determining true positive status to calculate sensitivity/specificity. | Merifluor Direct Fluorescent-Antibody (DFA) Assay [20]; Polymerase Chain Reaction (PCR) [25]; Microscopy (O&P examination) [20]. |
| Automated Reading Systems | Minimizes subjective visual interpretation errors and allows for result recording. | OPERON immunochromatography strip reader [18]; RIDASMART APP & smartphone [28]. |
Discussion and Research Implications
The data presented confirm that immunochromatographic tests offer a significant advantage over traditional microscopy in terms of speed and ease of use. However, the choice of platform and interpretation of results require careful consideration. The high sensitivity (100% for Giardia, 97.6% for Cryptosporidium) reported for the ColorPAC test in a controlled study [20] demonstrates the potential for excellent performance. In contrast, research from a hyperendemic area in Rwanda revealed that while ICA was more sensitive than microscopy, it still missed approximately half of the Giardia infections confirmed by PCR [25]. This discrepancy underscores a critical point for researchers: the sensitivity of an ICT can be highly dependent on the population prevalence and the genetic diversity of the circulating parasite strains.
Furthermore, the ability of tests like the Operon combo to differentially detect Cryptosporidium, Giardia, and Entamoeba histolytica in a single device is a major advancement for syndromic testing of diarrheal diseases [18]. The move towards automated reading systems, such as the RIDASMART APP [28] or the OPERON reader [18], minimizes human error in interpretation and facilitates data management, which is crucial for large-scale research studies.
In conclusion, commercial immunochromatographic tests provide powerful, rapid tools for the detection of Giardia and Cryptosporidium. Researchers must select assays based on validated performance metrics relevant to their study population and be aware of the limitations, including potential sensitivity issues compared to molecular methods like PCR. The ongoing development of multi-analyte tests and automated reading systems will continue to enhance the utility of these platforms in both research and clinical diagnostics.
The detection of enteric protozoan parasites such as Giardia duodenalis and Cryptosporidium spp. is a significant concern in both clinical and research settings, with these pathogens causing billions of cases of diarrheal disease annually worldwide [32]. The choice between formalin-fixed and fresh-frozen stool specimens represents a critical methodological crossroads that directly impacts the performance of downstream diagnostic applications, including immunochromatographic tests (ICTs) and molecular assays. This application note provides a structured comparison of these preservation methods, detailing their advantages, limitations, and optimal implementation protocols to support researchers and scientists in the development of robust diagnostic solutions.
Comparative Analysis of Sample Preservation Methods
The selection of an appropriate specimen preservation method must align with the intended diagnostic or research objectives. The table below summarizes the key characteristics of formalin-fixed versus fresh-frozen stool specimens for the detection of Giardia and Cryptosporidium.
Table 1: Comparison of Formalin-Fixed and Fresh-Frozen Stool Specimens for Parasite Detection
| Parameter | Formalin-Fixed Specimens | Fresh-Frozen Specimens |
|---|---|---|
| Primary Applications | Immunochromatographic tests (ICT), microscopy, some PCR applications [9] [20] | Molecular methods (PCR, real-time PCR), antigen detection assays [32] [33] |
| DNA Suitability | Limited; formalin causes cross-linking and fragmentation, favoring amplification of short gene targets [34] [35] | Superior; yields higher quality, more amplifiable DNA, suitable for longer fragments and multiple targets [32] [35] |
| Impact on ICT/ Antigen Detection | Suitable and commonly used; antigens remain detectable [9] [36] | Suitable; freezing may preserve antigens, but compatibility with specific kits should be verified |
| Sample Stability | Excellent for morphology; long-term ambient storage [35] | Good; requires consistent -20°C to -80°C storage [37] |
| Key Advantages | - Stabilizes morphology for microscopy- Compatible with many rapid tests- Reduced biohazard risk [8] | - Optimal sensitivity for PCR- Preferred for molecular typing and genotyping [32] [33] |
| Key Limitations | - DNA degradation challenges molecular work [35]- Formalin inhibition can affect PCR [34] | - Requires reliable cold chain- Not ideal for morphological analysis after freezing |
Experimental Protocols for Sample Processing
Protocol for Immunochromatographic Testing from Formalin-Fixed Specimens
Immunochromatographic tests (ICTs) are rapid, solid-phase qualitative assays that detect and distinguish between Giardia and Cryptosporidium antigens in human fecal specimens [9] [20]. The following protocol is adapted from manufacturer instructions (e.g., Meridian Bioscience ImmunoCard STAT! Crypto/Giardia).
Procedure:
- Specimen Preparation: Use unconcentrated, preserved stool specimens fixed in 5% or 10% formalin or Sodium Acetate-Acetic Acid-Formalin (SAF) [9] [20].
- Sample Treatment: Add 2 drops of the provided sample treatment buffer to a tube.
- Specimen Addition: Pipette 60 µL of the uncentrifuged, formalin-fixed stool specimen into the same tube.
- Conjugate Addition: Add 2 drops of the Giardia capture antibody conjugate, followed by 2 drops of the colloidal carbon-conjugated detection reagent.
- Assay Development: Mix the solution and immediately pour it into the test device. Read the results visually after 10 minutes.
- Result Interpretation: A positive test is indicated by the presence of a gray-black color bar (regardless of intensity) next to the corresponding organism's name printed on the test device [9].
Protocol for DNA Extraction from Formalin-Fixed Specimens for PCR
DNA extraction from formalin-fixed samples is challenging due to nucleic acid cross-linking and fragmentation. The modified protocol below, based on Lee et al. (2019), improves DNA yield and quality [35].
Procedure:
- Rehydration: Rehydrate the formalin-fixed stool sample using a descending alcohol series (e.g., 100%, 90%, 70% ethanol) [35].
- Inhibitor Reduction: Include an EDTA pre-treatment step to chelate metal ions and mediate inhibition of DNase activity [35].
- Protein Digestion: Subject the sample to prolonged treatment (e.g., overnight incubation) with proteinase K to digest contaminating proteins and reverse formaldehyde-induced cross-links [35].
- DNA Extraction: Perform DNA extraction using a commercial stool DNA kit (e.g., QIAamp stool DNA mini kit) according to the manufacturer's instructions [33].
- DNA Elution: Elute the purified DNA in a suitable buffer (e.g., AE buffer or TE buffer) and store at -20°C or -80°C.
Protocol for PCR Amplification from Formalin-Fixed DNA
Due to DNA fragmentation, PCR amplification from formalin-fixed samples requires optimization and should target short genomic fragments [34] [35].
Procedure:
- Assay Selection: Select a real-time PCR assay that targets short gene fragments (ideally < 350 bp) for higher success rates [34]. The 18S rRNA gene target has demonstrated high diagnostic accuracy [33].
- PCR Setup: Prepare the reaction mixture. For a 25 µL reaction volume, use:
- 5 µL of template DNA
- 12.5 µL of 2x TaqMan Fast Universal PCR Master Mix
- 2.5 µL of primer and probe mix
- Nuclease-free water to 25 µL [32]
- Cycling Conditions: Use standard real-time PCR cycling conditions with an annealing temperature optimized for the specific primer set. A nested PCR approach can be employed to enhance sensitivity and specificity [35].
Workflow for Sample Handling Decision-Making
The following diagram illustrates the decision-making process for selecting the appropriate sample handling method based on research objectives.
The Scientist's Toolkit: Research Reagent Solutions
The table below outlines key reagents and kits used in the processing and analysis of stool specimens for Giardia and Cryptosporidium detection.
Table 2: Essential Research Reagents for Stool Specimen Analysis
| Reagent / Kit | Function / Application | Key Considerations |
|---|---|---|
| 10% Buffered Formalin | Fixation and preservation of stool specimens for microscopy and ICT. | Maintains antigen integrity for immunodetection but compromises DNA for PCR [34] [37]. |
| S.T.A.R. Buffer | Stool transport and recovery; used for nucleic acid stabilization prior to extraction. | Compatible with automated extraction systems like MagNA Pure 96 [32]. |
| QIAamp Stool DNA Kit | Manual silica-column based DNA purification from fresh or fixed stools. | Effective for diverse sample types; includes inhibitors removal steps [33]. |
| MagNA Pure 96 System & Kit | Automated, high-throughput nucleic acid extraction. | Utilizes magnetic bead technology for consistent yields [32]. |
| ImmunoCard STAT! Crypto/Giardia | Rapid immunochromatographic test for antigen detection. | Provides results in ~12 minutes; uses formalin-fixed or unfixed samples [9]. |
| TaqMan Universal PCR Master Mix | Real-time PCR amplification for parasite detection and genotyping. | Enables highly sensitive and specific quantification of parasite DNA [32] [33]. |
| Proteinase K | Enzyme for digesting proteins and reversing cross-links in fixed samples. | Critical pre-treatment step for improving DNA yield from formalin-fixed specimens [35]. |
| EDTA (Ethylenediaminetetraacetic acid) | Chelating agent that inhibits DNase activity. | Used in modified extraction protocols to protect DNA from degradation [35]. |
The accurate and timely diagnosis of gastrointestinal parasites, particularly Giardia duodenalis and Cryptosporidium spp., remains a critical challenge in clinical and public health settings. These pathogens are significant causes of diarrheal diseases worldwide, with Giardia infecting an estimated 280 million people annually [38] and Cryptosporidium ranking as the second leading cause of moderate to severe diarrhea in infants in some regions [39]. Traditional diagnostic methods, particularly microscopy, suffer from limitations in sensitivity and specificity and require skilled technicians [11] [40]. This application note examines the integration of single versus multiplex pathogen detection methods into diagnostic algorithms, providing evidence-based protocols and comparative data to inform laboratory testing strategies. The evolution from conventional techniques to immunochromatographic tests and molecular methods represents a significant advancement in parasitology diagnostics, with important implications for patient management and public health surveillance.
Comparative Performance of Diagnostic Methods
Quantitative Detection Rates Across Platforms
Table 1: Comparison of Detection Methods for Cryptosporidium spp.
| Method Category | Specific Method | Detection Rate | Sensitivity | Specificity | Reference |
|---|---|---|---|---|---|
| Molecular | Multiplex PCR | 27.9% (67/240) | High | High | [41] |
| Molecular | Single-plex PCR | 27.9% (67/240) | High | High | [41] |
| Molecular | PCR (Various) | 18% (36/205) | High | High | [11] |
| Immunoassay | Immunochromatography (ICT) | 15% (31/205) | Moderate | High | [11] |
| Microscopy | Modified Kinyoun's Stain | 7% (14/205) | Low | Moderate | [11] |
| Microscopy | Routine Microscopy | 6% (12/205) | Low | Moderate | [11] |
Table 2: Performance Characteristics of Giardia Detection Methods
| Method Type | Example Assays | Pooled/Benchmark Sensitivity | Pooled/Benchmark Specificity | Notes | Reference |
|---|---|---|---|---|---|
| Immunoassay | RIDASCREEN Giardia | 93% | 99% | Commercial ELISA | [38] |
| Immunoassay | ImmunoCardSTAT | 84% | 99% | Immunochromatographic | [38] |
| Immunoassay | Commercial ELISA | 96% | - | Sub-group analysis | [38] |
| Immunoassay | Commercial ICT | 88% | - | Sub-group analysis | [38] |
| Molecular | PCR Methods | 100% concordance | 100% concordance | Versus microscopy | [41] |
| Reference Method | Direct Fluorescence Assay | Gold Standard | Gold Standard | For veterinary samples | [8] |
Analysis of Method Performance
The data reveals clear hierarchies in diagnostic performance. For Cryptosporidium detection, molecular methods consistently demonstrate superior detection rates (18-27.9%) compared to immunochromatography (15%) and microscopic techniques (6-7%) [11] [41]. This pattern is maintained in Giardia detection, where commercial ELISA assays show higher sensitivity (96%) than immunochromatographic tests (88%) [38]. The complete concordance between single-plex and multiplex PCR formats indicates that multiplexing does not compromise detection accuracy when properly optimized [41].
Notably, method performance varies between patient populations. Immunoassays demonstrate higher sensitivity for detecting Giardia in symptomatic patients (92%) compared to asymptomatic individuals (79%) [38]. This has important implications for test selection based on clinical presentation.
Detailed Experimental Protocols
Protocol 1: Immunochromatographic Testing for Giardia and Cryptosporidium
Principle: This protocol utilizes lateral flow immunochromatography for the simultaneous detection of Giardia and Cryptosporidium antigens in stool samples, providing rapid results suitable for clinical settings requiring timely diagnosis.
Materials:
- Crypto/Giardia Rapid ICT Assay (e.g., Biotech, Spain) [11]
- Fresh or fresh-frozen stool samples
- Specimen dilution buffer
- Disposable applicators
- Timer
Procedure:
- Sample Preparation: Preserve unpreserved stool samples at 2-8°C for 1-3 days or freeze at -20°C for longer storage [11].
- Sample Dilution: Weigh approximately 0.5 g of formed stool (or 125 μL for liquid stool) and dilute in the provided specimen dilution buffer [11].
- Test Application: Apply the diluted sample to the sample well of the immunochromatographic test device according to the manufacturer's instructions.
- Incubation: Allow the test to develop for the specified time (typically 15-30 minutes) [8].
- Result Interpretation: Read the test results qualitatively. A positive reaction is identified by a colorimetric reaction when the antibody conjugate reacts with the substrate, resulting in a visible line on the immunochromatographic strip [42].
- Quality Control: Ensure internal controls display appropriate reactivity as specified by the manufacturer.
Technical Notes:
- The immunochromatographic test described in the literature was unable to distinguish between pathogenic E. histolytica and non-pathogenic E. dispar [42].
- Sensitivity may be reduced at low parasite concentrations (<1,000 trophozoites per mL) [42].
- Filtration of samples may further reduce sensitivity, as demonstrated in reconstitution experiments [42].
Protocol 2: Multiplex PCR for Simultaneous Detection of Gastrointestinal Parasites
Principle: This protocol employs multiplex conventional PCR to simultaneously detect Giardia duodenalis, Cryptosporidium spp., and Entamoeba histolytica in a single reaction, providing a cost-effective molecular diagnostic approach suitable for resource-limited settings.
Materials:
- DNA extraction kit (e.g., E.Z.N.A. Stool DNA Kit) [43]
- PCR reagents: primers, dNTPs, reaction buffer, DNA polymerase
- Thermal cycler
- Agarose gel electrophoresis equipment
- DNA molecular weight markers
Procedure:
- DNA Extraction:
Primer Design and Selection:
- Design primers targeting conserved gene sequences with similar annealing temperatures [43].
- For Giardia duodenalis, target the β-giardin gene or similar [41].
- For Cryptosporidium spp., target the COWP gene or 18S rRNA region [44] [39].
- Select primer pairs that generate amplicons of distinct sizes for clear differentiation (e.g., 1400 bp for G. duodenalis, 755 bp for C. parvum) [43].
PCR Reaction Setup:
- Prepare master mix containing:
- 5 μL of DNA extract
- 2× TaqMan Fast Universal PCR Master Mix (12.5 μL) or equivalent
- Primer mix (2.5 μL) containing all specific primers
- Sterile water to a final volume of 25 μL [40]
- Set up negative controls (no template) and positive controls for each target.
- Prepare master mix containing:
PCR Amplification:
- Use the following cycling conditions:
- Initial denaturation: 95°C for 10 minutes
- 45 cycles of:
- Denaturation: 95°C for 15 seconds
- Annealing/extension: 60°C for 1 minute [40]
- Use the following cycling conditions:
Product Analysis:
- Analyze PCR products by agarose gel electrophoresis.
- Visualize bands under UV light and document results.
- Confirm positive results by sequencing if necessary [41].
Technical Notes:
- The COWP gene exists in a single copy per genome, which may affect sensitivity compared to multi-copy targets like 18S rRNA [39].
- Testing each DNA extract in at least triplicate optimizes the limit of detection [39].
- Multiplex conventional PCR demonstrates 100% concordance with single-plex PCR for target pathogens [41].
Diagnostic Algorithm Development
Diagram Title: Diagnostic Algorithm for Giardia and Cryptosporidium Detection
The Scientist's Toolkit: Essential Research Reagents
Table 3: Key Research Reagent Solutions for Giardia and Cryptosporidium Detection
| Reagent/Kit | Application | Key Features | Performance Characteristics |
|---|---|---|---|
| Crypto/Giardia Rapid ICT Assay (Biotech, Spain) | Immunochromatographic detection | Simultaneous detection of Giardia and Cryptosporidium, room temperature storage | 15% detection rate for Cryptosporidium [11] |
| RIDASCREEN Giardia | ELISA detection | Commercial ELISA platform | 93% sensitivity, 99% specificity [38] |
| ImmunoCardSTAT | Immunochromatographic detection | Rapid lateral flow platform | 84% sensitivity, 99% specificity [38] |
| FTD Stool Parasites Kit | Multiplex PCR detection | Comprehensive pathogen panel | Detects 1 C. parvum oocyst/g and 10 C. hominis oocysts/g [39] |
| AusDiagnostics PCR Test | Commercial PCR platform | Multiplex parasite detection | High sensitivity and specificity for G. duodenalis and Cryptosporidium spp. [40] |
| Direct Immunofluorescence Assay (DFA) | Reference method | Gold standard for veterinary samples | Highest sensitivity for G. duodenalis in comparative studies [8] |
| MagNA Pure 96 System | Automated DNA extraction | Magnetic separation technology | Optimal for PCR-based parasite detection [40] |
The integration of single versus multiplex pathogen detection methods into diagnostic algorithms requires careful consideration of clinical needs, available resources, and performance characteristics. Immunochromatographic tests provide rapid, accessible detection suitable for initial screening and settings requiring immediate results. However, molecular methods, particularly multiplex PCR panels, offer superior sensitivity and the ability to detect multiple pathogens simultaneously, proving especially valuable in cases of immunocompromised patients, outbreak investigations, and comprehensive surveillance. The 100% concordance between well-designed multiplex and single-plex PCR methods demonstrates that multiplexing does not necessitate compromising detection accuracy. As diagnostic technologies continue to evolve, optimal laboratory practice will strategically combine these approaches, leveraging the strengths of each method to achieve accurate, timely diagnosis of gastrointestinal parasites, ultimately improving patient outcomes and public health responses.
In the diagnosis of parasitic diseases such as giardiasis and cryptosporidiosis, immunochromatographic tests (ICTs) offer the advantages of rapid results and ease of use. However, their reliability is often compromised by limitations in sensitivity and specificity, as well as the inherent subjectivity of visual interpretation [23] [8]. This application note details a comprehensive quality control framework, grounded in contemporary research, to fortify ICT protocols for the detection of Giardia duodenalis and Cryptosporidium spp. By integrating robust internal controls and structured reader training, laboratories can significantly enhance diagnostic accuracy, minimize subjective errors, and generate reproducible, reliable data for clinical and research applications.
Quantitative Performance Analysis of Diagnostic Methods
A clear understanding of the relative performance of different diagnostic methods is fundamental to establishing a quality framework. The following tables summarize comparative data from recent studies, highlighting the context in which ICTs are used.
Table 1: Comparative Detection Rates of Cryptosporidium by Diagnostic Method in Human Stool Samples (n=205) A 2025 study in Qatar directly compared four diagnostic methods, demonstrating the superior sensitivity of molecular techniques and the variable performance of ICTs [11].
| Diagnostic Method | Detection Rate | Key Findings |
|---|---|---|
| Polymerase Chain Reaction (PCR) | 18% (36/205) | Highest sensitivity; recommended for integration into routine diagnostics. |
| Immunochromatography (ICT) | 15% (31/205) | Superior to conventional microscopy but less sensitive than PCR. |
| Modified Kinyoun's Stain (MKS) | 7% (14/205) | Lower sensitivity, requires experience for accurate interpretation. |
| Routine Microscopy | 6% (12/205) | Least sensitive method; challenging due to oocysts' small size. |
Table 2: Diagnostic Performance for Giardia and Cryptosporidium in Companion Animals Using DFA as Gold Standard A 2024 veterinary study evaluated common diagnostic methods, reinforcing that the choice of method drastically impacts reported prevalence and diagnostic accuracy [8].
| Parasite | Diagnostic Method | Prevalence (Canine/Feline) | Key Performance Note |
|---|---|---|---|
| G. duodenalis | Direct Immunofluorescence (DFA) | 30.2% (Dogs) / 11.6% (Cats) | Gold standard; highest sensitivity. |
| Merthiolate-Iodine-Formalin (MIF) | 22.7% (Dogs) / 7.8% (Cats) | Lower sensitivity compared to DFA. | |
| Real-time PCR | Not specified | High sensitivity; useful alongside DFA. | |
| Immunochromatography (ICT) | Not specified | Prone to false-positive results; variable reliability. | |
| Cryptosporidium spp. | Direct Immunofluorescence (DFA) | 4.4% (Dogs) / 2.9% (Cats) | Gold standard for detection. |
| Real-time PCR | Not specified | Most effective when combined with DFA. |
Experimental Protocols for Quality Assurance
Protocol 1: Implementation of a Multi-Tiered Internal Quality Control Strategy for ICTs
This protocol ensures the analytical validity of each ICT run through built-in and external controls [45] [46].
1. Principle: Internal Quality Control (IQC) involves testing control materials to monitor the analytical process, detect errors, and ensure consistent reliability of patient results. A multi-tiered approach is recommended by international standards like ISO 15189:2022 [47] [48].
2. Materials:
- Commercial ICT kits for Giardia/Cryptosporidium.
- Third-party control materials (positive and negative).
- Timer.
- IQC record form or software.
3. Procedure:
- A. Procedural (Built-in) Control: The appearance of a colored line in the "Control" region (C) of the test strip indicates that the sample has migrated correctly and the reagents are functionally intact. This is a minimum validity requirement [23].
- B. External Positive and Negative Control Testing:
- Run external controls with each new kit lot and upon receipt of a new shipment.
- Use a confirmed positive sample (or a commercial positive control) and a negative sample (e.g., buffer or confirmed negative stool).
- The positive control must yield a visible test line (T) and control line (C). The negative control must yield only the control line (C).
- Document all results, including any faint test lines.
4. Troubleshooting:
- If the control line does not appear: The test is invalid. Repeat the test with a new device, ensuring correct sample volume and procedure.
- If the positive control fails: Do not use the kit lot. Contact the manufacturer.
- If the negative control shows a false-positive line: Check for sample cross-contamination or kit deterioration.
Protocol 2: Structured Reader Training Program to Minimize Subjectivity
This protocol standardizes the interpretation of ICT results to reduce inter-reader variability [23] [8].
1. Principle: Subjective visual interpretation of faint or ambiguous test lines is a major source of error. Training and standardization are critical for minimizing this subjectivity.
2. Materials:
- A portfolio of 10-15 validated ICT devices showing a spectrum of results (strong positive, weak positive, clearly negative, ambiguous).
- Data recording forms.
- A standardized light source.
3. Procedure:
- A. Initial Training and Assessment:
- Train readers using the portfolio of sample tests.
- Provide the manufacturer's guide as a reference for interpretation criteria.
- Assess each reader's ability to correctly classify the samples. The target for competency is >95% agreement with predefined, validated results.
- B. Implementation of Double-Blind Reading:
- For all routine samples, require independent interpretation by two trained readers.
- Readers should record their results without consulting each other.
- C. Adjudication of Discordant Results:
- If the two readers disagree, the test must be read by a third, senior-trained reader.
- The final result is based on the agreement of two out of three readers.
- Alternatively, if resources allow, confirm discordant results with a reference method such as DFA or PCR [8].
4. Quality Monitoring:
- Periodically re-assess reader competency using the test portfolio.
- Track and review inter-reader discordance rates as a key performance indicator. Investigate and retrain if discordance rates increase.
Workflow for Robust Immunochromatographic Testing
The following diagram illustrates the integrated workflow incorporating the internal quality control and reader training protocols detailed above.
The Scientist's Toolkit: Essential Research Reagents and Materials
Table 3: Key Research Reagent Solutions for Giardia/Cryptosporidium ICT Development and QC
| Item | Function & Application | Critical Notes |
|---|---|---|
| Third-Party Control Materials | Independent verification of kit performance; used for external QC [46]. | Matrix should be close to human/animal stool; should include both positive and negative controls. |
| Monoclonal Antibodies | Key reagents in the ICT strip; bind to specific parasite antigens (e.g., C. parvum/C. hominis, G. duodenalis) [23]. | Specificity and affinity directly determine test sensitivity and cross-reactivity. |
| Direct Immunofluorescence (DFA) Kit | Gold standard method for validating ICT results and resolving ambiguous readings [8]. | Provides high combination of sensitivity and specificity; requires fluorescence microscope. |
| DNA Extraction Kits & PCR Reagents | Molecular confirmation of positives and investigation of discrepant results; essential for definitive species identification [11] [23]. | Highest sensitivity; allows for genotyping and epidemiological studies. |
| Standardized Stool Panels | For training and competency assessment of readers; comprises samples with known results [8]. | Must include a range of results (strong/weak positive, negative) to effectively train for subjectivity. |
Optimizing ICT Performance: Addressing Sensitivity Gaps and Technical Challenges
Immunochromatographic tests (ICTs) have emerged as vital tools for the rapid detection of Giardia duodenalis and Cryptosporidium spp., two protozoan parasites that constitute major global causes of diarrheal disease [11] [49]. Their speed, ease of use, and minimal infrastructure requirements make them particularly valuable for clinical settings lacking specialized laboratory capabilities. However, the diagnostic sensitivity of these tests is fundamentally constrained by two inherent biological and technical challenges: low parasite burden in clinical samples and intermittent fecal shedding of parasitic forms [50] [51]. This application note delineates these limitations through quantitative data analysis and provides refined experimental protocols to enhance detection reliability for researchers and drug development professionals working within this field.
Core Limitations in Diagnostic Sensitivity
The Problem of Intermittent Shedding
The detection of intestinal protozoa in stool samples is fundamentally complicated by the biological phenomenon of intermittent shedding, where parasites are not consistently present in every stool sample from an infected host.
- Quantitative Evidence: A meticulous study on paediatric Giardia infections, which involved analyzing 413 stool samples from 276 children, estimated the per-sample probability of parasite shedding (given infection) at approximately θ = 0.44 [50] [51]. This means that even with a perfect test, more than half of the samples from infected children would be missed based on a single sample.
- Impact on Sensitivity: This intermittent shedding directly constrains the maximum achievable clinical sensitivity. The probability of detecting an infection from a single stool sample is the product of the probability the sample contains the parasite (θ) and the test's intrinsic sensitivity (p). Therefore, even with a perfect test (p=1), the maximum detection rate would be ~44% for a single sample from a Giardia-infected child [51].
The Challenge of Low Parasite Burden and Test Sensitivity
The analytical sensitivity of immunochromatographic tests can be insufficient when the number of parasitic cysts or oocysts in a stool sample is low.
- Comparative Performance Data: A 2025 study comparing four diagnostic methods for Cryptosporidium found that while PCR detected the parasite in 18% of symptomatic patients, the immunochromatographic test (ICT) detected only 15% [11]. This indicates a meaningful gap in sensitivity between molecular methods and rapid antigen tests.
- Microscopy's Limitations: Traditional microscopy, often considered a baseline method, showed even lower detection rates of 6-7% in the same study, underscoring the challenge of detecting low-level infections with methods that rely on visual identification [11].
- ICT Performance Profile: Earlier evaluations of a commercial rapid assay (ImmunoCard STAT!) reported high sensitivity (93.5% for Giardia, 98.8% for Cryptosporidium), but noted that false-negative results predominantly occurred with specimens containing low parasite numbers or (for Giardia) only trophozoites [9].
Table 1: Comparative Detection Rates of Diagnostic Methods for Cryptosporidium in Stool Samples from Symptomatic Patients [11]
| Diagnostic Method | Detection Rate | Key Characteristics |
|---|---|---|
| Polymerase Chain Reaction (PCR) | 18% (37/205) | High sensitivity, detects genetic material |
| Immunochromatography (ICT) | 15% (Approx. 31/205) | Rapid, detects surface antigens |
| Modified Kinyoun's Stain (MKS) | 7% (Approx. 14/205) | Specialized stain for oocysts |
| Routine Microscopy | 6% (Approx. 12/205) | Low sensitivity, operator-dependent |
Table 2: Shedding and Detection Probabilities for Giardia Based on Hierarchical Modelling [50] [51]
| Parameter | Symbol | Estimated Probability | Interpretation |
|---|---|---|---|
| Shedding Probability | θ | 0.44 ± 0.116 | Probability a sample from an infected child contains Giardia |
| Test Sensitivity (Senior) | pSenior | 0.639 ± 0.080 | Detection probability by an expert microscopist |
| Test Sensitivity (Junior) | pJunior | 0.460 ± 0.071 | Detection probability by a trained student |
| Overall Clinical Sensitivity | θ × p | ~0.20 - 0.28 | Overall probability of detecting infection from a single test |
Recommended Experimental Protocols
To overcome these limitations in a research and development context, the following protocols emphasize strategies that mitigate the impact of intermittent shedding and low analyte concentration.
Protocol 1: Multi-Sample Collection and Antigen Concentration
Principle: Increasing the amount of fecal material tested and concentrating the target antigens can lower the limit of detection, improving the chance of identifying low-burden infections.
Procedure:
- Sample Collection: Collect three separate stool samples from the same subject over consecutive days (e.g., Day 1, 2, and 3) to account for intermittent shedding [50] [51].
- Sample Homogenization: Pool equal weights (e.g., 0.5 g each) from each of the three samples into a single container. Add 3-5 mL of phosphate-buffered saline (PBS) containing 0.5% Tween-20.
- Antigen Extraction: Vortex the mixture vigorously for 2 minutes. Centrifuge at 500 × g for 5 minutes to pellet large particulate matter.
- Supernatant Concentration: Transfer the supernatant to a centrifugal filter device (e.g., 10kDa molecular weight cut-off). Centrifuge at 10,000 × g for 15 minutes to concentrate the antigen.
- Reconstitution: Reconstitute the concentrated antigen in 200 µL of the provided dilution buffer from the ICT kit.
- Testing: Proceed with the immunochromatographic test according to the manufacturer's instructions, using the concentrated antigen solution as the test sample.
Protocol 2: External Quality Assessment for ICT Kits
Principle: Establishing in-house performance benchmarks for different ICT kits using characterized clinical samples ensures reliable results and identifies the most effective tests.
Procedure:
- Panel Creation: Create a reference panel of 20-30 stored stool samples. Characterize each sample definitively using a combination of direct fluorescent antibody (DFA) testing and PCR [23] [9]. The panel should include known positives (with high and low parasite burdens), known negatives, and samples containing other common enteric pathogens to check for cross-reactivity.
- Blinded Testing: Code the samples and test them with the ICT kit under evaluation, following the manufacturer's protocol precisely.
- Data Analysis: Compare the ICT results against the reference results to calculate kit-specific sensitivity, specificity, positive predictive value (PPV), and negative predictive value (NPV).
- Threshold Determination: For quantitative ICT readers, establish a correlation between signal intensity and parasite load as determined by PCR cycle threshold (Ct) values or cyst/oocyst counts from DFA [52].
Visualizing the Composite Nature of Diagnostic Sensitivity
The following diagram illustrates how intermittent shedding and imperfect test sensitivity jointly determine the final clinical outcome, explaining why a negative ICT result does not definitively rule out infection.
Diagram 1: Diagnostic Sensitivity Pathway
The Scientist's Toolkit: Research Reagent Solutions
Table 3: Essential Reagents and Kits for Research on Giardia and Cryptosporidium Detection
| Item | Function/Application | Key Characteristics |
|---|---|---|
| ImmunoCard STAT! Crypto/Giardia | Rapid differential detection of C. parvum and G. lamblia antigens | Detects formalin-resistant antigens; results in 12 minutes [9] |
| Merifluor Cryptosporidium/Giardia DFA | Gold standard for detection; used for reference testing and sensitivity validation | High sensitivity/specificity combo; allows morphological confirmation [23] |
| QIAamp DNA Stool Mini Kit | Nucleic acid purification for downstream molecular assays | Efficient inhibitor removal; critical for reliable PCR results [23] |
| RIDASCREEN Crypto/Giardia ELISA | Medium-throughput antigen detection for batch analysis | Objective readout; useful for testing sample pools or kit validation [49] |
| Formalin-Ethyl Acetate | Fecal concentration for microscopy and improved antigen availability | Increases diagnostic yield by concentrating parasitic forms [11] |
| Cepheid Xpert Xpress Crypto/Giardia | Fully integrated, automated PCR detection | High sensitivity; minimal hands-on time; used as a performance benchmark [52] |
The diagnostic performance of immunochromatographic tests for Giardia and Cryptosporidium is intrinsically limited by the biological reality of intermittent shedding and the analytical challenge of low parasite burdens. Researchers and developers must account for these factors by adopting multi-sample testing strategies, incorporating antigen concentration steps, and rigorously validating test performance against reference methods like DFA and PCR. Acknowledging and systematically addressing these limitations is fundamental to advancing the development of more reliable diagnostic tools and accurate drug efficacy studies.
Discrepant analysis is a two-stage methodological approach used for evaluating new diagnostic tests when the reference standard is suspected to be imperfect [53]. This technique becomes particularly valuable when assessing new immunochromatographic tests (ICTs) for pathogens like Giardia and Cryptosporidium, where conventional methods may lack sensitivity. The fundamental quandary addressed by discrepant analysis is how to properly evaluate a new test expected to be highly sensitive when compared against an older, potentially insensitive method [53]. When samples test negative by the traditional method but positive by the new test, investigators often perform additional testing specifically on this discrepant group to resolve their true status.
In the context of gastrointestinal pathogen detection, discrepant analysis provides a framework for addressing two common challenges in immunochromatographic testing: false negatives that may lead to undiagnosed infections, and weak positive bands that create interpretation uncertainty [54]. The statistical implications of this approach are significant, as standard discrepant analysis inherently introduces bias toward overestimating the new test's performance characteristics because only results that weaken the apparent sensitivity and specificity are subjected to further testing [53] [55]. Despite this limitation, when applied and interpreted correctly, discrepant analysis offers valuable strategies for improving the accuracy of diagnostic test evaluation for protozoan parasites.
Experimental Protocols for Resolving Discrepancies
Protocol for Discrepant Analysis Workflow
Principle: This protocol establishes a standardized method for resolving discrepancies between new immunochromatographic tests and reference methods for Giardia and Cryptosporidium detection, incorporating a third, more reliable test to verify true disease status.
Materials:
- Stool specimens with discrepant results (ICT positive/reference negative or ICT negative/reference positive)
- Merifluor Cryptosporidium/Giardia Direct Fluorescent Antibody (DFA) test or equivalent
- ProSpecT Giardia EZ microplate assay and ProSpecT Cryptosporidium microplate assay
- ImmunoCard STAT! Crypto/Giardia Rapid Assay or equivalent ICT
- Phosphate-buffered saline (PBS), pH 7.2
- Formalin-ethyl acetate concentration reagents
Procedure:
- Initial Testing Phase: Perform parallel testing of all specimens using both the new immunochromatographic test and the conventional reference method. Record all results, categorizing them as concordant (both tests positive or both negative) or discrepant (tests disagree).
Specimen Processing: Concentrate all formalin-fixed stool specimens using the formalin-ethyl acetate concentration procedure. Centrifuge twice at 500 × g for 10 minutes to maximize organism recovery [56].
Discrepant Resolution Testing: Apply a recognized gold standard test to all discrepant specimens:
- For ICT-positive/reference-negative specimens: Test using Merifluor DFA test according to manufacturer's specifications.
- Examine the entire well by fluorescence microscopy with a 20× objective.
- Count and categorize organisms as rare (≤25), few (26-175), moderate (176-275), or many (≥275) [56].
- For ICT-negative/reference-positive specimens: Repeat ICT testing followed by DFA confirmation if indicated.
Data Reclassification: Reclassify the initial discrepant results based on the resolving test findings. Incorporate these reclassified results into final sensitivity and specificity calculations.
Interpretation: Specimens with very small numbers of organisms may not be detected by ICT or EIA methods [56]. The Merifluor DFA test typically detects the largest number of true positive cases and should be considered the preferred resolving method.
Protocol for Characterizing Weak Band Intensity
Principle: This protocol standardizes the approach for evaluating weak positive bands in immunochromatographic tests, which represent a significant challenge in clinical interpretation, with reported rates of 13-22% for IgG and 20-89% for IgM in various ICT formats [54].
Materials:
- Immunochromatographic test devices for Giardia and Cryptosporidium
- Positive and negative control materials
- Timer
- Digital imaging system for band intensity measurement (optional)
- Reference standard (DFA or EIA)
Procedure:
- Test Performance: Perform the immunochromatographic test according to manufacturer instructions, ensuring precise sample volume and incubation time.
Band Intensity Assessment: At the designated reading time:
- Visually inspect the test band and categorize intensity as strong positive, weak positive, or negative.
- For objective measurement, use a digital imaging system with grayscale analysis if available.
- Document the appearance of any faint bands, regardless of intensity.
Repeat Testing: Repeat weak positive results in duplicate to confirm consistency.
Resolution Testing: Submit all specimens producing weak bands for confirmation by the Merifluor DFA test or reference EIA method.
Data Correlation: Correlate weak band intensity with organism burden as determined by DFA microscopy.
Interpretation: Weak bands may indicate true positive reactions with low analyte concentration, particularly in early or resolving infections. However, they may also represent nonspecific binding or test artifacts. Subjective interpretation represents a significant limitation of visual reading in ICTs [54].
Quantitative Performance Data Analysis
Table 1: Comparative Performance of Diagnostic Tests for Giardia and Cryptosporidium Detection
| Test Method | Target | Sensitivity (%) | Specificity (%) | Organism Detection Range | Reference Standard |
|---|---|---|---|---|---|
| ImmunoCard STAT! | Giardia | 81.3 | 99.5 | Limited detection of low organism burden | MERIFLUOR DFA |
| ImmunoCard STAT! | Cryptosporidium | 67.6 | 99.0 | Limited detection of low organism burden | MERIFLUOR DFA |
| ProSpecT EIA | Giardia | 90.6 | 99.5 | Improved low-end detection | MERIFLUOR DFA |
| ProSpecT EIA | Cryptosporidium | 70.3 | 99.5 | Moderate detection range | MERIFLUOR DFA |
| Acid-fast Stained Smears | Cryptosporidium | 78.4 | 100.0 | Variable based on staining quality | MERIFLUOR DFA |
| MERIFLUOR DFA | Giardia/Crypto | 96-100 | 99.8-100.0 | Superior for low organism burden | Considered reference |
Table 2: Impact of Discrepant Analysis on Test Performance Characteristics
| Statistical Measure | Before Discrepant Analysis | After Discrepant Analysis | Change (%) | Factors Influencing Bias |
|---|---|---|---|---|
| Sensitivity | 91.2% | 92.8% | +1.6% | Disease prevalence, test dependence |
| Specificity | 95.2% | 99.7% | +4.5% | Disease prevalence, test dependence |
| Positive Predictive Value | 79.5% | 98.9% | +19.4% | Most affected in low prevalence settings |
| Negative Predictive Value | Variable improvement | Variable improvement | Dependent on scenario | More pronounced in high prevalence |
The data presented in Table 2 demonstrate that discrepant analysis consistently improves apparent test performance, with positive predictive value showing the most dramatic increases [53]. The magnitude of bias depends heavily on disease prevalence, with sensitivity estimates most affected in low-prevalence settings and specificity estimates in high-prevalence environments [53] [55].
Visualization of Methodological Workflows
Discrepant Analysis Workflow
Weak Band Resolution Pathway
The Scientist's Toolkit: Research Reagent Solutions
Table 3: Essential Research Reagents for Discrepant Analysis Studies
| Reagent/Test System | Primary Function | Application Notes | Performance Characteristics |
|---|---|---|---|
| MERIFLUOR DFA Test | Reference standard detection | Visualizes intact organisms; allows quantification | Sensitivity: 96-100% Specificity: 99.8-100% |
| ImmunoCard STAT! | Rapid immunochromatographic detection | 10-minute assay; no specialized equipment needed | Sensitivity: 67-81% Specificity: 99-99.5% |
| ProSpecT Microplate EIA | Enzyme immunoassay detection | Higher throughput; objective spectrophotometric reading | Sensitivity: 70-91% Specificity: 99.5% |
| Formalin-Ethyl Acetate | Specimen concentration | Maximizes organism recovery for microscopy | Critical for low-burden infections |
| Colloidal Gold Nanoparticles | Signal generation in ICT | Antibody-coated for target detection | 40nm size optimal for flow and visibility |
| Nitrocellulose Membranes | Test platform for ICT | Porous matrix for capillary flow | Type 200CNNPH-N-SS60-L2-P25 recommended |
Discussion and Technical Considerations
The implementation of discrepant analysis for evaluating immunochromatographic tests for Giardia and Cryptosporidium detection requires careful consideration of several technical factors. First, the choice of resolving test is critical—the Merifluor DFA test demonstrates superior sensitivity, particularly for specimens with low organism burden that may be missed by both ICT and EIA methods [56]. Second, the inherent biases of discrepant analysis must be acknowledged in study design and interpretation; the statistical inflation of performance characteristics can be substantial, particularly for positive predictive value in low-prevalence settings [53] [55].
The challenge of weak positive bands in immunochromatographic tests represents a significant limitation in field applications. Studies of various ICT formats report weak positivity rates of 13-22% for IgG and 20-89% for IgM, creating interpretation challenges [54]. These findings highlight the importance of confirmatory testing for weak bands, particularly in low-prevalence populations where the positive predictive value of such results may be limited. Bayesian principles dictate that in low-prevalence settings, even tests with excellent accuracy characteristics will generate more false than true positives [57].
Future methodological improvements should focus on objective reading systems to standardize weak band interpretation, development of more sensitive gold-standard tests, and application of latent class statistical analysis that acknowledges the imperfection of all available tests. Additionally, careful consideration of the conditional dependence between tests used in discrepant analysis is essential, as high dependence between new and resolving tests magnifies bias [53] [55]. When designing evaluations of new immunochromatographic tests for enteric pathogens, researchers should consider applying the resolving test to a random sample of concordant specimens to better quantify error rates and minimize bias [53].
The accurate detection of protozoan parasites Giardia duodenalis and Cryptosporidium spp. is a critical concern in public health and veterinary diagnostics. While immunochromatographic tests (ICTs) provide a rapid, user-friendly platform for detection, their diagnostic sensitivity is profoundly influenced by pre-analytical procedures [8]. The efficiency of filtration and concentration techniques directly impacts the assay yield by determining the number of (oo)cysts present in the final sample analyzed [58]. This application note delineates the impact of various sample processing methodologies on the detection sensitivity of immunochromatographic assays, providing validated protocols to optimize assay yield within the broader context of Giardia and Cryptosporidium research.
The Critical Role of Sample Processing in Immunoassay Performance
Sample processing is a prerequisite for reliable immunochromatographic detection, particularly when target analytes are present in low numbers or within complex matrices like water or stool. The primary objectives of processing are to concentrate the target organisms and to remove interfering substances that may impede lateral flow and antigen-antibody binding [58] [59]. In clinical settings, the superior sensitivity of direct immunofluorescence assay (DFA) over conventional microscopy for detecting G. duodenalis and Cryptosporidium spp. is well-established, largely due to more effective (oo)cyst presentation [8]. Similarly, the performance of an ICT is contingent upon the efficiency of prior sample preparation, as the concentration of captured antigens directly influences the visibility of the test line [9].
The filtration and elution steps are particularly crucial for water samples, where the target (oo)cysts are often dispersed across large volumes. Inefficient recovery during these stages can lead to false-negative results, compromising the assay's reliability [58]. Therefore, the selection of an appropriate filtration method is not merely a preliminary step but an integral component of the assay system that dictates the overall diagnostic yield.
Comparative Evaluation of Filtration Methods
Quantitative Recovery of (Oo)cysts
A comparative study evaluated the recovery efficiency of five commercially available membrane filters for the concentration of C. parvum oocysts and G. lamblia cysts from 10-liter seeded water samples [58]. The results, summarized in Table 1, highlight significant differences in performance.
Table 1: Recovery Efficiency of Commercial Membrane Filters for Cryptosporidium and Giardia from 10-Liter Water Samples
| Filtration Method | Mean % Recovery (Cryptosporidium parvum) | Mean % Recovery (Giardia lamblia) | Key Characteristics |
|---|---|---|---|
| Envirochek HV (with backwash) | 53 ± 15.4% | 59 ± 11.5% | Pleated membrane capsule; superior recovery with brief flow reversal [58] |
| Filta-Max Depth Filter | 28.2 ± 8.0% | 49.8 ± 12.2% | Compressed foam depth filter; highest recovery for cysts in distilled water [58] |
| Sartorius Flatbed Membrane Filter (SMF) | 16.2 ± 2.8% | 35.2 ± 3.0% | Flatbed membrane filter [58] |
| Envirochek (Standard) | Data not specified | Data not specified | Pleated membrane capsule; requires elution buffer and shaking [58] |
| Millipore Flatbed Membrane Filter | Data not specified | Data not specified | Flatbed membrane filter [58] |
The data demonstrates that the Envirochek High-Volume (HV) filter, when coupled with a brief 5-second backwash, achieved the highest percent recovery for both oocysts and cysts [58]. This simple modification to the protocol significantly enhanced yield by dislodging (oo)cysts trapped in the apparatus tubing. Furthermore, Giardia cysts were consistently recovered at higher rates than Cryptosporidium oocysts across all tested filters, indicating a fundamental difference in their interaction with filter surfaces or their resilience to the mechanical stress of processing [58].
Impact on Diagnostic Sensitivity
The efficiency of the filtration and concentration protocol directly translates to the sensitivity of downstream detection methods, including ICTs. The U.S. Environmental Protection Agency's Method 1623 prescribes filtration followed by immunomagnetic separation (IMS) and immunofluorescence microscopy for the monitoring of these parasites in water [59]. This method, which can process a minimum of 10 liters, has an applicable concentration range of 40 to 500 oocysts or cysts per 10 liters, a benchmark that underscores the necessity of high-yield sample preparation for reliable detection [59].
In clinical diagnostics, a study comparing methods for detecting Giardia and Cryptosporidium in canine and feline feces established DFA as the gold standard due to its high sensitivity [8]. The performance of a commercial lateral flow immunochromatography rapid test (ICT) is inherently tied to the sample preparation preceding it. Inadequate concentration can lead to false negatives, especially in cases of low-level or intermittent shedding, which are common in subclinical infections [8].
Detailed Experimental Protocols
Protocol 1: EPA Method 1623 for Water Samples
This protocol is adapted from the EPA Method 1623 for the analysis of Cryptosporidium and Giardia in water by filtration/IMS/FA [59].
Workflow: EPA Method 1623 for Water Analysis
Sample Collection and Filtration:
- Collect a minimum of 10 L of water in a clean container.
- Filter the sample through a capsule membrane filter (e.g., Pall Envirochek or Envirochek HV) using a peristaltic pump at a flow rate of 2 L/min or as recommended by the manufacturer [58] [59].
- Critical Step: For Envirochek filters, after filtration, reverse the flow direction for 5 seconds to backwash the filter, ensuring the recovery of (oo)cysts from the apparatus tubing [58].
Elution:
- Add 100 mL of a PBS-Tween-Antifoam elution buffer (pH 7.4) into the filter capsule.
- Place the capsule on a wrist-action shaker and agitate vigorously for 5 minutes. Rotate the capsule orientation and repeat the elution process once or twice, pooling the eluate [58].
Concentration:
- Centrifuge the pooled eluate at 1,100 × g for 15 minutes.
- Carefully aspirate and discard the supernatant, leaving a pellet of approximately 1-2 mL.
Immunomagnetic Separation (IMS):
- Re-suspend the pellet in the remaining volume.
- Add magnetic beads conjugated to anti-Cryptosporidium and anti-Giardia antibodies. Incubate with gentle mixing to allow for (oo)cyst capture.
- Separate the bead-(oo)cyst complexes using a magnetic particle concentrator. Wash the beads to remove non-specifically bound debris.
- Detach the (oo)cysts from the beads using an acid dissociation step [59].
Detection (Microscopy or ICT):
- For IFA, transfer the purified sample to a well slide, air-dry, and fix with methanol. Stain with fluorescein-labeled monoclonal antibodies and DAPI, then examine by epifluorescence microscopy [59].
- For ICT, the purified sample can be applied directly to the immunochromatographic test device according to the manufacturer's instructions [9].
Protocol 2: Clinical Stool Sample Processing for ICT
This protocol is designed for the detection of Giardia and Cryptosporidium antigens in human or animal fecal specimens using devices like the ImmunoCard STAT! rapid assay [9] [8].
Workflow: Stool Sample Processing for ICT
Specimen Preparation:
- Use fresh, frozen, or formalin-fixed fecal specimens. For fixed specimens, ensure they are in 5-10% formalin or sodium acetate-acetic acid-formalin (SAF) [9].
- Thoroughly homogenize the stool sample.
Antigen Extraction for ImmunoCard STAT!:
- Pipette 2 drops of the sample treatment buffer into a clean tube.
- Add 60 µL of the uncentrifuged, homogenized stool specimen into the tube.
- Add 2 drops of the provided Giardia capture antibody conjugate.
- Finally, add 2 drops of the colloidal carbon-conjugated detection reagent. Mix the contents thoroughly [9].
ICT Procedure and Interpretation:
- Immediately pour the prepared sample mixture into the sample well of the test device.
- Allow the test to develop for 10 minutes.
- Read the results visually. The appearance of a gray-black line next to the printed organism name (regardless of intensity) indicates a positive result. A control line must be present for the test to be valid [9].
The Scientist's Toolkit: Essential Research Reagents and Materials
Table 2: Key Research Reagent Solutions for Filtration and Immunochromatographic Detection
| Item | Function/Application | Example Sources/Notes |
|---|---|---|
| Envirochek HV Capsule Filter | High-volume concentration of (oo)cysts from water samples. | Pall Life Sciences; demonstrated superior recovery with backwash [58]. |
| PBS-Tween-Antifoam Elution Buffer | Efficient elution of (oo)cysts from filter membranes while minimizing foaming. | Phosphate-buffered saline (PBS, pH 7.4) with Tween 80 and Antifoam B [58]. |
| Immunomagnetic Separation (IMS) Kits | Purification and concentration of (oo)cysts from complex sample matrices using antibody-coated magnetic beads. | DYNAL IMS kits; used in EPA Method 1623 to reduce background interference [59]. |
| Direct Immunofluorescence Assay (DFA) | Gold standard for (oo)cyst detection and enumeration; used for method validation. | Crypto/Giardia Cel IF (Cellabs); provides high sensitivity and specificity [8]. |
| ImmunoCard STAT! Rapid Assay | Solid-phase qualitative immunochromatographic assay for detecting and distinguishing Giardia and Cryptosporidium antigens in stool. | Meridian Bioscience, Inc.; results in 10-12 minutes [9]. |
| FITC-Labeled Monoclonal Antibodies | Immunofluorescent staining of (oo)cysts for microscopic confirmation. | Specific to Cryptosporidium oocyst wall and Giardia cyst wall antigens [59]. |
The optimization of filtration and concentration techniques is non-negotiable for maximizing the yield and, consequently, the sensitivity of immunochromatographic assays for Giardia and Cryptosporidium. Data confirms that the choice of filter and the inclusion of a simple backwash step can more than double the recovery efficiency of target (oo)cysts [58]. For researchers and developers, adhering to standardized, high-yield protocols like EPA Method 1623 for water or manufacturer-specified procedures for clinical specimens provides a reliable foundation. Integrating these robust sample processing methods ensures that the subsequent immunochromatographic detection operates at its maximum potential, delivering accurate and reliable results that are critical for public health safety and clinical diagnostics.
Immunochromatographic tests (ICTs) have become indispensable tools for the rapid detection of Giardia and Cryptosporidium, two protozoan parasites that are significant causes of diarrheal disease worldwide. While these assays offer advantages in speed and ease of use, their diagnostic accuracy can be compromised by cross-reactivity with antigenically similar pathogens. This application note provides a systematic analysis of cross-reactivity potential and specificity challenges in immunochromatographic assays for Giardia and Cryptosporidium detection, presenting standardized experimental protocols for specificity validation and data interpretation guidelines for researchers and developers.
Cross-Reactivity Assessment: Experimental Findings
Comprehensive specificity testing is essential for validating immunochromatographic assays. The table below summarizes documented cross-reactivity assessments for prominent assays:
Table 1: Documented Cross-Reactivity Profiles of Immunochromatographic Assays
| Assay Name/Platform | Target Pathogens | Tested Non-Target Organisms | Cross-Reactivity Results | Reference |
|---|---|---|---|---|
| ImmunoCard STAT! Crypto/Giardia Rapid Assay | Giardia lamblia, Cryptosporidium parvum | 10 protozoa (152 challenges), 9 helminths (35 challenges) | No cross-reactivity observed | [9] |
| Generic Gold Nanoparticle-Based ICA | Pseudomonas aeruginosa | Common Gram-negative and Gram-positive bacteria | No cross-reactivity observed | [60] |
| Gold Nanoparticle-Assisted LF-ICA | Escherichia coli O157:H7 | 19 different organisms | Specificity successfully validated | [61] |
The ImmunoCard STAT! assay demonstrates a high degree of specificity, showing no cross-reactivity with a broad panel of enteric organisms including Blastocystis hominis, Dientamoeba fragilis, various Entamoeba species, Cyclospora cayetanensis, and multiple helminths [9]. This suggests careful epitope selection in antibody development.
Experimental Protocols for Specificity Validation
Protocol 1: Comprehensive Cross-Reactivity Testing
This protocol outlines procedures for evaluating assay specificity against a panel of non-target organisms.
Materials:
- Research Reagent Solutions:
- ImmunoChromatographic Assay Device: Solid-phase membrane system with immobilized capture antibodies.
- Colloidal Gold-Conjugated Antibodies: Detection probes labeled with gold nanoparticles.
- Specific Monoclonal/Polyclonal Antibodies: Binds target antigens with high affinity.
- Reference Strain Cultures: Well-characterized microbial strains for validation.
- Sample Treatment Buffer: Optimized pH and salt conditions for antigen-antibody binding.
Method:
- Panel Preparation: Comply with a minimum of 25-30 different microbial species, including antigenically related pathogens, common fecal flora, and organisms morphologically similar to target parasites [9] [60].
- Sample Processing: For each challenge organism, prepare standardized suspensions in negative stool matrix. For protozoan parasites and helminths, use microscopically confirmed positive specimens [9].
- Testing Procedure: Apply 60 μL of each challenge suspension to the test device according to manufacturer instructions [9].
- Incubation and Reading: Allow the reaction to proceed for exactly 10 minutes. Visually inspect for development of any gray-black line in the test zone, regardless of intensity [9].
- Interpretation: Record any visible test line as potential cross-reactivity. Confirm true cross-reactivity through repeat testing and alternative method comparison (e.g., DFA, PCR) [8].
Protocol 2: Limit of Detection in Mixed Infections
This protocol determines whether the presence of non-target pathogens affects the detection limit for Giardia or Cryptosporidium.
Method:
- Prepare dilution series of Giardia cysts or Cryptosporidium oocysts in negative stool matrix.
- Spike constant, high concentrations of non-target organisms (e.g., Blastocystis hominis, Entamoeba histolytica/E. dispar) into each dilution point.
- Process and test all samples following standard assay procedures.
- Compare detection limits with and without non-target organisms present.
- Statistical analysis: Perform regression analysis to determine significant differences in detection limits (p < 0.05 considered significant).
The experimental workflow for conducting these comprehensive specificity assessments is outlined below:
Critical Reagents and Research Solutions
The performance of immunochromatographic assays depends heavily on key reagent components. The table below details essential research reagents and their functions:
Table 2: Research Reagent Solutions for Immunochromatographic Assay Development
| Reagent Component | Function | Critical Parameters | Performance Considerations |
|---|---|---|---|
| Capture Antibodies | Immobilized on test line to bind target antigens | Epitope specificity, affinity, isotype | Determines primary specificity; must recognize conserved, genus-specific epitopes [62] |
| Detection Antibodies (Gold-Labeled) | Conjugated to colloidal gold for visual detection | Labeling efficiency, stability, specificity | Gold nanoparticle size (3-30 nm) affects signal intensity [61] [62] |
| Membrane System | Platform for capillary flow and immunoreaction | Porosity, flow characteristics, protein binding | Nitrocellulose membrane with controlled capillary flow time [62] |
| Colloidal Gold Nanoparticles | Signal generation system | Size (3-30 nm), uniformity, conjugation efficiency | Surface plasmon resonance at ~520 nm enables visual detection [62] |
| Sample Treatment Buffer | Extract and stabilize target antigens | pH, surfactants, preservatives | Optimized pH critical for antibody-antigen binding [9] [62] |
Analytical Specificity Challenges and Limitations
Despite generally favorable specificity profiles, immunochromatographic assays face several analytical challenges:
- Low Parasite Loads: False-negative results occur most commonly with low cyst/oocyst counts or specimens containing trophozoites only [9].
- Antigenic Variation: Genetic diversity in target pathogens may lead to variable epitope expression, potentially affecting antibody binding [62].
- Prozone Effect: Extremely high antigen concentrations may occasionally cause false-negative results due to antibody saturation.
- Sample Matrix Effects: Varying stool composition across specimens can interfere with antigen-antibody interactions or flow characteristics.
Immunochromatographic assays for Giardia and Cryptosporidium detection generally exhibit excellent specificity when properly validated. The documented absence of cross-reactivity with a wide range of enteric pathogens in well-designed assays [9] provides confidence in their diagnostic specificity. However, rigorous in-house verification using the protocols outlined herein remains essential, particularly when evaluating assays for use in specific geographical regions with unique pathogen distributions. Continued development of highly specific monoclonal antibodies and optimization of assay conditions will further enhance the reliability of these rapid diagnostic tools for both clinical and research applications.
Within the broader scope of research on immunochromatographic tests (ICT) for Giardia and Cryptosporidium detection, understanding environmental and user-dependent factors is crucial for ensuring diagnostic accuracy. These rapid assays are vital in clinical and public health settings for managing parasitic infections, yet their performance can be influenced by pre-analytical and analytical variables [13] [14]. This application note details the impact of storage conditions, workflow timing, and reader variability on test results, providing validated protocols to optimize reliability and reproducibility for researchers and developers.
Performance Benchmarks of Immunochromatographic Tests
Immunochromatographic tests (ICTs) are widely used for detecting Giardia and Cryptosporidium due to their rapid results and ease of use [14]. The following table summarizes the documented performance of various assays against reference standards.
Table 1: Documented Performance of Immunochromatographic Tests for Giardia and Cryptosporidium
| Assay Name | Target Parasite | Sensitivity | Specificity | Key Findings | Source (Year) |
|---|---|---|---|---|---|
| ColorPAC Giardia/Cryptosporidium | Giardia lamblia | 100% | 100% | Agreement with ProSpecT EIA: 96.5% (166/172). | [20] (2000) |
| Cryptosporidium parvum | 97.6% | 100% | Agreement with ProSpecT EIA: 98.8% (169/171). | [20] (2000) | |
| ImmunoCard STAT! | Giardia lamblia | 93.5% | 100% | False-negatives occurred with low parasite numbers or trophozoites only. | [9] (2003) |
| Cryptosporidium parvum | 98.8% | 100% | No cross-reactivity with other parasites or human cells. | [9] (2003) | |
| Biotech (Spain) Crypto + Giardia ICT | Cryptosporidium spp. | N/A | N/A | Detection rate of 15%, higher than microscopy (6%) but lower than PCR (18%). | [11] (2025) |
| RIDAQUICK Crypto/Giardia Combi | Cryptosporidium spp. | N/A | N/A | Used as a screening tool in a two-step algorithm; 2% positivity in a clinical cohort. | [13] (2023) |
| Microcult Combo Rapid Cassette | Cryptosporidium spp. | ~66.7%* | N/A | Detected 4 out of 6 samples positive by DFA and/or other methods. | [23] (2025) |
*Calculated based on 4 positives out of 6 samples confirmed by other methods in the study.
Experimental Protocols for Evaluating User and Environmental Factors
Protocol: Establishing a Standard Workflow and Timing
The following procedure outlines the steps for performing a rapid immunochromatographic assay, with critical timing checkpoints to ensure result validity.
Objective: To correctly execute the ICT procedure and evaluate the impact of development time on result interpretation. Materials: ImmunoCard STAT! kit (or equivalent), fresh or preserved stool sample, timer, calibrated pipette. Procedure: [9]
- Sample Preparation: Pipet 2 drops of the provided sample treatment buffer into a tube. Add 60 µL of uncentrifuged, formalin-fixed or unfixed stool specimen into the same tube.
- Conjugate Addition: Add 2 drops of the Giardia capture antibody conjugate, followed by 2 drops of the colloidal carbon-conjugated detection reagent. Note that these reagent addition steps are not individually timed.
- Application: Mix the sample thoroughly and immediately pour the entire mixture into the sample well of the test device.
- Incubation and Reading: Start the timer. Read the results visually after exactly 10 minutes. Positive results are indicated by the appearance of a gray-black line in the appropriate test zone ("G" for Giardia or "C" for Cryptosporidium), regardless of intensity. The control line must be present for the test to be valid. Critical Step: The 10-minute reading window is critical. Reading results too early may lead to false negatives, while reading too late can lead to false positives due to background or non-specific binding.
Protocol: Evaluating Sample Storage Conditions
This protocol assesses the stability of parasite antigens in stool samples under different storage conditions, which is vital for accurate testing in real-world settings.
Objective: To determine the effect of various storage temperatures and durations on the detectability of Giardia and Cryptosporidium antigens. Materials: Stool samples positive for Giardia and/or Cryptosporidium, sterile containers, refrigerators (4°C), freezers (-20°C), ICT kits. Procedure: [11] [13] [14]
- Aliquot Samples: For each positive sample, create multiple aliquots.
- Storage Conditions: Store the aliquots under the following conditions:
- Short-term: At 2-8°C for 1-3 days.
- Long-term: At -20°C for extended periods (weeks to months).
- Preserved: In 5% or 10% formalin, or Sodium Acetate-Acetic Acid-Formalin (SAF).
- Testing: Test the aliquots using the chosen ICT at predetermined time points (e.g., day 1, 3, 7, 30). Compare the intensity of the test line and the overall result to the baseline result obtained from a fresh sample. Data Analysis: A decrease in test line intensity or a shift from positive to negative over time indicates antigen degradation under that storage condition.
Diagram 1: Sample storage and testing workflow to evaluate antigen stability.
The Scientist's Toolkit: Key Research Reagent Solutions
Table 2: Essential Materials for Giardia/Cryptosporidium ICT Research
| Item | Function in Research & Development |
|---|---|
| Merifluor Cryptosporidium/Giardia DFA | Used as a gold standard reference method for validating the sensitivity and specificity of new ICT prototypes due to its high combination of sensitivity and specificity [8] [23]. |
| Formalin & SAF Fixatives | Preserves stool samples for stability studies, allowing evaluation of antigen longevity and test performance on preserved versus fresh samples [20] [9]. |
| ColorSeed/EasySeed | Contains inactivated, fluorescently labeled oocysts/cysts. Serves as a critical internal process control for recovery efficiency and to monitor assay performance across different sample matrices and lots [14]. |
| Immunomagnetic Separation (IMS) Kits | Used in sample preparation workflows to concentrate and purify oocysts from complex matrices (e.g., water, stool), improving the detection limit of downstream ICTs [14]. |
| Colloidal Carbon/Dye-Labeled Conjugates | The detection reagent in non-enzymatic ICTs. Research focuses on optimizing these labels for enhanced visual contrast and sensitivity compared to traditional gold nanoparticles [9] [63]. |
Reader Variability and Quantitative Analysis
A significant challenge with traditional ICTs is subjective visual interpretation, which can lead to reader variability. Newer generations of ICTs are addressing this through technological integration.
Visual vs. Automated Reading: While many protocols rely on visual interpretation of lines [9], this can introduce human error. A 2025 study highlighted that ICT, while more sensitive than microscopy, was less sensitive than PCR, suggesting limitations in detection thresholds that may be partly due to subjective reading [11]. To mitigate this, advanced quantitative ICA readers are being developed. These portable devices use imaging technology and software to objectively measure test line intensity, enabling precise, quantitative results and data connectivity, thereby reducing reader variability [63].
Advanced Sensor Integration: Beyond optical readers, research is exploring the integration of electrochemical sensors with machine learning. One study demonstrated a system where cyclic voltammetry data from an immunoassay was analyzed by a machine learning model (multivariate linear regression) to quantify an analyte with high precision ((R^2 \approx 0.999)). This approach compensates for experimental noise and variations, showcasing a path toward highly robust and automated quantitative immunodetection [64].
Diagram 2: Comparing traditional subjective reading with advanced quantitative analysis.
The reliability of immunochromatographic tests for Giardia and Cryptosporidium is inherently linked to controlled environmental and user factors. Adherence to standardized protocols for sample storage, strict timing during the assay workflow, and the adoption of objective reading systems are paramount for generating reproducible and accurate data. Future research and development should focus on integrating more robust reagents, stable labels, and intelligent reader systems to minimize variability and enhance the precision of these vital diagnostic tools.
Comparative Diagnostic Accuracy: ICT vs. Microscopy, DFA, ELISA, and PCR
Immunochromatographic tests (ICTs) have emerged as critical tools for the rapid diagnosis of enteric parasitic infections, particularly giardiasis and cryptosporidiosis. This application note provides a comprehensive meta-analysis of the sensitivity and specificity profiles of commercially available ICT kits for detecting Giardia duodenalis (also known as Giardia lamblia) and Cryptosporidium spp. in human fecal specimens. By synthesizing data from multiple clinical evaluations, we demonstrate that several commercial assays achieve high sensitivity (82-100%) and specificity (95-100%), establishing their utility in clinical and public health settings, especially where expert microscopy is unavailable. The document further presents standardized experimental protocols for kit evaluation and visualizes the diagnostic workflow, providing researchers and drug development professionals with essential resources for assay selection, validation, and implementation.
Giardia duodenalis and Cryptosporidium spp. are major causative agents of waterborne diarrheal diseases worldwide, posing significant challenges to public health systems [65]. Traditional diagnostic methods based on microscopic examination require skilled personnel, are time-consuming, and may lack sensitivity, particularly in cases of low parasite burden [66]. Rapid solid-phase qualitative immunochromatographic assays have revolutionized parasitological diagnosis by providing results within minutes without the need for special equipment [67] [9]. These assays detect genus-specific antigens captured and immobilized on a membrane substrate through antibody-antigen interactions, with positive results visualized as distinct color bars on the test device [68]. This meta-analysis synthesizes performance data across multiple commercial ICT platforms, providing evidence-based guidance for their application in clinical and research settings, framed within the broader context of improving diagnostic accuracy for these significant enteric pathogens.
Comparative Performance Analysis of Commercial ICT Kits
Performance Metrics for Giardia and Cryptosporidium Detection
Extensive evaluation of commercial ICT kits reveals generally high diagnostic performance, though significant variation exists between different products and target organisms. The following table summarizes the sensitivity and specificity profiles of major commercially available assays as reported in clinical validation studies.
Table 1: Diagnostic Performance of Commercial ICT Kits for Giardia and Cryptosporidium Detection
| Test Kit (Manufacturer) | Target Organism | Sensitivity (%) | Specificity (%) | Positive Predictive Value (%) | Negative Predictive Value (%) | Reference |
|---|---|---|---|---|---|---|
| ImmunoCard STAT! (Meridian) | G. duodenalis | 93.5 | 100 | 100 | 95.5 | [9] |
| ImmunoCard STAT! (Meridian) | C. parvum | 98.8 | 100 | 100 | 99.7 | [9] |
| CerTest Crypto-Giardia (CerTest Biotec) | G. duodenalis | 97 | 100 | - | - | [67] |
| CerTest Crypto-Giardia (CerTest Biotec) | Cryptosporidium spp. | 100 | - | - | - | [67] |
| Stick Crypto-Giardia (Operon) | G. duodenalis | 97 | 95 | - | - | [67] |
| Stick Crypto-Giardia (Operon) | Cryptosporidium spp. | 92 | - | - | - | [67] |
| RIDAQUICK Cryptosporidium/Giardia Combi (R-Biopharm) | G. duodenalis | 80 | - | - | - | [66] |
| RIDAQUICK Cryptosporidium/Giardia Combi (R-Biopharm) | Cryptosporidium spp. | 82 | - | - | - | [66] |
| Giardia-Strip (Coris BioConcept) | G. duodenalis | 44 | - | - | - | [66] |
| Cryptosporidium-Strip (Coris BioConcept) | Cryptosporidium spp. | 75 | - | - | - | [66] |
Performance in Animal Species and Comparative Analysis
Evaluation of ICT performance in animal models reveals important considerations for zoonotic transmission studies. The following table summarizes the sensitivity and specificity of immunological tests for Cryptosporidium species in animals compared to PCR results.
Table 2: Performance of Immunological Tests for Cryptosporidium Detection in Animal Samples [69]
| Test Type | Test Name | Sensitivity (%) | Specificity (%) |
|---|---|---|---|
| Enzyme Immunoassay (EIA) | RIDASCREEN Cryptosporidium | 63.6 | 75.9 |
| Enzyme-Linked Immunosorbent Assay (ELISA) | Cryptosporidium 2nd Generation | 40.9 | 78.9 |
| Immunochromatographic Test (ICT) | RIDAQUICK Cryptosporidium | 22.7 | 100 |
Performance variation in animal samples highlights the impact of Cryptosporidium species diversity on diagnostic accuracy. The RIDAQUICK test demonstrated perfect specificity but low sensitivity (22.7%) in animal specimens, contrasting with its higher sensitivity (82%) in human samples [69] [66]. This discrepancy may reflect differences in the Cryptosporidium species present (including C. scrofarum, C. suis, C. muris, and C. andersoni in animals versus primarily C. parvum and C. hominis in humans) and potential variations in antigen production across species [69].
Experimental Protocols for ICT Evaluation
Specimen Collection and Preparation Protocol
Materials Required:
- Fresh, frozen, or preserved (5-10% formalin or SAF) human fecal specimens
- Sample collection containers
- Disposable transfer pipettes
- Dilution buffers (kit-specific)
- Centrifuge tubes
- Vortex mixer
Procedure:
- Specimen Collection: Collect fecal specimens in clean, leak-proof containers. Specimens may be used fresh, frozen at -20°C, or preserved in 5-10% formalin or sodium acetate-acetic acid-formalin (SAF). Note that formalin-based fixatives are not recommended if molecular confirmation testing is anticipated [65].
Specimen Preparation:
- For liquid specimens: Pipette 60μL directly into the preparation tube.
- For solid specimens: Emulsify approximately 50mg (pea-sized) of stool in the provided dilution buffer (usually 1:10 ratio).
- Vortex thoroughly for 10-15 seconds to achieve homogeneous suspension.
- Allow coarse particles to settle for 2-3 minutes [9].
Sample Clarification: Transfer 500μL of supernatant to a new test tube for testing. Avoid transferring particulate matter that may obstruct the immunochromatographic membrane [9].
ImmunoCard STAT! Rapid Assay Procedure
Materials Required:
- ImmunoCard STAT! test devices (Meridian Bioscience, Inc.)
- Sample preparation tubes with buffers
- Conjugate A (Giardia capture antibody)
- Conjugate B (colloidal carbon-conjugated detection reagent)
- Disposable transfer pipettes
- Timer
Procedure:
- Tube Preparation: Add 2 drops of sample treatment buffer to a clean preparation tube.
Sample Addition: Pipette 60μL of prepared fecal specimen (uncentrifuged) into the same tube.
Conjugate Addition: Add 2 drops of Conjugate A (Giardia-specific antibody) followed by 2 drops of Conjugate B (colloidal carbon-conjugated detection reagent for both Giardia and Cryptosporidium).
Mixing: Mix the contents thoroughly by vortexing or repeated pipetting.
Test Device Application: Immediately pour the entire mixture into the sample well of the test device.
Incubation: Allow the test to develop at room temperature for 10 minutes.
Result Interpretation: Visually examine the test device for the presence of gray-black color bars in the "Giardia" and/or "Cryptosporidium" zones, regardless of intensity. A valid test must show a distinct color bar in the control zone [9] [68].
Troubleshooting Notes:
- If the control line fails to appear, the test is invalid and should be repeated with a new device.
- Faint test lines should be considered positive, though follow-up testing is recommended for weakly positive results in symptomatic patients.
- For patients who remain symptomatic after a negative result, additional diagnostic methods including ova and parasite examination and special stains should be employed [68].
Quality Control and Validation Procedures
Internal Quality Control:
- Each test device contains a built-in control line that must develop for the test to be considered valid.
- The control line verifies that the sample has migrated properly and the reagents are functioning.
External Quality Control:
- Positive and negative controls should be run with each new lot number and when a new operator is trained.
- Positive controls containing inactivated Giardia and Cryptosporidium antigens are available from manufacturers.
- Negative controls should consist of buffer only or known negative stool samples.
Resolution of Discrepant Results:
- Specimens with discrepant results between ICT and reference methods should be retested using an alternative method, preferably immunofluorescence or PCR [9] [70].
- For Giardia false negatives, consider that specimens with low parasite numbers or containing trophozoites only may yield false-negative results [68].
- Molecular methods such as PCR and sequencing provide the highest specificity for species identification and are recommended as reference standards [69] [70].
Diagnostic Workflow Visualization
ICT Diagnostic Workflow: This diagram illustrates the standardized procedure for performing immunochromatographic tests for Giardia and Cryptosporidium detection, from sample preparation through result interpretation and follow-up testing recommendations.
The Scientist's Toolkit: Essential Research Reagents and Materials
Table 3: Essential Research Reagents and Materials for ICT-Based Parasite Detection
| Item | Function/Application | Examples/Specifications |
|---|---|---|
| ICT Kits | Simultaneous detection of Giardia and Cryptosporidium antigens | ImmunoCard STAT! (Meridian), RIDAQUICK Combi (R-Biopharm), CerTest Crypto-Giardia (CerTest) |
| Specimen Preservation Media | Maintain antigen integrity during storage and transport | 10% buffered formalin, SAF (sodium acetate-acetic acid-formalin), 2.5% potassium dichromate |
| Reference Standard Reagents | Method validation and discrepancy resolution | Merifluor immunofluorescence assay (Meridian), Modified acid-fast staining reagents, PCR kits |
| Molecular Biology Kits | Species identification and genotyping | DNA extraction kits, PCR/master mix reagents, Sequencing reagents |
| Quality Control Materials | Assay performance verification | Positive control antigens, Negative stool matrices |
| Sample Processing Equipment | Specimen preparation and homogenization | Microcentrifuges, Vortex mixers, Disposable pipettes |
| Optical Reading Devices | Objective result interpretation (optional) | Strip readers, Densitometers |
This meta-analysis demonstrates that commercially available immunochromatographic tests provide clinically acceptable sensitivity and specificity for the rapid detection of Giardia duodenalis and Cryptosporidium spp. in human fecal specimens. The ImmunoCard STAT! and CerTest Crypto-Giardia assays consistently show superior performance with sensitivities exceeding 93% for both parasites and specificities approaching 100%. These assays offer significant advantages in settings lacking expert microscopists or specialized equipment, providing results within 10-15 minutes. However, performance variations across different test brands and between human and animal specimens highlight the importance of careful test selection and validation for specific applications. When implementing these rapid tests, laboratories should establish protocols for confirming discrepant results with reference methods, particularly for symptomatic patients with negative ICT results. Future developments in multiplex ICT platforms incorporating additional enteric pathogens and standardized quantitative readouts will further enhance the clinical utility of these rapid diagnostic tools.
The accurate detection of gastrointestinal protozoan parasites, particularly Giardia duodenalis (also known as G. lamblia) and Cryptosporidium spp., is critical for both clinical management and public health surveillance. While numerous diagnostic methods are available, immunochromatographic tests (ICT) and direct fluorescent-antibody (DFA) assays have emerged as prominent techniques. This application note provides a systematic comparison of these methods, drawing upon recent scientific evidence to guide researchers and laboratory professionals in selecting appropriate diagnostic approaches for their specific contexts. DFA is widely regarded as the reference standard in many clinical and veterinary settings due to its well-established sensitivity and specificity [8]. However, the operational simplicity and rapid turnaround time of ICT platforms have made them increasingly popular, particularly in resource-limited environments or during outbreak investigations. Understanding the relative performance characteristics of these assays is essential for optimizing diagnostic protocols in both human and veterinary parasitology.
Performance Data Comparison
Extensive evaluations across multiple studies have demonstrated consistent performance patterns for ICT and DFA methods. The table below summarizes key performance metrics for detecting Giardia and Cryptosporidium.
Table 1: Comparative Performance of DFA and ICT for Protozoan Detection
| Parasite | Method | Sensitivity (%) | Specificity (%) | Positive Predictive Value (%) | Negative Predictive Value (%) | Study/Context |
|---|---|---|---|---|---|---|
| Giardia | DFA (Gold Standard) | 100 [8] | 100 [8] | 100 [8] | 100 [8] | Veterinary & Clinical Settings |
| ImmunoCard STAT! ICT | 93.5 | 100 | 100 | 95.5 | Human Stool Samples [9] | |
| ColorPAC ICT | 100 | 100 | 100 | 100 | Human Stool Samples [20] | |
| Cryptosporidium | DFA (Gold Standard) | 100 [8] | 100 [8] | 100 [8] | 100 [8] | Veterinary & Clinical Settings |
| ImmunoCard STAT! ICT | 98.8 | 100 | 100 | 99.7 | Human Stool Samples [9] | |
| ColorPAC ICT | 97.6 | 100 | 100 | 100 | Human Stool Samples [20] |
Comparative Detection Rates in Recent Studies
A 2024 veterinary study providing a direct head-to-head comparison found DFA to be the most sensitive technique for detecting G. duodenalis in dogs and cats, significantly outperforming other methods (p-value: <0.001) [8]. The same research identified that the identification of Cryptosporidium infections was most effectively accomplished by the combination of DFA and PCR technique (p-value: <0.001) [8].
A 2025 study on human cryptosporidiosis in Qatar evaluated four diagnostic methods and found the following detection rates for Cryptosporidium: PCR (18%), ICT (15%), modified Kinyoun's acid-fast stain (7%), and routine microscopy (6%) [11]. This demonstrates the superior sensitivity of both antigen and molecular detection methods over conventional staining techniques, with ICT showing reasonably high detection capability, though still below that of PCR.
Table 2: Comparative Detection Rates Across Multiple Methods (2025 Study)
| Diagnostic Method | Technology Type | Detection Rate for Cryptosporidium |
|---|---|---|
| Multiplex PCR | Molecular | 18% |
| Immunochromatography (ICT) | Antigen Detection | 15% |
| Modified Kinyoun's Stain | Microscopy/Staining | 7% |
| Routine Microscopy | Microscopy | 6% |
Experimental Protocols
Direct Fluorescent-Antibody (DFA) Assay Protocol
Principle
DFA assays utilize fluorescently labeled monoclonal antibodies that specifically bind to cell wall antigens of Giardia cysts and Cryptosporidium oocysts. The bound complexes are then visualized using a fluorescence microscope, allowing for simultaneous morphological confirmation and enumeration [8].
Reagents and Equipment
- Commercial DFA kit (e.g., Crypto/Giardia Cel IF, CeLLabs)
- Fluorescence microscope with appropriate filters (e.g., Nikon Eclipse Ci-S)
- Phosphate-buffered saline (PBS)
- Centrifuge and centrifuge tubes
- Disposable pipettes and micropipettes
- Glass slides and coverslips
- Moist chamber for slide incubation
Step-by-Step Procedure
- Sample Preparation: Thoroughly resuspend 3-5 g of fecal material in 20 ml of PBS. Filter the homogenate through a sieve mesh (250 μm diameter) to remove large debris [8].
- Centrifugation: Transfer the filtered suspension to a 10 ml centrifuge tube and centrifuge at 1,500 rpm for 10 minutes. Carefully discard the supernatant [8].
- Staining Application: Apply the appropriate volume of fluorescently-labeled antibody reagent to the processed sediment according to manufacturer specifications.
- Incubation: Place slides in a moist chamber and incubate at room temperature for the duration specified in the kit protocol (typically 30-60 minutes).
- Washing: Gently rinse slides with PBS to remove unbound antibody.
- Mounting: Apply coverslips using mounting medium if provided.
- Microscopy: Examine slides under a fluorescence microscope at 400× magnification. Giardia cysts (8-12 μm) and Cryptosporidium oocysts (4-6 μm) appear bright apple-green and exhibit appropriate morphology [8].
- Interpretation: Consider samples positive when structures of the correct size and morphology show specific fluorescence. Report the number of cysts/oocysts per microscope field for semi-quantitative assessment.
Immunochromatographic Test (ICT) Protocol
Principle
ICT devices employ antibodies immobilized on a membrane to capture parasite-specific antigens present in fecal specimens. A second labeled antibody creates a visible line when the target antigen is present, providing a rapid, qualitative result without requiring specialized equipment [9] [18].
Reagents and Equipment
- Commercial ICT device (e.g., ImmunoCard STAT!, Biotech Crypto/Giardia ICT)
- Sample collection tubes with buffer
- Disposable pipettes
- Timer
Step-by-Step Procedure
- Sample Preparation: For liquid stools, pipette 125 μL directly. For formed stools, emulsify 0.5 g in the provided dilution buffer [11]. Note: Some manufacturers recommend against using formalin-fixed samples, while others permit testing on fixed specimens [9] [18].
- Reagent Preparation: Add 2 drops of sample treatment buffer to a tube. Pipette 60 μL of uncentrifuged stool specimen into the tube [9] [20].
- Conjugate Addition: Add 2 drops of Giardia capture antibody conjugate and 2 drops of colloidal carbon-conjugated detection reagent to the tube [20].
- Test Activation: Mix the sample thoroughly and immediately pour the entire mixture into the sample well of the test device.
- Incubation: Allow the test to develop for the specified time (typically 10-12 minutes). Do not read results after the maximum time specified [9].
- Interpretation: Read results visually. The appearance of a gray-black line (regardless of intensity) in the test region indicates a positive result. A control line must always appear for the test to be valid [9].
Visual Workflows
The Scientist's Toolkit: Research Reagent Solutions
Table 3: Essential Reagents and Materials for Protozoan Antigen Detection
| Item | Function/Application | Examples/Specifications |
|---|---|---|
| DFA Kits | Gold standard detection of cysts/oocysts via fluorescent labeling | Crypto/Giardia Cel IF (CeLLabs); Merifluor Cryptosporidium/Giardia [8] [9] |
| ICT Devices | Rapid qualitative detection of parasite antigens | ImmunoCard STAT! (Meridian Bioscience); ColorPAC (Becton Dickinson); Biotech Crypto/Giardia [9] [11] [20] |
| Fluorescence Microscope | Visualization of fluorescing parasites in DFA | Nikon Eclipse Ci-S, 400× magnification capability [8] |
| Formalin-Based Fixatives | Sample preservation for DFA and some ICT platforms | 5-10% formalin, SAF [9] |
| Centrifuge | Sample processing and concentration | Capable of 1,500 rpm for 10 minutes [8] |
| Sample Dilution Buffers | Preparation of fecal samples for ICT | Manufacturer-provided buffer solutions [9] [18] |
The head-to-head comparison between ICT and DFA reveals a consistent pattern: while DFA maintains its position as the gold standard with superior sensitivity and the added advantage of morphological confirmation, ICT platforms offer an excellent alternative when rapid results and operational simplicity are prioritized. The selection between these methods should be guided by specific diagnostic needs, available resources, and the clinical or research context. For the most accurate detection, particularly in cases of low parasite burden or for research purposes requiring definitive confirmation, DFA remains the recommended choice. However, in settings where speed and ease of use are critical, or as an initial screening tool, ICT provides a reliable and valuable diagnostic option. Ultimately, a combined approach utilizing ICT for initial screening followed by DFA confirmation of positive or equivocal results may represent the most effective diagnostic strategy for comprehensive parasite detection and surveillance programs.
Within the broader research on immunochromatographic tests for the detection of Giardia lamblia and Cryptosporidium parvum, Enzyme Immunoassays (EIAs) represent a critical benchmark for performance. These protozoan parasites are significant causes of waterborne diarrheal disease worldwide, with Giardia being the most common intestinal parasite in the United States [71]. Traditional diagnostic methods rely on microscopic examination, which demands considerable time and expertise while often lacking sufficient sensitivity [71] [11]. Antigen-detection EIAs have become widely accepted for screening stools, offering a highly sensitive and specific alternative [71] [9]. This application note provides a detailed comparative analysis and experimental protocol for benchmarking the ProSpecT Giardia/Cryptosporidium Microplate Assay against the ColorPAC Giardia/Cryptosporidium Rapid Assay, herein referred to as the Cryptosporidium II test for the purpose of this study, thereby establishing a reference standard for evaluating newer immunochromatographic methods.
Experimental Design & Benchmarking Objectives
The primary objective of this benchmarking study is to conduct a head-to-head comparison of two commercially available EIAs—the ProSpecT Microplate Assay and the ColorPAC (Cryptosporidium II) Rapid Assay—for the detection of G. lamblia and C. parvum antigens in clinical stool specimens. The study is designed to mirror real-world diagnostic scenarios.
- Sample Preparation: The evaluation utilizes archived and freshly collected clinical stool specimens fixed in 10% formalin. A total of 241 stool specimens were tested for each parasite [71]. Specimens are considered truly positive or negative based on a composite reference standard: positivity is defined as agreement of both EIAs, or one EIA positive with morphological confirmation. Negativity is defined as both EIAs negative, or one EIA negative with a confirmatory negative morphological exam [71].
- Morphological Confirmation: Iodine wet preps and trichrome-stained smears are used to detect Giardia cysts and trophozoites. A modified Ziehl-Neelsen stain on concentrated specimens is used to identify Cryptosporidium oocysts [71]. This is a critical step for resolving discrepant EIA results.
- Key Performance Indicators (KPIs): The core metrics for benchmarking are Sensitivity, Specificity, and Percent Agreement between the two assays. Furthermore, operational factors such as time-to-result, ease of use, and cost are evaluated [71].
Detailed Experimental Protocols
Specimen Collection and Preparation
- Collection: Collect human fecal specimens in 10% formalin or Sodium Acetate-Acetic Acid-Formalin (SAF) fixatives [9] [20].
- Storage: Archived specimens should be tested within 5 months of collection [71]. Unpreserved stool samples for immediate testing can be stored at 4°C for 1-2 days; for longer storage, freeze at -20°C [18].
- Preparation: For both EIA protocols, use unconcentrated, preserved stool specimens. Ensure samples are homogenized before aliquoting [71] [20].
ProSpecT Giardia/Cryptosporidium Microplate Assay Protocol
The ProSpecT assay is a microplate-based EIA that requires multiple reagent additions and washing steps [20].
- Sample Addition: Pipette the prepared unconcentrated stool specimen into the wells of the antibody-coated microplate.
- Incubation and Washing: Incubate the plate to allow antigen-antibody binding, then wash the wells to remove unbound materials.
- Enzyme Conjugate: Add enzyme-conjugated antibody to the wells and incubate. A second wash is performed to remove unbound conjugate.
- Substrate Addition: Add enzyme substrate to the wells and incubate to allow color development.
- Reaction Stop: Add stop solution to the reaction.
- Result Interpretation: Measure the optical density (OD) of each well with a spectrophotometer. The OD value is compared to a calibrator or cut-off value to determine a positive or negative result. Note: The combination Giardia/Cryptosporidium assay requires supplemental testing to determine which organism is responsible for positivity [71].
ColorPAC Giardia/Cryptosporidium Rapid Assay (Cryptosporidium II) Protocol
The ColorPAC assay is a rapid, solid-phase immunochromatographic assay designed for ease of use and faster results [71] [20].
- Tube Preparation: Add 2 drops of sample treatment buffer to a provided tube.
- Sample Addition: Pipette 60 µL of the uncentrifuged stool specimen into the same tube.
- Conjugate Addition: Add 2 drops of Giardia capture antibody conjugate, followed by 2 drops of a colloidal carbon-conjugated detection reagent for both Giardia and Cryptosporidium.
- Chromatography: Mix the sample and immediately pour the entire mixture into the sample well of the test device.
- Result Interpretation: Read the results visually after 10 minutes. A positive test is indicated by the appearance of a gray-black line (regardless of intensity) in the region corresponding to Giardia or Cryptosporidium on the test device. The test includes an internal control line that must appear for the test to be valid [9] [20].
Workflow Diagram
The following diagram illustrates the procedural flow and key decision points for the benchmarking study:
Results & Performance Data
Quantitative Benchmarking Results
The following tables summarize the performance data derived from the direct comparison of 241 clinical stool specimens [71].
Table 1: Raw Result Distribution and Agreement Between EIA Methods
| Organism | Assay | True Positive | False Positive | True Negative | False Negative | Total Specimens |
|---|---|---|---|---|---|---|
| Giardia | ColorPAC | 53 | 0 | 188 | 0 | 241 |
| ProSpecT | 53 | 3 | 185 | 0 | 241 | |
| Cryptosporidium | ColorPAC | 19 | 1 | 221 | 0 | 241 |
| ProSpecT | 19 | 3 | 219 | 0 | 241 |
Table 2: Calculated Sensitivity, Specificity, and Overall Agreement
| Organism | Assay | Sensitivity (%) | Specificity (%) | Agreement with ProSpecT (%) |
|---|---|---|---|---|
| Giardia | ColorPAC | 100 | 100 | 98.7 |
| ProSpecT | 100 | 98.4 | - | |
| Cryptosporidium | ColorPAC | 100 | 99.5 | 98.1 |
| ProSpecT | 100 | 98.6 | - |
Analysis of Discrepant Results and Operational Factors
- Specificity Observations: The ProSpecT assay generated a small number of false-positive reactions for both Giardia (n=3) and Cryptosporidium (n=3). It was noted that all these specimens were grossly bloody, suggesting a potential interference that warrants further investigation [71]. The ColorPAC assay demonstrated 100% specificity for Giardia and 99.5% for Cryptosporidium [71].
- Operational Comparison: The ColorPAC EIA was reported to be simpler to use with a faster time-to-result. A key usability advantage is its ability to detect and distinguish between Giardia and Cryptosporidium on a single device without supplemental testing, whereas the ProSpecT combination assay requires additional steps to speciate the positive result [71]. However, the ColorPAC assay is noted to be more expensive based on the manufacturer's retail price [71].
The Scientist's Toolkit: Research Reagent Solutions
Table 3: Essential Materials and Reagents for EIA Benchmarking
| Item | Function/Description | Example Product/Brand |
|---|---|---|
| Stool Fixatives | Preserves parasite morphology and antigen integrity for testing. | 10% Formalin, Sodium Acetate-Acetic Acid-Formalin (SAF) [71] [9] |
| Reference EIA Kits | Benchmarking standards for sensitivity and specificity comparison. | ProSpecT Giardia/Cryptosporidium Microplate Assay (Alexon-Trend) [71] |
| Rapid Immunoassay Kits | The test device for rapid, visual detection and differentiation. | ColorPAC Giardia/Cryptosporidium Rapid Assay (Becton Dickinson) [71] [20] |
| Immunofluorescence Assay (IFA) | High-sensitivity reference method for resolving discrepant results. | Merifluor Cryptosporidium/Giardia (Meridian Bioscience) [9] |
| Microscopy Stains | For morphological confirmation of parasites in discrepant samples. | Trichrome stain (Giardia), Modified Ziehl-Neelsen stain (Cryptosporidium) [71] |
| Sample Processing Tubes & Buffers | Provided with test kits for standardized specimen preparation. | ColorPAC Sample Treatment Buffer and Tubes [20] |
This benchmarking study establishes that both the ProSpecT and ColorPAC (Cryptosporidium II) EIAs are highly sensitive (100%) and specific tools for the detection of Giardia and Cryptosporidium in clinical stool specimens [71]. The choice between them involves a trade-off: the ProSpecT assay offers a cost-effective platform but may have slightly lower specificity with bloody specimens and a more complex workflow. In contrast, the ColorPAC assay provides superior specificity, ease of use, and rapid, differentiated results at a higher cost. For researchers developing and evaluating immunochromatographic tests, these EIA platforms provide a robust gold standard against which the sensitivity, specificity, and operational efficiency of new rapid diagnostics must be rigorously compared.
Within clinical and research settings, immunochromatographic tests (ICTs) provide a rapid, initial result for the detection of enteric parasites like Giardia duodenalis and Cryptosporidium spp. However, the need for confirmatory testing is well-established. This application note details the protocols and supporting data for using real-time polymerase chain reaction (real-time PCR) as a definitive confirmatory tool, framing this methodology within the broader context of diagnostic parasitology research and drug development.
Performance Comparison: Immunochromatography vs. Real-time PCR
The following table summarizes key performance metrics of ICTs when real-time PCR is used as a reference standard, illustrating the necessity for molecular confirmation.
Table 1: Comparative Diagnostic Performance of Immunochromatography (ICT) and Real-time PCR for Giardia and Cryptosporidium Detection
| Parasite | Sample Type | Reference Method | ICT Sensitivity | ICT Specificity | Key Findings | Source |
|---|---|---|---|---|---|---|
| Cryptosporidium spp. | Human Stool | Multiplex Real-time PCR | 15% | N/R | PCR detected 18% of samples as positive, while ICT and microscopy detected 15% and 6%, respectively, highlighting PCR's superior sensitivity. [11] | |
| G. duodenalis & Cryptosporidium spp. | Canine/Feline Stool | Direct Immunofluorescence (DFA) & Real-time PCR | Lower than DFA & PCR | Variable; some ICTs showed false positives | DFA was the most sensitive technique; real-time PCR was highly effective, especially for identifying Cryptosporidium infections when combined with DFA. [8] | |
| G. lamblia | Sewage | Nested PCR & DFA | N/R | N/R | A commercial multiplex real-time PCR kit found 10 times more samples contaminated with G. lamblia than DFA and showed high agreement with nested PCR. [72] |
N/R: Not Reported in the source material
Experimental Protocols for Confirmatory Testing
Protocol 1: Multiplex Real-time PCR for Simultaneous Detection
This protocol is adapted from assessments of a commercial multiplex real-time PCR (MRT-PCR) kit for detecting Giardia lamblia, Cryptosporidium spp., and Entamoeba histolytica in complex samples like sewage [72]. Its high-throughput capacity makes it suitable for large-scale screening studies.
Key Applications:
- Simultaneous screening for multiple intestinal protozoa of public health importance.
- Monitoring of environmental water or sewage for pathogen contamination.
- Epidemiological studies where co-infections are suspected.
Materials & Reagents:
- Commercial Multiplex Real-Time PCR Kit: Designed for fecal samples but adaptable to environmental samples.
- Positive Control DNA: For G. lamblia, Cryptosporidium spp., and E. histolytica.
- DNA Extraction Kit: Suitable for complex samples (e.g., EURx GeneMATRIX Stool DNA Purification Kit).
- Real-time PCR Thermocycler.
Procedure:
- Sample Preparation: Concentrate water or sewage samples if necessary. For stool samples, use a small aliquot.
- DNA Extraction: Perform DNA isolation according to the kit manufacturer's instructions. Incorporate a bead-beating or similar mechanical disruption step to ensure efficient lysis of (oo)cysts.
- MRT-PCR Setup:
- Prepare the master mix according to the kit protocol.
- Add the extracted DNA sample.
- Include positive controls (for each target) and no-template controls (NTC) in each run.
- Amplification: Run the plate on a real-time PCR thermocycler using the cycling conditions specified by the kit manufacturer.
- Data Analysis:
- A cycle threshold (Ct) value below 37.6 (as validated for one kit) indicates a positive result for G. lamblia [72].
- Analyze amplification curves for all targets to identify single or co-infections.
Protocol 2: Real-time PCR forGiardia duodenaliswith Assemblage Discrimination
This protocol outlines a method for specific detection of G. duodenalis and differentiation of its zoonotic assemblages (A and B) using laboratory-developed real-time PCR assays [73].
Key Applications:
- Confirmatory diagnosis of human giardiasis.
- Molecular epidemiology to determine the source of outbreaks (anthroponotic vs. potential zoonotic transmission).
- Research into potential correlations between parasite assemblage and clinical presentation.
Materials & Reagents:
- Primers and Probes: Specific for the general detection of G. duodenalis and for assemblages A and B [73].
- DNA Polymerase Master Mix: For real-time PCR.
- DNA Extraction Kit: Optimized for stool samples (e.g., QIAamp Stool DNA Mini Kit).
Procedure:
- DNA Extraction: Extract genomic DNA from 180-220 mg of stool sample using a commercial stool DNA kit. Include inhibitor removal steps as per the protocol.
- Assay Selection and Setup: Perform multiple parallel real-time PCR reactions:
- One assay for the general detection of G. duodenalis.
- Separate, assemblage-specific assays for Assemblage A and Assemblage B.
- Amplification: Run the reactions on a real-time PCR platform (e.g., LightCycler Pro). A typical cycling program includes:
- Initial denaturation: 95°C for 5-10 minutes.
- 45 cycles of: Denaturation (95°C for 10-15 seconds), Annealing/Extension (60°C for 30-60 seconds - acquire fluorescence).
- Interpretation: A sample is considered positive for a specific assemblage if the corresponding assay produces a sigmoidal amplification curve that crosses the threshold within the defined cycle limit.
Research Reagent Solutions
Table 2: Essential Research Reagents for Molecular Detection of Giardia and Cryptosporidium
| Item | Function/Application | Example Product/Source |
|---|---|---|
| Stool DNA Extraction Kit | Isolation of inhibitor-free genomic DNA from complex stool or environmental samples. | QIAamp Stool DNA Mini Kit (Qiagen), EURx GeneMATRIX Stool DNA Purification Kit [73] [74] |
| Commercial Multiplex Real-time PCR Kit | Simultaneous detection and differentiation of multiple enteric protozoa in a single reaction. | Kits validated for Giardia, Cryptosporidium, and Entamoeba [72] |
| Assemblage-Specific Primers/Probes | Detection and genotyping of G. duodenalis to determine zoonotic potential. | Laboratory-developed assays for Assemblages A and B [73] |
| Positive Control Plasmids | Quality control for PCR efficiency and specificity; contains target sequence inserts. | Plasmid-based controls (e.g., pEX A128 vector with target insert) [73] |
Workflow for Confirmatory Diagnosis
The following diagram illustrates the integrated diagnostic pathway, from initial rapid screening to molecular confirmation and epidemiological analysis.
The integration of immunochromatographic tests with real-time PCR creates a robust diagnostic and research pipeline. While ICTs offer speed and convenience for initial screening, real-time PCR is an indispensable confirmatory tool that provides the sensitivity, specificity, and discriminatory power necessary for accurate diagnosis, effective public health surveillance, and advanced research into these significant enteric pathogens.
Immunochromatographic tests (ICTs) have emerged as vital tools for the rapid detection of Giardia duodenalis and Cryptosporidium spp., two protozoan parasites responsible for a significant global burden of waterborne and foodborne diarrheal diseases. Their utility is particularly pronounced in endemic settings, during outbreak investigations, and in point-of-care scenarios where timely diagnosis directly influences patient management and public health interventions. This application note synthesizes recent field evaluation data to assess the performance characteristics of these rapid tests against established diagnostic methods, providing researchers and drug development professionals with a critical evidence base for their implementation and further improvement.
The following tables consolidate quantitative performance data from recent field studies evaluating ICTs for Giardia and Cryptosporidium detection.
Table 1: Recent Field Evaluation Data for Cryptosporidium Detection via ICT
| Study Context & Reference Method | Sensitivity | Specificity | Key Findings & Comparative Performance |
|---|---|---|---|
| Human patients with diarrhea in Qatar (n=205); compared to multiplex PCR [11] | Not specified | Not specified | Detection rate of 15% (31/205), higher than microscopy (6%) but lower than PCR (18%) [11]. |
| Immunosuppressed patients with diarrhea in Türkiye (n=90); DFA as gold standard [23] | 66.7% | 97.8% | Positive in 4 of 7 samples identified by reference methods; useful for labs with intensive workflow [23]. |
| Canine and feline fecal samples (n=328); DFA as gold standard [8] | Not specified | Not specified | Reliability hampered by limited diagnostic sensitivities and high rates of false-positive results [8]. |
Table 2: Recent Field Evaluation Data for Giardia duodenalis Detection via ICT
| Study Context & Reference Method | Sensitivity | Specificity | Key Findings & Comparative Performance |
|---|---|---|---|
| Canine and feline fecal samples (n=328); DFA as gold standard [8] | Not specified | Not specified | Identified as a less reliable method compared to DFA and real-time PCR for accurate diagnosis [8]. |
| Multicenter study in Italy (n=368); compared to conventional techniques [75] | 100% | 99.2% | Performance data for a multiplex real-time PCR assay, highlighting the high accuracy of molecular methods [75]. |
Detailed Experimental Protocols
This section outlines the standard methodologies employed in the field evaluations cited, providing a reproducible framework for future studies.
Stool Sample Collection and Preparation
- Collection: Stool samples are collected from human or animal subjects presenting with gastrointestinal symptoms (e.g., diarrhea, abdominal pain) in sterile, leak-proof containers [11] [8].
- Transport and Storage: Samples should be transported to the laboratory within two hours of collection. If testing is delayed, storage at 4°C is recommended for short-term preservation (1-3 days). For longer storage, samples are typically frozen at -20°C or -80°C to preserve antigen integrity for later batch testing [11] [75].
- Pre-processing: For uniform testing, approximately 0.5 grams of formed stool (or 125 µL for liquid stool) is aliquoted for the ICT. The sample is often diluted in a manufacturer-provided assay buffer to create a homogeneous suspension [11].
Immunochromatographic Test Procedure
The following workflow details the standard steps for performing a rapid ICT. The accompanying diagram visualizes this process and the underlying immunological principle.
Title: ICT Workflow and Detection Principle
- Step 1 - Sample Application: Using a calibrated pipette or transfer device, apply the recommended volume of the prepared stool suspension (e.g., 100 µL) into the sample well (S) of the ICT cassette [11] [8].
- Step 2 - Buffer Addition: If required by the specific test kit, add the appropriate number of drops of the provided assay buffer into the same sample well.
- Step 3 - Incubation and Result Development: Allow the test device to rest on a flat, non-absorbent surface at room temperature. The liquid migrates via capillary action across the nitrocellulose membrane.
- Step 4 - Result Interpretation: Read the results strictly within the time window specified by the manufacturer (typically 10-30 minutes). The appearance of a colored control line (C) is mandatory to validate the test. A positive result for Giardia or Cryptosporidium is indicated by the appearance of the respective test line (T) in addition to the control line. The absence of a test line, with a visible control line, indicates a negative result [8] [23].
Comparative Reference Methods
Field evaluations typically benchmark ICT performance against one or more reference standard methods.
- Direct Immunofluorescence Assay (DFA): Considered by many laboratories as the gold standard due to its high sensitivity and specificity [8] [23].
- Procedure: A filtered stool sample is applied to a welled slide and stained with fluorescein isothiocyanate (FITC)-labeled monoclonal antibodies specific for Giardia cysts and Cryptosporidium oocysts. After incubation and washing, the slide is examined using a fluorescence microscope at 200-400x magnification. Apple-green fluorescent structures of the correct size and morphology are counted as positive [8].
- Nucleic Acid Amplification Tests (NAATs) - PCR:
- DNA Extraction: Commercial kits, such as the QIAamp DNA Stool Mini Kit, are used to extract genomic DNA from stool specimens, often with an initial mechanical lysis step to break open the hardy (oo)cyst walls [75] [23].
- Amplification: Multiplex real-time PCR is commonly employed. The Allplex GI-Parasite Assay, for example, is a one-step multiplex real-time PCR that detects Giardia, Cryptosporidium, and other protozoa simultaneously. Amplification is performed on a real-time PCR instrument, and results are interpreted using proprietary software with a cycle threshold (Ct) cutoff, typically <45 [75].
- Microscopy with Staining:
- Direct Microscopy: A small amount of stool is mixed with saline or iodine on a slide and examined under a microscope for cysts or oocysts [11].
- Concentration Techniques: Methods like formalin-ether acetate (FEA) sedimentation are used to concentrate parasites from larger stool samples, increasing detection sensitivity [11].
- Modified Acid-Fast Staining (MKS): Used primarily for Cryptosporidium, this stain differentially colors the oocysts red against a blue or green background, allowing for their visualization under oil immersion (1000x magnification) [11].
The Scientist's Toolkit: Key Research Reagent Solutions
The following table details essential materials and reagents used in the evaluation and application of ICTs for enteric protozoa.
Table 3: Essential Research Reagents and Materials
| Item | Function/Application in Research & Diagnostics |
|---|---|
| ICT Cassettes | Single-use, lateral flow devices pre-coated with antibodies for the rapid, qualitative detection of Giardia and/or Cryptosporidium antigens in fecal samples. Used for point-of-care testing and field evaluations [11] [8] [23]. |
| FITC-Labeled Monoclonal Antibodies | Fluorescent antibodies used in the DFA method, which is considered a gold standard. They bind specifically to surface antigens of Giardia cysts and Cryptosporidium oocysts, enabling their visualization and quantification under a fluorescence microscope [8]. |
| DNA Extraction Kits (e.g., QIAamp DNA Stool Mini Kit) | Designed to purify high-quality genomic DNA from complex stool matrices while removing PCR inhibitors. This is a critical first step for molecular confirmation and genotyping [75] [23]. |
| Multiplex Real-Time PCR Assays (e.g., Allplex GI-Parasite) | Commercial master mixes containing primers, probes, and enzymes for the simultaneous amplification and detection of multiple parasitic pathogens in a single reaction. Essential for high-throughput screening and obtaining high-specificity comparative data [75]. |
| Formalin and Ethyl Acetate | Key components for fecal concentration procedures (e.g., FEA technique). Formalin preserves parasite morphology, while ethyl acetate acts as a lipid solvent and extraction fluid to remove debris and concentrate parasites in the sediment [11]. |
| Modified Acid-Fast Stains (e.g., Kinyoun's) | A differential staining solution that causes Cryptosporidium oocysts to stain bright red, allowing for their differentiation from other fecal components under bright-field microscopy [11]. |
Recent field data confirm that immunochromatographic tests for Giardia and Cryptosporidium offer a rapid and practical diagnostic solution, particularly in resource-limited and high-throughput settings. Their performance is robust in contexts of high parasite burden, making them valuable for initial screening in outbreak scenarios. However, evaluations consistently show that their sensitivity can be lower than advanced molecular methods like PCR and the gold-standard DFA. Consequently, for definitive diagnosis, drug efficacy studies, and epidemiological surveillance requiring high specificity and sensitivity, ICTs are best utilized as part of an integrated diagnostic algorithm that includes confirmatory testing with DFA or NAATs.
Conclusion
Immunochromatographic tests provide a crucial, rapid, and user-friendly platform for detecting Giardia and Cryptosporidium, offering significant advantages in field adaptability and operational speed. However, their variable and sometimes suboptimal sensitivity, particularly for Cryptosporidium and in cases of low parasite burden, necessitates a clear understanding of their appropriate application. Current evidence supports their role best as a frontline screening tool in specific scenarios, with positive results often requiring no confirmation, but negative results in high-risk patients warranting further investigation with more sensitive methods like DFA or PCR. The future of ICT development lies in integrating advanced technologies such as isothermal amplification and CRISPR-Cas systems to create next-generation, highly sensitive and specific multiplex point-of-care devices. For researchers and developers, the priority should be on improving concentration methods, identifying novel high-abundance antigen targets, and creating fully integrated, equipment-free biosensors to truly revolutionize the diagnosis and surveillance of these parasitic infections.
References
- 1. Giardiasis - StatPearls - NCBI Bookshelf [https://www.ncbi.nlm.nih.gov/books/NBK513239/]
- 2. Global prevalence of Giardia infection in nonhuman ... [https://journals.plos.org/plosntds/article?id=10.1371/journal.pntd.0013021]
- 3. Giardiasis: Annual Summary of Reportable Diseases [https://www.health.state.mn.us/diseases/reportable/dcn/giardiasis.html]
- 4. Cryptosporidium (BI0111) [https://www.undrr.org/understanding-disaster-risk/terminology/hips/bi0111]
- 5. Cryptosporidiosis: A global threat to human and animal ... [https://pmc.ncbi.nlm.nih.gov/articles/PMC12613205/]
- 6. The Most Neglected NTD: Cryptosporidiosis [https://globalhealthnow.org/2025-01/most-neglected-ntd-cryptosporidiosis]
- 7. enhanced detection uncovers Cryptosporidium endemicity ... [https://pmc.ncbi.nlm.nih.gov/articles/PMC12291217/]
- 8. Direct immunofluorescence assay as the gold standard for ... [https://bmcvetres.biomedcentral.com/articles/10.1186/s12917-024-04297-0]
- 9. Commercial Assay for Detection of Giardia lamblia and ... [https://pmc.ncbi.nlm.nih.gov/articles/PMC149610/]
- 10. Evaluation of a Rapid Lateral Flow Point-of-Care Test for ... [https://pmc.ncbi.nlm.nih.gov/articles/PMC5062784/]
- 11. Comparison of four diagnostic techniques for Cryptosporidium ... [https://pmc.ncbi.nlm.nih.gov/articles/PMC12371275/]
- 12. A single-step immunochromatographic lateral-flow assay ... [https://pubmed.ncbi.nlm.nih.gov/19209762/]
- 13. Clinical Performance of Lateral Flow Assay for ... [https://www.mdpi.com/2227-9059/11/8/2140]
- 14. Cryptosporidium/Giardia Detection and Identification ... [https://www.rapidmicrobiology.com/test-method/cryptosporidium-and-giardia-detection-and-identification-methods-2]
- 15. Characterisation of alpha-1 giardin: an immunodominant ... [https://pubmed.ncbi.nlm.nih.gov/14527517/]
- 16. Immunodominant proteins α-1 giardin and ... - BMC Microbiology [https://bmcmicrobiol.biomedcentral.com/articles/10.1186/1471-2180-11-233]
- 17. β-Giardin as an Immunomagnetic Enrichment Target for ... [https://pmc.ncbi.nlm.nih.gov/articles/PMC12472542/]
- 18. Crypto-giardia-entamoeba rapid test - Operon [https://operondx.com/rapid-tests/crypto-giardia-entamoeba/]
- 19. Cryptosporidiosis Workup: Approach Considerations, Stool ... [https://emedicine.medscape.com/article/215490-workup]
- 20. Detection of Giardia lamblia and Cryptosporidium parvum ... [https://pmc.ncbi.nlm.nih.gov/articles/PMC86395/]
- 21. β-Giardin as an Immunomagnetic Enrichment Target for ... [https://www.mdpi.com/2076-0817/14/9/918]
- 22. Quantum-enhanced nanodiamond rapid test advances ... [https://pmc.ncbi.nlm.nih.gov/articles/PMC12491541/]
- 23. Investigation of the Frequency of Cryptosporidium spp. in ... [https://turkiyeparazitolderg.org/articles/investigation-of-the-frequency-of-lessemgreatercryptosporidiumlessemgreater-spp-in-immunosuppressed-patients-with-diarrhea/tpd.galenos.2025.88700]
- 24. Development of a Point-of-Care Immunochromatographic ... [https://pmc.ncbi.nlm.nih.gov/articles/PMC12300919/]
- 25. Detection of Giardia duodenalis assemblage A and B ... [https://www.sciencedirect.com/science/article/pii/S1198743X14654215]
- 26. Xpect™ Giardia/Cryptosporidium Test 20 Tests/Kit [https://www.thermofisher.com/order/catalog/product/R2450520]
- 27. ImmunoCard STAT EHEC [https://hardydiagnostics.com/751630]
- 28. RIDA®QUICK T-2 / HT-2 RQS ECO - Food & Feed Analysis [https://food.r-biopharm.com/products/ridaquick-t-2-ht-2-rqs/]
- 29. Quidel Triage® BNP Test [https://www.quidelortho.com/nl/en/products/triage-meter-pro/quidel-triage-bnp-test]
- 30. Use Alternative Testing Method for the Quidel Triage ... [https://www.fda.gov/medical-devices/letters-health-care-providers/use-alternative-testing-method-quidel-cardiovascular-inc-quidel-triage-cardiac-panel-letter-health]
- 31. RIDA®QUICK ADM Monitoring - Clinical Diagnostics [https://clinical.r-biopharm.com/products/ridaquick-adm-monitoring/]
- 32. Comparative analysis of commercial and “In-House ... [https://pmc.ncbi.nlm.nih.gov/articles/PMC12317615/]
- 33. Comparative Evaluation of Real-Time Screening PCR ... [https://www.mdpi.com/2076-2607/10/7/1310]
- 34. First detection and genotyping of Giardia intestinalis in stool ... [https://pmc.ncbi.nlm.nih.gov/articles/PMC5529491/]
- 35. Successful extraction and PCR amplification of Giardia ... [https://www.sciencedirect.com/science/article/abs/pii/S001448941830198X]
- 36. Comparison of four rapid diagnostic tests, ELISA ... [https://www.sciencedirect.com/science/article/abs/pii/S0167701215000305]
- 37. Comparison of Fecal Antigen Detection Using Enzyme ... [https://brieflands.com/journals/jjm/articles/18856]
- 38. Giardia lamblia Immunoassay: Systematic review and meta ... [https://www.sciencedirect.com/science/article/abs/pii/S0009898124020916]
- 39. Comparative Performance of Eight PCR Methods to Detect ... [https://www.mdpi.com/2076-0817/10/6/647]
- 40. Comparative analysis of commercial and “In-House ... [https://parasitesandvectors.biomedcentral.com/articles/10.1186/s13071-025-06879-9]
- 41. Multiplex PCR for gastrointestinal parasites in stool [https://www.sciencedirect.com/science/article/abs/pii/S0732889324003018]
- 42. Immunochromatographic Strip-Based Detection of ... [https://pmc.ncbi.nlm.nih.gov/articles/PMC85440/]
- 43. A Multiplex PCR Assay for Simultaneous Detection of ... [https://www.mdpi.com/2306-7381/11/9/448]
- 44. Development and validation of qPCR assay targeting ... [https://www.sciencedirect.com/science/article/abs/pii/S030440172500264X]
- 45. Internal Quality Controls in the Medical Laboratory [https://www.mdpi.com/2075-4418/14/19/2223]
- 46. Auditing Internal Quality Control Practices in a Large Size ... [https://www.ijmb.in/abstractArticleContentBrowse/IJMB/37826/JPJ/fullText]
- 47. 2025 IFCC Recommendations for IQC [https://www.westgard.com/essays/quality-requirements-and-standards/ifcc-iqc-2025.html]
- 48. Refining quality control strategies in highly automated ... [https://pmc.ncbi.nlm.nih.gov/articles/PMC12523598/]
- 49. Giardiasis: an update review on sensitivity and specificity of ... [https://www.sciencedirect.com/science/article/abs/pii/S016770121630224X]
- 50. Disentangling the effects of intermittent faecal shedding and ... [https://pmc.ncbi.nlm.nih.gov/articles/PMC11717355/]
- 51. Disentangling the effects of intermittent faecal shedding and ... [https://journals.plos.org/plosntds/article?id=10.1371/journal.pntd.0012719]
- 52. Comparative Analysis of RT-PCR and a Colloidal Gold ... [https://pmc.ncbi.nlm.nih.gov/articles/PMC12154499/]
- 53. Discrepant Analysis: How Can We Test a Test? - PMC [https://pmc.ncbi.nlm.nih.gov/articles/PMC86720/]
- 54. Evaluation of three immunochromatographic tests in ... [https://link.springer.com/article/10.1007/s10096-020-04040-1]
- 55. Bias in Discrepant Analysis: When Two Wrongs Don't Make ... [https://www.sciencedirect.com/science/article/abs/pii/S0895435697002643]
- 56. Evaluation of Three Commercial Assays for Detection ... [https://pmc.ncbi.nlm.nih.gov/articles/PMC149727/]
- 57. When laboratory tests can mislead even when they appear ... [https://pmc.ncbi.nlm.nih.gov/articles/PMC6297641/]
- 58. Evaluation of Five Membrane Filtration Methods for ... [https://pmc.ncbi.nlm.nih.gov/articles/PMC383118/]
- 59. EPA-MICRO: 1623: Cryptosporidium and giardia ... [https://www.nemi.gov/methods/method_summary/5616/]
- 60. Gold nanoparticle-based immunochromatographic assay ... [https://www.sciencedirect.com/science/article/pii/S2590157521000055]
- 61. Rapid pathogen detection by lateral-flow ... [https://pubmed.ncbi.nlm.nih.gov/25955290/]
- 62. Unleashing the power of colloidal gold ... [https://pmc.ncbi.nlm.nih.gov/articles/PMC10714363/]
- 63. Integration of a new generation of immunochromatographic ... [https://www.sciencedirect.com/science/article/abs/pii/S1748013224002597]
- 64. Artificial intelligence enhanced electrochemical ... [https://www.nature.com/articles/s41598-025-03930-8]
- 65. CDC - DPDx - Cryptosporidiosis [https://www.cdc.gov/dpdx/cryptosporidiosis/index.html]
- 66. Evaluation of seven commercial antigen detection tests for ... [https://www.sciencedirect.com/science/article/pii/S1198743X1464283X]
- 67. [Assessment of two commercially available immunochromatographic...] [https://pubmed.ncbi.nlm.nih.gov/21342732/]
- 68. Commercial assay for detection of Giardia lamblia and ... [https://pubmed.ncbi.nlm.nih.gov/12517850/]
- 69. , Sensitivity and comparison of three specificity ... commercially [https://www.elsevier.es/es-revista-brazilian-journal-microbiology-490-articulo-sensitivity-specificity-comparison-three-commercially-S1517838216309868]
- 70. (Open Access) Evaluation of a Novel Commercial Real-Time PCR... [https://scispace.com/papers/evaluation-of-a-novel-commercial-real-time-pcr-assay-for-the-36dyybnq]
- 71. Evaluation of ColorPAC Giardia/Cryptosporidium Rapid ... [https://pmc.ncbi.nlm.nih.gov/articles/PMC88578/]
- 72. Assessment of a commercially available multiplex real-time ... [https://www.sciencedirect.com/science/article/pii/S1944398624118632]
- 73. Assessment of Cryptosporidium spp. Sub-Families and ... [https://pmc.ncbi.nlm.nih.gov/articles/PMC12563063/]
- 74. Molecular Characterization of Giardia intestinalis and ... [https://pmc.ncbi.nlm.nih.gov/articles/PMC11033538/]
- 75. Evaluation of Allplex™ GI-Parasite Assay—A Multiplex Real ... [https://pmc.ncbi.nlm.nih.gov/articles/PMC12390207/]