Geometric vs. Linear Morphometrics: A Comparative Analysis of Discriminatory Power in Biomedical Research
This article provides a comprehensive comparison of geometric morphometrics (GMM) and linear morphometrics (LMM) for researchers and drug development professionals.
Geometric vs. Linear Morphometrics: A Comparative Analysis of Discriminatory Power in Biomedical Research
Abstract
This article provides a comprehensive comparison of geometric morphometrics (GMM) and linear morphometrics (LMM) for researchers and drug development professionals. It explores the foundational principles of both methods, examines their application across diverse fields from neuroimaging to cancer diagnostics, addresses common methodological challenges and optimization strategies, and presents empirical evidence comparing their discriminatory performance. By synthesizing findings from recent studies, this review serves as a practical guide for selecting appropriate morphometric approaches to maximize classification accuracy and biological insight in phenotypic profiling and biomarker discovery.
Foundational Principles: Understanding Geometric and Linear Morphometrics
Morphometrics, the quantitative analysis of biological form, relies fundamentally on three core data types for capturing morphological information: landmarks, semilandmarks, and linear measurements. These distinct approaches form the foundation for both traditional and modern shape analysis methodologies, each with unique strengths, limitations, and appropriate applications in biological research. Landmarks represent discrete, anatomically homologous points that can be precisely located across all specimens in a study [1]. In contrast, semilandmarks are utilized to quantify shapes along curves and surfaces where true anatomical homologues are scarce, sliding along tangents to minimize bending energy or Procrustes distance against a reference [1] [2]. Linear measurements, the basis of traditional morphometrics, consist of standardized distance measurements between landmarks or other anatomical points, providing readily interpretable size information but limited capacity to capture complex geometric shape [3] [4].
The ongoing methodological evolution in morphometrics reflects a transition from traditional linear measurement-based approaches toward geometric frameworks that preserve the spatial relationships of anatomical structures throughout analysis. This comparison guide examines the discriminatory performance, technical requirements, and appropriate applications of these three fundamental data types within the broader research context of geometric versus linear morphometrics, providing researchers with evidence-based guidance for methodological selection.
Conceptual Definitions and Technical Specifications
Landmarks: Homologous Points
Landmarks are defined as discrete, anatomically homologous points that can be precisely located and consistently identified across all specimens in a study. From a biological perspective, landmarks represent points that are considered equivalent in each individual at every stage of developmental or evolutionary transformation [1]. Technically, landmarks are represented as two-dimensional or three-dimensional coordinates that capture their spatial position. The primary strength of landmarks lies in their biological interpretability, as they represent genuinely comparable anatomical loci across specimens. However, their primary limitation is that many biological structures, particularly smooth surfaces such as cranial vaults, offer few identifiable landmarks, thus restricting the morphological information that can be captured [1].
Semilandmarks: Geometric Homology
Semilandmarks are points used to quantify shapes along curves and surfaces where identifiable anatomical landmarks are insufficient. They are located using algorithms that establish geometric correspondence rather than developmental homology [1]. The technical process involves three key steps: initial placement along curves or surfaces between true landmarks, sliding along tangents to minimize either bending energy or Procrustes distance against a reference form, and subsequent treatment as homologous points in statistical analyses [2]. This approach enables the quantification of entire morphological structures rather than isolated points, significantly increasing data density. However, this method introduces methodological dependencies, as results can vary based on the chosen sliding algorithm (bending energy versus Procrustes distance) and sampling density [1] [2].
Linear Measurements: Traditional Dimensions
Linear measurements constitute the foundation of traditional morphometrics, consisting of standardized distance measurements between landmarks or other anatomical points. Common examples include lengths, widths, and heights of morphological structures, typically measured using calipers or digital tools [3] [4]. These measurements provide immediately interpretable biological data with straightforward collection protocols. However, they reduce complex morphological structures to single dimensions, inevitably losing geometric information about the spatial arrangement of structures. While multiple measurements can be combined, they cannot fully reconstruct the original geometry, presenting fundamental limitations for comprehensive shape analysis [4].
Table 1: Core Conceptual Comparison of Morphometric Data Types
| Feature | Landmarks | Semilandmarks | Linear Measurements |
|---|---|---|---|
| Basis of Homology | Developmental/evolutionary equivalence | Geometric correspondence | Anatomical reference points |
| Data Structure | 2D/3D coordinates | 2D/3D coordinates (with sliding) | Scalar distances |
| Information Captured | Spatial position of discrete points | Curves and surfaces between landmarks | Size and proportions |
| Primary Limitation | Sparse on smooth surfaces | Algorithm-dependent placement | Loss of geometric relationships |
Performance Comparison: Discriminatory Power and Applications
Taxonomic Discrimination
Multiple empirical studies have directly compared the discriminatory power of geometric morphometric methods (utilizing landmarks and semilandmarks) against traditional linear morphometrics. In species complex resolution, geometric morphometrics often demonstrates superior capability to separate closely related taxa. Research on Sorex shrews revealed that while linear morphometrics achieved a Jackknifed classification rate exceeding 92%, geometric morphometrics provided enhanced visualization of shape differences and better separation of centroid sizes among species [3]. Similarly, a study on Taterillus gerbils found that geometric morphometrics of cranial morphology "quantitatively supported traditional species boundaries" despite moderate classification accuracy [5].
Fossil shark tooth identification studies demonstrate another compelling application, where geometric morphometrics successfully recovered the same taxonomic separation as traditional morphometrics while capturing additional shape variables that traditional methods overlooked [4]. This pattern of geometric methods extracting more comprehensive morphological information appears consistent across diverse taxonomic groups.
Measurement Error and Repeatability
The manual placement of landmarks introduces potential observer error and measurement bias, though semiautomated approaches are developing to address this limitation [6]. Semilandmark placement introduces additional methodological variability, as results can differ based on the chosen algorithm (bending energy versus Procrustes distance minimization) and density of points [1] [2]. Studies comparing sliding methods found that while statistical results (F-scores, p-values) were often similar, estimates of within- and between-sample variation differed, and correlation between principal component axes was low [2].
Linear measurements generally exhibit high repeatability with standard protocols but capture less morphological information. Emerging automated landmarking approaches aim to reduce observer error associated with manual placement, potentially increasing accuracy in shape approximation [6].
Allometric Analysis
A crucial consideration in taxonomic applications is distinguishing true shape differences from allometric variation (shape change correlated with size). Research suggests there is "substantial risk that discrimination comes from variation in size, rather than shape" when using geometric morphometrics [5]. This is particularly relevant when comparing taxa of different sizes, as allometric patterns can confound taxonomic distinctions. The Sorex study specifically tested for allometric growth, finding it was not observed in the skull and mandible variations among the species examined [3]. Linear measurements inherently confound size and shape information, while geometric approaches enable their separation through Procrustes superposition, though the risk of allometric confounding remains if not explicitly tested.
Table 2: Empirical Performance Comparison Across Study Systems
| Study System | Landmarks Performance | Semilandmarks Performance | Linear Measurements Performance |
|---|---|---|---|
| Sorex shrews [3] | N/A | Effective species separation; centroid size differentiation | 92%+ classification rate; measurement overlap between some species |
| Shark teeth [4] | Captured comprehensive shape variation | Enabled analysis of root curvature | Effective but missed some shape variables |
| Human facial skeleton [2] | Limited on smooth surfaces | Method-dependent results (BE vs. PD) | Traditional approach; limited geometric information |
| Modern human populations [2] | Limited by low variation | Sensitive to sliding algorithm with low variation | Established approach but less powerful for subtle differences |
Experimental Protocols and Methodologies
Standard Landmark and Semilandmark Protocol
A typical experimental workflow for geometric morphometric analysis involves several standardized steps. First, specimens are digitized using appropriate imaging technology (e.g., CT scanning, surface scanning, or photography). Next, homologous landmarks are manually identified and digitized on each specimen using software such as tpsDig [2] [4]. For semilandmark placement, curves and surfaces are defined between landmarks, and points are initially placed equidistantly along these contours. These points are then slid along tangents to minimize either bending energy or Procrustes distance against a reference specimen [1] [2]. Finally, all landmark and semilandmark coordinates undergo Generalized Procrustes Analysis (GPA) to remove differences in position, orientation, and scale, isolating pure shape variation for subsequent statistical analysis.
Linear Measurement Protocol
Traditional morphometric protocols begin with the identification of standardized measurement points on each specimen. Linear distances are then collected using digital calipers or measurement tools in imaging software. These raw measurements are typically log-transformed to normalize variance and allow for multivariate statistical analysis such as principal component analysis or discriminant function analysis [3] [4].
Methodological Comparisons
When comparing methodologies, researchers often apply multiple approaches to the same specimen set. For example, a study on Sorex shrews employed "morphological, linear and geometric morphometric analysis" on the same specimens to enable direct comparison of results [3]. Similarly, the shark tooth study applied both traditional and geometric morphometrics to the same teeth, allowing for "comparison with traditional morphometrics" and assessment of which approach "is more effective" [4]. Such comparative designs provide the most robust evidence for evaluating methodological performance.
Morphometrics Methodological Workflow
Research Reagent Solutions: Essential Materials and Tools
Table 3: Essential Research Tools for Morphometric Data Collection
| Tool Category | Specific Examples | Primary Function | Application Context |
|---|---|---|---|
| Imaging Equipment | CT scanners, surface scanners, digital cameras | Specimen digitization | All morphometric approaches |
| Digitization Software | tpsDig, MorphoJ, Landmark | Landmark/semilandmark placement | Geometric morphometrics |
| Measurement Tools | Digital calipers, ImageJ | Linear distance collection | Traditional morphometrics |
| Analysis Packages | PAST, R (geomorph, Morpho) | Statistical shape analysis | All approaches |
| Alignment Methods | Generalized Procrustes Analysis (GPA) | Remove non-shape variation | Geometric morphometrics |
| Sliding Algorithms | Minimum bending energy, Procrustes distance | Semilandmark optimization | Semilandmark approaches |
The comparative evidence indicates that geometric morphometric approaches utilizing landmarks and semilandmarks generally provide superior discriminatory power for taxonomic and morphological research compared to traditional linear measurements. This advantage derives from their capacity to capture and preserve geometric relationships throughout analysis, enabling more nuanced visualization and interpretation of shape differences. However, this enhanced capability comes with increased methodological complexity and sensitivity to analytical decisions, particularly regarding semilandmark placement algorithms and densities.
For researchers selecting among these approaches, geometric morphometrics is recommended when comprehensive shape analysis is prioritized, specimens possess adequate homologous landmarks, and resources permit the more complex analytical pipeline. Linear morphometrics remains appropriate for rapid assessment of major size differences, when methodological simplicity is advantageous, or for comparison with historical datasets. Semilandmarks provide essential tools for analyzing complex biological shapes but require transparent reporting of methodological parameters and recognition that their results represent approximations of biological reality. As the field advances toward increasingly automated approaches, the integration of these complementary data types will continue to enhance our understanding of morphological diversity and evolution.
In the fields of biological taxonomy, medical phenotyping, and industrial metrology, the accurate capture and analysis of shape data is paramount. Two fundamental paradigms dominate this data acquisition landscape: coordinate-based approaches and measurement-based approaches. Coordinate-based methods capture the precise spatial coordinates of morphological structures, often creating detailed digital models [7]. In contrast, measurement-based approaches traditionally rely on linear distances, angles, and ratios between defined points [8]. Within scientific research, particularly in studies comparing the discriminatory performance of geometric morphometrics (GMM - a coordinate-based technique) versus linear morphometrics (LMM - a measurement-based technique), understanding the strengths, limitations, and appropriate applications of these paradigms is crucial for robust experimental design and valid conclusions. This guide provides an objective comparison of these methodologies, supported by experimental data and detailed protocols.
Fundamental Concepts and Definitions
Coordinate-Based Approaches
Coordinate-based data acquisition involves recording the precise two-dimensional or three-dimensional spatial coordinates of points located on an organism's structure. In geometric morphometrics, these are typically captured as landmarks (anatomically homologous points), semi-landmarks (points along curves and surfaces), or outline points [7] [9]. The primary output is a configuration of points that retains the complete geometry of the structure throughout analysis. Modern implementations often use digital scanners, coordinate measuring machines (CMMs), or photographic techniques with calibration to capture this data [7] [10].
Measurement-Based Approaches
Measurement-based data acquisition, historically the foundation of morphometrics, involves collecting linear distances between landmarks, as well as angles and ratios derived from these measurements [8]. This approach produces a set of one-dimensional variables that describe size and shape characteristics but do not inherently preserve the complete geometric structure of the specimen. Traditional tools include calipers, but digital interfaces now allow for automated data collection from images or directly from instruments [11].
Table 1: Core Conceptual Differences Between the Two Paradigms
| Characteristic | Coordinate-Based Approaches | Measurement-Based Approaches |
|---|---|---|
| Primary Data | 2D/3D coordinate points | Linear distances, angles, ratios |
| Geometric Relationship | Preserved entirely | Partially lost |
| Statistical Framework | Multivariate shape space | Traditional multivariate statistics |
| Primary Analysis Methods | Procrustes analysis, PCA, CVA | Discriminant Analysis, PCA, CVA |
| Common Tools | Digital scanners, CMMs, calibrated photography | Calipers, rulers, protractors |
Methodological Comparison in Taxonomic Research
Experimental Evidence from Mammalian Taxonomy
A 2023 study by Viacava et al. directly compared the performance of 3D geometric morphometrics (coordinate-based) and four published linear measurement sets (measurement-based) in discriminating three clades of antechinus, a mammalian species complex known for subtle shape differences [8]. The researchers used linear discriminant analysis (LDA) to assess discriminatory performance under three conditions: raw data, data with isometry (overall size) removed, and data with allometry (non-uniform effects of size) removed.
Table 2: Performance Comparison in Taxonomic Discrimination (Based on Viacava et al., 2023 [8])
| Data Type | Analysis Method | Key Finding | Statistical Note |
|---|---|---|---|
| Linear Measurements (Raw) | Linear Discriminant Analysis | High group discrimination | Discrimination largely driven by size variation |
| Linear Measurements (Size-Removed) | Linear Discriminant Analysis | Reduced discriminatory power | Remaining shape differences less diagnostic |
| Geometric Morphometrics (Raw) | Principal Component Analysis | Moderate group discrimination | |
| Geometric Morphometrics (Size-Removed) | Linear Discriminant Analysis | Better group discrimination after isometry and allometry removal | Separation based on non-allometric shape differences |
The study revealed that while raw linear measurements showed high discriminatory power in initial analyses, this discrimination was primarily driven by variation in size rather than shape [8]. When the effects of size were statistically removed, the discriminatory performance of linear measurements decreased substantially. Conversely, geometric morphometrics provided better discrimination between groups after isolating non-allometric shape differences, suggesting it is more effective at detecting true shape variation independent of size.
Visualizing the Experimental Workflow
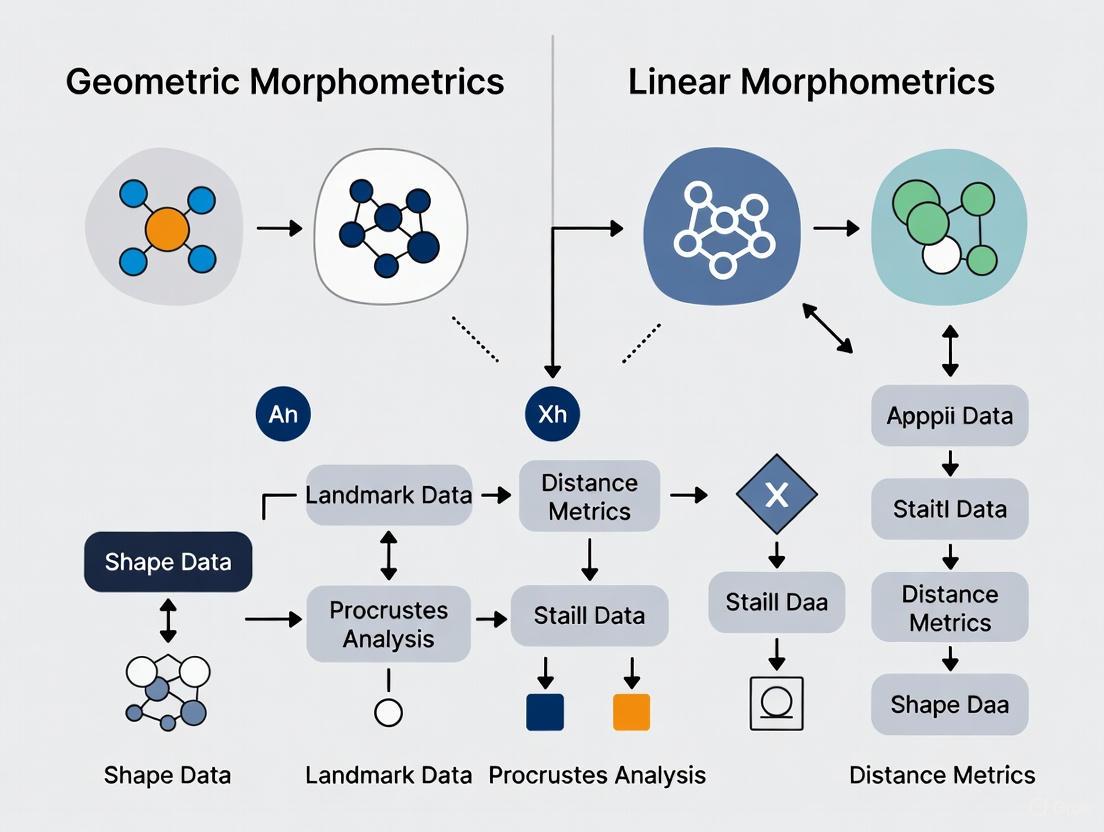
The following diagram illustrates the key methodological steps employed in comparative studies of geometric and linear morphometrics:
Technical Implementation Across Fields
Data Acquisition Techniques and Technologies
The implementation of coordinate-based and measurement-based approaches varies significantly across different research and application fields, each with distinct technical requirements and performance characteristics.
Table 3: Technical Implementation in Different Fields
| Field | Coordinate-Based Methods | Measurement-Based Methods |
|---|---|---|
| Biological Morphology | 3D surface scanners, micro-CT, laser scanning, photogrammetry, landmark digitization software (tpsDig, Landmark) [7] [11] | Digital calipers, ocular micrometers, standardized measurement protocols [8] |
| Medical Phenotyping | Intraoral laser rulers with digital cameras, calibrated photographic systems [10] | Traditional calipers, manual Mallampati scoring, visual assessment scales [10] |
| Industrial Metrology | Coordinate Measuring Machines (CMMs) with scanning probes, laser scanners, structured light systems [12] [13] | Handheld calipers, micrometers, height gauges, touch-trigger CMM probing [12] |
Performance Comparison in Industrial Metrology
A 2020 study comparing scanning (coordinate-based) and touch-trigger (measurement-based) probe systems on Coordinate Measuring Machines found no statistically significant differences in measurement uncertainty for basic geometric features [12]. However, the scanning method was significantly quicker for data acquisition, though it required relatively higher calibration time. This demonstrates the efficiency advantage of coordinate-based approaches for comprehensive surface characterization, while acknowledging contexts where discrete point measurement remains sufficient.
Experimental Protocols
Protocol for Comparative Taxonomic Studies
The following detailed protocol is adapted from Viacava et al. (2023) for conducting comparative studies of geometric and linear morphometrics:
Specimen Selection: Select specimens representing the groups to be discriminated (e.g., species, populations, age classes). Ensure adequate sample size considering the higher dimensionality of geometric morphometric data.
Data Collection:
- Coordinate-Based Data: Digitize 3D landmarks using standardized anatomical definitions. Use surface scanners or CT scanners for complete shape capture. For 2D studies, use standardized photographic views with scale calibration.
- Measurement-Based Data: Collect linear measurements using digital calipers or from digital images. Follow published measurement protocols specific to the taxonomic group.
Data Processing:
- Coordinate-Based Pipeline:
- Perform Generalized Procrustes Analysis to remove effects of position, orientation, and scale.
- Extract shape variables (Procrustes coordinates) for analysis.
- Optionally, apply semilandmark protocols for curves and surfaces.
- Measurement-Based Pipeline:
- Compile linear measurements into data matrix.
- Apply size correction if needed (e.g., Mosimann-style size correction).
- Coordinate-Based Pipeline:
Statistical Analysis:
- Conduct Principal Component Analysis (PCA) to visualize shape variation.
- Perform Linear Discriminant Analysis (LDA) to assess group discrimination.
- Use cross-validation to estimate classification rates and avoid overfitting.
- Compare performance using correct classification rates and discriminant function plots.
Protocol for Digital Morphometric Phenotyping
Based on the method described by Sutherland et al. (2017) for upper airway phenotyping:
Equipment Setup: Use a digital camera with an intraoral laser ruler that projects two parallel beams of known separation distance (e.g., 1.0 or 1.5 cm) for scale calibration [10].
Image Acquisition:
- Capture standardized photographs:
- P1: Front view with mouth open maximally, tongue within mouth, no phonation.
- P2: Front view with mouth open maximally, tongue extended maximally.
- P3: Side profile with mouth open, tongue extended.
- P4: Front view with mouth open, tongue depressed, no phonation.
- Capture standardized photographs:
Data Extraction:
- Use image analysis software to measure structures in pixels.
- Convert pixel measurements to physical units using the known laser distance as calibration reference.
- Extract quantitative measures: tongue width, length, area; mouth dimensions; uvula parameters.
Analysis:
- Compare measures between patient and control groups.
- Assess associations with clinical indices (e.g., AHI for sleep apnea).
- Determine discriminatory power using ROC analysis or similar methods.
The Scientist's Toolkit: Essential Research Reagents and Materials
Table 4: Essential Materials for Morphometric Research
| Item | Function | Application Context |
|---|---|---|
| Digital Calipers | Precise linear measurement collection | Measurement-based data acquisition [8] |
| tpsDig Software | Landmark and outline digitization from image files | Coordinate-based 2D data collection [11] |
| Coordinate Measuring Machine (CMM) | High-precision 3D coordinate acquisition | Industrial metrology and engineering [12] [13] |
| Laser Ruler Assembly | Projection of parallel beams for photographic calibration | Medical phenotyping and digital morphometrics [10] |
| Micro-CT Scanner | High-resolution 3D imaging without specimen destruction | Detailed internal morphology studies [7] |
| StereoMorph R Package | 2D and 3D landmark and curve data collection using consumer cameras | Low-cost coordinate-based data acquisition [11] |
| Geomorph R Package | Geometric morphometric analysis of landmark data | Statistical analysis of coordinate-based data [8] |
The comparative evidence indicates that coordinate-based and measurement-based approaches each have distinct advantages depending on research goals. Coordinate-based geometric morphometrics provides superior capability for analyzing complex shape differences independent of size, particularly valuable for discriminating cryptic species or quantifying subtle morphological changes [8]. Measurement-based linear morphometrics offers practical advantages in terms of equipment requirements and analytical simplicity, with strong performance when size variation contributes to group differences [8]. The choice between paradigms should be guided by research questions, sample availability, and equipment access, with the understanding that hybrid approaches often provide the most comprehensive morphological insights.
The analysis of biological form is a cornerstone of evolutionary biology, taxonomy, and various applied scientific fields. Within this domain, the concepts of size, shape, and their relationship—known as allometry—are fundamental. The study of allometry, which examines how organismal traits change with size, remains an essential concept for understanding evolution and development [14]. Historically, two primary schools of thought have shaped the methodological approaches to allometry: the Huxley–Jolicoeur school, which characterizes allometry as the covariation among morphological traits that all contain size information, and the Gould–Mosimann school, which defines allometry as the covariation between shape and size after their separation [14] [15]. This distinction is not merely academic; it underlies fundamental differences in how researchers quantify, analyze, and interpret morphological data.
The rise of geometric morphometrics (GMM) has revolutionized the analysis of shape by preserving geometric relationships throughout statistical analyses, in contrast to traditional linear morphometrics (LMM) based on sets of distance measurements [8] [3]. This guide provides a comprehensive comparison of these frameworks, their performance in discriminatory tasks, and their handling of allometry, supported by experimental data and detailed methodologies to inform research practices across biological and medical sciences.
Theoretical Foundations: Two Schools of Allometric Thought
The Gould-Mosimann School: Size-Shape Covariation
The Gould-Mosimann framework explicitly separates size and shape according to the criterion of geometric similarity [14] [15]. In this conceptualization, shape is defined as the morphological information that remains after accounting for differences in position, orientation, and scale. Allometry is then studied as the covariation between this purified shape variable and a measure of size, typically centroid size (the square root of the sum of squared distances of all landmarks from their centroid) [16].
Within geometric morphometrics, this concept is implemented operationally through the multivariate regression of shape variables on centroid size [14]. The regression coefficient vector indicates the direction of shape change associated with size increase, providing a multivariate representation of allometry. This approach directly tests the hypothesis that shape depends on size and allows for visualization of the predicted shape changes along the allometric vector.
The Huxley-Jolicoeur School: Covariation Among Traits
The Huxley-Jolicoeur school defines allometry as the covariation among morphological features that all contain size information, without necessarily separating size and shape into distinct components [14] [15]. This framework originated from the observation that pairwise plots of log-transformed measurements often fit straight lines, interpretable through constant ratios between relative growth rates of different parts [14].
In its multivariate generalization, allometric trajectories are characterized by the first principal component (PC1) of morphological variables, which represents the line of best fit to the data points [14]. In geometric morphometrics, this approach is implemented in analyses using either Procrustes form space or conformation space (also known as size-and-shape space), where position and orientation are standardized but size is retained [15].
Comparative Framework of Allometric Concepts
Table 1: Comparison of Allometric Frameworks in Morphometrics
| Aspect | Gould-Mosimann School | Huxley-Jolicoeur School |
|---|---|---|
| Conceptual Definition | Covariation between shape and size | Covariation among traits containing size information |
| Size-Shape Relationship | Explicitly separated | Integrated in form space |
| Primary Analytical Method | Multivariate regression of shape on size | First principal component in form space |
| Morphospace Used | Shape tangent space | Conformation space (size-and-shape space) |
| Size Measurement | External (e.g., centroid size) | Internal to the morphological space |
| Visualization | Shape change along size vector | Trajectory in multivariate morphospace |
| Biological Emphasis | Allometry as shape change correlated with size | Allometry as general size-related growth trajectory |
Methodological Implementation: Geometric vs. Linear Morphometrics
Geometric Morphometrics (GMM)
Geometric morphometrics is based on the statistical analysis of landmark coordinates, which capture the geometry of biological structures. The standard analytical workflow involves:
- Landmark Digitization: Capture of 2D or 3D coordinates of biologically homologous points
- Generalized Procrustes Analysis (GPA): Superimposition that removes differences in position, orientation, and scale
- Tangent Space Projection: Mapping to a linear space for multivariate statistics
- Allometric Analysis: Regression of Procrustes coordinates on centroid size [16] [15]
GMM provides several advantages: it preserves complete geometric information throughout analysis, allows visualization of shape changes, and separates shape variation from size variation [3]. The method is particularly powerful for capturing subtle morphological differences within species by analyzing landmarks on organismal structure [17].
Linear Morphometrics (LMM)
Traditional linear morphometrics relies on collections of distance measurements between landmarks. The standard workflow includes:
- Measurement Collection: Caliper-based or digital distance measurements
- Size Correction: Application of ratios, residuals, or Burnaby's method
- Multivariate Analysis: Principal components or discriminant analysis of measurement vectors
While LMM benefits from simpler data collection and analysis, it captures only a subset of morphological information and cannot fully reconstruct the geometry of forms [3]. As noted in shrew taxonomy studies, linear measurements often overlap across species, limiting discriminatory power [3].
Experimental Workflow for Morphometric Analysis
The following diagram illustrates a standardized workflow for comparative morphometric studies, integrating both geometric and linear approaches:
Performance Comparison: Discriminatory Power in Taxonomic Applications
Empirical Evidence from Mammalian Species Complexes
A comprehensive study comparing the taxonomic resolution of GMM and LMM in antechinus (a mammalian species complex) revealed critical insights into their relative performance [8]. The research assessed discrimination using raw data, data with isometry removed, and data after allometric correction across four published LMM protocols and a 3D GMM dataset.
Table 2: Performance Comparison in Taxonomic Discrimination of Antechinus Species Complex
| Method | Raw Data Discrimination | After Isometry Removal | After Allometric Correction | Risk of Size-Confounded Results |
|---|---|---|---|---|
| Linear Morphometrics (LMM) | High discrimination | Reduced discrimination | Further reduced discrimination | Substantial risk |
| Geometric Morphometrics (GMM) | Moderate discrimination | Improved discrimination | Best discrimination | Minimal risk with proper correction |
| Principal Findings | LMM showed high group discrimination with raw data | GMM discriminated groups better after isometry removal | GMM performed best after allometric correction | LMM discrimination primarily from size variation |
The study demonstrated that while LMM can be a powerful tool for taxonomic discrimination, there is substantial risk that this discrimination comes from variation in size rather than shape [8]. This finding has profound implications for taxonomic practice, suggesting that measurement protocols might benefit from GMM-based pilot studies to differentiate allometric and non-allometric shape differences before developing easier-to-apply LMM protocols.
Case Study: Anatolian Shrew Morphometrics
Research on Anatolian Sorex species (S. volnuchini, S. raddei, and S. satunini) provides additional comparative data [3]. The study employed morphological features (molar teeth), linear morphometrics, and geometric morphometrics to address taxonomic complexities arising from morphological similarity.
The linear morphometric analysis yielded a Jackknifed classification rate exceeding 92%, indicating strong discriminatory power [3]. However, geometric morphometrics provided additional insights through visualization of shape differences and explicit tests of allometry. The study found that allometric growth—shape change correlated with size—was not observed in the skull (ventral and dorsal) and mandible across these species [3]. This absence of allometry simplified taxonomic interpretation by eliminating size-related shape changes as a confounding factor.
Allometry Correction Methods: Performance and Applications
Comparison of Allometric Vector Estimation Methods
Computer simulation studies have compared the performance of four methods for estimating allometric vectors from landmark data [15]:
- Multivariate regression of shape on size
- First principal component (PC1) of shape
- PC1 in conformation space
- PC1 of Boas coordinates
Table 3: Performance Comparison of Allometric Vector Estimation Methods
| Method | Theoretical Framework | Performance with Isotropic Noise | Performance with Anisotropic Noise | Implementation Complexity |
|---|---|---|---|---|
| Regression of shape on size | Gould-Mosimann | Consistently better than PC1 of shape | Robust performance | Low (standard in most software) |
| PC1 of shape | Gould-Mosimann | Suboptimal compared to regression | Variable performance | Low |
| PC1 in conformation space | Huxley-Jolicoeur | Very close to simulated allometric vectors | Excellent performance | Moderate |
| PC1 of Boas coordinates | Huxley-Jolicoeur | Almost identical to conformation space | Excellent performance | High |
Simulations with no residual variation showed that all four methods are logically consistent with one another, with minor nonlinearities in the mapping between conformation space and shape tangent space [15]. When residual variation was added (either isotropic or with patterns independent of allometry), regression of shape on size performed consistently better than the PC1 of shape. The PC1s of conformation and Boas coordinates were nearly identical and very close to the simulated allometric vectors under all conditions [15].
Practical Implications for Allometry Correction
The choice of allometry correction method has significant implications for downstream analyses. In taxonomic studies, failure to properly account for allometry can lead to spurious group discrimination based on size differences rather than genuine shape differences [8]. The simulation results suggest that for studies firmly within the Gould-Mosimann paradigm, regression-based approaches provide robust allometric correction, while for approaches in the Huxley-Jolicoeur tradition, conformation space PC1 offers excellent performance [15].
Applications Across Biological Disciplines
Nutritional Assessment in Children
Geometric morphometrics has been applied to nutritional status classification in children aged 6-59 months using arm shape analysis from photographs [17]. The SAM Photo Diagnosis App Program aims to develop an offline smartphone tool for identifying nutritional status, demonstrating the translational potential of morphometric methods. This application faces the challenge of classifying new individuals not included in the original study sample, requiring specialized approaches for out-of-sample prediction in the shape space [17].
Forensic Analysis of Bitemarks
Morphometric analysis has been applied to dog bitemarks, assessing inter-canine distance and interdental incisor-canine distance for forensic identification [18] [19]. Studies found high agreement between dental measurements and skin lesions, particularly for inter-canine measurements across different arch types and skull classifications (mesocephalic, dolichocephalic, brachycephalic) [19]. This application demonstrates the practical utility of morphometric approaches in legal medicine.
Phylogenetic Reconstruction
The potential use of morphometric data in phylogenetic reconstruction represents an emerging application, though systematic reviews indicate that continuous morphometric data alone do not consistently improve phylogenetic resolution or accuracy compared to discrete morphological characters [6]. Challenges include widespread non-independence of landmarks due to functional or developmental correlation, which violates assumptions of standard trait evolution models [6].
Essential Research Tools and Reagents
Table 4: Research Toolkit for Morphometric Studies
| Tool/Reagent | Function/Purpose | Application Context |
|---|---|---|
| Digital Calipers | Precision linear measurements | Traditional LMM data collection |
| 3D Scanner | High-resolution surface capture | GMM landmark digitization |
| Geomorph R Package | Procrustes analysis and shape statistics | GMM data analysis [20] |
| tpsDig Software | 2D landmark digitization | GMM data collection |
| MorphoJ | Comprehensive morphometric analysis | Integrated GMM analysis |
| Standardized Imaging Setup | Controlled specimen photography | 2D GMM data collection |
| Specimen Stabilization Mount | Elimination of positional variance | Standardized data collection |
| Centroid Size Calculation | Standardized size measurement | Allometric analysis [15] |
The choice between geometric and linear morphometrics, and between different allometric frameworks, should be guided by research questions, sample characteristics, and analytical goals. Geometric morphometrics provides superior visualization, complete geometric information, and robust allometric correction when properly implemented. Linear morphometrics offers practical advantages in data collection and analysis simplicity but risks confounding size and shape differences.
For taxonomic discrimination, evidence suggests that GMM with appropriate allometric correction provides the most reliable separation of genuine shape differences from size variation [8] [3]. The Gould-Mosimann framework, implemented through multivariate regression of shape on size, offers a statistically robust approach for allometric studies, while the Huxley-Jolicoeur framework, implemented through PC1 in conformation space, provides an excellent alternative for analyses that treat size and shape as integrated features [14] [15].
Future methodological development should address challenges in out-of-sample classification [17], phylogenetic reconstruction [6], and standardization of allometry correction protocols across biological disciplines.
Morphometrics, the quantitative analysis of form, is a cornerstone of biological and medical research. For centuries, Linear Morphometrics (LMM)—the collection of point-to-point distance measurements—has been the standard tool for taxonomic and clinical studies, ranging from distinguishing between closely related rodent species to analyzing human cranial variations [21]. Its longevity is rooted in simplicity: measurements are easily acquired with basic tools and analyzed with straightforward statistics. However, this traditional approach carries significant limitations, primarily its limited capacity to capture holistic shape and its confounding of size and shape differences [21] [8]. In response, Geometric Morphometrics (GMM) has emerged as a modern standard, using the coordinates of anatomical landmarks to provide a comprehensive characterization of shape, explicitly separating it from size through Procrustes superimposition [21].
The choice between LMM and GMM is not merely a technicality; it fundamentally shapes the questions a researcher can ask and the answers they will find. This guide provides an objective comparison of their performance, underpinned by recent experimental data. The core thesis, supported by empirical findings, is that while LMM can effectively discriminate between groups, this power often stems from size variation. In contrast, GMM provides a more rigorous toolkit for isolating non-allometric shape differences, which are crucial for understanding true morphological divergence [21] [8]. This distinction is critical for researchers in fields like drug development, where precise phenotypic characterization in model organisms can inform mechanistic studies.
Performance Comparison: Experimental Data and Quantitative Findings
A 2023 study directly compared the discriminatory performance of four established LMM protocols against a 3D GMM dataset using three clades of antechinus, a mammalian species complex known for subtle shape differences [21] [8]. The research assessed the methods using raw data, data with isometry (overall size) removed, and data after allometric correction (non-uniform size effects removed).
Table 1: Comparative Performance of LMM and GMM in Taxonomic Discrimination
| Performance Metric | Linear Morphometrics (LMM) | Geometric Morphometrics (GMM) |
|---|---|---|
| Group Discrimination (Raw Data) | High [21] [8] | Effective [21] [8] |
| Group Discrimination (Size & Allometry Removed) | Performance drops significantly; discrimination often reliant on size [21] [8] | Maintains or improves discrimination; isolates non-allometric shape differences [21] [8] |
| Shape Characterization | Limited, based on isolated distances; may use non-homologous points (e.g., max/min dimensions) [21] | Holistic; retains geometric structure of landmarks [21] |
| Treatment of Size & Allometry | Difficult to separate; measurements often contain redundant size information [21] | Explicitly separates size (Centroid Size) and shape via Procrustes superimposition [21] |
| Data Acquisition | Low-cost, easy to acquire [21] | More complex; requires digitization and specialized software [21] |
| Visualization of Results | Limited to statistical plots (e.g., PCA score plots) [21] | Powerful visualization of shape change along axes (e.g., warp grids) [21] |
| Risk of Inflated Variance | Can inflate variance in first principal components [21] | Provides more balanced representation of shape variance [21] |
The key finding is that while LMM showed high group discrimination with raw data, its performance was substantially reliant on size variation. When size and allometry were statistically removed, GMM demonstrated superior ability to discriminate groups based on shape alone [21] [8]. This is critical because non-allometric shape variation is more likely to reflect independent adaptive processes and genuine species divergence rather than simple growth trajectories [21].
Methodologies: Protocols for a Direct Comparison
The experimental protocol from the 2023 antechinus study provides a framework for a rigorous comparison.
Experimental Workflow
The following diagram outlines the key steps for a comparative analysis of LMM and GMM, highlighting the parallel and divergent processes.
Detailed Methodological Steps
Specimen and Data Acquisition:
- LMM Protocol: Using digital calipers, collect a set of linear distances. These often include standard cranial measurements like skull length, width, and height, as defined by existing taxonomic literature [21].
- GMM Protocol: Using a 3D scanner or digitizer, capture the 3D coordinates of predefined anatomical landmarks (e.g., suture intersections, tips of processes) on the same specimens. These landmarks must be biologically homologous across all individuals [21].
Data Processing:
- LMM: The matrix of linear measurements is log-transformed to normalize data. Size correction may be attempted using ratios or residuals from a regression on a composite size variable, though these methods have known limitations [21].
- GMM: The landmark coordinates undergo a Generalized Procrustes Analysis (GPA). This procedure translates, rotates, and scales all specimens to a common unit size, minimizing the sum of squared distances between corresponding landmarks [21]. This produces two separate datasets:
- Shape Variables: The Procrustes-aligned coordinates, which represent pure shape.
- Centroid Size: A size variable calculated as the square root of the sum of squared distances of all landmarks from their centroid [21].
- Allometric Correction: For GMM, a multivariate regression of the shape variables on centroid size is performed. The residuals from this regression represent shape variation after removing the effects of allometry [21].
Data Analysis and Comparison:
- Both the processed LMM and GMM datasets (raw, size-corrected, and allometry-corrected) are analyzed using Principal Component Analysis (PCA) to visualize group separation.
- Linear Discriminant Analysis (LDA) is used to quantitatively assess the classification performance of each method and dataset for discriminating the known taxonomic groups [21] [8].
The Scientist's Toolkit: Essential Research Reagents and Materials
The following table details key solutions and tools required for conducting morphometric research.
Table 2: Essential Research Reagents and Materials for Morphometrics
| Item Name | Function/Brief Explanation |
|---|---|
| 3D Scanner / Microscribe | Device for capturing high-resolution 3D models or 3D coordinates of biological specimens for GMM. Replaces calipers for distance-based measurement [21]. |
| Digital Calipers | Tool for collecting traditional LMM measurements with high precision. Remains the standard instrument for linear-based protocols [21]. |
| Geometric Morphometrics Software (e.g., geomorph R package) | Specialized statistical software for performing Procrustes superimposition, shape visualization, and associated multivariate analyses [21]. |
| Statistical Software (e.g., R, PAST) | Platform for conducting standard multivariate analyses (PCA, LDA) on both LMM and GMM datasets and for general data manipulation [21]. |
| Anatomical Landmark Protocol | A predefined and justified set of biologically homologous points (e.g., suture intersections) to ensure consistency and repeatability in GMM data collection [21]. |
| Standard Linear Measurement Protocol | A published set of linear measurements (e.g., skull greatest length) specific to the taxon or structure under investigation for LMM [21]. |
Decision Framework: Choosing the Right Method for Your Research Question
The choice between LMM and GMM should be driven by the specific research question and logistical constraints. The following decision pathway synthesizes the experimental findings into a practical guide.
Interpretation of the Decision Workflow
- Choose LMM when: The research requires a low-cost, rapid method for initial screening or discrimination where the differences between groups are expected to be large and potentially correlated with size. It is also suitable when research must align directly with a vast body of historical literature built on linear measurements [21].
- Choose GMM when: The research question demands a rigorous separation of size and shape, such as in studies of cryptic species or complex morphological integration. It is the unequivocal choice when the goal is to identify and visualize subtle, non-allometric shape changes or to explore the relationship between shape and other variables (e.g., ecology, genetics) without the confounding effect of size [21] [8].
- Consider a Hybrid Approach: A powerful strategy is to use GMM for an initial pilot study. This can identify the specific anatomical regions that contribute most to shape variation. This knowledge can then inform the development of a targeted, efficient, and highly effective LMM protocol that avoids the pitfalls of redundant or non-homologous measurements, combining the statistical rigor of GMM with the practicality of LMM [21].
Both Geometric and Linear Morphometrics are powerful tools in the researcher's arsenal. The experimental evidence clearly shows that LMM's discriminatory power can be misleadingly inflated by size variation, while GMM provides a more robust framework for isolating true shape differences through its explicit treatment of allometry [21] [8]. The decision is not always binary. For exploratory taxonomy or functional morphology studies where shape is paramount, GMM is the superior choice. For large-scale, rapid screening where resources are limited and size differences are diagnostically relevant, LMM remains a valid and practical tool. Ultimately, the most informed research may leverage the strengths of both, using GMM to discover the true nature of morphological differences and LMM to apply that knowledge efficiently at scale.
Methodological Applications: From Neuroimaging to Drug Discovery
Tensor-Based Morphometry in Neurodegenerative Disease Tracking
In the study of neurodegenerative diseases, researchers rely on sensitive biomarkers to track the progression of pathological changes in the brain. Morphometry—the quantitative analysis of brain structure—has emerged as a critical tool for detecting subtle anatomical changes that occur during disease progression. Two principal approaches have dominated this field: linear morphometrics, which involves manual or semi-automated measurements of specific structures (e.g., hippocampal volume), and geometric morphometrics, which analyzes the complete shape and deformation patterns of brain structures. As a specialized form of geometric morphometry, Tensor-Based Morphometry (TBM) has gained prominence for its ability to provide detailed, voxel-level maps of tissue growth or atrophy by analyzing deformation fields derived from image registration [22] [23].
TBM functions by calculating the Jacobian determinant of deformation fields that map individual brain images to a common template. These Jacobian determinants represent local volume differences: values greater than 1 indicate local expansion, while values less than 1 indicate local contraction or atrophy. This approach offers significant advantages for neurodegenerative disease tracking, as it can detect diffuse atrophic patterns throughout the brain without requiring prior anatomical segmentation [24] [25]. The methodological robustness of TBM has been demonstrated across various neurodegenerative conditions, including Alzheimer's disease (AD), frontotemporal dementia (FTD), and Huntington's disease (HD), establishing it as a powerful tool for both clinical research and therapeutic trial monitoring [26] [25] [27].
Comparative Performance of TBM Methodologies
Field Strength Comparison: 3T vs. 1.5T MRI for TBM
Magnetic field strength represents a fundamental consideration in MRI-based tracking of neurodegeneration, affecting both image quality and statistical power. A comparative study investigating TBM for tracking Alzheimer's disease progression directly addressed this question by analyzing 110 subjects scanned longitudinally at both 3.0T and 1.5T field strengths. The cohort included 24 patients with Alzheimer's Disease, 51 individuals with mild cognitive impairment (MCI), and 35 healthy controls [26].
Table 1: Sample Size Requirements for Detecting 25% Slowing of Atrophy with 80% Power
| Patient Group | Field Strength | Subjects Required |
|---|---|---|
| Alzheimer's Disease | 1.5T | 37 |
| Alzheimer's Disease | 3.0T | 49 |
| Mild Cognitive Impairment | 1.5T | 108 |
| Mild Cognitive Impairment | 3.0T | 166 |
Surprisingly, the study found that 1.5T scans demonstrated slightly higher statistical power for detecting longitudinal change, although this advantage did not reach statistical significance. The atrophy measures derived at both field strengths showed strong correlations with clinical decline as measured by standard cognitive tests including the Alzheimer's Disease Assessment Scale-cognitive subscale (ADAS-cog), Mini-Mental State Examination (MMSE), and Clinical Dementia Rating sum-of-boxes (CDR-SB) [26]. This finding has important practical implications for clinical trial design, suggesting that 1.5T scanners—which are more widely available and cost-effective—remain viable for longitudinal TBM studies.
Registration Methodologies in TBM
The accuracy and sensitivity of TBM depend critically on the image registration algorithms used to compute deformation fields. A comprehensive comparison of registration methodologies examined multiple approaches, including viscous fluid registration, inverse-consistent linear elastic registration, and both symmetric and asymmetric unbiased registration techniques [22] [23].
Table 2: Performance Comparison of Registration Methods for TBM
| Registration Method | Reproducibility | Sensitivity to True Change | Resistance to Noise |
|---|---|---|---|
| Fluid Registration | Moderate | High | Low |
| Inverse-Consistent Linear Elastic | Moderate | Moderate | Moderate |
| Symmetric Unbiased | High | High | High |
| Asymmetric Unbiased | High | High | High |
The investigation revealed that unbiased registration methods (both symmetric and asymmetric) demonstrated superior performance characteristics. These methods produced symmetric log-Jacobian distributions with zero mean under the null hypothesis of no change, making them less likely to detect artifactual changes in the absence of true physiological change. This property is particularly valuable for longitudinal studies where minimizing false positive findings is crucial. The unbiased methods also showed higher reproducibility and more accurate measurement of biological deformations by explicitly penalizing bias in the resulting statistical maps [22] [23].
The foundational principle of unbiased registration involves coupling the computation of deformations with statistical analyses of the resulting Jacobian maps. The approach minimizes an energy functional that incorporates both image matching criteria (such as sum of squared differences or mutual information) and regularization terms based on the Kullback-Leibler divergence between probability density functions associated with the deformations [23]. This mathematical framework ensures that the deformation fields maintain intuitive axiomatic properties essential for reliable morphometric analysis.
Advanced TBM Techniques: Diffusion Tensor-Based Morphometry
While conventional TBM typically utilizes T1-weighted images, the relative homogeneity of white matter on these scans limits sensitivity to changes in specific pathways. To address this limitation, Diffusion Tensor-Based Morphometry (DTBM) has been developed, leveraging both scalar and directional information from diffusion tensor imaging [24].
In a study comparing T1W-TBM, FA-TBM (using fractional anisotropy), and DTBM in patients with hereditary spastic paraplegia type 11 (SPG11), DTBM demonstrated superior capability for detecting pathway-specific atrophy. While T1W-TBM showed diffuse white matter atrophy in SPG11 patients, DTBM revealed that atrophy predominantly affected several long-range pathways, providing more specific anatomical localization [24].
The DTBM methodology involves proper alignment of diffusion tensor images, which requires specialized registration approaches that account for tensor reorientation consistent with anatomical transformations. The resulting deformation fields capture volume changes with enhanced sensitivity to specific white matter pathways, making DTBM particularly valuable for disorders characterized by selective white matter degeneration [24].
Recent applications of DTBM have expanded to developmental studies, where it has revealed pathway-specific volumetric trajectories from infancy through young adulthood. Different white matter pathways exhibit distinct growth patterns, with the corticospinal tract showing protracted growth into young adulthood while corpus callosum growth is largely complete within the first three years of life [28]. These findings demonstrate DTBM's utility for investigating both developmental and degenerative processes affecting white matter architecture.
TBM in Action: Comparative Neurodegenerative Disease Studies
Differential Diagnosis: Frontotemporal Dementia vs. Alzheimer's Disease
The diagnostic differentiation between frontotemporal dementia (FTD) and Alzheimer's disease represents a clinically challenging scenario where TBM has demonstrated significant utility. A comprehensive study compared the effectiveness of hippocampal volumetry (HV), voxel-based morphometry (VBM), and TBM for distinguishing between these neurodegenerative conditions [25].
The investigation revealed distinctive patterns of brain atrophy in each disorder. FTD patients showed predominant atrophy in anterior brain regions, including the frontal lobes and anterior temporal lobes, often with right-side predominance. In contrast, AD patients exhibited more prominent atrophy in medial temporal lobe structures, including the hippocampus and entorhinal cortex, as well as posterior cingulate and parietal regions [25].
TBM proved particularly valuable for capturing the specific anatomical patterns characteristic of each disorder. The deformation patterns derived from TBM analysis aligned with known neuropathological differences between FTD and AD, providing a sensitive method for differential diagnosis. The whole-brain nature of TBM allowed for comprehensive assessment without requiring a priori hypotheses about specific affected regions, an advantage over region-of-interest approaches like hippocampal volumetry [25].
Enhanced Longitudinal Analysis: Two-Level Deformation-Based Morphometry
Recent methodological advances have further refined TBM approaches for longitudinal studies. A novel two-level deformation-based morphometry pipeline has been developed to enhance sensitivity for detecting within-subject changes over time [29].
This innovative approach involves two sequential registration stages. First, Jacobian determinants are calculated for each individual using within-subject registration to capture longitudinal changes. Subsequently, these Jacobian maps are transformed to an unbiased common space for group-level statistical analysis. This methodology minimizes registration bias that can occur when directly registering individual brains with substantial morphological differences to a common template [29].
Validation studies demonstrated that this two-level pipeline is 4.5 times more sensitive for detecting longitudinal within-subject volume changes compared to conventional one-level approaches. The method also more accurately captured the magnitude of induced volume changes in synthetic experiments and showed lower false positive rates in test-retest scenarios [29]. When applied to the OASIS-2 dataset, the enhanced pipeline better captured cortical volume changes associated with cognitive decline in dementia patients compared to healthy controls, confirming its utility for neurodegenerative disease tracking.
TBM-Based Classification: Tensor-Based Grading for Huntington's Disease
The principles of TBM have been extended to develop novel classification frameworks for neurodegenerative disorders. Tensor-based grading represents an innovative approach that combines patch-based analysis with deformation tensor metrics to model local patterns of anatomical changes [27].
In this methodology, deformation-based tensor fields are first computed from non-rigid image registration. Local similarity metrics are then calculated using a patch-based approach within a log-Euclidean framework. Finally, an elastic-net regularization model selects the most discriminative features for classification [27].
When applied to the classification of pre-manifest Huntington's disease patients and healthy controls, tensor-based grading achieved a classification accuracy of 87.5% ± 0.5%, substantially outperforming conventional patch-based grading methods (81.3% ± 0.6%). Furthermore, the tensor-based grading provided complementary information to putamen volume—a established imaging marker for Huntington's disease—suggesting potential for combined biomarker approaches [27].
Experimental Protocols for TBM Analysis
Standard TBM Processing Pipeline
A typical TBM analysis involves several sequential processing steps, each requiring specific methodological considerations:
Image Acquisition and Preprocessing: High-resolution 3D T1-weighted images are acquired using standardized protocols, such as the Alzheimer's Disease Neuroimaging Initiative (ADNI) protocol. Preprocessing typically includes geometric distortion correction, intensity non-uniformity correction, bias field correction, and spatial calibration based on phantom scans [22] [23].
Image Registration: Non-rigid registration is performed to align each subject's image to a common template. The choice of registration algorithm significantly impacts results, with unbiased methods generally preferred for their superior reproducibility and accuracy [22].
Jacobian Map Computation: The determinant of the Jacobian matrix is computed from the deformation field at each voxel, representing local volume differences between the subject and template.
Statistical Analysis: Jacobian maps are analyzed using general linear models to identify significant group differences or correlations with clinical variables. Multiple comparison correction is typically applied using false discovery rate or random field theory methods.
Essential Research Reagents and Tools
Table 3: Essential Research Tools for TBM Studies
| Tool Category | Specific Examples | Function in TBM Analysis |
|---|---|---|
| Image Processing Software | ANTs, SPM, FSL | Non-rigid image registration and Jacobian computation |
| Statistical Analysis Packages | R, MATLAB, Python with RMINC | Statistical modeling of Jacobian maps |
| Template Construction Tools | ANTs multivariate template construction | Creation of unbiased population templates |
| Quality Control Tools | MINC tools, ITK-SNAP | Visualization and quality assessment of registration results |
| DTI Processing Software | TORTOISE, DRTAMAS | Processing diffusion data for DTBM |
Visualizing TBM Workflows
Comprehensive TBM Analysis Pipeline
TBM Analysis Methodology Overview
The diagram illustrates the comprehensive workflow for TBM analysis, from image acquisition through final applications. The process begins with MRI acquisition, which can utilize either conventional T1-weighted imaging or diffusion tensor imaging (DTI). Following preprocessing to correct for various artifacts, unbiased non-rigid registration aligns images to a common template. The resulting deformation fields are used to compute Jacobian maps, which undergo statistical analysis to identify significant patterns of structural difference. The workflow highlights several methodological variations, including conventional TBM, diffusion tensor-based morphometry (DTBM), longitudinal analysis pipelines, and tensor-based grading approaches, each offering unique advantages for specific research applications.
Tensor-Based Morphometry represents a powerful methodology for tracking neurodegenerative disease progression, offering distinct advantages over both traditional linear morphometrics and other geometric morphometric approaches. The technique's sensitivity to distributed atrophic patterns, combined with its ability to provide detailed voxel-level maps of structural change, makes it particularly valuable for studying heterogeneous neurodegenerative conditions.
Key performance comparisons reveal several important considerations for researchers: (1) 1.5T and 3T scanners show comparable statistical power for longitudinal TBM studies, with 1.5T potentially offering slight advantages in statistical power despite lower signal-to-noise ratios; (2) Unbiased registration methods significantly improve reproducibility and reduce false positive findings compared to conventional registration approaches; (3) Advanced TBM variations, including DTBM and tensor-based grading, provide enhanced sensitivity for specific applications such as white matter pathway analysis and disease classification.
The integration of TBM into large-scale neurodegenerative disease studies like ADNI has established its validity as a biomarker for disease progression. Future methodological developments will likely focus on enhancing multi-modal integration, refining longitudinal analysis pipelines, and improving accessibility for clinical applications. As geometric morphometrics continues to evolve, TBM remains a cornerstone technique for quantifying and visualizing the structural consequences of neurodegenerative pathology.
Nuclear Mechano-Morphometric Biomarkers for Cancer Diagnosis
Comparative Performance of Morphometric Methodologies
The discriminatory power of a nuclear morphometric analysis is highly dependent on the chosen methodology. The table below summarizes the performance of geometric (non-linear, shape-based) and linear morphometric approaches in classifying cell status, based on experimental data from studies of normal and cancerous cell lines [30].
| Morphometric Approach | Cell Types / Conditions Compared | Key Discriminatory Features | Reported Classification Accuracy |
|---|---|---|---|
| Geometric (Deep Learning on full nucleus) | NIH/3T3 (mouse fibroblast) vs. BJ (human fibroblast) | Complex, non-linear texture and shape patterns | 96.1% (Validation) [30] |
| Geometric (Deep Learning on full nucleus) | BJ (normal human fibroblast) vs. MCF10A (fibrocystic breast) | Primarily shape features | 88.2% (Validation) [30] |
| Geometric (Deep Learning on full nucleus) | MCF7 vs. MCF10A vs. MDA-MB-231 (breast cancer lines) | Complex texture and shape patterns | 87.8% (Validation) [30] |
| Linear Morphometrics (Logistic Regression) | BJ (normal human fibroblast) vs. MCF10A (fibrocystic breast) | Pre-defined shape features | Slightly lower than deep learning approach [30] |
| Geometric (Deep Learning on nuclear patches) | BJ (normal human fibroblast) vs. MCF10A (fibrocystic breast) | Texture features at the scale of heterochromatin foci | 78.8% (Validation) [30] |
Experimental Protocols for Morphometric Analysis
Protocol: SCENMED Platform for Nuclear Morphometric Classification
The Single-Cell Nuclear Mechanical Diagnostics (SCENMED) platform combines fluorescence imaging and deep learning to discriminate between normal and cancer cells based on nuclear architecture [30].
- Cell Culture and Preparation: Seed cells (e.g., NIH/3T3, BJ, MCF10A, MCF7, MDA-MB-231) in glass-bottom dishes and allow them to grow overnight.
- Fixation and Staining: Fix and permeabilize the cells. Stain the nuclei with DAPI (4′,6-diamidino-2-phenylindole).
- Image Acquisition: Acquire several thousand wide-field images of the nucleus using a 60X objective.
- Image Processing and Segmentation: Employ a 4-step image processing procedure to identify individual nuclei, removing artifacts like overexposure, edge blur, and drift blur.
- Data Analysis and Classification:
- Geometric/Deep Learning Path: Classify the pre-processed nucleus images using a convolutional neural network (CNN) pipeline based on the VGG architecture.
- Linear Morphometrics Path: Extract pre-defined morphometric features (e.g., shape, texture) from each nucleus and use a supervised linear model (e.g., logistic regression) for classification.
Protocol: Chromatin Condensation Analysis via HC/EC Ratio
This protocol details the measurement of the heterochromatin-to-euchromatin (HC/EC) ratio, a quantitative metric for nuclear mechano-biology status [30].
- Image Acquisition: Follow steps 1-4 of the SCENMED protocol to obtain processed images of DAPI-stained nuclei.
- Intensity Thresholding: Calculate a threshold value to distinguish between heterochromatin (highly condensed, brighter DAPI staining) and euchromatin (less condensed, dimmer DAPI staining). The threshold is determined based on the image intensity distribution.
- Pixel Classification: Classify each pixel within the nucleus as belonging to either heterochromatin or euchromatin based on the calculated threshold.
- Ratio Calculation: Compute the HC/EC ratio by dividing the number of pixels classified as heterochromatin by the number of pixels classified as euchromatin for each nucleus.
Workflow and Conceptual Diagrams
SCENMED Experimental Workflow
Relationship: Morphometrics and Biomarkers
Research Reagent Solutions
The following table details key reagents and materials essential for conducting experiments in nuclear mechano-morphometric biomarker research.
| Research Reagent / Material | Function in Experiment |
|---|---|
| DAPI (4′,6-diamidino-2-phenylindole) | Fluorescent stain that binds strongly to A-T rich regions in DNA, used to visualize the nucleus and its internal chromatin structure for image analysis [30]. |
| Cell Lines (e.g., BJ, MCF10A, MDA-MB-231) | Provide biologically relevant in vitro models of normal human tissue and various cancer states (e.g., fibrocystic, metastatic) for comparative studies [30]. |
| VGG-based Convolutional Neural Network | A deep learning architecture adapted for image classification tasks, used to automatically identify complex, non-linear morphometric patterns from nuclear images [30]. |
| Procrustes Analysis Algorithms | A statistical method for geometric morphometrics that aligns, rotates, and scales landmark configurations to isolate shape variation from other nuisances like size and position [17]. |
| Liquid Biopsy Assays | Enable non-invasive sampling and analysis of circulating tumor cells (CTCs) or cell-free DNA (cfDNA), providing a source of material for molecular biomarker detection [31]. |
| High-Throughput Proteomics/Genomics Platforms | Technologies such as next-generation sequencing (NGS) and mass spectrometry that accelerate the discovery and validation of molecular biomarkers from various sample types [32] [31]. |
Geometric Morphometrics for GPCR Structure Classification in Pharmaceutical Research
G protein-coupled receptors (GPCRs) represent one of the most important drug target classes in pharmaceutical research, with over 30% of FDA-approved drugs acting through these receptors [33]. Despite their therapeutic importance, analyzing their dynamic, complex structures remains challenging due to their structural flexibility and the subtle nature of their conformational changes. Traditional methods for quantifying structural variations in GPCRs have relied on linear measurements, but these approaches often fail to capture the comprehensive three-dimensional nature of receptor activation and ligand-induced conformational changes.
Geometric morphometrics (GM) offers a powerful alternative for analyzing shape variation in three-dimensional space. This technique, borrowed from disciplines such as anthropology and paleontology, provides a mathematical framework for quantifying and comparing complex biological shapes [34]. When applied to GPCR structures, GM can discriminate between receptor states based on characteristics such as activation state, bound ligands, and the presence of fusion proteins, with the most significant results focused at the intracellular face where G protein coupling occurs [35].
This review examines the application of geometric morphometrics to GPCR structure classification within the broader context of morphometric performance research, specifically comparing its discriminatory power against traditional linear-based methods for pharmaceutical applications.
Geometric versus Linear Morphometrics: Theoretical Foundations and Performance Comparison
Fundamental Methodological Differences
Linear Morphometrics (LMM) traditionally relies on manually defined measurements between specific points, such as distances, angles, or ratios. In GPCR research, this might include measuring distances between specific Cα atoms across transmembrane helices or angles between helical axes. While straightforward to implement, LMM captures only a limited aspect of structural variation and may overlook subtle but functionally important shape changes.
Geometric Morphometrics (GM) utilizes Cartesian landmark coordinates common to all structures being compared. For GPCRs, this typically involves the XYZ coordinates of the alpha-carbon atoms at both ends of each transmembrane helix, effectively capturing the three-dimensional arrangement of the entire transmembrane bundle [35]. The core analytical process involves Procrustes superimposition to standardize and scale the data, followed by principal component analysis to identify patterns of shape variation [36].
Comparative Performance in Taxonomic Resolution
A critical 2023 study by Viacava et al. directly compared the performance of these methods for discriminating closely related species, with findings highly relevant to GPCR classification [8]. The research demonstrated that while raw LMM data showed apparently high discriminatory power in principal component analysis, this discrimination primarily reflected size variation rather than genuine shape differences. After removing isometric (overall size) and allometric (size-related shape) effects, GM provided superior discrimination of taxonomic groups based purely on shape characteristics.
Table 1: Performance Comparison of Morphometric Methods in Discrimination Tasks
| Performance Metric | Linear Morphometrics | Geometric Morphometrics |
|---|---|---|
| Shape Characterization | Partial, limited to predefined measurements | Holistic, captures complete 3D structure |
| Size/Shape Separation | Poor, often confounded | Excellent with proper statistical treatment |
| Allometry Assessment | Requires additional analyses | Integrated into analytical framework |
| Data Visualization | Limited 2D plots | Rich 3D shape deformation visualizations |
| Discriminatory Power | High for size-based differences, lower for pure shape | Superior for shape-based classification after size correction |
| Technical Barrier | Low | Moderate to high |
The implications for GPCR research are significant: while LMM might quickly identify gross structural differences, GM provides more biologically meaningful discrimination of subtle conformational states that may be critical for understanding drug mechanism of action.
Application to GPCR Structures: Experimental Evidence
Proof of Concept: Wiseman et al. (2021) Study
The pioneering application of GM to GPCR structures was demonstrated by Wiseman et al. in 2021, establishing this methodology as a novel approach for membrane protein analysis [34]. Their research implemented a comprehensive workflow from structure selection through statistical analysis, specifically designed to classify GPCRs based on structural characteristics.
Table 2: Key Findings from GM Application to GPCR Structures [35] [36]
| Structural Characteristic | GM Discrimination Result | Localization of Maximum Variation |
|---|---|---|
| Activation State | Successful classification of active vs. inactive states | Intracellular face |
| Bound Ligand Type | Significant differentiation between ligand classes | Intracellular face for family B receptors |
| Fusion Proteins | Strong discrimination with fusion protein present | Intracellular face |
| Thermostabilizing Mutations | No significant differences detected | Not applicable |
| Receptor Family | Successful classification across GPCR families | Both extracellular and intracellular faces |
The experimental protocol began with acquiring GPCR structures from the GPCRdb database and cross-referencing with the mpstruc database. Researchers identified the first and last residues of each transmembrane helix using the GPCRdb numbering system, then extracted XYZ coordinates for the Cα atoms at these positions using Swiss-PdbViewer software. This created a set of 28 landmarks (7 helices × 2 ends × 2 coordinates) for each receptor structure [36].
Statistical analysis proceeded using MorphoJ and PAST software, with Procrustes superimposition to align structures followed by principal component analysis. The resulting principal component scores underwent rigorous statistical testing using both PERMANOVA and ANOSIM to verify the significance of observed groupings [36].
Visualizing the Workflow: From Structures to Statistical Classification
GM Workflow: From GPCR structures to statistical classification
Experimental Protocols for GM in GPCR Research
Landmark Selection and Coordinate Extraction
The foundation of reliable GM analysis lies in appropriate landmark selection. For GPCR structures, the recommended protocol involves:
- Structure Acquisition: Download structures from GPCRdb or PDB, ensuring consistent resolution and completeness criteria.
- Transmembrane Definition: Identify TM helix boundaries using GPCRdb numbering system or structural alignment.
- Landmark Specification: Extract XYZ coordinates for Cα atoms at the first and last residue of each TM helix (14 landmarks total for extracellular and intracellular faces).
- Data Validation: Verify coordinate completeness and check for structural anomalies that might skew analysis.
Statistical Analysis Pipeline
The analytical workflow implements sophisticated multivariate statistics:
- Procrustes Superimposition: Normalize structures to remove positional, rotational, and size differences while preserving shape information.
- Principal Component Analysis: Reduce dimensionality while preserving maximum shape variance, typically resulting in 5-10 meaningful principal components.
- Hypothesis Testing: Apply PERMANOVA (Permutational Multivariate Analysis of Variance) to test for significant shape differences between predefined groups.
- Cluster Validation: Use ANOSIM (Analysis of Similarity) to verify the strength of group separation relative to within-group variation.
Performance Visualization: GM vs. LMM Discrimination Power
Discrimination Pathways: GM enables pure shape-based classification
Table 3: Research Reagent Solutions for GPCR Geometric Morphometrics
| Resource | Function | Application in GPCR GM |
|---|---|---|
| GPCRdb | Comprehensive GPCR structure database | Primary source of curated GPCR structures and classification data [37] |
| MorphoJ | Geometric morphometrics software | Statistical analysis of landmark data, Procrustes superimposition, PCA [36] |
| Swiss-PdbViewer | Molecular visualization | Structure analysis, landmark identification, coordinate extraction [36] |
| PAST Software | Paleontological statistics | Additional multivariate statistical analysis and validation [36] |
| AlphaFold Models | Predicted protein structures | Expanding structural coverage beyond experimentally solved receptors [37] |
| FoldSeek | Structure similarity search | Rapid comparison of new structures against existing database [37] |
Geometric morphometrics represents a significant advancement over linear methods for GPCR structure classification, particularly when the research question involves subtle conformational changes related to activation state, ligand binding, or transducer coupling. The technique's ability to holistically capture three-dimensional shape variations provides pharmaceutical researchers with a powerful tool for understanding structure-function relationships in this important drug target class.
While the methodological complexity of GM is higher than traditional approaches, its implementation is justified when analyzing complex conformational ensembles or when attempting to classify receptors based on subtle structural features that may be missed by linear measurements. As structural coverage of GPCRs continues to expand through experimental methods and AI-based prediction tools like AlphaFold [37], the application of geometric morphometrics is poised to become an increasingly valuable component of the structural pharmacologist's toolkit, particularly for sense-checking newly resolved structures and planning experimental design in targeted drug development programs [35].
Nutritional Status Assessment Through Arm Shape Analysis
The accurate classification of nutritional status, particularly for screening severe acute malnutrition (SAM) in children, is a critical public health challenge, especially in resource-limited settings. Traditional methods rely heavily on linear morphometrics (LMM), such as Mid-Upper Arm Circumference (MUAC) and Weight-for-Height Z-scores (WHZ). This guide objectively compares the performance of these established LMM techniques with an emerging alternative: landmark-based Geometric Morphometrics (GMM) for arm shape analysis. The comparison is framed within a broader research thesis investigating the discriminatory performance of GMM versus LMM, highlighting how the former captures complex shape information that linear measurements may overlook [38].
Methodological Comparison: LMM vs. GMM
Fundamental Differences in Data Capture and Analysis
The core difference between these approaches lies in how they quantify morphological variation.
- Linear Morphometrics (LMM) relies on traditional, one-dimensional measurements such as lengths, widths, circumferences, and their ratios. In nutritional assessment, key LMM proxies include MUAC and WHZ [17]. While simple to acquire, these measurements are often highly correlated and do not preserve the geometric relationships between anatomical points, potentially missing critical shape-based information relevant to health status [39].
- Geometric Morphometrics (GMM) uses the Cartesian coordinates of anatomical landmarks to analyze the complete shape of a structure. The method explicitly accounts for, and separates, variations due to position, orientation, and size through a process called Generalized Procrustes Analysis (GPA). This allows for the study of "pure shape" and its visualization [17] [39]. In arm shape analysis, landmarks and semi-landmarks are placed on 2D images of the arm to capture its outline and internal contours [17].
Table 1: Conceptual and Methodological Comparison between LMM and GMM.
| Feature | Linear Morphometrics (LMM) | Geometric Morphometrics (GMM) |
|---|---|---|
| Data Type | Distances, circumferences, ratios (1D) | Landmark coordinates (2D or 3D) |
| Primary Variables | MUAC, WHZ [17] | Procrustes-aligned shape coordinates [17] |
| Spatial Information | Not preserved; measurements are isolated | Preserved in full; geometry is maintained |
| Size vs. Shape | Often conflated, requiring explicit correction | Mathematically separated via GPA [39] |
| Key Advantage | Simplicity, speed, low-cost equipment | High-dimensional detail, visualization capability |
Experimental Protocol for GMM-based Nutritional Assessment
The following workflow is adapted from a recent study on classifying children's nutritional status using arm shape, which serves as the primary experiment for this comparison [17].
Sample Collection:
- Imaging: A photograph is taken of the child's left arm under standardized conditions.
- Participants: The study involved 410 Senegalese children (6-59 months), with equal representation of Severe Acute Malnutrition (SAM) and Optimal Nutritional Condition (ONC) groups, balanced for age and sex [17].
- Gold-Standard Classification: Nutritional status (SAM vs. ONC) was determined using traditional anthropometry (MUAC and WHZ) prior to shape analysis [17].
Landmarking and Preprocessing:
- Landmark Digitization: Anatomical landmarks and semi-landmarks are manually or automatically placed on the arm image to capture its shape. Semi-landmarks are used to quantify curves between traditional landmarks [17] [39].
- Generalized Procrustes Analysis (GPA): All landmark configurations are superimposed by scaling them to a unit centroid size, and then translating and rotating them to minimize the sum of squared distances between corresponding landmarks. This step removes non-shape variation [17].
Statistical Analysis and Classification:
- Shape Variable Extraction: The resulting Procrustes shape coordinates are used as variables for subsequent analysis.
- Classifier Training: A linear discriminant analysis (LDA) classifier is trained on the shape coordinates from the reference sample to distinguish between SAM and ONC children. The model is validated using leave-one-out cross-validation [17].
- Out-of-Sample Application: For new individuals, their raw landmark coordinates are registered to a template from the training sample before being projected into the existing discriminant space for classification, enabling use in smartphone applications [17].
The following diagram illustrates this experimental and analytical workflow.
Performance Comparison: Experimental Data
Quantitative Discriminatory Performance
The primary metric for comparison is the ability of each method to correctly classify individuals into SAM and ONC categories. Research indicates that while LMM is effective, GMM provides a more nuanced tool by capturing shape differences that may be imperceptible to linear measurements.
Table 2: Comparative Performance of LMM and GMM in Taxonomic and Morphological Studies.
| Study & Organism | Linear Morphometrics (LMM) Performance | Geometric Morphometrics (GMM) Performance | Key Finding |
|---|---|---|---|
| Mammalian Species Complex (Antechinus) [38] | Effective group discrimination with raw data, but risk of confusion between size and shape variation. | Superior group discrimination after removal of isometry and allometry, isolating pure shape differences. | GMM differentiates allometric vs. non-allometric shape changes, reducing misclassification. |
| Social Vole Skulls (Microtus) [40] | Linear methods (DFA, MANOVA) failed to distinguish between some morphologically similar species (e.g., M. dogramacii, M. schidlovskii). | 3D GMM showed a high level of correct classification and significant shape differences between all species, including cryptic ones. | GMM achieved taxonomic resolution where LMM could not, highlighting its sensitivity. |
| Child Arm Shape (SAM vs. ONC) [17] | MUAC and WHZ used as standard for defining groups. Provides a single-dimensional threshold. | LDA on Procrustes coordinates from arm shape successfully classified nutritional status, validated with leave-one-out cross-validation. | GMM provides a multivariate shape-based model for classification, capturing information beyond circumference. |
Addressing Allometry: A Key Advantage of GMM
A critical issue in morphological classification is allometry—how shape changes with size. Studies show that LMM can inadvertently discriminate groups based on size differences alone, which may not be the target of the classification [5] [38]. For example, in a mammalian species complex, LMM showed high discriminatory power with raw data, but this was substantially driven by size variation. When allometric effects were accounted for, GMM provided a more reliable discrimination based on true shape differences [38]. This is particularly relevant in nutritional studies where the goal is to identify pathological shape changes independent of, or correlated with, overall body size.
The Scientist's Toolkit: Essential Reagents and Materials
Table 3: Key Research Reagent Solutions for GMM-based Arm Shape Analysis.
| Item | Function in Research | Application Note |
|---|---|---|
| Standardized Digital Camera | Captures high-resolution 2D images of the arm for analysis. | Enables consistent image quality for landmark digitization; often integrated into a custom smartphone app [17]. |
| Landmark Digitization Software | Software for placing anatomical landmarks and semi-landmarks on digital images. | Examples include TPS series or MorphoJ. Critical for converting images into quantitative shape data [17] [39]. |
| Geometric Morphometrics Software Suite | Performs core GMM analyses (GPA, PCA, DA). | Tools like R (geomorph, Morpho), EVAN Toolbox, or PAST are used for statistical shape analysis and classifier training [17]. |
| Anthropometric Toolkit | Provides gold-standard nutritional status classification. | Includes calibrated scales, height/length boards, and MUAC tapes to define the training groups (SAM vs. ONC) for the model [17]. |
| Smartphone Application Framework | Deploys the trained model for field use. | Allows for offline capture of new arm images, automated landmarking, and application of the classification rule to new individuals [17]. |
The experimental data and protocols summarized in this guide demonstrate a clear trade-off between traditional and geometric morphometrics for nutritional assessment. Linear Morphometrics (MUAC, WHZ) offers an established, simple, and rapid field tool. However, Geometric Morphometrics provides a more powerful and nuanced analytical framework by capturing the complete shape of the arm. Evidence from multiple biological fields shows that GMM can achieve superior discriminatory performance by isolating true shape variation from size-related allometry [38]. For the specific application of screening child malnutrition, GMM-based arm shape analysis has been successfully validated, offering a promising digital health tool that can enhance the accuracy and reliability of nutritional status classification in diverse populations [17].
Image-Based Profiling in High-Content Screening for Drug Discovery
Image-based profiling is a maturing strategy in high-content screening (HCS) that reduces the rich information in biological images to multidimensional profiles, which are collections of quantitative features extracted from cellular images [41]. This approach enables the characterization of small-molecule effects based on phenotypic changes within cell populations, generating valuable datasets for drug discovery applications [42]. Unlike traditional screening methods that focus on predefined molecular targets or pathways, image-based profiling operates in a more unbiased manner, capturing a wide spectrum of morphological features that can reveal unanticipated biological activity [41]. The technology has evolved significantly with advances in automated microscopy, image processing, and computational analysis, particularly with the integration of machine learning methods that better leverage the biological information contained in images [43] [41].
The fundamental premise of image-based profiling lies in its ability to quantify subtle morphological changes in cells following genetic or chemical perturbations. This capability makes it particularly valuable for various drug discovery applications, including target-agnostic screening, predicting a compound's mechanism of action (MOA), understanding disease mechanisms, and assessing drug toxicity [41]. As the field has progressed, key methodological questions have emerged regarding optimal approaches for data acquisition and analysis, including the comparative performance of different profiling methods and morphometric techniques [44].
Comparative Analysis of Profiling Methods and Their Performance
Experimental Protocols for Method Comparison
To objectively evaluate the performance of different image-based profiling methods, researchers have conducted systematic comparisons using standardized experimental frameworks. One seminal study applied various profiling methods to a widely applicable assay of cultured cells and measured the ability of each method to predict the mechanism of action (MOA) for a compendium of drugs [44]. The experimental design involved treating cells with small molecules of known MOA, followed by image acquisition using high-content screening systems.
The methodological comparison included several computational approaches for generating image-based profiles. These ranged from simple methods based on population means to more complex techniques designed to leverage single-cell measurements [44]. In parallel, studies have compared morphometric approaches, specifically evaluating geometric morphometrics (GMM) against traditional linear-based methods (LMM) for taxonomic resolution in mammalian species complexes, providing insights applicable to cellular morphological analysis [8]. The experimental protocol for such comparisons typically involves multiple stages: (1) sample preparation and image acquisition, (2) image processing and feature extraction, (3) data normalization and dimensionality reduction, and (4) performance evaluation using ground-truth datasets [44] [8].
For the cell-based studies, the ground-truth set consisted of compounds with well-established mechanisms of action, enabling quantitative assessment of each method's predictive accuracy [44]. Performance was measured by the percentage of treatments for which the method correctly predicted the MOA, providing a standardized metric for comparison across methodologies.
Quantitative Comparison of Profiling Methods
The comparative analysis of image-based profiling methods yielded surprising results regarding their predictive performance for mechanism of action. A key finding was that a very simple method based on population means performed as well as more complex methods designed to take advantage of individual cell measurements, despite many treatments inducing heterogeneous phenotypic responses across cell populations [44]. However, another relatively simple method that performs factor analysis on cellular measurements before averaging them provided substantial improvement, correctly predicting MOA for 94% of treatments in the ground-truth set [44].
Table 1: Performance Comparison of Image-Based Profiling Methods for MOA Prediction
| Profiling Method | Key Characteristics | Prediction Accuracy | Complexity Level |
|---|---|---|---|
| Population Means Method | Averages features across cell populations | Moderate | Low |
| Single-Cell Methods | Analyzes individual cell measurements | Moderate | High |
| Factor Analysis + Averaging | Reduces dimensionality before population averaging | 94% | Moderate |
Further insights come from comparisons of morphometric approaches. Studies evaluating geometric morphometrics (GMM) versus linear-based methods (LMM) revealed important performance differences in discrimination tasks [8]. When visualizing principal component analysis (PCA) plots, researchers found that group discrimination among raw data was high for LMM, but these datasets may inflate PC variance accounted for in the first two principal components relative to GMM [8]. More significantly, GMM discriminated groups better after isometry (overall size) and allometry (nonuniform effects of size) were removed in both PCA and linear discriminant analysis (LDA).
Table 2: Performance Comparison of Geometric vs. Linear Morphometrics
| Morphometric Approach | Discrimination with Raw Data | Discrimination after Size Removal | Allometry Correction |
|---|---|---|---|
| Linear Morphometrics (LMM) | High group discrimination | Reduced performance | Limited capability |
| Geometric Morphometrics (GMM) | Moderate group discrimination | Improved discrimination | Comprehensive correction |
The research demonstrated that while LMM can powerfully discriminate taxonomic groups, there is substantial risk that this discrimination comes from variation in size rather than shape [8]. This finding has significant implications for image-based profiling in drug discovery, where capturing genuine shape changes independent of size effects may provide more biologically relevant insights into compound mechanisms.
Advanced Methodologies: From Fixed to Live-Cell Imaging
Fixed-Cell Profiling Protocols
Traditional image-based profiling has relied heavily on fixed-cell imaging approaches, with the Cell Painting assay emerging as a standard unbiased method [41]. This protocol uses six inexpensive dyes to stain eight cell organelles and components, which are imaged in five channels that each capture fluorescent light of a particular wavelength [41]. The assay captures several thousand morphological metrics for each imaged cell, providing a comprehensive profile of cellular state. The standardized nature of Cell Painting has enabled the generation of publicly available image-based profiling data, facilitating method development and comparison [41].
The experimental workflow for fixed-cell profiling typically involves: (1) cell culture and treatment with perturbagens, (2) fixation and staining with fluorescent dyes, (3) automated image acquisition using high-content microscopes, (4) image processing and segmentation to identify cellular compartments, (5) feature extraction to quantify morphological properties, and (6) data analysis and pattern recognition [42] [41]. Fixed-cell approaches offer practical advantages including ease of handling, compatibility with batch processing, and signal stability, but they can introduce artifacts and eliminate the possibility of capturing dynamic cellular processes [45].
Live-Cell Imaging Protocols
Recent advances have expanded image-based profiling to live cells, enabling the study of dynamic biological processes and real-time cellular responses. The Live Cell Painting (LCP) protocol presents a cost-effective and scalable method for live-cell high-content analysis using acridine orange (AO), a metachromatic fluorescent dye that highlights cellular organization by staining nucleic acids and acidic compartments [45]. This assay provides visualization of distinct subcellular structures, including nuclei and cytoplasmic organelles, using a two-channel fluorescence readout while preserving cell viability and enabling dynamic measurements.
The experimental protocol for Live Cell Painting involves: (1) seeding cells in imaging-compatible multi-well plates, (2) optimal cell growth conditions until approximately 80% confluency, (3) staining with AO working solution optimized for specific cell lines, (4) live-cell image acquisition using fluorescence microscopes with environmental control, and (5) computational analysis of the resulting images [45]. Key advantages of this approach include the ability to detect subtle, sublethal phenotypic changes and to perform kinetic analyses of cellular responses, overcoming limitations of fixation assays in toxicology and drug discovery [45].
The Scientist's Toolkit: Essential Research Reagents and Materials
Successful implementation of image-based profiling requires specific reagents, equipment, and computational tools. The following table summarizes key solutions used in live-cell imaging protocols, based on established methodologies [45].
Table 3: Essential Research Reagent Solutions for Live-Cell Image-Based Profiling
| Category | Specific Product/Model | Function/Application |
|---|---|---|
| Cell Lines | MCF-7 (ATCC HTB-22TM) | Human breast cancer cell line for phenotypic screening |
| Fluorescent Dyes | Acridine Orange (AO) | Metachromatic dye staining nucleic acids and acidic compartments |
| Cell Culture Media | RPMI-1640 with FBS and PenStrep | Cell growth and maintenance medium |
| Imaging Plates | 96-well black μClear plates | Optimal optical properties for high-content imaging |
| Microscope Systems | Cytation 5 with environmental control | Automated image acquisition with live-cell compatibility |
| Image Analysis Software | CellProfiler, CellProfiler Analyst | Open-source platform for image processing and analysis |
| Data Analysis Tools | Python with scikit-learn, pandas | Computational analysis of morphological profiles |
Beyond these core reagents, specialized equipment is essential for quality image acquisition. This includes fluorescence microscopes equipped for live-cell imaging with temperature- and CO2-controlled incubation chambers, appropriate filter sets for different fluorescent probes, and computational workstations with sufficient processing power for analyzing large image datasets [45]. For fixed-cell approaches using methods like Cell Painting, additional staining reagents including various fluorescent dyes and antibodies are required to comprehensively label cellular structures [41].
Computational Advances in Image-Based Profiling
Machine Learning and Deep Learning Approaches
The field of image-based profiling has been fundamentally transformed by advances in machine learning, particularly deep learning approaches [43]. Convolutional neural networks (CNNs) have demonstrated remarkable capability in discriminating between normal and cancer cell lines based on nuclear morphological features alone [30]. These approaches can achieve high classification accuracy - for example, distinguishing between normal human fibroblast cells (BJ) and fibrocystic breast cancer cells (MCF10A) with 88.2% validation accuracy [30].
The application of deep learning to image-based profiling follows two primary approaches: end-to-end learning directly from images, and feature-based learning using extracted morphometric measurements [30]. End-to-end learning with CNNs has the advantage of automatically learning relevant features from raw images, while feature-based approaches using traditional machine learning models (such as logistic regression, support vector machines, or random forests) operate on predefined morphometric features, offering greater interpretability [30]. Recent studies have shown that machine learning models can be trained to predict the outcomes of hundreds of assays from existing high-content images, illustrating how machine learning can leverage side information to enhance drug discovery [41].
Data Analysis Workflows and Challenges
The computational workflow for image-based profiling typically involves multiple stages, from raw image processing to final phenotypic classification. A critical challenge in this domain is the analysis of complex, multidimensional datasets generated by high-content screens [42]. Studies have compared various multivariate data analysis strategies, evaluating approaches for dimensionality reduction and methods for summarizing cell populations [46].
A key finding from methodological comparisons is that dimension reduction typically leads to a lower degree of discrimination between control samples, suggesting that some biological information may be lost in the process [46]. However, a high degree of classification accuracy can be achieved when cell populations are summarized on the well level using percentile values [46]. This highlights the importance of developing optimized data analysis pipelines that balance computational efficiency with biological information retention.
Despite these advances, the field continues to face substantial challenges in developing methods for emerging temporal and 3D data modalities, establishing robust quality control standards and workflows, and interpreting the processed features [43]. The growth of public benchmarks and open-source software ecosystems has been a key driver for fostering reproducibility and collaboration, helping to address some of these challenges [43].
Image-based profiling has established itself as a powerful technology in high-content screening for drug discovery, enabling comprehensive characterization of compound effects through quantitative analysis of cellular morphology. The comparative analysis of profiling methods reveals that both simple and complex approaches have distinct advantages, with factor analysis combined with population averaging demonstrating particularly high accuracy for mechanism of action prediction [44]. The ongoing methodological evolution from linear to geometric morphometrics addresses critical limitations in discriminating genuine shape changes from size variations, enhancing the biological relevance of profiling data [8].
The field continues to advance through innovations in both experimental protocols and computational分析方法. The transition from fixed-cell to live-cell imaging approaches expands analytical capabilities to dynamic biological processes, while machine learning and deep learning technologies increasingly enable more sophisticated analysis of complex morphological patterns [45] [30]. As these methodologies mature, image-based profiling is poised to play an increasingly central role in accelerating drug discovery and enhancing our understanding of cellular responses to chemical and genetic perturbations.
Troubleshooting and Optimization: Overcoming Methodological Limitations
In morphological research, allometric bias presents a fundamental challenge for accurate species discrimination and phenotypic analysis. Allometry refers to shape changes disproportionate to size that occur as organisms grow, where genetically similar individuals may differ morphologically simply because they differ in size [21]. This bias is particularly problematic in taxonomic and pharmaceutical research, where precise discrimination between groups is essential. When allometric variation is misinterpreted as taxonomic differentiation, it can lead to flawed taxonomic decisions and compromised research outcomes [21].
The morphometrics field employs two principal methodological approaches with distinct capacities for addressing allometric bias: traditional linear morphometrics (LMM) and geometric morphometrics (GMM). LMM relies on point-to-point linear measurements, capturing distances but containing limited information about overall shape. In contrast, GMM uses coordinate data from anatomical reference points, enabling holistic shape characterization and explicit separation of size and shape components [21]. Understanding their differential performance in managing allometric effects is crucial for researchers selecting appropriate methodologies for discrimination tasks in biological and pharmaceutical research.
Methodological Approaches: Fundamental Technical Differences
Linear Morphometrics (LMM)
Traditional LMM employs caliper-based or digital linear measurements between defined anatomical points. Typical measurements include lengths, widths, heights, and circumferences, often converted into ratios for analysis. This approach has dominated taxonomic research for centuries due to its straightforward data collection and minimal equipment requirements [47].
However, LMM presents significant analytical limitations: high measurement redundancy as multiple linear measurements often share overlapping components; dominance of size information in datasets; inability to capture complex geometric relationships; and reliance on proportions that become problematic when species display intraspecific allometry [21]. Perhaps most critically, LMM protocols frequently consist of "nested measurements" where linear dimensions contain other linear measurements within them, resulting in redundant and dominant size information that creates false impressions of shape differentiation [21].
Geometric Morphometrics (GMM)
GMM represents an advanced methodology that uses Cartesian coordinates of anatomically homologous points (landmarks) to capture the geometry of biological structures. Through Procrustes superimposition, GMM isolates pure shape information by scaling all specimens to unit size, rotating and translating configurations to optimize landmark correspondence [21] [48]. This process generates two distinct components: centroid size (a proxy for overall size) and multivariate shape coordinates [21].
This explicit separation of size and shape provides GMM with distinct advantages for allometry research: preservation of geometric relationships among landmarks; capacity to visualize shape changes graphically; ability to statistically test allometric patterns via shape-size regression; and elimination of autocorrelation problems plaguing traditional measurements [21] [48]. The methodological workflow typically involves digitizing landmarks, Procrustes alignment, multivariate statistical analysis, and graphical visualization of results.
Comparative Performance Analysis: Experimental Evidence
Discrimination Accuracy with Allometric Correction
Experimental studies directly comparing LMM and GMM reveal crucial performance differences in handling allometric variation. Research on antechinus skulls demonstrated that while raw LMM data showed high group discrimination, this differentiation primarily reflected size differences rather than genuine shape variation [21]. After removing isometric and allometric effects, LMM's discriminatory power substantially decreased, while GMM maintained better group discrimination even after allometric correction [21].
Table 1: Comparative Discrimination Performance of LMM vs. GMM
| Methodological Aspect | Linear Morphometrics (LMM) | Geometric Morphometrics (GMM) |
|---|---|---|
| Raw data discrimination | High group discrimination | Moderate group discrimination |
| Post-allometric correction performance | Significant decrease in discrimination | Maintains better discrimination |
| Size information handling | Size dominates datasets, creating false differentiation | Explicit size removal via Procrustes scaling |
| Allometric pattern detection | Limited capacity | Specialized tools (e.g., shape-size regression) |
| Visualization capabilities | Limited to comparing measurements | Detailed deformation grids and shape models |
Case Study: Sinibotia Fish Species Discrimination
A comprehensive study of Sinibotia fish species provides compelling empirical evidence of methodological performance differences. Researchers applied both MM and GM to five morphologically similar Sinibotia species, finding that both methods effectively distinguished species but with complementary strengths [47]. MM quantified linear size differences more effectively, while GM better captured and visualized complex variations in overall shape [47].
The morphological variations were primarily reflected in snout length, nasal snout distance, head depth, body depth, caudal fin length, and dorsal fin length. The combined application of both approaches provided the most comprehensive understanding of morphological differentiation, suggesting an integrated methodology may be optimal for complex discrimination tasks [47].
Table 2: Experimental Results from Sinibotia Fish Morphometrics
| Species | Sample Size | Standard Length Range (mm) | Key Diagnostic Morphological Traits | Methodological Effectiveness |
|---|---|---|---|---|
| S. superciliaris | 30 | 76.95-81.33 | Snout length, head depth | Both methods effective |
| S. reevesae | 30 | 89.38-95.39 | Snout length, head depth | Both methods effective |
| S. robusta | 32 | 69.06-74.49 | Body depth, caudal fin length | Contrasted with S. pulchra and S. zebra |
| S. pulchra | 30 | 73.04-77.28 | Body depth, dorsal fin length | Distinguished by both methods |
| S. zebra | 28 | 66.34-70.57 | Multiple shape aspects | Distinguished by both methods |
Machine Learning Integration with Morphometric Data
Advanced analytical approaches combining morphometrics with machine learning algorithms demonstrate promising pathways for improving discrimination accuracy. Research on Eocene radiolarians compared Linear Discriminant Analysis (LDA) applied to traditional morphometric data against neural network approaches (CNN and SNN) using image data [49]. LDA achieved 73.5% classification accuracy but struggled with intermediate forms, while neural networks reached up to 92% accuracy in identifying morphospecies [49].
Similarly, carnivore agency identification research found computer vision approaches significantly outperformed GMM, with deep learning models achieving 81% classification accuracy compared to GMM's <40% in bidimensional applications [50]. These results suggest that integrating modern computational approaches with morphometric data may overcome limitations of traditional statistical methods, particularly for complex classification tasks involving allometric variation.
Experimental Protocols and Methodologies
Standardized GMM Workflow for Allometric Analysis
The following experimental protocol represents a standardized approach for geometric morphometric analysis with allometric correction:
Landmark Digitization: Anatomically homologous landmarks are digitized on 2D or 3D specimen representations. Landmark selection should reflect biologically meaningful locations (suture intersections, maximum curvature points, etc.) [21] [48].
Procrustes Superimposition: Landmark configurations are scaled to unit centroid size, translated to a common position, and rotated to optimize alignment through Generalized Procrustes Analysis (GPA). This removes non-shape variation while preserving geometric relationships [21].
Allometric Analysis: Procrustes-aligned coordinates are regressed against centroid size to quantify allometric patterns. The regression residuals represent size-corrected shape variables [21].
Multivariate Statistical Analysis: Size-corrected shape coordinates undergo multivariate analysis (PCA, CVA, DFA) to examine group discrimination and morphological patterns [47].
Visualization and Interpretation: Shape changes associated with discrimination are visualized through deformation grids, wireframes, or surface models [21].
Diagram 1: GMM Allometric Analysis Workflow. This workflow illustrates the systematic separation of size and shape components in geometric morphometrics.
Protocol for Comparative LMM-GMM Studies
Research comparing LMM and GMM performance should incorporate these methodological elements:
Parallel Data Collection: Collect both traditional linear measurements and landmark coordinates from the same specimens [47].
Allometric Correction Phases: Analyze data in three phases: (1) raw measurements, (2) with isometry removed, and (3) with allometry removed [21].
Discrimination Validation: Use cross-validation or test on out-of-sample individuals to assess real-world classification performance [17] [49].
Methodological Integration: Explore complementary applications, such as deriving optimized linear measurements from GMM results for field-deployable identification tools [21].
The Scientist's Toolkit: Essential Research Reagent Solutions
Table 3: Essential Materials and Tools for Morphometrics Research
| Research Tool | Function/Purpose | Specification Considerations |
|---|---|---|
| Digital Calipers | Traditional linear measurements | Electronic, 0.01mm resolution, data export capability |
| Standardized Imaging Setup | 2D landmark digitization | Fixed focal length, scale reference, uniform lighting |
| 3D Scanner/Stereoscope | 3D landmark digitization | Resolution <0.1mm, color texture capture |
| Landmark Digitization Software | Coordinate data collection | TPSDig2, MorphoJ, or integrated solutions |
| Statistical Analysis Platform | Multivariate morphometrics | R with geomorph/morpho packages, PAST, MATLAB |
| Geometric Morphometrics Software | Shape analysis and visualization | MorphoJ, EVAN, Viewbox, Landmark |
| Reference Specimens | Methodological validation | Voucher specimens with documented provenance |
Discussion and Research Implications
The empirical evidence demonstrates that GMM provides superior analytical capacity for addressing allometric bias compared to traditional LMM approaches. By explicitly separating size and shape components, GMM enables researchers to distinguish genuine taxonomic differences from allometrically-induced morphological variation [21]. This has profound implications for taxonomic research, species discrimination, and morphological studies in pharmaceutical development.
The complementary strengths of both methods suggest that integrated approaches may offer optimal solutions [47]. GMM can identify biologically informative shape variations that then inform the development of targeted linear measurement protocols for field applications [21]. This hybrid methodology combines the statistical rigor of GMM with the practical deployability of LMM.
Future methodological developments will likely focus on three-dimensional GMM, machine learning integration, and automated landmarking approaches [49] [50]. As these technologies mature, they will further enhance researchers' ability to address allometric bias and improve discrimination accuracy in morphological research.
For research requiring precise morphological discrimination with minimal allometric bias, geometric morphometrics represents the methodologically superior approach, though practical considerations may warrant integrated methodologies that leverage the complementary strengths of both LMM and GMM.
Out-of-Sample Classification Challenges in Real-World Applications
In the field of morphometrics, the true test of any classification model lies not in its performance on the data used to build it, but in its ability to generalize to new, unseen individuals—a challenge known as out-of-sample classification. While extensive research has compared the discriminatory performance of geometric morphometrics (GMM) versus linear morphometrics, the practical implementation of these models on data not included in the original training set presents unique methodological hurdles that remain poorly addressed in standard literature [17]. This challenge is particularly acute in geometric morphometrics, where standard processing pipelines require sample-dependent transformations—such as Generalized Procrustes Analysis (GPA)—that utilize information from the entire dataset, making it unclear how to properly register and classify new individuals without conducting a new global alignment [17].
The out-of-sample problem represents a critical bottleneck in translating morphometric research into practical tools for drug development, archaeological analysis, and ecological monitoring. As researchers increasingly seek to deploy classification models in real-world scenarios, understanding and addressing these challenges becomes paramount for ensuring reliable, reproducible results that can inform scientific decision-making and product development.
Methodological Foundations: Geometric vs. Linear Morphometrics
Fundamental Approaches to Shape Analysis
Morphometric analysis encompasses two primary methodologies for quantifying biological form, each with distinct approaches to handling shape variation:
Geometric Morphometrics (GMM): This approach captures the geometric configuration of forms using landmark coordinates that document homologous points across specimens. GMM utilizes Procrustes superposition to remove differences in position, orientation, and scale, followed by statistical analysis of the aligned coordinates in tangent space [51]. The strength of GMM lies in its ability to visualize shape changes and directly analyze the geometry of biological forms, though it requires careful consideration of landmark homology and sliding semilandmarks for complex curves.
Linear Morphometrics: Often termed "traditional morphometrics," this approach relies on measured distances, angles, ratios, and counts between defined points [51] [52]. While potentially losing some geometric information, linear measurements often provide more intuitive variables that can be directly related to functional or ecological hypotheses. The method benefits from simpler statistical treatment and more straightforward interpretation for non-specialists.
Comparative Performance in Species Discrimination
Multiple studies have directly compared the discriminatory power of geometric and linear morphometric approaches across various biological contexts:
Table 1: Comparative Performance of Geometric vs. Linear Morphometrics
| Study Context | Geometric Morphometrics Performance | Linear Morphometrics Performance | Key Findings |
|---|---|---|---|
| Tabulate coral species discrimination [51] | More effective discrimination; Relative warp analysis and thin-plate spline deformation grids particularly useful for characterizing corallite shape | Less effective discrimination; Limited ability to capture complex shape variations | GMM proved more powerful in distinguishing species based on corallite shape |
| Mammalian species complex resolution [5] | Substantial risk of discrimination coming from size variation rather than shape alone | More straightforward size correction | GMM beneficial for differentiating allometric and non-allometric shape differences |
| Plant systematics using Gaussian Mixture Models [52] | Not specifically tested | Effective when combined with modern statistical frameworks like Gaussian Mixture Models for species circumscription | Linear morphometrics remains valuable when paired with rigorous statistical analysis |
The evidence suggests that geometric morphometrics generally offers superior discriminatory power for capturing complex shape variations, though this advantage comes with increased methodological complexity, particularly for out-of-sample classification.
The Out-of-Sample Challenge in Real-World Applications
Core Methodological Problems
The application of trained classification models to new individuals presents several fundamental challenges, particularly for geometric morphometrics:
Alignment Dependency: In GMM, classifiers are typically constructed from aligned coordinates (e.g., Procrustes coordinates) derived using information from the entire sample. There is no standard technique for registering a new individual into the shape space of a training sample without conducting a new global alignment that would incorporate the new specimen [17].
Template Selection: For out-of-sample registration, a template configuration from the study sample must be selected as a target for registration of the new individual's raw coordinates. The choice of template can significantly impact classification results, with different templates potentially yielding different outcomes for the same specimen [17].
Data Processing Pipeline: A series of sample-dependent processing steps, such as Procrustes alignment or allometric regression, must be applied consistently before classification rules can be applied to new specimens, creating complex preprocessing requirements for practical implementation [17].
Domain-Specific Manifestations
These methodological challenges manifest differently across various scientific domains:
Table 2: Out-of-Sample Challenges Across Disciplines
| Application Domain | Specific Out-of-Sample Challenge | Practical Consequences |
|---|---|---|
| Nutritional assessment of children [17] | Need to classify new children's arm shapes without including them in original sample | Requirement to develop registration methods for new individuals to existing shape space |
| Archaeological seed classification [53] | Generalizing classification models to new archaeological specimens | Potential performance degradation when applying models to specimens from different contexts |
| Marine species monitoring [54] | Distribution shifts between training and test data (e.g., different ROI sizes) | Models trained on certain image characteristics may perform poorly on new data with different properties |
| Ancient salmonid vertebrae identification [55] | Validating morphology-based classifications against ancient DNA | Need for independent validation methods when ground truth is unavailable |
Experimental Approaches and Comparative Performance
Emerging Solutions for Out-of-Sample Classification
Several methodological approaches have been developed to address out-of-sample challenges:
Template-Based Registration: This approach involves obtaining shape coordinates for a new individual by registering them to a template configuration selected from the study sample. The method analyzes the effect of using different template configurations as targets for registration of out-of-sample raw coordinates [17].
Deep Learning Alternatives: Convolutional Neural Networks (CNNs) have demonstrated superior performance compared to traditional geometric morphometrics in some classification tasks, particularly for archaeobotanical seed classification [53]. CNNs can automatically learn relevant features from raw images, potentially bypassing some alignment challenges.
Hybrid AI and Feature Selection: Methods such as Two-phase Mutation Grey Wolf Optimization (TMGWO), Improved Salp Swarm Algorithm (ISA), and Binary Black Particle Swarm Optimization (BBPSO) have shown promise in selecting optimal feature subsets for classification in high-dimensional data, improving both accuracy and generalizability [56].
Quantitative Performance Comparisons
Recent studies provide quantitative evidence of performance differences between methodologies:
Table 3: Quantitative Performance Comparison Across Methodologies
| Methodology | Application Context | Reported Performance | Out-of-Sample Considerations |
|---|---|---|---|
| Geometric Morphometrics with LDA [17] | Children's nutritional status from arm shape | Effective with proper template selection | Performance dependent on template choice for new specimens |
| Convolutional Neural Networks [53] | Archaeobotanical seed classification | Outperformed GMM in classification accuracy | Reduced dependency on alignment; better generalization |
| Hybrid TMGWO with SVM [56] | Wisconsin Breast Cancer dataset | 96% accuracy with only 4 features | Improved feature selection enhances generalizability |
| Traditional Morphometrics with DNA validation [55] | Ancient salmonid vertebrae identification | Relatively low error rates in modern specimens | Ongoing validation against ancient DNA for archaeological specimens |
Workflow Visualization
The following diagram illustrates the core challenge of out-of-sample classification in geometric morphometrics and potential solutions:
Research Toolkit: Essential Methodological Solutions
Implementing robust out-of-sample classification requires specific methodological approaches and computational tools:
Table 4: Research Reagent Solutions for Out-of-Sample Classification
| Methodological Solution | Function | Implementation Considerations |
|---|---|---|
| Template Configuration Selection [17] | Provides target for registering new individuals to existing shape space | Choice of template affects classification results; multiple templates should be tested |
| Two-phase Mutation Grey Wolf Optimization (TMGWO) [56] | Hybrid feature selection algorithm for high-dimensional data | Balances exploration and exploitation; enhances classification accuracy with fewer features |
| Gaussian Mixture Models with Bayesian Inference [52] | Statistical framework for species circumscription in linear morphometrics | Enables rigorous testing of alternative taxonomic hypotheses; handles probabilistic class membership |
| Convolutional Neural Networks [53] | Deep learning approach for image-based classification | Reduces dependency on manual landmarking; automatically learns relevant features |
| Improved Salp Swarm Algorithm (ISSA) [56] | Enhanced metaheuristic for feature selection | Incorporates adaptive inertia weights and local search techniques to improve convergence |
| Multi-context Environmental Attention Module [54] | Computer vision approach incorporating environmental context | Mimics expert biologist reasoning by considering habitat clues; improves marine species identification |
The challenge of out-of-sample classification in morphometrics highlights fundamental trade-offs between methodological sophistication and practical implementation. While geometric morphometrics generally offers superior discriminatory power for capturing complex shape variations, its dependency on sample-specific transformations presents significant hurdles for real-world application to new specimens. Linear morphometrics, while potentially less powerful for capturing geometric complexity, offers more straightforward implementation for out-of-sample classification.
Emerging approaches, including deep learning and hybrid feature selection algorithms, show promise in addressing these challenges by reducing dependency on manual landmarking and alignment procedures. However, these methods introduce their own complexities and require validation against biological ground truth.
For researchers and drug development professionals, the choice of methodology must balance statistical performance with practical implementation constraints, particularly when developing classification systems for routine use. Template-based registration approaches for geometric morphometrics, combined with rigorous validation protocols, offer a path forward for maintaining geometric rigor while addressing the critical challenge of generalizing to new specimens.
As morphometric applications continue to expand into new domains—from archaeological identification to medical diagnostics—developing robust solutions to out-of-sample classification will remain essential for translating methodological advances into reliable, practical tools for scientific research and product development.
In the field of morphometrics, the reliability of quantitative biological form analysis is fundamentally dependent on the quality of the underlying imaging data. The presence of imaging artifacts and outliers can significantly compromise the integrity of morphometric datasets, leading to distorted measurements and misleading scientific conclusions. This challenge is particularly acute when comparing the discriminatory performance of geometric morphometrics (GMM) and linear morphometrics (LMM), where data quality directly influences which method appears superior for specific taxonomic or diagnostic questions [8].
Geometric morphometrics, which captures the complete geometry of anatomical structures using landmark coordinates, and linear morphometrics, which relies on traditional measurement sets of distances and angles, differ substantially in their sensitivity to data quality issues. Research by Viacava et al. (2023) demonstrates that while raw LMM data can show high group discrimination, this power often stems from size variation rather than shape differences, potentially creating a misleading performance advantage that is actually an artifact of methodology rather than true biological distinction [8].
Furthermore, in biomedical contexts such as histopathology, the emergence of next-generation morphometry (NGM) frameworks enables large-scale extraction of quantitative morphometric features through deep learning-based segmentation [57]. These advanced approaches remain vulnerable to technical artifacts, such as the 52% tissue shrinkage observed in paraffin-embedded samples compared to plastic-embedded tissue in glomerular morphometry studies [58]. Such artifacts can systematically bias measurements if not properly identified and controlled.
This guide provides a systematic comparison of contemporary approaches for handling imaging artifacts and outliers, with specific application to the morphometric methods comparison research domain. We evaluate detection methodologies, experimental protocols, and analytical frameworks that enhance robustness across diverse morphometric applications.
Methodological Comparison: Outlier Detection Techniques
Visual, Statistical, and Machine Learning Approaches
Effective identification of imaging artifacts and outliers requires a multifaceted approach combining visual, statistical, and computational methods. Vasilev et al. (2025) systematically evaluated multiple outlier detection techniques on CT scan morphometric datasets of the spleen, identifying distinctive advantages across methodological categories [59].
Table 1: Performance Comparison of Outlier Detection Methods for Morphometric Data
| Method Category | Specific Techniques | Key Strengths | Limitations | Effectiveness for Morphometrics |
|---|---|---|---|---|
| Visual Methods | 1.5 IQR, Boxplots, Histograms, Heat Maps, Scatter Plots | Intuitive interpretation, Quick implementation, Identifies obvious errors | Subjective, Limited for high-dimensional data, Time-consuming for large datasets | High effectiveness for initial data screening [59] |
| Mathematical Statistics | Z-score, Grubb's Test, Rosner's Test | Established statistical rigor, Objective thresholds, Well-understood properties | Assumes normal distribution, Sensitive to multiple outliers, Limited to simple anomaly types | Moderate effectiveness; requires distributional assumptions [59] |
| Machine Learning Algorithms | One-Class SVM (OSVM), K-Nearest Neighbors (KNN), Autoencoders, Isolation Forest | Handles complex patterns, Detects multivariate outliers, No distributional assumptions | Computational complexity, Requires parameter tuning, "Black box" interpretation | High effectiveness for complex morphometric datasets [59] |
The research findings indicate that comprehensive outlier detection should not rely on any single methodology. Visual techniques like boxplots and histograms provide invaluable initial screening, while machine learning approaches such as OSVM and KNN excel at identifying complex multivariate outliers in morphometric datasets [59]. Autoencoders demonstrated particular utility for detecting anomalous organ shapes (e.g., sickle-shaped, round, or triangular spleens) that might represent true biological variation rather than measurement error [59].
Specialized Morphometric Frameworks
Beyond general outlier detection methods, specialized frameworks have been developed specifically for morphological analysis. The concept of "dysmorphometrics" extends traditional geometric morphometrics by explicitly modeling form abnormalities as outliers compared to an established normative reference [60]. This approach incorporates a latent variable coding for abnormalities within the landmark superimposition process, using Expectation-Maximization algorithms to quantify unusual form differences such as congenital malformations or traumatic injuries [60].
The dysmorphometrics framework generates dysmorphograms that visually encode the topography of detected abnormalities, enabling researchers to differentiate true morphological anomalies from normal variation. This is particularly valuable in clinical contexts where unusual form instances are of primary interest rather than nuisances to be eliminated [60].
Experimental Protocols for Robust Morphometry
Data Acquisition and Quality Control Framework
Implementing systematic quality control protocols during data acquisition is crucial for minimizing artifacts in morphometric studies. The following workflow outlines a comprehensive framework for ensuring data quality throughout the morphometric analysis pipeline:
Diagram 1: Comprehensive quality control workflow for robust morphometric analysis
Protocol 1: Multi-Method Outlier Detection for Medical Imaging
Vasilev et al. (2025) established a rigorous protocol for identifying outliers in CT-based spleen morphometry that can be adapted to various morphometric applications [59]:
Dataset Preparation: Create a dataset containing linear measurements from CT scans, with labeling performed by multiple trained experts (e.g., three radiologists for medical imaging studies). Sample size should be calculated based on statistical power requirements.
Multi-Method Outlier Detection:
- Apply visual methods (1.5 interquartile range, heat maps, boxplots, histograms, scatter plots) for initial screening.
- Implement machine learning algorithms (Isolation Forest, DBSCAN, K-nearest neighbors, Local Outlier Factor, One-Class Support Vector Machines, Elliptic Envelope, Autoencoders) to identify complex multivariate outliers.
- Employ mathematical statistics (z-score, Grubb's test, Rosner's test) for statistically-defined outliers.
Anomaly Categorization: Classify detected outliers as either:
- Measurement Errors: Require revision, correction, or removal.
- True Anomalies: Biologically plausible but unusual measurements that require separate consideration and may be of particular research interest.
Comprehensive Reporting: Document the number and nature of identified outliers (e.g., 32 outlier anomalies found in the spleen morphometry study), along with their proposed causes and preventive measures for future studies [59].
Protocol 2: Geometric Morphometrics with Allometry Correction
Viacava et al. (2023) developed a specialized protocol for comparing geometric and linear morphometrics while controlling for allometric effects and outliers [8]:
Data Acquisition: Collect 3D coordinate data using standardized landmark protocols, including true anatomical landmarks and semi-landmarks for comprehensive shape characterization.
Shape Normalization: Perform Generalized Procrustes Analysis (GPA) to remove non-shape variation (position, orientation, scale) from landmark data.
Allometry Assessment: Test for allometric effects (shape changes correlated with size) using multivariate regression of shape coordinates on size measures (e.g., centroid size).
Allometry Correction: Remove allometric effects from shape data to isolate size-independent shape variation using regression residuals.
Comparative Discrimination Analysis: Apply Linear Discriminant Analysis (LDA) to assess discriminatory performance of:
- Raw GMM data
- GMM data with isometry removed
- GMM data with allometry removed
- Raw LMM data
- LMM data with size effects removed
Performance Evaluation: Compare group discrimination accuracy, variance explained in principal components, and biological interpretability across all methodological variations.
This protocol revealed that GMM discriminated groups better after isometry and allometry were removed, while LMM discrimination often reflected size variation rather than shape differences—a critical insight for methodological selection in morphometric research [8].
Comparative Performance in Morphometric Research
Quantitative Comparison of Morphometric Approaches
The discriminatory performance of geometric versus linear morphometrics has been quantitatively evaluated across multiple studies, with specific implications for how each method handles data quality challenges:
Table 2: Performance Comparison of Geometric vs. Linear Morphometrics in Handling Data Quality Challenges
| Performance Metric | Geometric Morphometrics | Linear Morphometrics | Research Evidence |
|---|---|---|---|
| Discrimination Accuracy | Superior after allometry correction | High in raw data but inflated by size effects | Viacava et al. 2023 [8] |
| Sensitivity to Size Effects | Can statistically isolate and remove | Inherently confounded with shape | Viacava et al. 2023 [8] |
| Handling of Unusual Forms | Specialized frameworks (dysmorphometrics) available | Limited analytical frameworks | [60] |
| Pinocchio Effect | Explicit modeling approaches | Amplified in analyses | [60] |
| Automation Potential | High in next-generation frameworks | Moderate with standardized protocols | [57] |
| Technical Artifact Sensitivity | Identifies differential artifacts between groups | May not detect systematic biases | Reghuvaran et al. 2023 [58] |
| Biological Interpretability | High when shape features are traceable | Intuitive but potentially misleading | [8] [57] |
Case Study: Kidney Histomorphometry with FLASH
The Framework for Large-Scale Histomorphometry (FLASH) represents a cutting-edge application of next-generation morphometry that exemplifies robust handling of imaging artifacts [57]. This approach demonstrated several key advantages:
Pan-Disease Segmentation Accuracy: FLASH achieved high-precision segmentation of kidney structures (glomeruli, tubules, vessels) across diverse injury patterns and staining protocols, with Dice similarity coefficients confirming robust performance despite technical variations [57].
Clinical Correlation Validation: The framework extracted over 11,000 glomerular morphometric features, revealing statistically significant associations between morphometric features and clinical parameters:
- 19.71% larger glomerular tuft area in lupus nephritis vs. normal (95% CI [10.65, 28.83%])
- 40.54% larger tuft area in membranous glomerulonephritis (95% CI [30.99, 51.5%])
- 9.71% larger tuft areas in cases with nephrotic-range proteinuria (95% CI [2.81, 15.81%]) [57]
Artifact Quantification: The approach enabled precise quantification of technical artifacts, such as the 52% tissue shrinkage in paraffin-embedded versus plastic-embedded tissue observed in control animals, with differential artifact magnitudes in disease states (FSGS glomeruli showed reduced but more variable shrinkage) [58].
Essential Research Toolkit
Implementing robust morphometric analysis requires specific methodological tools and approaches. The following toolkit summarizes essential solutions for handling imaging artifacts and outliers:
Table 3: Research Reagent Solutions for Robust Morphometric Analysis
| Solution Category | Specific Tools/Methods | Primary Function | Key Applications |
|---|---|---|---|
| Visual Screening Tools | Boxplots, Histograms, Scatter Plots, Heat Maps | Initial identification of obvious outliers and data distribution assessment | All morphometric studies for quality control [59] |
| Statistical Detection | Grubb's Test, Rosner's Test, Z-score | Statistical identification of extreme values based on distributional assumptions | Initial outlier screening in normally-distributed data [59] |
| Machine Learning Algorithms | One-Class SVM, K-Nearest Neighbors, Autoencoders | Detection of complex multivariate outliers without distributional assumptions | High-dimensional morphometric data, unusual shape detection [59] |
| Specialized Morphometric Frameworks | Dysmorphometrics, Allometry Correction | Domain-specific detection and modeling of morphological abnormalities | Clinical morphometrics, evolutionary biology, taxonomy [8] [60] |
| Segmentation & Feature Extraction | FLASH, Deep Learning CNNs | Automated structure segmentation and quantitative feature extraction | Large-scale histomorphometry, pathomics data mining [57] |
| Data Quality Management | Automated profiling, cleansing, monitoring | Systematic data quality assessment and maintenance throughout project lifecycle | Ensuring ongoing data integrity in longitudinal studies [61] |
Integrated Analysis Pathway
The relationship between data quality challenges, detection methodologies, and analytical outcomes in morphometrics research can be visualized through the following integrated pathway:
Diagram 2: Integrated analysis pathway from data challenges to robust morphometric outputs
The comparative analysis of geometric and linear morphometrics reveals that methodological performance is intrinsically linked to effective handling of imaging artifacts and outliers. While both approaches offer distinct advantages, their discriminatory performance must be evaluated in the context of data quality considerations:
Geometric morphometrics provides superior discrimination of true shape differences after appropriate allometry correction and outlier handling, with specialized frameworks like dysmorphometrics offering unique capabilities for modeling morphological abnormalities [8] [60].
Linear morphometrics demonstrates high discriminatory power in raw data but often reflects size variation rather than shape differences, potentially leading to misleading taxonomic or diagnostic conclusions if not properly controlled [8].
Next-generation morphometry frameworks enable large-scale, automated analysis while maintaining robustness to technical artifacts through advanced segmentation and feature extraction approaches [57].
The most robust morphometric research employs multi-method outlier detection, explicit allometry handling, and sensitivity analyses to ensure conclusions reflect biological reality rather than methodological artifacts. As morphometrics continues to evolve toward increasingly automated and large-scale applications, maintaining rigorous attention to data quality fundamentals remains essential for generating scientifically valid and clinically meaningful results.
Integration with Machine Learning and Deep Learning Approaches
The field of morphometrics, the quantitative analysis of biological shape, has long relied on traditional methods like geometric morphometrics (GMM) and linear morphometrics (LMM). However, the integration of machine learning (ML) and deep learning (DL) is fundamentally enhancing how researchers capture, analyze, and interpret morphological data. This paradigm shift addresses key limitations of traditional methods, particularly their reliance on pre-defined landmarks and limited ability to process high-dimensional, complex shape information. This guide provides an objective comparison of these integrated approaches against conventional alternatives, detailing their performance, experimental protocols, and practical applications for researchers and scientists.
Performance Comparison: Traditional vs. Modern Methods
Quantitative comparisons reveal the relative strengths and weaknesses of different morphometric approaches. The tables below summarize key performance metrics from recent studies.
Table 1: Overall Performance of Morphometric Methods in Classification Tasks
| Method | Application/Organism | Key Performance Metric | Result | Reference |
|---|---|---|---|---|
| Deep Learning (CNN) | Archaeobotanical seeds (Wild vs. Domestic) | Classification Performance | Outperformed GMM | [53] |
| Geometric Morphometrics (GMM) | Mammalian species complex (Antechinus) | Group Discrimination (Raw data, with size) | High | [8] |
| Geometric Morphometrics (GMM) | Mammalian species complex (Antechinus) | Group Discrimination (Size-corrected shape) | Worse than LMM | [8] |
| Linear Morphometrics (LMM) | Mammalian species complex (Antechinus) | Group Discrimination (Raw data, with size) | High | [8] |
| Linear Morphometrics (LMM) | Mammalian species complex (Antechinus) | Group Discrimination (Size-corrected shape) | Better than GMM | [8] |
| Functional Data GM (FDGM) | Shrew crania (3 species) | Classification Accuracy | Outperformed Classical GM | [62] |
| Random Forest (RF) | Roselle morphological traits | Predictive Performance (R²) | 0.84 | [63] |
| Multi-layer Perceptron (MLP) | Roselle morphological traits | Predictive Performance (R²) | 0.80 | [63] |
Table 2: Detailed Performance in Specific DL and GMM Studies
| Study Detail | Method | Classification Task | Result / Note |
|---|---|---|---|
| Plusiinae Pest Identification [64] | Deep Learning (CNN) | SBL vs. CBL (2 species) | Effective identification from wing patterns |
| Plusiinae Pest Identification [64] | Deep Learning (CNN) | SBL, CBL, & GLM (3 species) | Effective identification from wing patterns |
| Shrew Crania Classification [62] | Classical GMM | 3 shrew species | Outperformed by FDGM |
| Shrew Crania Classification [62] | FDGM + Machine Learning | 3 shrew species | Best performance; Dorsal view most informative |
| Rove Beetle Phylogenetics [65] | Deep Learning-derived traits | Phylogenetic signal | Underperformed vs. molecular data alone |
| Rove Beetle Phylogenetics [65] | Total Evidence (DL traits + Molecular) | Phylogenetic signal | Improved upon molecular results |
Experimental Protocols and Workflows
Protocol: Convolutional Neural Networks (CNNs) for Seed Classification
This protocol is derived from the study that compared CNNs and outline analysis for classifying archaeobotanical seeds [53].
- Step 1: Image Acquisition: Obtain standardized 2D orthophotographs of seeds. The dataset used in the benchmark study comprised over 15,000 seed photographs [53].
- Step 2: Data Preparation and Workflow Setup: The computational workflow is developed in R, which leverages Python via the
reticulatepackage to perform the machine learning computations. The entire dataset and code are structured for high reproducibility [53]. - Step 3: Model Training and Comparison: A relatively simple CNN architecture is trained on the image data. Its performance is directly compared against a standard GMM pipeline using outline analysis conducted with the R package
Momocs[53]. - Step 4: Performance Evaluation: The classification accuracy of both methods is evaluated on a held-out test set. The study confirmed that CNNs outperformed GMM in this task [53].
Protocol: Functional Data Geometric Morphometrics (FDGM) with Machine Learning
This protocol outlines the FDGM approach combined with ML classifiers for shrew craniodental shape classification [62].
- Step 1: Data Collection: Collect landmark data from crania specimens. The study used 89 shrew crania, with landmarks placed on three craniodental views: dorsal, jaw, and lateral [62].
- Step 2: Landmark Preprocessing: Subject the raw landmark data to Generalised Procrustes Analysis (GPA) to remove the effects of size, translation, and rotation [62].
- Step 3: Functional Data Transformation: Convert the discrete Procrustes-aligned landmark coordinates into continuous curves. This is achieved by representing the landmark sequences as linear combinations of basis functions, such as Fourier series or B-splines [62].
- Step 4: Feature Extraction and Modeling: Perform Principal Component Analysis (PCA) on the functional data to reduce dimensionality and extract key shape variations. Use the resulting PC scores as features in a machine learning classifier.
- Step 5: Classification and Validation: Apply classifiers like Linear Discriminant Analysis (LDA), Naïve Bayes, Support Vector Machine (SVM), or Random Forest. Compare the performance of this FDGM approach against classical GM using the same landmarks and classifiers [62].
Logical Workflow Diagram
The following diagram illustrates the logical relationship and data flow between the different morphometric approaches discussed, from traditional methods to integrated ML/DL frameworks.
The Scientist's Toolkit: Essential Research Solutions
This table details key reagents, software, and tools essential for conducting research in this integrated field.
Table 3: Essential Research Reagents and Solutions for Morphometric Integration
| Tool/Solution | Category | Primary Function | Example Use Case |
|---|---|---|---|
| R Statistical Environment | Software Platform | Core platform for statistical analysis, data visualization, and pipeline integration. | Executing GMM (e.g., with geomorph [8]), FDA, and traditional statistical tests [53] [62]. |
| Python with DL Libraries (e.g., TensorFlow, PyTorch) | Software Platform | Building, training, and deploying deep learning models, particularly CNNs. | Image-based classification of seeds [53] or insect wings [64] via R's reticulate package. |
| Momocs R Package | Software Library | Performs outline and elliptical Fourier analyses for GMM. | Served as a GMM benchmark in the seed classification study [53]. |
| Segment Anything Model (SAM) | AI Model | Foundational model for automated image segmentation from photographs. | Extracting fish body shapes from field photographs for morphometric analysis [66]. |
| Random Forest Algorithm | Machine Learning | Robust regression and classification for structured data, handles non-linear interactions. | Predicting plant morphological traits from genotype and planting date data [63]. |
| Functional Data Analysis (FDA) | Statistical Method | Analyzes landmark data as continuous curves, capturing subtle shape variations. | Improving classification accuracy of shrew species from craniodental landmarks [62]. |
| NSGA-II (Genetic Algorithm) | Optimization Algorithm | Solves multi-objective optimization problems to find Pareto-optimal solutions. | Identifying optimal genotype and planting date combinations to maximize multiple crop traits [63]. |
| Standardized Imaging System | Laboratory Equipment | Captures high-resolution, standardized images of specimens with minimal distortion. | Creating the CavFish-Colombia dataset from live fish in the field [66]. |
Template Selection and Registration Strategies for Consistent Results
In scientific research, particularly within taxonomy, evolutionary biology, and biomedical applications, the selection of an appropriate template and the subsequent registration of data to that template are foundational steps that directly determine the validity, reliability, and interpretability of results. These processes are especially critical in morphology-based studies, where the goal is to quantify and compare shapes across individuals or groups. The broader methodological debate often centers on the choice between Geometric Morphometrics (GMM) and Linear Morphometrics (LMM), as each approach entails different philosophies and techniques for template selection and registration. GMM utilizes the coordinates of anatomical reference points to capture the geometry of a structure holistically, while LMM relies on traditional point-to-point linear measurements [21]. Evidence suggests that the choice between these methods is not merely technical but profoundly influences scientific conclusions, especially regarding the interplay between size and shape [21] [5]. This guide provides a comparative overview of template selection and registration strategies, framing them within the ongoing discussion of GMM versus LMM discriminatory performance.
Morphometrics Face-Off: Geometric vs. Linear Approaches
The core difference between GMM and LMM lies in how they represent biological form, which directly impacts their template requirements and registration complexity.
Geometric Morphometrics (GMM)
- Data Foundation: Uses 2D or 3D coordinates of anatomically homologous landmarks to represent shape [21].
- Template Registration: Relies on a Procrustes superimposition to align all specimens by removing differences in position, scale, and orientation. This process explicitly separates size (centroid size) from shape (Procrustes coordinates) [21] [17].
- Key Strength: Provides a holistic characterization of shape and offers powerful visualizations of shape variation. Its registration procedure inherently accounts for and allows the study of allometry (shape changes correlated with size) [21].
Linear Morphometrics (LMM)
- Data Foundation: Uses traditional, one-dimensional measurements between points (e.g., skull length, width) [21].
- Template Registration: The "template" is often an implicit set of standard measurements. Registration is less about spatial alignment and more about ensuring measurement protocols are consistent. However, measurements often contain redundant size information [21].
- Key Limitation: Captures only a fraction of shape information and cannot easily disentangle allometric effects from non-allometric shape differences. This can lead to the misinterpretation of pure size differences as meaningful shape divergence [21] [5].
Table 1: Fundamental Comparison of Geometric and Linear Morphometrics
| Feature | Geometric Morphometrics (GMM) | Linear Morphometrics (LMM) |
|---|---|---|
| Data Type | Landmark/semi-landmark coordinates | Linear distances |
| Shape Capture | Holistic; preserves geometry | Partial; limited to measured axes |
| Size vs. Shape | Explicitly separated via Procrustes | Often conflated |
| Allometry Analysis | Directly possible via shape-size regression | Problematic; often requires ratios |
| Taxonomic Discrimination | Based on non-allometric shape differences post-registration | Can be inflated by underlying size variation |
Performance Comparison: Disentangling Shape from Size
A pivotal 2023 study directly compared the performance of LMM protocols and GMM in discriminating three clades of antechinus, a mammalian species complex known for subtle shape differences [21] [5]. The experimental protocol and results highlight the critical importance of registration and template choice.
Experimental Protocol
- Specimens: Skulls from three closely related antechinus clades.
- Data Acquisition:
- LMM: Four published linear measurement protocols were applied.
- GMM: A 3D landmark dataset was collected.
- Data Processing & Registration:
- Raw Data: Analyzed without correction.
- Isometry Removal: Size (isometry) was statistically removed from both LMM and GMM data.
- Allometric Correction: Non-uniform effects of size on shape (allometry) were removed from the GMM data using regression.
- Analysis: Data were analyzed using Principal Component Analysis (PCA) and Linear Discriminant Analysis (LDA) to assess group discrimination [21].
Key Findings and Quantitative Results
The study yielded several critical findings that inform template and registration strategy:
- Raw Data Performance: LMM showed high group discrimination with raw data, but this was largely driven by size variation rather than shape.
- Effect of Registration/Correction: After removing isometry, the discriminatory performance of LMM decreased substantially. In contrast, GMM achieved its best group discrimination after both isometry and allometry were removed, revealing true shape differences independent of size [21].
- Risk of Inflation: The study concluded that LMM carries a "substantial risk that this discrimination comes from variation in size, rather than shape" [21] [5].
Table 2: Summary of Key Results from Viacava et al. (2023) Comparative Study [21]
| Analysis Type | LMM Discriminatory Performance | GMM Discriminatory Performance | Primary Driver of Discrimination |
|---|---|---|---|
| Raw Data | High | Moderate | Size (LMM), Mixed Size & Shape (GMM) |
| Isometry Removed | Reduced | Improved | Residual allometry & shape |
| Allometry Removed | (Not typically performed) | Best | Non-allometric shape differences |
A Framework for Template Selection and Registration
Choosing a template and a registration strategy is context-dependent. The following workflow and decision guide outline the core steps and strategic considerations.
Core Registration Workflow
The following diagram illustrates the generalized registration pipeline for morphometric data, particularly for GMM.
Diagram 1: Generalized Morphometric Registration Pipeline
Advanced Registration Strategies
For challenging scenarios with large deformations or heterogeneous data, basic registration may fail. Intermediate Template strategies improve robustness.
- Population Graph Construction: A graph is built where each node is an image/specimen, and edges represent shape similarity (e.g., based on Euclidean distance of FA maps in DTI) [67].
- Root Template Selection: The root template is automatically selected as the node with the shortest overall path length to all others on the graph's Minimum Spanning Tree (MST), representing the population center [67].
- Progressive Registration: Each specimen is warped to the root template not directly, but via intermediate templates along its unique path on the MST. This breaks down large, complex deformations into a series of smaller, more reliable registration steps [67].
Diagram 2: Intermediate Template Registration Pathway
Template Selection Decision Guide
The optimal choice of a template depends on the research question, data structure, and analytical goals.
Table 3: Template Selection Strategy Guide
| Template Type | Description | Best Use Cases | Considerations |
|---|---|---|---|
| Study-Specific Average | An average shape (e.g., Procrustes mean) created from the study sample itself. | Confirmatory studies with a well-defined, coherent population. | May not represent out-of-sample individuals well [17]. |
| Standardized Atlas | A pre-existing, canonical template from a different population or a published atlas. | Multi-study comparisons; clinical applications. | Risk of poor fit and registration errors if the study population deviates significantly. |
| Population-Centered (Root) | A single specimen from the population identified as the most central via graph theory [67]. | Groupwise registration of heterogeneous populations. | More robust than a randomly chosen specimen; requires similarity metrics. |
| Intermediate Templates | A pathway of specimens used to bridge large morphological gaps [67]. | Populations with high variance or distinct subgroups; large deformation fields. | Computationally intensive but significantly improves accuracy and robustness. |
The Scientist's Toolkit: Essential Research Reagents and Solutions
Successful implementation of morphometric studies requires a suite of methodological tools and software solutions.
Table 4: Key Research Reagent Solutions for Morphometrics
| Tool/Solution | Function | Example Use Case |
|---|---|---|
| Open Science Framework (OSF) Preregistration | A repository with structured templates for preregistering study plans, enhancing transparency [68]. | Preregistering hypotheses, sampling, and analysis plans for a taxonomic study using the "Preregistration in Social Psychology" template. |
| Digital Phenotyping Preregistration Template | A specialized template for studies using passive smartphone measures, addressing data cleaning and feature engineering [69]. | Planning a study using smartphone GPS and accelerometer data to link behavior and mental health. |
| Procrustes Superimposition Algorithms | Core GMM procedure implemented in morphometrics software to align specimens and extract shape variables. | Registering all skull landmark configurations to a mean template prior to discriminant analysis. |
| R (with geomorph/morpho packages) | Open-source statistical environment with dedicated packages for GMM analysis. | Performing Procrustes ANOVA, allometric regression, and generating shape visualizations. |
| Minimum Spanning Tree (MST) Algorithms | Graph theory tools to determine root templates and intermediate registration pathways [67]. | Identifying the most central DTI image in a cohort and planning a stepwise registration path for all others. |
The strategic selection of templates and the application of robust registration protocols are not merely preliminary technical steps but are analytically decisive. The comparative performance data clearly indicates that Geometric Morphometrics, with its ability to explicitly separate size from shape during registration, provides a more reliable foundation for identifying true morphological differences, as in taxonomic discrimination [21] [5]. While Linear Morphometrics is more accessible, its inherent conflation of size and shape poses a significant interpretive risk. For consistent and biologically meaningful results, researchers should prioritize GMM, adopt structured preregistration templates [68] [69], and consider advanced strategies like intermediate templates [67] when dealing with complex or heterogeneous populations. The choice of morphometric framework, therefore, directly shapes the validity and impact of scientific findings in morphology-driven research.
Validation and Performance Comparison: Empirical Evidence
Direct Methodological Comparisons in Species Complex Resolution
The resolution of species complexes—groups of closely related and often morphologically similar species—is a fundamental challenge in systematics, ecology, and evolutionary biology. Accurate delimitation of species boundaries is critical for biodiversity assessment, conservation prioritization, and understanding evolutionary processes. The methodological landscape for tackling these complexes has expanded significantly, offering researchers multiple approaches with differing theoretical foundations, data requirements, and analytical frameworks.
This guide provides an objective comparison of leading methodological approaches for species complex resolution, with particular emphasis on the comparative performance of geometric morphometrics (GMM) versus traditional linear morphometrics (LMM). We synthesize experimental data from controlled comparisons to inform methodological selection and provide detailed protocols for implementation. Within the broader context of morphometrics research, understanding the relative strengths and limitations of these approaches enables more informed taxonomic decisions and more reliable species delimitations.
Theoretical Foundations and Operational Principles
Species delimitation methods operate under different operational criteria and theoretical assumptions. Molecular approaches often appeal to the phylogenetic species concept, identifying minimal phylogenetic units as operational taxonomic units [70]. Methods like the generalized mixed Yule-coalescent (GMYC) and Poisson tree processes (PTP) were designed for single-locus data but are often applied to concatenated multilocus data, while Bayesian multispecies coalescent approaches (e.g., BPP) explicitly model the evolution of multilocus data [70]. In contrast, morphometric approaches typically align with phenetic species concepts, quantifying morphological distinctions through measurement-based protocols [21].
The performance of these methods varies significantly under different biological scenarios. Simulation studies have demonstrated that in the absence of gene flow, the primary factor influencing methodological performance is the ratio of population size to divergence time, with smaller effects from the number of loci and sample size per species [70]. Given appropriate priors and correct guide trees, Bayesian methods like BPP show lower rates of species overestimation and underestimation and generally robust performance except under high levels of gene flow [70].
Table 1: Core Methodological Approaches for Species Complex Resolution
| Method Category | Specific Methods | Data Requirements | Theoretical Basis | Key Applications |
|---|---|---|---|---|
| Molecular Delimitation | GMYC, PTP, BPP [70] | Genetic sequences (single or multi-locus) | Phylogenetic species concept | Species validation, phylogenetic inference |
| Linear Morphometrics | Traditional measurement protocols [21] | Point-to-point distances | Phenetic species concept | Taxonomic differentiation, diagnostic characters |
| Geometric Morphometrics | Landmark-based, outline methods [21] | 2D/3D coordinates of landmarks | Phenetic species concept | Shape analysis, allometry correction |
| Genomic Approaches | GBS, RADseq [71] | Genome-wide SNP data | Phylogenetic/Genealogical concordance | Phylogeny of recently diverged groups |
Performance Comparison: Geometric vs. Linear Morphometrics
Recent controlled comparisons have provided quantitative data on the relative performance of geometric and linear morphometrics in taxonomic discrimination. A 2023 study systematically evaluated both approaches on three clades of antechinus, a mammalian species complex known for subtle shape differences [21] [8].
Table 2: Performance Comparison of Geometric and Linear Morphometrics in Taxonomic Discrimination
| Performance Metric | Linear Morphometrics (LMM) | Geometric Morphometrics (GMM) |
|---|---|---|
| Raw data discrimination | High group discrimination [21] | Moderate group discrimination [21] |
| Size-corrected discrimination | Performance decreases after allometric correction [21] | Better discrimination after isometry and allometry removal [21] |
| Size vs. shape discrimination | Substantial risk of discriminating based on size rather than shape [21] | Effectively differentiates allometric and non-allometric shape differences [21] |
| Data redundancy | High measurement redundancy [21] | Holistic shape characterization [21] |
| Visualization capability | Limited shape visualization | Comprehensive graphical output of shape variation [21] |
The experimental data revealed that while LMM can be a powerful tool for discriminating taxonomic groups, there is substantial risk that this discrimination derives from size variation rather than shape differences [21] [8]. This is particularly problematic for taxonomic studies, as size differences may reflect environmental factors rather than evolutionary divergence. GMM, while more complex in data acquisition, provides more reliable discrimination of shape differences after accounting for allometric effects [21].
Detailed Methodological Protocols
Geometric Morphometrics Implementation
Experimental Workflow for 3D Geometric Morphometrics:
The standard protocol for 3D GMM analysis involves sequential stages from data acquisition through statistical analysis and interpretation [21] [8]:
Specimen Digitization: Capture 3D representations of specimens using micro-CT scanning or laser surface scanning technology.
Landmark Placement: Identify and digitize fixed homologous landmarks (e.g., suture intersections) using specialized software. The study compared four published LMM protocols and a 3D GMM dataset, assessing discrimination of raw data, data with isometry removed, and data with allometric correction [21].
Procrustes Superimposition: Apply Generalized Procrustes Analysis (GPA) to remove the effects of position, orientation, and scale through translation, rotation, and scaling of landmark configurations [21].
Size Correction: Calculate centroid size as a proxy for overall size and remove isometric scaling effects. Conduct allometric correction through shape versus size regression to remove non-uniform effects of size [21].
Statistical Analysis: Perform Principal Component Analysis (PCA) to visualize shape variation and Linear Discriminant Analysis (LDA) to assess discriminatory performance between putative taxonomic groups [21].
The following diagram illustrates this workflow:
Molecular Delimitation Methods
Implementation Protocols for GMYC, PTP, and BPP:
Molecular delimitation methods require careful parameterization and specific analytical workflows [70]:
Gene Tree Estimation: For GMYC and PTP, estimate gene trees from sequence data. GMYC requires ultrametric trees (branch lengths proportional to time), while PTP uses trees with branch lengths proportional to genetic change [70].
Model Application: Apply the respective models to identify transition points between speciation and coalescent processes. GMYC fits a coalescent model to within-species branching rates and a Yule model to between-species rates, identifying the threshold that maximizes likelihood [70].
Multilocus Analysis (BPP): For BPP analysis, specify a guide tree and model prior distributions for population size and divergence time parameters. Run Markov Chain Monte Carlo (MCMC) algorithms to estimate the posterior distribution of species delimitation models [70].
Simulation studies recommend that BPP analyses use appropriate priors and correct guide trees for optimal performance. The single-threshold GMYC and best PTP strategies generally perform well for scenarios involving more than a single putative species when gene flow is absent, with PTP outperforming GMYC when fewer species are involved [70].
Advanced Technical Developments
Functional Data Geometric Morphometrics
Emerging methodologies like Functional Data Geometric Morphometrics (FDGM) represent a significant advancement in shape analysis. This approach converts discrete landmark data into continuous curves represented as linear combinations of basis functions [62]. A 2024 study comparing FDGM with classical GM for classifying three shrew species found that FDGM enhanced sensitivity to subtle shape variations through the analysis of continuous function-based shape changes [62].
The FDGM workflow involves:
- Converting landmark data into continuous curves using interpolation techniques
- Applying curve registration or functional alignment to warp the temporal domain of functions
- Analyzing shape changes as continuous functions rather than discrete points
- Using machine learning classifiers (e.g., naïve Bayes, support vector machine, random forest) on predicted PC scores for species classification [62]
This approach is particularly valuable for studying species with minor morphological distinctions or monitoring subtle changes in response to environmental factors [62].
Genotyping-by-Sequencing for Phylogenomic Resolution
Genotyping-by-sequencing (GBS) provides a cost-effective approach for resolving species complexes using genome-wide SNP data. A case study on the Triodia basedowii grass species complex demonstrated effective phylogenetic resolution using GBS [71].
Key methodological considerations for GBS include:
- Locus Assembly: Merging overlapping paired-end reads and optimizing locus assembly parameters in programs like PyRAD
- Data Analysis: Employing both traditional concatenation analyses (e.g., RAxML) and summary species tree analyses (e.g., ASTRAL, SVDquartets) that take gene trees as input
- Parameter Optimization: Exploring assembly parameters to maximize recovered loci while minimizing error rates and intrapopulation genetic distances [71]
This approach significantly improved resolution of taxa and phylogenetic relationships in the Triodia basedowii complex compared to previous Sanger sequencing of nuclear and chloroplast markers [71].
Research Reagent Solutions
Table 3: Essential Research Reagents and Computational Tools for Species Delimitation
| Category | Item | Specific Examples | Function |
|---|---|---|---|
| Molecular Analysis | Sequence Alignment Software | MAFFT, MUSCLE | Align sequence data for phylogenetic analysis |
| Phylogenetic Software | RAxML, BEAST, MrBayes | Infer evolutionary relationships | |
| Species Delimitation Programs | GMYC, PTP, BPP | Implement delimitation algorithms [70] | |
| Morphometric Analysis | Digitization Equipment | Micro-CT scanners, 3D laser scanners | Create high-resolution 3D specimen models [21] |
| Landmarking Software | tpsDig2, MorphoJ | Digitize and analyze landmark data [21] | |
| Statistical Packages | geomorph R package [8] | Perform Procrustes analysis and shape statistics [21] | |
| Genomic Approaches | Library Prep Kits | GBS/RADseq kits | Prepare reduced-representation genomic libraries [71] |
| Bioinformatics Tools | PyRAD, STACKS, TASSEL [71] | Process and assemble GBS/RADseq data | |
| Phylogenomic Programs | ASTRAL, SVDquartets | Perform species tree analysis from gene trees [71] |
Comparative Performance Under Specific Scenarios
Methodological Robustness to Gene Flow and Incomplete Lineage Sorting
Simulation studies have quantified the performance of delimitation methods under varying evolutionary scenarios. The Bayesian method in BPP performs well with appropriate priors, showing low rates of false positives and false negatives under most evolutionary scenarios, and appears robust to low levels of gene flow [70]. In contrast, GMYC and PTP are more sensitive to the effects of gene flow and potential confounding factors [70].
For recently diverged species complexes with ongoing gene flow, BPP with informed priors may provide more reliable delimitation, while GMYC and PTP may be sufficient for complexes without recent gene flow, particularly when involving multiple species [70].
Integration of Multiple Data Types
Case studies have demonstrated the value of integrating multiple data types for species complex resolution. Research on the Gammarus roeselii amphipod cryptic species complex revealed that lineage identity had minor influence on thiacloprid tolerance, with differentiation occurring primarily at the population level [72]. This highlights that methodological approaches must account for population-level variation that may not align with phylogenetic lineages.
The following diagram illustrates an integrated methodological framework for species complex resolution:
Methodological selection for species complex resolution requires careful consideration of taxonomic context, biological factors, and research objectives. Geometric morphometrics provides superior discrimination of shape differences after accounting for allometric effects compared to linear morphometrics, making it particularly valuable for complexes with subtle morphological differentiation. Molecular delimitation methods offer complementary approaches, with Bayesian multilocus methods like BPP generally showing more robust performance under various evolutionary scenarios, including cases with low levels of gene flow.
Emerging methodologies like functional data geometric morphometrics and genotyping-by-sequencing represent significant advances for handling complex shape data and resolving recently diverged groups, respectively. An integrative approach that combines multiple data types and methodological frameworks often provides the most robust resolution of species complexes, particularly for taxonomically challenging groups with conflicting patterns of differentiation across character systems.
Classification Accuracy in Controlled Experimental Settings
The selection of morphometric methodologies is a critical decision in biological research, directly impacting the reliability of taxonomic classification and morphological analysis. This guide provides a systematic comparison between geometric morphometrics (GM) and linear morphometrics (LM) in controlled experimental settings, offering evidence-based insights into their discriminatory performance. While geometric morphometrics captures comprehensive shape information through landmark coordinates, linear morphometrics relies on traditional measurements of distances and angles [3]. Understanding the relative strengths, limitations, and optimal applications of each approach is essential for researchers across biological disciplines, from taxonomy to functional morphology.
Theoretical Foundations and Methodological Principles
Fundamental Methodological Differences
Linear morphometrics represents the traditional approach to quantitative shape analysis, utilizing caliper measurements of distances, widths, lengths, and angles between defined points. These univariate measurements are often combined into multivariate statistical analyses. While this approach benefits from conceptual simplicity and ease of implementation, it captures only a limited aspect of overall shape geometry [3].
Geometric morphometrics represents a paradigm shift in shape analysis, utilizing two primary data types:
- Landmarks: Discrete, homologous points that have biological correspondence across specimens
- Semi-landmarks: Points used to capture information along curves and outlines between landmarks
GM analyses typically employ Procrustes superimposition to remove non-shape variation (position, orientation, scale), followed by multivariate statistical analysis of the aligned coordinates [73]. This approach preserves the complete geometric information of structures throughout analysis, allowing for visualization of shape changes along statistical axes [3].
Analytical Workflow Comparison
The diagram below illustrates the fundamental methodological differences between linear and geometric morphometrics approaches:
Comparative Performance Analysis
Classification Accuracy Across Biological Systems
Table 1: Classification Accuracy of Geometric vs. Linear Morphometrics Across Experimental Studies
| Biological System | Geometric Morphometrics Accuracy | Linear Morphometrics Accuracy | Experimental Context | Citation |
|---|---|---|---|---|
| Apple Cultivars | 66.7% (test set) | 72.6% (test set) | Cultivar identification using statistical learning tools | [74] |
| Shrew Species (Sorex) | High discrimination (p < 0.05) | 92% Jackknifed classification | Craniodental and mandibular characters for taxonomic separation | [3] |
| Neuronal vs. Glial Cells | Near-perfect accuracy (multiple ML algorithms) | Not assessed | Classification based on arbor morphology from reconstructions | [75] |
| Carnivore Tooth Marks | <40% (2D outlines) | Not assessed | Agency identification using landmark and outline methods | [50] |
| Archaeological Cut Marks | Effective tool type classification | Not assessed | Distinguishing flint vs. metal tool marks on bone | [73] |
Methodological Advantages and Limitations
Table 2: Methodological Comparison of Linear and Geometric Morphometric Approaches
| Characteristic | Linear Morphometrics | Geometric Morphometrics |
|---|---|---|
| Shape Capture | Limited to measured dimensions | Comprehensive geometric information |
| Data Type | Distances, angles, ratios | Landmark coordinates, outlines |
| Visualization | Limited shape visualization | Powerful graphical output of shape variation |
| Size/Shape Separation | Requires explicit calculation | Built-in through Procrustes analysis |
| Statistical Power | Effective with clear linear differences | Superior with complex shape differences |
| Implementation Complexity | Low | High (requires specialized software) |
| Sample Size Requirements | Moderate | Large (especially for landmark-rich approaches) |
| Homology Requirement | Flexible | Strict (dependent on landmark homology) |
Detailed Experimental Protocols
Protocol 1: Taxonomic Discrimination of Anatolian Shrews
This study provides a direct comparison of linear and geometric morphometric approaches on the same specimens, offering unique insights into their relative performance [3]:
Specimen Preparation:
- Collected 47 Sorex specimens from field studies across Türkiye
- Used karyological and molecular data for unambiguous taxonomic identification
- Prepared skulls and mandibles for morphological analysis
Linear Morphometric Protocol:
- Measured 10 craniodental and mandibular characters using digital calipers
- Conducted discriminant function analysis on measurement data
- Performed jackknifed classification validation
Geometric Morphometric Protocol:
- Digitized 2D landmarks on ventral skull, dorsal skull, and mandible
- Placed 14 landmarks on ventral skull, 12 on dorsal skull, and 8 on mandible
- Performed Generalized Procrustes Analysis (GPA) for landmark alignment
- Conducted Procrustes ANOVA and discriminant analysis of shape variables
Analysis:
- Compared classification success rates between methods
- Assessed allometric patterns using centroid size and shape variables
- Calculated mechanical potential (bite force) from linear measurements
Protocol 2: Apple Cultivar Identification
This experimental design directly tested both morphometric approaches on biological material with pre-defined but morphologically similar categories [74]:
Sample Collection:
- Multiple apple cultivars with known genetic profiles
- High morphological similarity between test groups
Linear Morphometric Approach:
- Traditional measurements of fruit size, shape, and structural features
- Standardized measurement protocols across specimens
- Multivariate statistical analysis of measurement data
Geometric Morphometric Approach:
- Landmark placement on fruit structures
- Outline-based approaches for complex curves
- Procrustes-based alignment and shape variable extraction
Validation Method:
- Test set validation approach (separate from training data)
- Direct comparison of classification accuracy between methods
- Combined approach testing ("pick and mix") using most effective techniques
Technical Implementation and Research Reagents
Essential Research Solutions and Tools
Table 3: Essential Research Reagents and Solutions for Morphometric Studies
| Research Solution | Function/Application | Example Use Cases | |
|---|---|---|---|
| Digital Calipers (precision 0.01mm) | Linear measurement collection | Craniometric measurements, bone fragment dimensions | [3] |
| Structured-Light 3D Scanner (e.g., DAVID SLS-2) | High-resolution 3D model generation | Cut mark analysis, complex surface documentation | [73] |
| Landmark Digitization Software (e.g., tpsDig) | Precise coordinate acquisition | Geometric morphometric data collection | [3] [73] |
| Geometric Morphometric Software (e.g., MorphoJ) | Procrustes analysis and shape statistics | Shape variable extraction, discrimination testing | [3] |
| Statistical Computing Environment (R, Python) | Multivariate analysis and machine learning | Classification model implementation, validation | [75] [74] |
Methodological Decision Framework
The diagram below illustrates the decision pathway for selecting appropriate morphometric methods based on research objectives and sample characteristics:
Discussion and Research Implications
Contextual Performance Interpretation
The comparative performance between linear and geometric morphometrics is highly context-dependent, influenced by multiple factors:
Biological Scale of Differentiation: Linear morphometrics outperformed geometric approaches in apple cultivar identification (72.6% vs. 66.7% accuracy), suggesting that for certain classification problems with subtle but discrete morphological differences, traditional measurements may capture diagnostically relevant variation more effectively [74]. Conversely, for complex shape differences in shrew crania, geometric methods provided superior visualization and interpretation of morphological patterns [3].
Data Structure Considerations: Geometric morphometric methods require careful consideration of dimensionality. As noted in feather shape analysis, "the linear CVA requires a matrix inversion of the pooled within-group variance-covariance matrix, requiring that it be of full rank, which in turn requires more measured specimens than the sum of measurements per specimen and groups" [76]. This statistical constraint can limit the application of GM approaches with limited sample sizes.
Methodological Integration: The highest classification accuracy in apple identification (77.8%) was achieved through combined use of both techniques with post-hoc knowledge of their individual successes with particular cultivars [74]. This suggests that integrative approaches leveraging the strengths of both methodologies may optimize classification performance.
Future Research Directions
Emerging methodologies are addressing current limitations in morphometric classification:
Machine Learning Integration: Recent studies have successfully integrated geometric morphometrics with machine learning algorithms, achieving "near‐perfect accuracy and precision" in distinguishing neuronal and glial arbors [75]. Similar approaches have shown promise in archaeological applications, classifying cut marks by tool type through combined GM and machine learning techniques [73].
3D Topographical Analysis: Current research indicates that "future research should utilize complete 3D topographical information for more complex GMM and CV analyses, potentially resolving current interpretive challenges" in carnivore agency identification [50]. This represents a shift from 2D outline methods to more comprehensive 3D approaches.
Cross-Validation Optimization: New approaches to dimensionality reduction optimize cross-validation assignment rates by selecting principal component axes that maximize classification success rather than using fixed thresholds [76]. This methodological refinement addresses overfitting concerns in high-dimensional morphometric data.
Sample Size Requirements and Statistical Power in Clinical Trials
In clinical research, study samples are used to estimate and compare characteristics of target populations. However, because samples inevitably differ from their target populations, statistical inferences are subject to inherent uncertainty. Among various contributing factors, sample size plays a critical role in determining the reliability of research findings [77]. Proper sample size planning ensures that studies have adequate statistical power—the probability of correctly rejecting the null hypothesis when it is false—which has major implications for the accuracy and replicability of research findings [78]. Underpowered study designs undermine the reliability of experimental research, with growing concerns regarding randomized controlled trials (RCTs) across medical disciplines [78].
The fundamental concepts of statistical power and sample size requirements provide a critical framework for evaluating methodological approaches not only in clinical trials but also in morphological research. As we examine the comparison between geometric morphometrics and linear-based methods, understanding these statistical principles becomes essential for interpreting their discriminatory performance and generalizability [5].
Fundamental Concepts: Statistical Power and Sample Size Determination
Key Factors in Sample Size Planning
Sample size estimation is a critical component of rigorous study design. The required sample size is determined by several key factors: the expected effect size, data variability, significance level (α, typically 0.05), and desired statistical power (1-β, typically 0.8 or 80%) [77]. As sample size increases, statistical power rises and p-values decrease when a true effect is present, both gradually leveling off as they approach their respective limits [77].
The default in many scientific fields is that study designs should have at least 80% power, meaning they should find a significant effect in 8 out of 10 replications, assuming a true effect exists [78]. All else being equal, studies with high statistical power are more likely to detect genuine empirical effects, while those with lower power face an increased risk of false negative findings (Type II errors) [78].
Consequences of Inadequate Sample Size
Low statistical power permeates many research fields, limiting the clinical and scientific utility of many studies. When an actual treatment effect is correctly discovered, studies with lower power tend to overestimate the effect size, a phenomenon known as the 'winner's curse' [78]. Furthermore, the probability that a statistically significant result in underpowered studies reflects a true difference in the population is low [78].
A recent assessment of statistical power in musculoskeletal research found that less than 1 in 3 RCTs from statistically significant meta-analyses had ≥80% power to detect the corresponding summary effect. The number of RCTs with ≥80% power to detect small, medium, and large effects was 0%, 7.9%, and 37.6%, respectively [78]. This pervasive underpowering undermines the evidence base and reduces the likelihood of successful replication.
Sample Size Calculation Methods Across Study Types
Traditional Clinical Trials
For traditional clinical trials with a single primary endpoint, sample size calculations follow established formulae based on the study design and outcome type. For example, to target a precise estimate of the observed/expected (O/E) ratio in a prediction model with binary outcome, the sample size can be calculated as:
N = (1-∅) / (∅ × [SE(ln(O/E))]²)
where ∅ is the assumed true outcome prevalence and SE(ln(O/E)) is the target standard error [79].
Similarly, to target a precise estimate of the calibration slope (β), the sample size formula becomes more complex, incorporating elements of Fisher's information matrix that depend on the distribution of the linear predictor values in the external evaluation population [79].
Studies with Multiple Primary Endpoints
Clinical trials in certain therapeutic areas require two co-primary binary endpoints to evaluate treatment benefit multi-dimensionally. When evidence of effects on both co-primary endpoints is necessary to conclude that the intervention is effective, consideration of correlation between endpoints can increase trial power and consequently reduce the required sample size [80]. Methods for calculating exact power and sample size in clinical trials with two co-primary binary endpoints have been developed that incorporate this correlation, thereby improving efficiency [80].
Feasibility and Pilot Studies
Pilot and feasibility studies are crucial for determining whether follow-up trials should be conducted, yet their sample size justification has traditionally been less rigorous compared to definitive RCTs [81]. Many feasibility studies justify sample sizes based on pragmatic reasons (e.g., the ability to complete the study within constraints) or on published guidance and various rules of thumb [81].
Common rules of thumb include:
- 12 participants per arm for estimating standard deviation [81]
- 35-60 participants per arm depending on whether outcomes are continuous or binary [81]
- At least 50 participants total [81]
However, these approaches may not provide sufficient sample sizes for feasibility studies with multiple outcomes of interest. Rather than relying solely on rules of thumb, feasibility studies should be designed for, or at least report, relevant operating characteristics—specifically, the probability of determining a future trial will be feasible when it is, and the probability of determining a trial will be feasible when it is not [81].
Prediction Model Evaluation
When evaluating the performance of a model for individualized risk prediction, the sample size needs to be large enough to precisely estimate the performance measures of interest. Extended sample size calculations have been developed for evaluation of prediction models using a threshold for classification, accounting for measures such as accuracy, specificity, sensitivity, positive predictive value (PPV), negative predictive value (NPV), and F1-score [79].
Table 1: Sample Size Calculation Methods for Different Study Types
| Study Type | Key Considerations | Common Approaches |
|---|---|---|
| Traditional Clinical Trials | Effect size, variability, α, power [77] | Closed-form formulae based on primary endpoint |
| Trials with Co-primary Endpoints | Correlation between endpoints [80] | Exact methods incorporating correlation |
| Feasibility/Pilot Studies | Multiple feasibility outcomes [81] | Rules of thumb, operating characteristics |
| Prediction Model Evaluation | Threshold-based performance measures [79] | Formulae for precision of performance measures |
Statistical Analysis and Interpretation Considerations
Moving Beyond P-Values
Compared with p-values, confidence intervals provide more comprehensive information, including the direction, magnitude, statistical significance, and clinical importance of effect estimates [77]. Therefore, reporting effect estimates and 95% confidence intervals alongside p-values is essential for transparent and meaningful interpretation of research findings [77].
A small p-value may reflect a large effect size or a large sample size, which is why considering the clinical significance of findings, not just their statistical significance, remains crucial [77]. Similarly, non-significant findings may result from no effect or insufficient power, highlighting the importance of considering statistical power when interpreting negative results [77].
Analysis Methods for Different Data Types
The analysis of clinical trial data employs various statistical methodologies depending on the study design and outcome measures:
- Descriptive statistics summarize and organize the data using measures such as the mean, median, standard deviation, and interquartile range [82]
- Inferential statistics enable generalizations about a broader population, employing methods such as hypothesis testing, confidence intervals, and regression models [82]
- Survival analysis, such as Kaplan-Meier curves and Cox models, is employed for time-to-event data [82]
- Methods such as Bonferroni corrections and false discovery rate (FDR) procedures help manage multiple comparisons [82]
Methodological Connections to Morphometrics Research
Sample Size Challenges in High-Dimensional Morphometric Data
Geometric morphometric methods present unique sample size challenges due to the high-dimensional nature of the data. These methods capture comprehensive information about shapes using numerous variables, requiring careful consideration of sample size requirements [76]. The use of outline methods poses difficulties for canonical variates analysis (CVA), both due to the large number of semi-landmarks needed per specimen to describe outlines and due to the representation of semi-landmark points by two coordinates when there is only one degree of freedom per point [76].
The linear CVA requires a matrix inversion of the pooled within-group variance-covariance matrix, requiring that it be of full rank, which in turn requires more measured specimens than the sum of measurements per specimen and groups [76]. If this condition is not met, there are more degrees of freedom in the measurements than in the specimens, creating analytical challenges.
Dimensionality Reduction Approaches
To address the high dimensionality of morphometric data, several approaches to dimensionality reduction may be employed:
- Principal components analysis (PCA) reduces the dimensionality of the data by analyzing a limited number of PC scores of the specimens instead of the original data [76]
- A variable number of PC axes approach selects the number of PC axes that result in the highest cross-validation rate of correct assignments [76]
- Partial least squares regression techniques generate axes that are linear combinations of the original measurements that show the greatest covariation with classification variables [76]
Research comparing these approaches has found that classification rates based on feather shape were not highly dependent on the method used to capture shape information, but the choice of dimensionality reduction approach was more influential [76].
Table 2: Comparison of Sample Size Considerations in Clinical vs. Morphometrics Research
| Aspect | Clinical Trials | Morphometrics Research |
|---|---|---|
| Primary Constraints | Participant recruitment, ethical considerations [77] [78] | High-dimensional data, measurement complexity [76] |
| Typical Outcomes | Clinical events, patient-reported outcomes [82] | Shape coordinates, outline data [76] |
| Analysis Challenges | Multiple comparisons, missing data [82] | Dimensionality reduction, alignment [76] |
| Power Considerations | Based on effect size and variability [77] | Based on discrimination accuracy [76] |
Experimental Protocols for Power and Sample Size Determination
Protocol for Power Analysis in Clinical Trials
- Define the primary endpoint: Clearly specify the primary outcome measure that will determine study success [82]
- Establish effect size: Determine the clinically meaningful effect size based on previous literature, pilot studies, or clinical expertise [77]
- Set error rates: Choose significance level (α, typically 0.05) and power (1-β, typically 0.8-0.9) [77]
- Estimate variability: Obtain estimates of variability from previous studies or pilot data [77]
- Select statistical test: Identify the appropriate statistical test for the primary analysis [82]
- Calculate sample size: Use appropriate formula or software to calculate required sample size [79]
- Account for attrition: Inflate sample size to account for anticipated dropout or missing data [78]
- Consider practical constraints: Balance statistical requirements with feasibility and resources [81]
Protocol for Morphometric Studies
- Define classification goals: Determine the taxonomic or group discrimination objectives [76]
- Choose measurement protocol: Select appropriate geometric morphometric methods (semi-landmarks, Fourier analysis, etc.) [76]
- Conduct pilot study: Collect preliminary data to inform variability and effect size [5]
- Determine dimensionality reduction approach: Select PCA, PLS, or other method based on study goals [76]
- Estimate required sample size: Use cross-validation approaches to optimize classification rates [76]
- Plan data collection: Ensure adequate sample representation across groups of interest [5]
- Validate discrimination ability: Use cross-validation rather than resubstitution for unbiased accuracy estimates [76]
Visualization of Statistical Power Concepts
Essential Research Toolkit
Table 3: Essential Reagents and Tools for Sample Size and Power Analysis
| Tool/Reagent | Function/Purpose | Application Context |
|---|---|---|
| Power Analysis Software | Calculate sample size and power for various designs | All study types |
| Pilot Study Data | Inform effect size and variability estimates | Study planning phase |
| Statistical Expertise | Guide appropriate methodology selection | All study phases |
| Sample Size Justification Framework | Document assumptions and calculations | Protocol development |
| Cross-Validation Methods | Estimate classification accuracy | Morphometric studies [76] |
| Dimensionality Reduction Techniques | Address high-dimensional data challenges | Morphometrics [76] |
| Confidence Interval Methods | Report precision of estimates [77] | Results interpretation |
Sample size estimation is a critical component of rigorous study design across clinical and morphological research. It ensures adequate statistical power, improves precision, and facilitates meaningful interpretation of research findings [77]. The fundamental principles of power analysis apply consistently across domains, though specific methodological adaptations are needed to address the unique challenges of different research contexts, whether clinical trials with multiple endpoints [80] or morphometric studies with high-dimensional data [76].
Enhancing study power requires methodological improvements, including robust planning, stronger theoretical frameworks, multi-center collaboration, data sharing, and the use of valid, reliable outcome measures [78]. By applying rigorous sample size planning methodologies and acknowledging the limitations of underpowered studies, researchers across disciplines can strengthen the evidence base and improve the reproducibility of scientific findings.
In scientific research, accurately capturing the complexity of morphological structures, landscapes, and biological habitats is fundamental to generating reliable data. The choice between bidimensional (2D) and three-dimensional (3D) approaches represents a critical methodological crossroads with significant implications for data interpretation. While 2D methods have long served as the standard across numerous disciplines due to their accessibility and simplicity, advancements in technology have made 3D approaches increasingly viable. This guide provides an objective comparison of these methodologies, focusing on their performance in capturing topographical complexity, with particular emphasis on applications within geometric morphometrics and ecological assessments. We present experimental data and detailed protocols to inform researchers, scientists, and drug development professionals in selecting the most appropriate methodology for their specific research context.
Theoretical Framework: Geometric vs. Linear Morphometrics
The debate between 2D and 3D approaches is intrinsically linked to the evolution of morphological analysis techniques, particularly the distinction between traditional linear morphometrics (LMM) and geometric morphometrics (GMM).
Linear Morphometrics (LMM): This traditional approach relies on collecting point-to-point linear measurements (e.g., lengths, widths, and heights). While easily acquired, LMM data contains limited information about overall shape, often exhibits measurement redundancy, and can inflate perceived differences between groups based primarily on size variation rather than true shape differences [38] [21].
Geometric Morphometrics (GMM): GMM utilizes the coordinates of anatomical landmarks to provide a more holistic characterization of shape. Through Procrustes superimposition, GMM explicitly separates size (centroid size) from shape, enabling rigorous analysis of allometry (shape changes disproportionate to size) [38] [21]. This approach offers powerful visualization capabilities and is considered the current standard for comprehensive shape analysis.
As 3D data acquisition becomes more accessible, its integration with GMM represents a significant advancement for capturing the full spectrum of morphological variation, particularly for complex topographies that are poorly approximated by 2D projections.
Performance Comparison: Experimental Data
Multiple empirical studies have directly quantified the differences between 2D and 3D methodologies across various fields. The table below summarizes key experimental findings.
Table 1: Quantitative Comparisons of 2D and 3D Methodological Performance Across Disciplines
| Field of Study | Subject of Analysis | Key Performance Metrics | 2D Approach Results | 3D Approach Results | Citation |
|---|---|---|---|---|---|
| Coral Reef Ecology | Benthic Community Abundance | Cryptic Surface Area Detection | Failed to detect cryptic habitats | Half of total reef substrate (3.3 ± 0.2 m² per m² planar reef) | [83] |
| Mediterranean Ecosystem Ecology | Landscape & Animal Path Metrics | Surface Area Measurement | Baseline (projected area) | Up to 11.15% increase in geometric area | [84] |
| Mediterranean Ecosystem Ecology | Animal Path Tracking | Path Length Measurement | Baseline (projected length) | Up to 5% increase in path length | [84] |
| Geometric Morphometrics | Cichlid Mandibles (Taxonomic Discrimination) | Discrimination of Species/Sex | Effective with standard landmarks | Slight improvement when landmarks were held even | [85] |
| Geometric Morphometrics | Mammalian Skulls (Taxonomic Discrimination) | Discrimination after Allometry Removal | Lower performance, risk of size-based discrimination | Better group discrimination after removing allometry | [38] [21] |
| Neurobiology | Visual Object Processing | Cognitive Load (Induced Theta Band Response) | Higher cognitive load | Lower cognitive load (comparable to real-world objects) | [86] |
Key Implications of Comparative Data
- Ecosystem Assessment: The significant underestimation of surface area (up to 11.15%) and path length (up to 5%) in 2D ecological models [84] directly impacts habitat availability assessments, resource estimates, and energy expenditure calculations for wildlife.
- Taxonomic Studies: While 2D geometric morphometrics can effectively discriminate between groups, 3D data provides a more robust foundation, especially for accounting for allometric variation that can otherwise be misinterpreted as taxonomic difference [38] [21].
- Visual Information Processing: The finding that 3D visualizations (including Virtual Reality) induce a lower cognitive load than 2D images [86] suggests that 3D representations may be more efficient for complex data interpretation and learning.
Detailed Experimental Protocols
To ensure reproducibility and provide context for the data presented, here are the detailed methodologies from two key studies cited in this guide.
Protocol 1: Comparing 2D and 3D Geometric Morphometrics of Cichlid Mandibles
This protocol is adapted from the direct comparison study on African cichlid mandibles [85].
- Specimen Preparation: Adult mandibles from Maylandia zebra (n=36) and Tropheops "Red Cheek" (n=26) were used. Excess flesh was manually removed, and mandibles were dried for 48 hours to reduce glare for 3D scanning.
- 2D Data Acquisition:
- Imaging: Mandibles were photographed on left and right sides using a dissecting microscope (Leica M165) with a mounted digital camera (Leica DFC450 C). Each mandible was positioned laterally and held perpendicular to the lens.
- Landmarking: 2D landmarks were digitized using the TPS software suite (tpsDig2). Three datasets were created:
- Even: 4 homologous landmarks (for direct comparison with 3D).
- Standard: 8 homologous landmarks (representing common practice).
- Extended: Landmarks from both left and right sides combined.
- 3D Data Acquisition:
- Scanning: A low-cost DAVID Laser Scanner system in structured light mode was used, comprising an LED projector and a camera.
- Model Processing: 3D models were generated from multiple scans. Landmarks corresponding to the 2D "even" dataset were placed on the 3D models.
- Data Analysis: Both 2D and 3D landmark data were subjected to Generalized Procrustes Analysis (GPA) to superimpose shapes. The resulting shape variables were analyzed using multivariate statistics (e.g., Canonical Variate Analysis) to test for species and sex discrimination.
Protocol 2: Assessing 3D vs. 2D Benthic Cover on Coral Reefs
This protocol is adapted from the comprehensive reef census study in Curaçao [83].
- Site Selection: 12 reef sites along the leeward shore of Curaçao were selected, covering a range of reef types (healthy/degraded, flat/complex) at 9-14 m depth.
- Quadrant Establishment: At each site, two 40-m transects were laid parallel to shore. From these, 16 quadrats (1x1 m planar area) were established for sampling.
- 3D Reconstruction:
- Photogrammetry: Thousands of overlapping photographs of each quadrat (including cryptic spaces like overhangs and cavities) were taken using underwater cameras.
- Model Generation: Structure-from-Motion (SfM) photogrammetry software (e.g., Agisoft Metashape) was used to create high-resolution 3D models of the reef structure.
- Surface Area Calculation: The 3D surface area of the reef within each quadrat was calculated from the digital model.
- Community Cover Assessment:
- Visual Point Counts: The relative cover of benthic organisms (corals, algae, sponges, etc.) was determined by superimposing a point grid over the 3D model and identifying the organism under each point. This was done for both exposed and cryptic surfaces.
- Biomass and Biovolume Estimation:
- In Situ Measurements: The height and canopy structure of erect organisms (e.g., gorgonians, macroalgae) were measured directly in the quadrats.
- Volume Calculation: Biovolume was calculated from the 3D models and in-situ measurements.
- Conversion to Biomass: Species-specific conversion factors, developed from collected samples, were used to transform biovolume into biomass (ash-free dry weight).
Workflow and Pathway Visualizations
The following diagram illustrates the logical workflow and key decision points involved in choosing between 2D and 3D approaches for morphological and ecological studies, based on the cited research.
Diagram 1: A decision workflow for selecting between 2D and 3D morphometric approaches, integrating key findings from comparative studies.
The Scientist's Toolkit: Essential Research Solutions
The following table details key reagents, software, and equipment essential for conducting the 2D and 3D analyses described in this guide.
Table 2: Key Research Reagents and Solutions for 2D and 3D Morphometric and Ecological Studies
| Item Name | Category | Primary Function | Example Use Case | Citation |
|---|---|---|---|---|
| DAVID Laser Scanner | Hardware | Low-cost 3D data capture via structured light | Capturing 3D morphology of cichlid mandibles | [85] |
| Structure-from-Motion (SfM) Photogrammetry | Software/Method | Generating 3D models from 2D image stacks | Reconstructing 3D surface area of coral reef quadrats | [83] |
| TPS Software Suite | Software | Digitizing landmarks and outlines from 2D images | Collecting 2D landmark data from specimen photographs | [85] |
| Micro-CT Scanner | Hardware | High-resolution internal and external 3D imaging | Visualizing and analyzing hominin molar enamel-dentine junctions | [87] |
| R (with Stereomorph, geomorph packages) | Software | Statistical analysis and visualization of GMM data | Performing Procrustes superimposition and shape analysis | [85] [21] |
| Lidar Data / Digital Terrain Model | Data/Method | Providing 3D topographic information of landscapes | Calculating 3D surface metrics in ecological studies | [84] |
The choice between 2D and 3D approaches is not a simple binary but a strategic decision with measurable consequences for data integrity. The experimental evidence demonstrates that 3D approaches consistently capture topographical complexity and biological shape with greater fidelity, revealing critical information—such as cryptic habitats and true anatomical relationships—that is systematically underestimated or entirely missed by 2D projections. This is particularly crucial in geometric morphometrics, where 3D GMM more reliably discriminates taxonomic groups by effectively isolating shape from size.
However, the higher resource investment for 3D methods remains a valid consideration. Researchers must therefore weigh the specific requirements of their research questions against practical constraints. For foundational taxonomic work, ecological biomass estimates, or studies of highly complex structures, the investment in 3D is justified and often essential. For broader surveys or when tracking relative change in well-understood systems, 2D methods may still offer a viable path. Ultimately, integrating 3D methodologies, even as a piloting tool for developing more targeted 2D protocols, represents a powerful strategy for advancing the precision and reliability of morphological and ecological research.
The selection of analytical methods is pivotal in scientific research, particularly in fields reliant on morphological data for discrimination and classification tasks. The core dilemma faced by researchers involves navigating the trade-off between highly accurate but opaque "black-box" models and inherently interpretable, potentially less complex methods. This guide objectively compares the discriminatory performance of geometric morphometrics (GMM) and linear morphometrics (also termed multivariate or traditional morphometrics), framing this comparison within the broader context of interpretability in data analysis.
Geometric morphometrics utilizes landmark-based data to conserve geometric relationships throughout analysis, offering powerful visualization capabilities but often requiring complex statistical treatment [51] [17]. In contrast, linear morphometrics relies on traditional measurements (lengths, widths, ratios) and is inherently interpretable but may overlook nuanced shape information [51]. This analysis synthesizes experimental data to determine how each method performs under various research scenarios, providing a evidence-based framework for method selection in scientific applications.
Methodological Comparison
Core Principles and Workflows
The fundamental difference between these approaches lies in their data capture and processing, which directly influences their interpretability and analytical power.
Table 1: Fundamental Methodological Differences
| Feature | Geometric Morphometrics (GMM) | Linear Morphometrics (LM) |
|---|---|---|
| Data Type | Landmark and semilandmark coordinates preserving geometry [51] [17] | Linear distances, angles, indices, and ratios [51] |
| Data Capture | Digital capture of landmarks from images or specimens [17] | Calipers, rulers, or digital measurements [88] |
| Underlying Model | Procrustes superposition, statistical shape analysis [17] | Multivariate statistics (PCA, MANOVA) on measured variables [51] |
| Primary Output | Shape variables (Procrustes coordinates, warp scores) [51] | Statistical comparisons of size and simple shape measures [51] |
The following workflow diagrams illustrate the distinct analytical pathways for each method.
Experimental Evidence and Discriminatory Performance
Empirical studies across biological taxonomy and paleontology provide quantitative performance data. The following table synthesizes results from controlled experiments comparing the classification accuracy of GMM and linear-based methods.
Table 2: Experimental Comparison of Discriminatory Performance
| Study Organism / Context | Geometric Morphometrics (GMM) Performance | Linear Morphometrics (LM) Performance | Key Finding | Source |
|---|---|---|---|---|
| Catenipora Coral Species | Effectively discriminated 11 of 12 species; superior shape characterization [51] | Successfully discriminated most species; less effective than GMM for shape [51] | GMM was more effective than multivariate analysis in species discrimination [51] | [51] |
| Mammalian Species Complex (Taterillus gerbils) | Supported traditional species boundaries with moderate classification accuracy [5] | Provided comparable taxonomic resolution to GMM [5] | Both methods offered similar levels of discrimination, with GMM risk of size-based rather than shape-based discrimination [5] | [5] |
| Larimichthys crocea Dimorphism (Otolith vs. Body Morphology) | Not directly applicable; SHAP interpretability analysis used on black-box models [88] | Not directly applicable; traditional significance and PCA used [88] | Otolith morphology (71% accuracy with RF) outperformed fish body morphology (65%) for dimorphism identification [88] | [88] |
Interpretability in Analytical Models
The Interpretability Spectrum
The trade-off between model performance and interpretability is a central consideration. Inherently interpretable models, like linear models and decision trees, provide direct insight into decision-making processes [89]. Black-box models, such as deep neural networks and complex ensembles, offer high predictive power but opaque mechanics [90]. Post-hoc explanation techniques like SHAP and LIME attempt to bridge this gap by explaining black-box predictions after the fact [88] [91].
A case study on inferring ratings from reviews demonstrated that while performance often improves as interpretability decreases, this relationship is not strictly monotonic, with interpretable models sometimes outperforming black-box counterparts [92]. This underscores the importance of method-specific evaluation rather than relying on broad assumptions.
Explainable AI (XAI) in Practice
In scientific domains, explaining model decisions is crucial for validation and discovery. The SHAP (SHapley Additive exPlanations) method is prominently used to interpret black-box models by quantifying feature importance for individual predictions [88] [90]. For instance, in identifying sexual dimorphism in Larimichthys crocea, SHAP analysis revealed that specific areas of the otolith (ear bone) were most informative for classification, providing biological insights beyond mere classification [88].
Similarly, in medical imaging, Grad-CAM (Gradient-weighted Class Activation Mapping) generates heatmaps to visualize image regions influencing a model's decision. A migraine classification study using fMRI data combined high-accuracy deep learning models with Grad-CAM to localize discriminative brain regions, successfully linking model decisions to known neurofunctional patterns [93] [94].
Research Protocols and Reagent Solutions
Detailed Experimental Protocols
Protocol 1: Geometric Morphometric Analysis for Species Discrimination (Adapted from [51])
- Specimen Preparation: Select type and figured specimens. Create high-resolution digital images of transverse thin-sections under standardized magnification and lighting.
- Landmark Digitization: Digitize 28 two-dimensional landmarks and semilandmarks capturing corallite geometry using software (tpsDig2, MorphoJ).
- Procrustes Superimposition: Perform Generalized Procrustes Analysis (GPA) to isolate shape from size, position, and orientation.
- Centroid size is calculated and used as a size metric.
- Procrustes coordinates are generated for subsequent shape analysis.
- Statistical Analysis:
- Perform Relative Warp Analysis (RWA), analogous to Principal Components Analysis (PCA) on shape variables.
- Use Thin-Plate Spline (TPS) deformation grids to visualize shape changes associated with warps.
- Conduct discriminant analysis (Canonical Variate Analysis) to test species separation.
- Validation: Employ leave-one-out cross-validation to assess classification accuracy.
Protocol 2: Linear Morphometric Analysis for Species Discrimination (Adapted from [51])
- Data Collection: From the same specimen images, collect 17 quantitative morphological characters (e.g., corallite width, length, wall thickness, septal count) and qualitative traits.
- Data Preprocessing: Conduct Principal Component Analysis (PCA) on the 17 characters to reduce dimensionality and multicollinearity prior to clustering.
- Cluster Analysis: Perform hierarchical clustering (e.g., UPGMA) on the first few principal components, which account for the majority of original variance (e.g., 89.28%).
- Validation: Compare cluster results with established taxonomic classifications to determine correct discrimination rate.
The Scientist's Toolkit: Essential Research Reagents & Solutions
Table 3: Key Software and Analytical Tools
| Tool Name | Function/Brief Explanation | Application Context |
|---|---|---|
| tpsDig2 / tpsRelw | Software suite for digitizing landmarks and performing basic relative warp analyses [51]. | Geometric Morphometrics |
| MorphoJ | Integrated software for comprehensive geometric morphometric analyses, including Procrustes ANOVA and CVA [51]. | Geometric Morphometrics |
| R (geomorph package) | Powerful statistical platform with specialized packages for Procrustes-based shape analysis and visualization [5]. | Geometric Morphometrics & Statistical Analysis |
| Python (Scikit-learn) | Programming language with libraries for implementing machine learning classifiers (SVM, RF) and explanation tools (SHAP) [88] [93]. | Data Analysis & Explainable AI |
| SHAP Library | Python library to compute SHapley values and generate force plots and summary plots for model interpretation [88] [90]. | Explainable AI (XAI) |
| ImageJ / Fiji | Open-source image processing software for making standardized linear measurements and basic shape analysis [17]. | Linear Morphometrics & Image Analysis |
The choice between geometric morphometrics and linear morphometrics is not a matter of identifying a universally superior technique but of matching the method to the research objective.
- Geometric morphometrics demonstrates superior power for discrimination based on complex shape differences and provides unparalleled visualization capabilities, as evidenced in the Catenipora coral study [51]. However, its relative complexity and potential conflation of size and shape (allometry) necessitate careful implementation [5].
- Linear morphometrics offers inherent interpretability, methodological simplicity, and robust performance in many taxonomic applications, often matching GMM's discriminatory power [5]. It remains a valid and powerful approach, particularly when measurements have direct biological meaning.
For high-stakes decision-making, the scientific community is increasingly advocating for inherently interpretable models where possible, as post-hoc explanations for black-box models can be unreliable [89]. The most effective research strategy may be a complementary one: using GMM for exploratory shape analysis and discovery, while employing linear measurements and interpretable models for validation, explanation, and when the research question aligns with their strengths.
Conclusion
The comparative analysis reveals that geometric morphometrics generally offers superior discriminatory power for capturing complex shape variations independent of size, particularly after accounting for allometric effects [citation:2]. However, linear morphometrics remains valuable for specific applications where established measurement protocols exist and interpretability is paramount. The integration of both approaches with advanced computational methods, particularly deep learning and computer vision, represents the most promising future direction [citation:4][citation:5][citation:6]. For biomedical research, this synergy enables more sensitive biomarker discovery, enhanced drug screening efficiency, and improved diagnostic classification across diverse conditions from neurodegenerative diseases to cancer [citation:1][citation:4][citation:8]. Future work should focus on standardizing analysis pipelines, developing robust out-of-sample validation frameworks, and leveraging 3D topographical information to fully capture morphological complexity in clinical and research applications.
References
- 1. A Comparison of Semilandmarking Approaches in the ... [https://pmc.ncbi.nlm.nih.gov/articles/PMC10093231/]
- 2. Differences between sliding semi-landmark methods in ... [https://pmc.ncbi.nlm.nih.gov/articles/PMC2100233/]
- 3. Morphological, linear and geometric morphometric ... [https://www.sciencedirect.com/science/article/abs/pii/S0044523125001196]
- 4. Geometric morphometrics on fossil shark teeth [https://palaeo-electronica.org/content/2025/5603-geometric-morphometrics-on-fossil-shark-teeth]
- 5. The relative performance of geometric morphometrics and ... [https://www.semanticscholar.org/paper/The-relative-performance-of-geometric-morphometrics-Viacava-Blomberg/7a764370d567ee2f2006c34b23c0a1134f187181]
- 6. Do morphometric data improve phylogenetic reconstruction ... [https://bmcecolevol.biomedcentral.com/articles/10.1186/s12862-024-02313-3]
- 7. A New Era of Morphological Investigations - PubMed Central [https://pmc.ncbi.nlm.nih.gov/articles/PMC10081917/]
- 8. The relative performance of geometric morphometrics and ... [https://pubmed.ncbi.nlm.nih.gov/37006891/]
- 9. Comparison of geometric morphometric outline methods in the ... [https://pmc.ncbi.nlm.nih.gov/articles/PMC1592095/]
- 10. Digital Morphometrics: A New Upper Airway Phenotyping ... [https://pmc.ncbi.nlm.nih.gov/articles/PMC5577353/]
- 11. Data acquisition [https://www.sbmorphometrics.org/soft-dataacq.html]
- 12. Comparing the probing systems of coordinate ... [https://www.sciencedirect.com/science/article/abs/pii/S026322412030141X]
- 13. Estimating Time of Coordinate Measurements Based on the ... [https://pmc.ncbi.nlm.nih.gov/articles/PMC9573270/]
- 14. Size, shape, and form: concepts of allometry in geometric ... [https://pmc.ncbi.nlm.nih.gov/articles/PMC4896994/]
- 15. Methods for studying allometry in geometric morphometrics [https://link.springer.com/article/10.1007/s10682-022-10170-z]
- 16. A brief review of shape, form, and allometry in geometric ... [http://www.italian-journal-of-mammalogy.it/A-brief-review-of-shape-form-and-allometry-in-geometric-morphometrics-with-applications,77243,0,2.html]
- 17. Geometric morphometrics approach for classifying ... [https://www.nature.com/articles/s41598-025-85718-4]
- 18. Morphometric analysis of dog bitemarks. An experimental ... [https://www.sciencedirect.com/science/article/pii/S0379073825000301]
- 19. Morphometric analysis of dog bitemarks. An experimental ... [https://pubmed.ncbi.nlm.nih.gov/39923367/]
- 20. A practical, step-by-step, guide to taxonomic comparisons ... [https://europeanjournaloftaxonomy.eu/index.php/ejt/article/view/2527]
- 21. The relative performance of geometric morphometrics and ... [https://pmc.ncbi.nlm.nih.gov/articles/PMC10049884/]
- 22. Comparing registration methods for mapping brain change ... [https://www.sciencedirect.com/science/article/abs/pii/S1361841509000462]
- 23. Comparing Registration Methods for Mapping Brain ... [https://pmc.ncbi.nlm.nih.gov/articles/PMC2773147/]
- 24. Tensor‐based morphometry using scalar and directional ... [https://pmc.ncbi.nlm.nih.gov/articles/PMC6866509/]
- 25. Structural MRI in Frontotemporal Dementia - Research journals [https://journals.plos.org/plosone/article?id=10.1371/journal.pone.0052531]
- 26. Comparing 3 T and 1.5 T MRI for tracking Alzheimer's disease ... [https://pubmed.ncbi.nlm.nih.gov/19780044/]
- 27. TENSOR-BASED GRADING: A NOVEL PATCH- ... [https://pmc.ncbi.nlm.nih.gov/articles/PMC8643362/]
- 28. Volume changes in white matter pathways from infancy to ... [https://pmc.ncbi.nlm.nih.gov/articles/PMC12463617/]
- 29. Longitudinal deformation-based morphometry pipeline to ... [https://apertureneuro.org/article/133510-longitudinal-deformation-based-morphometry-pipeline-to-study-neuroanatomical-differences-in-structural-mri-based-on-syn-unbiased-templates]
- 30. Machine Learning for Nuclear Mechano-Morphometric ... [https://www.nature.com/articles/s41598-017-17858-1]
- 31. Cancer Biomarkers: Reflection on Recent Progress, Emerging ... [https://pmc.ncbi.nlm.nih.gov/articles/PMC12468363/]
- 32. Insights from Biomarkers & Precision Medicine 2025 [https://www.signifyresearch.net/insights/biomarkers-billions-and-breakthroughs-insights-from-biomarkers-precision-medicine-2025/]
- 33. Structural insights into GPCR signaling activated by ... [https://www.nature.com/articles/s12276-025-01497-y]
- 34. Abstract - Aston Publications Explorer [https://publications.aston.ac.uk/id/eprint/43120/]
- 35. The Novel Application of Geometric Morphometrics with ... [https://www.mdpi.com/1424-8247/14/10/953]
- 36. The Novel Application of Geometric Morphometrics with ... [https://www.bohrium.com/paper-details/the-novel-application-of-geometric-morphometrics-with-principal-component-analysis-to-existing-g-protein-coupled-receptor-gpcr-structures/811770227040714753-7368]
- 37. GPCRdb in 2025: adding odorant receptors, data mapper ... [https://pmc.ncbi.nlm.nih.gov/articles/PMC11701689/]
- 38. The relative performance of geometric morphometrics and ... [https://researchnow.flinders.edu.au/en/publications/the-relative-performance-of-geometric-morphometrics-and-linear-ba]
- 39. Geometric Morphometrics as an Analytical Tool in Plant ... [https://www.mdpi.com/2223-7747/14/5/808]
- 40. Three-dimensional (3D) photogrammetric-based geometric ... [https://www.sciencedirect.com/science/article/abs/pii/S0044523125000506]
- 41. Image-based profiling for drug discovery: due for a machine ... [https://pmc.ncbi.nlm.nih.gov/articles/PMC7754181/]
- 42. Image-based high-content screening in drug discovery [https://pubmed.ncbi.nlm.nih.gov/32561299/]
- 43. Progress and new challenges in image-based profiling [https://arxiv.org/abs/2508.05800]
- 44. Comparison of Methods for Image-Based Profiling ... [https://www.sciencedirect.com/science/article/pii/S2472555222075761]
- 45. Image-Based Profiling in Live Cells Using Live Cell Painting [https://pmc.ncbi.nlm.nih.gov/articles/PMC12514141/]
- 46. Comparison of Multivariate Data Analysis Strategies for ... [https://www.sciencedirect.com/science/article/pii/S2472555222077565]
- 47. Multivariate and Geometric Morphometrics Reveal ... [https://pmc.ncbi.nlm.nih.gov/articles/PMC12467238/]
- 48. Geometric Morphometrics as an Analytical Tool in Plant Biology [https://pmc.ncbi.nlm.nih.gov/articles/PMC11901851/]
- 49. Morphometrics and machine learning discrimination of the ... [https://www.sciencedirect.com/science/article/abs/pii/S0377839823000920]
- 50. Testing the reliability of geometric morphometric and ... [https://www.sciencedirect.com/science/article/pii/S2666033425000048]
- 51. Comparative morphometrics for species discrimination and ... [https://www.sciencedirect.com/science/article/abs/pii/S1871174X23000872]
- 52. Using Gaussian Mixture Models in plant morphometrics [https://www.sciencedirect.com/science/article/abs/pii/S1433831925000575]
- 53. Deep Learning Outperforms Geometric Morphometrics for ... [https://archaeo.peercommunityin.org/PCIArchaeology/articles/rec?id=502]
- 54. Results from FathomNet's 2025 Kaggle Competition [https://www.fathomnet.org/news/looking-at-the-bigger-picture%3A-results-from-fathomnet%E2%80%99s-2025-kaggle-competition]
- 55. Validating classification models that use morphometri... [https://www.fisheries.noaa.gov/inport/item/17790]
- 56. Optimizing high dimensional data classification with a ... [https://www.nature.com/articles/s41598-025-08699-4]
- 57. Next-Generation Morphometry for... | Nature Communications [https://www.nature.com/articles/s41467-023-36173-0?error=cookies_not_supported&code=930300dc-571b-4a43-b5be-455334a6d621]
- 58. Comparative evaluation of glomerular morphometric techniques... [https://pubmed.ncbi.nlm.nih.gov/37423891/]
- 59. Frontiers | Outliers and anomalies in training and testing datasets for... [https://www.frontiersin.org/journals/artificial-intelligence/articles/10.3389/frai.2025.1607348/full]
- 60. Dysmorphometrics: the modelling of morphological abnormalities [https://tbiomed.biomedcentral.com/articles/10.1186/1742-4682-9-5]
- 61. Data Quality Challenges: Enterprise Strategies in 2025 [https://www.alation.com/blog/data-quality-challenges-large-scale-data-environments/]
- 62. Functional data geometric morphometrics with machine ... [https://www.nature.com/articles/s41598-024-66246-z]
- 63. Machine learning models for predicting morphological ... [https://www.nature.com/articles/s41598-025-15373-2]
- 64. Integration of wing pattern morphology and deep learning ... [https://www.frontiersin.org/journals/agronomy/articles/10.3389/fagro.2025.1602164/full]
- 65. Integrating Deep Learning Derived Morphological Traits ... [https://pubmed.ncbi.nlm.nih.gov/39826140/]
- 66. Deep learning on field photography reveals the ... [https://link.springer.com/article/10.1007/s00435-025-00747-x]
- 67. Intermediate templates guided groupwise registration of ... [https://www.sciencedirect.com/science/article/abs/pii/S1053811910012000]
- 68. Choosing the Right Preregistration Template: A Guide ... [https://www.cos.io/blog/choosing-preregistration-template-guide-for-researchers]
- 69. A template and tutorial for preregistering studies using passive ... [https://pmc.ncbi.nlm.nih.gov/articles/PMC11525430/]
- 70. Comparison of Methods for Molecular Species Delimitation ... [https://pmc.ncbi.nlm.nih.gov/articles/PMC6101526/]
- 71. Genotyping-by-Sequencing in a Species Complex of ... [https://journals.plos.org/plosone/article?id=10.1371/journal.pone.0171053]
- 72. Cryptic species complex shows population-dependent ... [https://www.sciencedirect.com/science/article/pii/S0269749124016026]
- 73. Geometric Morphometrics and Machine Learning Models ... [https://www.mdpi.com/2076-3417/13/6/3967]
- 74. Can you make morphometrics work when you know the right ... [https://centaur.reading.ac.uk/79658/]
- 75. Machine learning classification reveals robust morphometric ... [https://pmc.ncbi.nlm.nih.gov/articles/PMC9828050/]
- 76. Comparison of geometric morphometric outline methods in the ... [https://frontiersinzoology.biomedcentral.com/articles/10.1186/1742-9994-3-15]
- 77. Impact of Sample Size and Its Estimation in Medical ... [https://www.sciencedirect.com/science/article/pii/S2773065425001397]
- 78. Statistical Power in Musculoskeletal Research: A Meta- ... [https://pmc.ncbi.nlm.nih.gov/articles/PMC12638596/]
- 79. Extended sample size calculations for evaluation of prediction ... [https://bmcmedresmethodol.biomedcentral.com/articles/10.1186/s12874-025-02592-4]
- 80. Exact power and sample size in clinical trials with two co- ... [https://pubmed.ncbi.nlm.nih.gov/40879443/]
- 81. Sample size justification in feasibility studies [https://pmc.ncbi.nlm.nih.gov/articles/PMC12186404/]
- 82. Statistical analysis and significance tests for clinical trial data [https://www.sciencedirect.com/science/article/pii/S1357303925000787]
- 83. Implications of 2D versus 3D surveys to measure the ... [https://link.springer.com/article/10.1007/s00338-021-02118-6]
- 84. Assessing 3D vs. 2D habitat metrics in a Mediterranean ... [https://www.sciencedirect.com/science/article/pii/S1574954122000723]
- 85. Shaping up? A direct comparison between 2D and low ... [https://link.springer.com/article/10.1007/s10641-019-00879-2]
- 86. Visual information processing of 2D, virtual 3D and real‐world ... [https://pmc.ncbi.nlm.nih.gov/articles/PMC11664642/]
- 87. Efficacy of diffeomorphic surface matching and 3D ... [https://www.sciencedirect.com/science/article/abs/pii/S0047248418300125]
- 88. Interpretability and identification of dimorphism in ... [https://www.sciencedirect.com/science/article/abs/pii/S0165783625002127]
- 89. Stop Explaining Black Box Machine Learning Models ... [https://pmc.ncbi.nlm.nih.gov/articles/PMC9122117/]
- 90. Interpreting Black-Box Models: A Review on Explainable ... [https://link.springer.com/article/10.1007/s12559-023-10179-8]
- 91. Black Box vs. Explainable AI (XAI): Understanding the Key ... [https://hellohere.medium.com/black-box-vs-explainable-ai-xai-understanding-the-key-differences-0e81a06ef944]
- 92. Demystifying the Accuracy-Interpretability Trade-Off [https://arxiv.org/html/2503.07914v1]
- 93. Interpretable Artificial Intelligence Analysis of Functional ... [https://medinform.jmir.org/2025/1/e72155]
- 94. Interpretable Artificial Intelligence Analysis of Functional ... [https://pmc.ncbi.nlm.nih.gov/articles/PMC12444220/]