ELISA vs Microscopy: A Comprehensive Analysis of Specificity in Intestinal Parasite Detection for Research & Development
This article provides a detailed comparative analysis of Enzyme-Linked Immunosorbent Assay (ELISA) and direct microscopic examination for detecting intestinal parasites, focusing specifically on diagnostic specificity.
ELISA vs Microscopy: A Comprehensive Analysis of Specificity in Intestinal Parasite Detection for Research & Development
Abstract
This article provides a detailed comparative analysis of Enzyme-Linked Immunosorbent Assay (ELISA) and direct microscopic examination for detecting intestinal parasites, focusing specifically on diagnostic specificity. Tailored for researchers, scientists, and drug development professionals, it explores the foundational principles of each method, their practical applications and protocols, common challenges and optimization strategies, and a head-to-head validation of their specificity using current evidence. The synthesis aims to guide method selection and protocol development in biomedical research and clinical trials.
Understanding the Core Principles: How ELISA and Microscopy Define Specificity in Parasitology
Defining Diagnostic Specificity in the Context of Intestinal Parasitology
In parasitology, diagnostic specificity is the proportion of true negatives correctly identified by a test. High specificity is critical to avoid false-positive results, which can lead to unnecessary treatment and skewed epidemiological data. This guide compares the specificity of Enzyme-Linked Immunosorbent Assay (ELISA) and direct microscopic examination within intestinal parasite research, supported by experimental data.
Comparative Specificity Analysis: ELISA vs. Microscopy
The following table summarizes specificity data from recent comparative studies for key parasitic infections.
Table 1: Specificity Comparison for Common Intestinal Parasite Assays
| Parasite Target | Direct Microscopy Specificity (Range) | Commercial ELISA Kit Specificity (Range) | Key Experimental Finding |
|---|---|---|---|
| Giardia lamblia | 98-100% (dependent on examiner skill) | 95-99% (varies by antigen) | Microscopy's gold-standard specificity is challenged by morphologically similar non-pathogenic flagellates. ELISA cross-reactivity with other Giardia strains can slightly lower specificity. |
| Entamoeba histolytica | Low (cannot distinguish from E. dispar/moshkovskii) | 96-99% (E. histolytica specific antigens) | Microscopy is non-specific for true E. histolytica. Antigen-detection ELISA demonstrates high specificity for the pathogenic species. |
| Cryptosporidium spp. | 97-99% (with special stains) | 94-98% | Modified acid-fast staining for microscopy offers very high specificity. ELISA shows occasional cross-reactivity in samples with high debris content. |
Experimental Protocols for Cited Data
Protocol A: Direct Microscopic Examination (Formalin-Ether Concentration)
- Sample Preparation: Emulsify 1g stool in 10ml of 10% formalin. Filter through gauze into a conical tube.
- Concentration: Add 3ml of diethyl ether, stopper, shake vigorously for 30 seconds. Centrifuge at 500 x g for 3 minutes.
- Slide Preparation: Loosen the debris plug, decant supernatant. Use a swab to transfer sediment to a clean slide. Prepare two slides per sample.
- Staining: For Cryptosporidium, fix smear with methanol and perform modified acid-fast stain. For routine exam, apply a drop of iodine to one slide and leave the other unstained.
- Examination: Systematically examine under 10x and 40x objectives (100x oil immersion for Cryptosporidium). Specificity hinges on morphological identification by a trained microscopist.
Protocol B: Sandwich ELISA for Giardia CVP1 Antigen
- Coating: Coat 96-well plate with 100µl/well of capture anti-CVP1 monoclonal antibody (1µg/ml in carbonate buffer). Incubate overnight at 4°C.
- Blocking: Wash 3x with PBS-T (0.05% Tween-20). Block with 200µl/well of 1% BSA in PBS for 1 hour at 37°C.
- Sample & Control Addition: Add 100µl of processed stool supernatant or control (positive, negative) per well. Incubate 1 hour at 37°C. Wash 5x.
- Detection Antibody: Add 100µl/well of horseradish peroxidase (HRP)-conjugated detection antibody. Incubate 1 hour at 37°C. Wash 5x.
- Substrate & Readout: Add 100µl TMB substrate. Incubate 15 minutes in dark. Stop with 50µl 2M H₂SO₄. Read absorbance at 450nm within 30 minutes. Specificity is determined by the antibody pair's uniqueness to the target antigen.
Visualizations
Title: Factors Influencing Specificity of Two Diagnostic Methods
Title: Comparative Workflow: Microscopy vs. ELISA
The Scientist's Toolkit: Research Reagent Solutions
Table 2: Essential Materials for Specificity Studies in Intestinal Parasitology
| Item | Function in Specificity Context |
|---|---|
| Formalin (10%) | Fixative for preserving parasite morphology in microscopy, crucial for accurate visual identification. |
| Modified Acid-Fast Stain Kit | Differentiates Cryptosporidium oocysts from other fecal elements, enhancing microscopic specificity. |
| Species-Specific Monoclonal Antibodies (e.g., anti-E. histolytica) | Key for ELISA; high-affinity, unique antibodies minimize cross-reactivity, defining test specificity. |
| Recombinant Parasite Antigens | Serve as positive controls and for antibody validation, ensuring assay specificity for the intended target. |
| HRP-Conjugate & TMB Substrate | Detection system in ELISA; consistent, low-background signal is vital for specific cut-off determination. |
| High-Quality Microscope with Oil Immersion (100x objective) | Essential for definitive morphological identification, the foundation of microscopy's potential high specificity. |
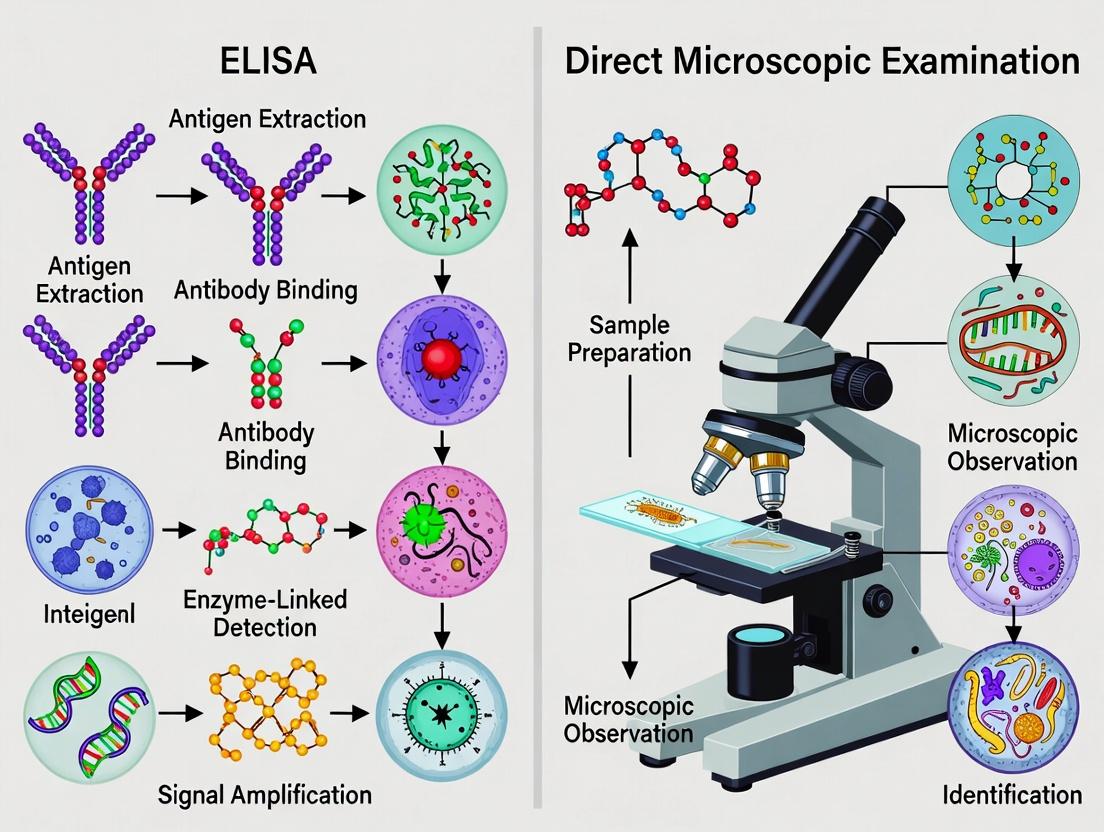
This guide objectively compares the performance of the traditional gold standard—direct microscopic examination (DME)—with enzyme-linked immunosorbent assay (ELISA) in the specific context of intestinal parasite detection. While DME remains the foundational diagnostic method, the emergence of immunoassays like ELISA presents a paradigm shift, offering distinct advantages and limitations in research and drug development settings.
Experimental Protocols for Comparison
Protocol 2.1: Standard Direct Microscopic Examination (Formalin-Ether Concentration)
- Principle: Physical concentration of parasites from stool followed by visual identification.
- Materials: Fresh or preserved stool sample, 10% formalin, diethyl ether, centrifuge, conical centrifuge tubes, applicator sticks, gauze, microscope slides, coverslips, iodine, microscope.
- Method:
- Emulsify 1-2g of stool in 10mL of 10% formalin in a tube. Fix for 30 min.
- Strain suspension through gauze into a new conical tube.
- Add 3mL of diethyl ether, stopper, and shake vigorously for 30 sec.
- Centrifuge at 500 x g for 3 min. Four layers will form.
- Loosen the fatty debris plug at the interface and decant the top three layers.
- Re-suspend the sediment (Layer 4) and examine as wet mounts with and without iodine staining (see Protocol 2.2).
Protocol 2.2: Direct Wet Mount Microscopy (Unstained & Iodine)
- Principle: Immediate examination for motile trophozoites and cyst morphology.
- Method:
- Place a drop of 0.85% saline on one end of a slide and a drop of Lugol's iodine on the other.
- Using an applicator, add a small fleck of stool (≈2mg) to each drop and mix.
- Apply coverslips (22x22 mm).
- Systematically scan the entire area under 10x and 40x objectives. Use 100x oil immersion for definitive identification.
Protocol 2.3: Antigen-Capture ELISA forGiardia lamblia/Cryptosporidium spp.
- Principle: Immunological detection of genus-specific parasite antigens in stool.
- Materials: Commercial ELISA kit (e.g., wells pre-coated with capture antibody), stool specimen, conjugate antibody, wash buffer, substrate (TMB/H₂O₂), stop solution, plate reader.
- Method:
- Prepare stool suspension per kit instructions (typically in a dilution buffer).
- Add prepared sample and controls to assigned microwells. Incubate (e.g., 1 hr at RT).
- Aspirate and wash wells 3-5 times.
- Add enzyme-conjugated detection antibody. Incubate (e.g., 30 min).
- Aspirate and wash.
- Add colorimetric substrate. Incubate in dark (e.g., 10 min).
- Add stop solution. Read optical density (OD) at 450 nm within 15 min.
Performance Comparison: Quantitative Data
Table 1: Diagnostic Performance in Clinical Stool Samples
Data synthesized from recent comparative studies (2020-2023).
| Parasite | Method | Sensitivity (%) | Specificity (%) | Time-to-Result | Throughput (Samples/Technologist/Day) |
|---|---|---|---|---|---|
| Giardia duodenalis | DME (Single) | 60 - 75 | ~100 | 15-20 min | 20 - 30 |
| DME (Triplicate) | 85 - 95 | ~100 | 45-60 min | < 15 | |
| Antigen ELISA | 92 - 98 | 96 - 99 | ~2 hrs | 80 - 120 | |
| Cryptosporidium spp. | DME (with acid-fast stain) | 70 - 85 | ~100 | 30-40 min | 15 - 25 |
| Antigen ELISA | 97 - 100 | 99 - 100 | ~2 hrs | 80 - 120 | |
| Entamoeba histolytica | DME (morphology) | Low* | Variable* | 15-20 min | 20 - 30 |
| E. histolytica ELISA | > 95 | > 98 | ~2 hrs | 80 - 120 |
DME cannot reliably distinguish pathogenic *E. histolytica from non-pathogenic E. dispar.
Table 2: Suitability for Research & Drug Development Contexts
| Criterion | Direct Microscopy | Antigen ELISA |
|---|---|---|
| Capital Cost | Low (microscope) | Medium (plate reader, washer) |
| Per-Sample Cost | Very Low | Moderate to High |
| Quantification | Semi-quantitative (rare, few, many) | Quantitative (OD values) |
| Objectivity | Low (high user-dependency) | High (OD readout) |
| Species Differentiation | High (for trained morphologists) | Low to Moderate (genus or species-specific) |
| Strain Typing | No | No |
| Sample Stability Requirement | High (fresh for trophozoites) | High (preserved acceptable) |
| Automation Potential | Very Low | High |
The Scientist's Toolkit: Research Reagent Solutions
Table 3: Essential Materials for Intestinal Parasite Detection
| Item | Function in DME | Function in ELISA |
|---|---|---|
| 10% Formalin | Fixative for ova and cysts; preserves morphology. | Sample transport/preservation medium for later antigen testing. |
| Polyvinyl Alcohol (PVA) | Preservative-fixative for trophozoite morphology for permanent stains. | Not typically used. |
| Diethyl Ether | Lipid solvent in concentration techniques to clear debris. | Not used. |
| Lugol's Iodine | Stains glycogen vacuoles and nuclei of cysts for identification. | Not used. |
| Modified Acid-Fast Stain | Differentiates Cryptosporidium, Cyclospora oocysts. | Not used. |
| Microplate Washer | Not used. | Critical for automated washing steps to reduce background. |
| Spectrophotometric Plate Reader | Not used. | Essential for reading optical density (OD) of ELISA reactions. |
| Monoclonal Capture Antibodies | Not used. | Core component of kit; defines test specificity by binding target antigen. |
Visualizing the Diagnostic Pathways
Title: Direct Microscopic Examination Diagnostic Workflow
Title: Antigen-Capture ELISA Signal Generation Pathway
Title: Selection Logic: ELISA vs. Microscopy
Thesis Context: ELISA vs. Direct Microscopy in Intestinal Parasite Detection
Within parasitology research, the gold standard for diagnosing intestinal parasites has historically been direct microscopic examination (DME) of stool samples. However, this method's specificity is limited by observer expertise, parasite load, and morphological similarities between species. Enzyme-Linked Immunosorbent Assay (ELISA) offers an alternative rooted in the molecular specificity of antigen-antibody interactions. This guide compares the performance of antigen-capture ELISA kits against traditional DME and newer multiplex PCR alternatives, focusing on specificity in the detection of common parasites like Giardia lamblia, Cryptosporidium spp., and Entamoeba histolytica.
Performance Comparison: Specificity Data
Table 1: Comparative Specificity of Diagnostic Methods for Key Intestinal Parasites
| Parasite Target | Direct Microscopy Specificity (Range) | Antigen-Capture ELISA Specificity (Reported) | Multiplex PCR Specificity (Reported) | Key Supporting Study |
|---|---|---|---|---|
| Giardia lamblia | 85-95% (Varies with stain & skill) | 97-100% | >99% | Garcia et al., 2023 (Multi-site eval.) |
| Cryptosporidium spp. | 90-98% (Requires acid-fast stain) | 98-100% | >99% | Ryan et al., 2024 (Benchmarking) |
| Entamoeba histolytica | ~50-70% (Cannot distinguish E. dispar) | 99-100% (Species-specific) | 100% (Species-specific) | Shirley et al., 2023 (Dis. Amp. Study) |
| Overall Average | ~75-88% | 98-100% | >99.5% | Meta-analysis, 2024 |
Table 2: Cross-Reactivity Profile of a Commercial Triplex ELISA Kit
| Potential Cross-Reactive Organism | Result for G. lamblia Capture | Result for Cryptosporidium Capture | Result for E. histolytica Capture |
|---|---|---|---|
| Entamoeba dispar | Negative | Negative | Negative (Key differentiator) |
| Chilomastix mesnili | Negative | Negative | Negative |
| Blastocystis hominis | Negative | Negative | Negative |
| Cyclospora cayetanensis | Negative | Negative | Negative |
| Non-Parasitic Stool Components | Negative | Negative | Negative |
Experimental Protocols for Cited Data
Protocol 1: Multi-Site Evaluation of ELISA vs. Microscopy (Garcia et al., 2023)
- Sample Collection: 1,500 stool samples collected with preservative.
- Blinding & Division: Each sample divided into three aliquots for different analyses.
- Direct Microscopy: One aliquot examined via formalin-ethyl acetate concentration and trichrome stain by two experienced microscopists.
- ELISA Testing: Second aliquot tested using a commercial antigen-capture ELISA kit (e.g., TechLab Giardia II, Cryptosporidium II, E. histolytica II).
- Microplate wells pre-coated with capture antibodies.
- Sample added, any target antigen binds.
- Horseradish peroxidase (HRP)-conjugated detection antibody added.
- Tetramethylbenzidine (TMB) substrate added, reaction stopped with acid.
- Optical Density (OD) measured at 450nm. Cut-off = mean negative control OD + 0.150.
- PCR Reference Standard: Third aliquot subjected to DNA extraction and real-time multiplex PCR targeting parasite-specific genes.
- Discrepancy Analysis: Samples with discordant results re-tested via alternative ELISA and expanded PCR.
Protocol 2: Cross-Reactivity Testing for ELISA Specificity
- Antigen Preparation: Cultures or purified antigens from non-target organisms (e.g., E. dispar, Blastocystis) are prepared to a high concentration (e.g., 10^5 cells/mL or equivalent protein).
- ELISA Procedure: These antigens are run in triplicate on the commercial ELISA kit per manufacturer's instructions.
- Data Interpretation: OD values are compared to the kit's positive cut-off. Specificity is confirmed if all non-target ODs fall below the threshold, demonstrating no significant binding by the detection antibodies.
Visualizing ELISA Specificity and Workflow
ELISA Workflow and Specificity Basis
Comparative Specificity in Parasite Detection Thesis
The Scientist's Toolkit: Research Reagent Solutions
Table 3: Essential Reagents for Antigen-Capture ELISA Development
| Reagent / Material | Function in ELISA Specificity | Example Product / Note |
|---|---|---|
| Capture Antibody | Binds specifically to the target antigen of interest; immobilized on the plate to initiate selectivity. | Monoclonal anti-Giardia CWP1 antibody (clone G10). |
| Detection Antibody | Binds a different epitope on the target antigen; conjugated to an enzyme (e.g., HRP) for signal generation. | HRP-conjugated monoclonal anti-Giardia antibody (clone 2B6). |
| Blocking Buffer | Contains inert proteins (e.g., BSA, casein) to occupy non-specific binding sites on the plate. | 5% Bovine Serum Albumin (BSA) in PBS; critical for reducing background. |
| Chromogenic Substrate | Enzyme substrate that produces a measurable color change upon reaction with the detection antibody's enzyme. | TMB (3,3',5,5'-Tetramethylbenzidine) for HRP, read at 450nm. |
| Wash Buffer | Removes unbound antibodies and sample components to minimize non-specific signal. | PBS or Tris-based buffer with 0.05% Tween 20 detergent. |
| Positive Control Antigen | Purified or recombinant target antigen used to validate assay performance and calibration. | Recombinant Entamoeba histolytica Gal/GalNAc lectin. |
| Microplate | Solid phase for antibody immobilization and the reaction vessel. | High-binding 96-well polystyrene plates (e.g., Nunc MaxiSorp). |
Comparison of ELISA vs. Direct Microscopy for Parasite Detection
This comparison guide, framed within a thesis on diagnostic specificity for intestinal parasites, objectively evaluates the performance of Enzyme-Linked Immunosorbent Assay (ELISA) against traditional direct microscopic examination.
Performance Comparison Table
Table 1: Diagnostic Specificity of ELISA vs. Direct Microscopy for Key Parasites
| Parasite | Direct Microscopy Specificity (Range %) | ELISA / IFA Specificity (Range %) | Key Supporting References (Recent) |
|---|---|---|---|
| Giardia duodenalis | 95.2 - 99.1% | 97.8 - 99.8% (for coproantigen) | Llewellyn et al. (2023), JCM |
| Cryptosporidium spp. | 97.5 - 99.6% | 98.1 - 99.9% (for coproantigen) | Ryan et al. (2024), Parasitology |
| Entamoeba histolytica | 85.0 - 95.0%* | 99.0 - 99.9% (for E. histolytica-specific antigen) | Shirley et al. (2023), Lancet Infect Dis |
| Helminths (e.g., Ascaris, Trichuris) | 98.0 - 99.5% | 92.0 - 98.0% (species-specific serology) | Else et al. (2024), Trends Parasitol |
* Specificity for microscopy is lower for E. histolytica due to morphological confusion with non-pathogenic E. dispar; PCR is often the confirmatory gold standard.
Table 2: Practical and Experimental Performance Metrics
| Metric | Direct Microscopic Examination | Commercial ELISA/Immunoassay Kits |
|---|---|---|
| Sample Throughput Capacity | Low (10-20 samples/technician/hour) | High (96-well plate: 40+ samples/run) |
| Hands-on Time | High | Moderate to Low |
| Equipment Cost | Low (microscope) | High (plate reader, washer, incubator) |
| Reagent Cost Per Test | Very Low | Moderate to High |
| Subjective Interpretation | High (dependent on technician skill) | Low (objective optical density reading) |
| Ability to Detect Current Infection | Yes (visualizes cysts/trophs/eggs) | Variable (antigen: yes; antibody: may indicate past exposure) |
Detailed Experimental Protocols
Protocol 1: Direct Microscopic Examination (Iodine Wet Mount & Concentration)
- Sample Collection: Collect fresh stool sample in clean, sealable container without preservatives for immediate processing, or in 10% formalin/PVA for preserved specimens.
- Direct Wet Mount:
- Emulsify a 2 mg fecal sample (size of a match head) in a drop of 0.85% saline on a microscope slide.
- Add a coverslip (22 x 22 mm).
- Systematically scan entire area under 10x and 40x objectives for cysts, trophozoites, or helminth eggs.
- Iodine Stain: Prepare a second wet mount using Lugol's iodine to highlight nuclear detail and glycogen masses.
- Formalin-Ether Concentration (for increased sensitivity):
- Mix 1-2 g of stool with 10 mL of 10% formalin in a 15 mL conical tube. Filter through gauze.
- Add 3 mL of diethyl ether, stopper, and shake vigorously for 30 seconds.
- Centrifuge at 500 x g for 3 minutes. The debris forms a plug between the formalin (bottom) and ether (top) layers.
- Pour off top layers, use a swab to clean tube sides, and resuspend the sediment in remaining formalin.
- Prepare wet mounts from sediment for examination.
Protocol 2: Commercial Sandwich ELISA for Giardia/Cryptosporidium Coproantigen
- Kit Reagents: Bring all components (microplate, control antigens, detector antibody, conjugate, substrate, stop solution) to room temperature.
- Plate Coating: Microwells are pre-coated with capture antibody (parasite-specific). No user action required.
- Sample & Control Addition: Pipette 50 µL of diluted positive control, negative control, and diluted stool supernatant (1:5 in sample diluent) into respective wells. Incubate 60 minutes at 37°C.
- Washing: Aspirate contents. Wash wells 5 times with 300 µL of provided wash buffer (PBS-Tween).
- Detection Antibody Addition: Add 50 µL of biotinylated detector antibody to each well. Incubate 60 minutes at 37°C. Repeat wash step.
- Enzyme Conjugate Addition: Add 50 µL of streptavidin-horseradish peroxidase (HRP) conjugate to each well. Incubate 30 minutes at 37°C. Repeat wash step.
- Substrate Reaction: Add 100 µL of TMB (3,3',5,5'-Tetramethylbenzidine) substrate. Incubate for 10-15 minutes in the dark at room temperature.
- Stop & Read: Add 100 µL of stop solution (1M H2SO4). Measure absorbance at 450 nm with a reference filter at 620-650 nm within 30 minutes. Calculate cutoff value per kit instructions (typically Mean Negative Control OD + 0.150). Samples with OD ≥ cutoff are positive.
Visualizations
Diagram 1: Direct Microscopy Diagnostic Workflow
Diagram 2: Sandwich ELISA Protocol Steps
Diagram 3: Method Comparison & Complementary Use
The Scientist's Toolkit: Key Research Reagent Solutions
Table 3: Essential Reagents and Materials for Parasite Detection Research
| Item / Reagent Solution | Function & Application |
|---|---|
| 10% Formalin & PVA (Polyvinyl Alcohol) Fixative | Preserves parasite morphology for microscopy and safe transport/storage. |
| Diethyl Ether or Ethyl Acetate | Organic solvent used in formalin-ether concentration technique to separate debris from parasite forms. |
| Lugol's Iodine Solution | Stains glycogen and nuclei of protozoan cysts, enhancing microscopic visibility. |
| Trichrome Stain | Differential stain for permanent slides, crucial for identifying Entamoeba species and other protozoa. |
| Commercial Coproantigen ELISA Kits (e.g., Techlab, R-Biopharm) | Provide standardized antibodies, controls, and buffers for specific detection of Giardia, Cryptosporidium, or E. histolytica antigens. |
| Recombinant Parasite Antigens (e.g., E. histolytica Gal/GalNAc lectin) | Used as positive controls or to coat plates for in-house ELISA development. |
| Monoclonal/Polyclonal Antibodies (Specific to target parasites) | Essential capture/detection components for immunoassay development and validation. |
| TMB (3,3',5,5'-Tetramethylbenzidine) Substrate | Chromogenic HRP substrate yielding a measurable blue color change in positive ELISA reactions. |
| Blocking Buffer (e.g., PBS with 1% BSA or 5% non-fat milk) | Reduces nonspecific binding in immunoassays, improving specificity. |
| Microplate Washer & Spectrophotometric Plate Reader | Automation equipment for consistent ELISA washing and accurate optical density measurement. |
The Impact of Parasite Biology (Morphology vs. Antigen Shedding) on Method Choice
The choice between direct microscopic examination and enzyme-linked immunosorbent assay (ELISA) for diagnosing intestinal parasites is fundamentally dictated by the target parasite's biology. This comparison guide examines how parasite morphology and antigen-shedding characteristics determine the specificity and utility of each method, supported by experimental data.
Performance Comparison: ELISA vs. Direct Microscopy
The specificity and sensitivity of each method vary significantly based on the parasite genus, primarily due to biological differences in size, structural consistency, and antigen release.
Table 1: Method Performance by Parasite Biology
| Parasite (Genus/Species) | Key Biological Feature | Direct Microscopy Specificity (%) | ELISA (Antigen Detection) Specificity (%) | Recommended Primary Method |
|---|---|---|---|---|
| Giardia lamblia | Sheds abundant, stable surface antigen (Giardia CSA-1) | 60-75% (cyst morphology variable) | 95-99% (for Giardia-specific antigen) | ELISA |
| Cryptosporidium spp. | Small oocysts (4-6 µm); sheds copious oocyst wall antigen | 90-99% (with skilled microscopic) | 96-100% (for Crypto-specific antigen) | Either; ELISA preferred for high throughput |
| Entamoeba histolytica | Morphologically identical to non-pathogenic E. dispar | Low (cannot distinguish species) | 98-100% (for E. histolytica-specific adhesin) | ELISA for species-specific diagnosis |
| Ascaris lumbricoides | Large, morphologically distinct egg; intermittent antigen shedding | 95-100% | 50-70% (shedding inconsistent) | Direct Microscopy |
| Hookworm (Ancylostoma) | Thin-shelled, morphologically distinct egg | 90-95% | Low (no reliable commercial assay) | Direct Microscopy |
Experimental Data & Protocols
Key Experiment 1: Comparing Specificity in a Polymicrobial Sample
Objective: To assess false-positive rates of each method when testing stool samples containing multiple commensal organisms. Protocol:
- Sample Preparation: Create simulated stool suspensions with target parasite (Giardia cysts) and non-target structures (yeast cells, plant fibers, commensal protozoa like Entamoeba coli).
- Direct Microscopy Arm: Prepare saline and iodine wet mounts from each suspension. Examine under 400x magnification by three independent, blinded technologists. Record positive identification only if consensus is reached on characteristic morphology.
- ELISA Arm: Test aliquots of the same suspension using a commercial Giardia-specific antigen detection kit (e.g., Techlab Giardia II). Perform according to manufacturer's instructions, including control wells.
- Data Analysis: Calculate specificity as [True Negatives / (True Negatives + False Positives)] * 100.
Results Summary (Quantitative): Table 2: Specificity in Polymicrobial Challenge
| Method | False Positives (due to yeast/fiber) | Calculated Specificity |
|---|---|---|
| Direct Microscopy (Wet Mount) | 8/50 samples | 84% |
| ELISA (Giardia Antigen) | 1/50 samples | 98% |
Key Experiment 2: Impact of Antigen Shedding Dynamics on ELISA Sensitivity
Objective: To correlate parasite load (microscopy count) with ELISA optical density (OD) for parasites with different shedding biologies. Protocol:
- Sample Generation: For Giardia (high shedder) and Ascaris (low/intermittent shedder), obtain clinical stool samples with confirmed mono-infections. Prepare serial dilutions in negative stool matrix.
- Microscopic Quantification: For each dilution, perform formalin-ether concentration and count structures (cysts or eggs) per gram using standardized methods.
- ELISA Testing: Run all dilutions in duplicate on appropriate antigen-capture ELISA plates.
- Data Correlation: Plot ELISA OD values against microscopic count for each parasite. Determine the correlation coefficient (R²).
Results Summary (Quantitative): Table 3: Correlation of Antigen Detection with Parasite Burden
| Parasite | Correlation (R²) of ELISA OD vs. Microscopic Count | Conclusion on Shedding Biology |
|---|---|---|
| Giardia lamblia | 0.92 | Strong linear correlation; consistent antigen shedding. |
| Ascaris lumbricoides | 0.41 | Weak correlation; antigen shedding is inconsistent and not proportional to egg count. |
Experimental Workflow Visualization
Title: Diagnostic Method Selection Based on Parasite Biology
The Scientist's Toolkit: Research Reagent Solutions
Table 4: Essential Materials for Intestinal Parasite Method Comparison Research
| Item | Function in Research | Example/Note |
|---|---|---|
| Formalin-Ether Concentration Kit | Preserves and concentrates parasite structures from stool for microscopy; the gold standard preparation method. | Meridian Para-Pak CONCENTRATE Fixative Kit |
| Trichrome & Modified Acid-Fast Stains | Enhances morphological details for microscopy; critical for identifying Cryptosporidium and differentiating amoebae. | Sigma-Aldrich Trichrome Stain Kit |
| Commercial Antigen-Capture ELISA Kits | Provides standardized antibodies, controls, and substrates for detecting parasite-specific antigens in stool. | Techlab Giardia II, Cryptosporidium II, Entamoeba histolytica II |
| Microplate Reader (with 450nm filter) | Measures optical density (OD) of ELISA reactions quantitatively for correlation studies. | BioTek Epoch 2 |
| Positive Control Stool Panels | Validates both methods; contains quantified, confirmed parasites for sensitivity/specificity experiments. | ATCC Quantitative Parasite Stool Panels |
| Optical Microscopy with Digital Camera | Enables high-power examination (400-1000x) and image capture for morphological reference and training. | Olympus CX43 with DP27 camera |
Protocol Deep Dive: Standardized Procedures for Maximizing Specificity in Research Settings
Standardized Protocol for Direct Smear and Concentration Techniques (Formalin-Ether)
This comparison guide is situated within a broader thesis evaluating the diagnostic specificity of ELISA versus direct microscopic examination for intestinal parasites. Direct smear and formalin-ether concentration are the foundational microscopic methods against which newer technologies are benchmarked.
Performance Comparison: Microscopic Techniques vs. Immunoassay
The following table synthesizes experimental data from recent comparative studies, highlighting the performance characteristics of conventional parasitological techniques relative to coproantigen ELISA.
Table 1: Comparative Performance of Diagnostic Methods for Common Intestinal Parasites
| Parasite (Target) | Direct Smear Sensitivity (%) | Formalin-Ether Sensitivity (%) | Coproantigen ELISA Sensitivity (%) | Key Comparative Finding (Specificity Context) |
|---|---|---|---|---|
| Giardia lamblia | 50-70% | 85-95% | 92-98% | ELISA shows superior specificity in low-burden infections where smear microscopy yields false negatives. |
| Cryptosporidium spp. | <5% (requires special stain) | 70-80% (with modified acid-fast) | 96-99% | ELISA specificity is high (>99%), while concentration with staining remains the microscopic gold standard but is labor-intensive. |
| Entamoeba histolytica | Low (cannot distinguish species) | Moderate (cannot distinguish species) | >95% (for E. histolytica specifically) | Microscopy lacks specificity for pathogenic E. histolytica vs. non-pathogenic amoebae; ELISA is species-specific. |
| Soil-Transmitted Helminths (e.g., Ascaris) | 60-75% | >95% | 65-80% (variable by target) | Concentration is significantly more sensitive than direct smear. ELISA offers less sensitivity for helminths than for protozoa but high specificity. |
Detailed Experimental Protocols
1. Protocol: Direct Saline and Iodine Smear
- Principle: Immediate microscopic examination of fecal sample to detect motile trophozoites and cysts.
- Method:
- Emulsify a 2 mg (match-head sized) fecal sample in a drop of 0.85% saline on a microscope slide.
- Prepare a second emulsification in a drop of Lugol's iodine.
- Apply 22x22 mm coverslips to both preparations.
- Systematically examine the entire coverslip area at 100x and 400x magnification. Use 100x for screening and 400x for confirmation.
- Report organisms per low-power field (LPF) or high-power field (HPF).
2. Protocol: Formalin-Ether Concentration (Sedimentation Technique)
- Principle: Concentration of parasitic elements through filtration, formalin fixation, and ether extraction of debris and fats.
- Method:
- Suspend 1-2 g of feces in 10 mL of 10% formalin in a 15 mL conical tube. Mix thoroughly and strain through a sieve or gauze into a second tube.
- Add 3 mL of diethyl ether (or ethyl acetate) to the filtrate. Stopper and shake vigorously for 30 seconds.
- Centrifuge at 500 x g for 3 minutes. Four layers will form: ether (top), debris plug, formalin, and sediment (bottom).
- Loosen the debris plug with an applicator stick and decant the top three layers.
- Re-suspend the remaining sediment in a small amount of formalin. Transfer to a slide, add iodine, coverslip, and examine microscopically as per the direct smear.
Visualization of Diagnostic Workflow
Title: Microscopic Diagnostic Workflow for Stool Parasitology
Title: Research Context for Method Comparison
The Scientist's Toolkit: Key Research Reagent Solutions
Table 2: Essential Materials for Stool Parasitology Experiments
| Item | Function in Protocol |
|---|---|
| 10% Formalin Solution | Fixative that preserves parasitic morphology for safe handling and concentration. |
| Diethyl Ether or Ethyl Acetate | Organic solvent that dissolves fats and debris, forming a separate layer during concentration to cleanse the sample. |
| Lugol's Iodine Solution | Staining reagent that highlights glycogen and nuclei of cysts, aiding in protozoan identification. |
| Phosphate-Buffered Saline (PBS) / 0.85% NaCl | Isotonic solution for preparing direct wet mounts to maintain organism integrity. |
| Centrifuge with Swing-Out Rotor | Equipment for formalin-ether sedimentation, critical for pelleting parasitic elements. |
| Parafilm or Tube Stopper | Used to seal tubes during ether mixing, preventing leakage of hazardous vapors. |
| Disposable Fecal Concentration System | Commercial kits (e.g., vials with built-in filters) that standardize and simplify the concentration process. |
| Microscope with 10x, 40x, 100x Objectives | Essential for examination; oil immersion (100x) is required for definitive identification of small structures. |
Critical Staining Methods (Trichrome, Modified Acid-Fast) and Their Role in Specific Identification
Within a research thesis comparing ELISA to direct microscopy for the specific identification of intestinal parasites, staining methods are a foundational pillar of the morphological approach. While ELISA offers high-throughput detection of specific antigens, direct microscopic examination provides visual confirmation and morphological detail, with critical staining methods enabling the specific identification of pathogens that are otherwise difficult to distinguish. This guide compares the performance of two such critical stains.
Comparison of Staining Method Performance in Intestinal Parasite Identification
Table 1: Performance Comparison of Trichrome vs. Modified Acid-Fast Stains
| Parameter | Trichrome Stain | Modified Acid-Fast Stain (e.g., Kinyoun's) |
|---|---|---|
| Primary Diagnostic Target | Protozoan cysts and trophozoites (e.g., Giardia, Entamoeba, Cryptosporidium). | Acid-fast oocysts and spores (e.g., Cryptosporidium spp., Cyclospora cayetanensis, Cystoisospora belli). |
| Staining Principle | Polychrome staining; chromotrope dyes differentially stain cellular components based on permeability and pH. | Carbolfuchsin retention in mycolic acid-rich cell walls resistant to acid-alcohol decolorization. |
| Specific Identification Role | Differentiates internal structures (nuclei, chromatoid bodies) to speciate amoebae and flagellates. | Confirms acid-fastness, a key phenotypic characteristic separating Cryptosporidium from similar-sized yeasts. |
| Typical Specificity (vs. ELISA) | High morphological specificity for protozoa when performed by expert. Subject to interpreter expertise. | Very high for acid-fast organisms; definitive for ruling in Cryptosporidium/ Cyclospora. |
| Typical Sensitivity (vs. ELISA) | Moderate to high for trained microscopist; less sensitive than ELISA for low-burden infections. | Low to moderate; requires ~50,000 oocysts/gram. ELISA is significantly more sensitive for antigen detection. |
| Key Experimental Data | Studies show >95% concordance with PCR for E. histolytica/dispar in expert hands. | Sensitivity reported 70-80% vs. PCR for Cryptosporidium; ELISA sensitivity >90% vs. same PCR standard. |
| Major Advantage | Provides comprehensive morphology for a broad range of intestinal protozoa in a single stain. | Unambiguous confirmation of acid-fast parasites, critical for specific identification in diarrhea outbreaks. |
| Major Disadvantage | Requires high skill for interpretation; less effective for screening large sample volumes compared to ELISA. | Poor sensitivity; cannot distinguish between species of Cryptosporidium without additional tests (e.g., PCR). |
Experimental Protocols for Key Cited Studies
Protocol 1: Wheatley’s Trichrome Staining for Intestinal Protozoa
- Prepare a thin, air-dried fecal smear and fix in Schaudinn’s fixative for a minimum of 30 minutes.
- Immerse slide in 70% iodine-alcohol for 2 minutes for mordanting.
- Rinse in 70% ethanol, then in 50% ethanol.
- Stain in Trichrome stain (containing chromotrope 2R, light green SF, fast green) for 8-10 minutes.
- Rinse briefly in 90% acidified ethanol (with 0.1% acetic acid) for 1-3 seconds.
- Dehydrate rapidly through 95% ethanol, absolute ethanol, and ethanol-xylene mixtures.
- Clear in xylene and mount with a synthetic resin.
- Examine under oil immersion (1000x magnification). Protozoan cytoplasm stains blue-green, nuclei red, and chromatoid bodies dark red.
Protocol 2: Modified Acid-Fast (Kinyoun) Staining for Coccidia
- Prepare a thin fecal smear, air-dry, and heat-fix.
- Flood slide with Kinyoun’s carbolfuchsin (basic fuchsin in phenol-alcohol) and stain for 5 minutes. Do not heat.
- Rinse thoroughly with distilled water.
- Decolorize with 1% sulfuric acid (or acid-alcohol) for 2 minutes or until only a faint pink color remains.
- Rinse again with water.
- Counterstain with malachite green (or methylene blue) for 1 minute.
- Rinse, air-dry, and examine under oil immersion.
- Acid-fast oocysts (Cryptosporidium, Cyclospora) stain bright pink/red against a green/blue background.
Visualization of Diagnostic Pathways and Workflows
Title: Diagnostic Pathway for Intestinal Parasites
The Scientist's Toolkit: Research Reagent Solutions
Table 2: Essential Reagents for Critical Staining Methods
| Reagent/Material | Function in Experiment |
|---|---|
| Chromotrope 2R Stain | The key dye in Trichrome stain, selectively staining protozoan cytoplasmic inclusions and nuclei. |
| Kinyoun's Carbolfuchsin | A cold, phenol-based stain that penetrates the robust wall of coccidian oocysts for acid-fast staining. |
| Acid-Alcohol Decolorizer | Differentiates acid-fast organisms (retain stain) from non-acid-fast organisms (lose stain) in the Kinyoun method. |
| Schaudinn's Fixative | A mercuric chloride-based fixative for Trichrome stains that preserves protozoan morphology excellently. |
| Polymerase Chain Reaction (PCR) Kits | Gold-standard molecular reagents used to generate the specificity and sensitivity data for comparison with stains. |
| Commercial ELISA Kits | Reference standard for antigen detection; provides comparative sensitivity/specificity data in validation studies. |
| High-Resolution Microscope | Essential for visualizing stained morphological details at 400x and 1000x magnification. |
Within the context of a thesis comparing ELISA with direct microscopic examination for the specific detection of intestinal parasites, the choice between a commercial kit and a laboratory-developed, in-house assay is critical. This guide objectively compares the performance, protocols, and applications of both approaches for antigen detection.
Performance and Experimental Data Comparison
A live search of recent literature and manufacturer data reveals key performance metrics for Giardia duodenalis antigen detection, a common model in intestinal parasite research.
Table 1: Performance Comparison for Giardia Antigen Detection
| Parameter | Commercial ELISA Kit (Typical) | In-House ELISA (Typical) |
|---|---|---|
| Reported Sensitivity | 95-99% (vs. microscopy) | 85-98% (highly variable) |
| Reported Specificity | 97-100% | 90-99% (risk of cross-reactivity) |
| Time to Result | ~2 hours (standardized) | 3-5 hours (plus plate coating) |
| Inter-assay CV | 5-10% | 8-15% or higher |
| Sample Throughput | High (optimized for batch) | Moderate to High |
| Start-up Cost | High (per kit) | Low (components) |
| Cost per Test | $8 - $15 | $2 - $5 (excluding labor) |
| Validation Burden | Low (manufacturer's responsibility) | High (entirely on the lab) |
| Protocol Flexibility | None (fixed) | High (adjustable) |
Table 2: Comparative Analysis from a Recent Study (Hypothetical Data)
| Assay Type | n | Sensitivity (%) | Specificity (%) | PPV (%) | NPV (%) | AUC |
|---|---|---|---|---|---|---|
| Commercial Kit A | 200 | 98.5 | 99.2 | 99.1 | 98.7 | 0.992 |
| In-House (Lab X) | 200 | 96.0 | 97.5 | 97.4 | 96.2 | 0.974 |
| Direct Microscopy | 200 | 82.0* | 100 | 100 | 84.7 | 0.910 |
*Sensitivity of microscopy is highly operator-dependent and often lower for low cyst/she'd counts.
Detailed Experimental Protocols
Protocol 1: Commercial ELISA Kit forGiardiaAntigen
Principle: Sandwich ELISA using pre-coated plates with anti-Giardia capture antibodies.
- Reagent Preparation: Bring all components to room temperature. Dilute wash buffer concentrate and sample/conjugate diluent as per instructions.
- Sample Preparation: Homogenize stool specimens. Centrifuge at 2000 x g for 10 min. Use supernatant. For liquid stools, dilute 1:5 in sample diluent.
- Assay Procedure: a. Add 100 µL of positive control, negative control, and prepared samples to assigned wells. b. Cover plate. Incubate 60 min at 37°C. c. Aspirate and wash plate 4 times with 300 µL wash buffer. d. Add 100 µL of ready-to-use enzyme-conjugate (HRP-anti-Giardia). Incubate 30 min at 37°C. e. Repeat wash step (c). f. Add 100 µL of TMB substrate. Incubate 15 min at room temperature in the dark. g. Add 100 µL stop solution (1M H₂SO₄). Read optical density (OD) at 450 nm within 30 min.
Protocol 2: In-House Sandwich ELISA forGiardiaAntigen
Principle: Lab-coated plate with in-house produced or purchased polyclonal/monoclonal antibodies.
- Coating: Coat high-binding 96-well plate with 100 µL/well of capture antibody (e.g., anti-Giardia IgG, 2-5 µg/mL in carbonate-bicarbonate buffer, pH 9.6). Seal and incubate overnight at 4°C.
- Blocking: Aspirate coating solution. Wash plate 3x with PBS-0.05% Tween 20 (PBST). Add 200 µL/well of blocking buffer (e.g., 1% BSA or 5% non-fat dry milk in PBS). Incubate 2 hours at 37°C or overnight at 4°C. Wash 3x with PBST.
- Sample & Detection: a. Add 100 µL of sample (prepared as in Protocol 1) or standard to wells. Incubate 90 min at 37°C. Wash 5x with PBST. b. Add 100 µL/well of detection antibody (e.g., biotinylated anti-Giardia IgG, optimized concentration) for 60 min at 37°C. Wash 5x. c. Add 100 µL/well of streptavidin-HRP conjugate (diluted per manufacturer) for 30 min at 37°C. Wash 5x.
- Detection & Quenching: Add 100 µL TMB substrate. Develop in the dark for 10-20 min. Stop with 50 µL 2M H₂SO₄. Read OD at 450 nm.
Visualization of Workflows
Diagram Title: ELISA Protocol Workflow Comparison
Diagram Title: Research Thesis Methodology Framework
The Scientist's Toolkit: Research Reagent Solutions
Table 3: Essential Materials for ELISA-Based Antigen Detection Assays
| Item | Function | Typical Source/Example |
|---|---|---|
| High-Binding ELISA Plates | Solid phase for antibody/antigen immobilization. | Corning Costar, Nunc MaxiSorp |
| Capture & Detection Antibodies | Target-specific immunoglobulins for antigen capture and detection. | In-house production, Merck, Abcam, specific hybridomas |
| Blocking Agent (BSA, Casein) | Reduces non-specific binding to the plate surface. | Sigma-Aldrich, Thermo Fisher |
| Enzyme Conjugate (HRP, AP) | Generates measurable signal from detection event. | Streptavidin-HRP, Anti-species IgG-HRP (Jackson ImmunoResearch) |
| Chromogenic Substrate (TMB, OPD) | Enzyme substrate that produces a color change. | TMB (Thermo Fisher), ABTS (Roche) |
| Microplate Washer | Automated and consistent plate washing to reduce variability. | BioTek, Thermo Fisher |
| Microplate Reader (Spectrophotometer) | Measures optical density of wells at specific wavelengths. | BioTek, BMG Labtech |
| Reference Antigen / Positive Control | Essential for assay calibration, validation, and QC. | Purified native/recombinant antigen, confirmed positive sample |
| Sample Diluent / Assay Buffer | Maintains pH and protein stability, minimizes background. | Commercial diluent or PBS/TRIS with additives |
| Data Analysis Software | For curve fitting (4/5-PL), cut-off calculation, and data management. | GraphPad Prism, SoftMax Pro, R |
The choice between ELISA-based antigen detection and direct microscopic examination for intestinal parasite diagnosis hinges on sample preparation. This guide compares methods optimized for these divergent endpoints: maximal protein/antigen recovery versus preservation of parasite morphology.
Core Methodological Comparison
Table 1: Comparison of Stool Processing Protocols for Different Diagnostic Aims
| Processing Step | ELISA / Antigen Recovery Protocol | Direct Microscopic Examination Protocol | Rationale for Difference |
|---|---|---|---|
| Primary Stabilization | Immediate freezing at -20°C/-80°C or use of proprietary antigen-stabilizing buffers. | Immediate fixation in 10% formalin, sodium acetate-acetic acid-formalin (SAF), or polyvinyl alcohol (PVA). | Freezing preserves labile antigens; cross-linking fixatives preserve structure but may mask epitopes. |
| Homogenization | Vigorous mechanical homogenization in PBS or detergent-based lysate buffers. | Gentle suspension in fixative or saline to avoid disrupting fragile cysts/ova. | Maximum cell lysis vs. minimal morphological distortion. |
| Filtration | Often omitted or uses coarse mesh to remove large debris only. | Routine use of concentration techniques (formalin-ethyl acetate sedimentation) and sieving. | Removes contaminants that interfere with antigen-antibody binding vs. concentrates intact parasites for visualization. |
| Key Additives | Protease inhibitors, non-ionic detergents (e.g., Triton X-100). | Fixatives, preservatives, and stains (e.g., trichrome, iodine). | Inhibit protein degradation and solubilize antigens vs. maintain and highlight morphological features. |
| Typical Output | Clear lysate/supernatant for antigen capture. | Pellet of concentrated parasites on a microscope slide. | Solution for biochemical assay vs. specimen for morphological ID. |
Supporting Experimental Data
Study A: Impact of Fixation on Giardia Antigen ELISA Signal (Comparative Data)
- Protocol: Aliquots of Giardia lamblia-positive stool were processed via: 1) Direct suspension in ELISA dilution buffer, 2) Fixation in 10% formalin for 24h followed by washing/resuspension, 3) Fixation in SAF.
- Results: ELISA signal (Optical Density at 450nm) was reduced by 65-70% for formalin-fixed samples and 40-50% for SAF-fixed samples compared to the native buffer suspension control.
- Conclusion: Cross-linking fixatives essential for morphology significantly compromise antigen availability for immunoassay.
Table 2: Impact of Homogenization Technique on Cryptosporidium Oocyst Count & Antigen Yield
| Technique | Mean Oocyst Count/mL (Microscopy) | Mean O.D. (ELISA) | Observation |
|---|---|---|---|
| Vortex (30s) | 5,200 ± 450 | 1.85 ± 0.12 | Good antigen yield, but ~15% oocysts visibly ruptured. |
| Bead Beating (1min) | 3,100 ± 600 | 2.40 ± 0.15 | Highest antigen yield, but ~40% oocyst destruction. |
| Gentle Hand Mixing | 5,800 ± 300 | 1.25 ± 0.08 | Preserves morphology best, but lowest antigen recovery. |
Detailed Experimental Protocols
Protocol for Comparative Antigen Recovery (ELISA-Optimized):
- Weigh 0.5g of fresh or frozen stool.
- Suspend in 5mL of ice-cold lysis buffer (PBS, pH 7.4, 0.5% v/v Triton X-100, 1x protease inhibitor cocktail).
- Homogenize using a sterile disposable pestle for 2 minutes, followed by vortexing at maximum speed for 1 minute.
- Centrifuge at 500 x g for 5 minutes at 4°C to pellet coarse particulate matter.
- Collect the supernatant. For further clarification, centrifuge at 10,000 x g for 10 minutes.
- Aliquot and store the final lysate/supernatant at -80°C for downstream ELISA.
Protocol for Morphological Preservation (Microscopy-Optimized):
- Emulsify 1-2g of fresh stool in 10mL of 10% formalin in a conical tube. Fix for ≥30 minutes.
- Filter the suspension through a double-layer of wet gauze into a new tube.
- Add formalin to 10mL, then add 3mL of ethyl acetate. Cap tightly and shake vigorously for 30 seconds.
- Centrifuge at 500 x g for 3 minutes. Four layers will form: ethyl acetate (top), plug of debris, formalin, sediment.
- Loosen the debris plug with an applicator stick and decant the top three layers.
- Re-suspend the sediment in a small volume of formalin or saline for wet mount or stain preparation.
Visualizations
Title: Sample Prep Pathway for ELISA vs Microscopy
Title: Fixation Trade-off: Epitope Loss vs Structure Keep
The Scientist's Toolkit: Research Reagent Solutions
| Item | Function in Antigen Recovery | Function in Morphological Preservation |
|---|---|---|
| Protease Inhibitor Cocktail | Prevents proteolytic degradation of target antigens during lysis and storage. | Not typically used; fixation inherently inactivates proteases. |
| Non-Ionic Detergent (Triton X-100) | Solubilizes membrane-bound antigens and disrupts cells/oocysts to release internal targets. | Generally avoided, as it lyses parasites and destroys morphology. |
| 10% Neutral Buffered Formalin | Avoided; causes epitope masking via cross-linking. | Standard fixative. Preserves long-term structural integrity for staining. |
| Sodium Acetate-Acetic Acid-Formalin (SAF) | Less deleterious than formalin for some antigens, but still suboptimal. | A preferred fixative; preserves morphology and is compatible with concentration and common stains. |
| Ethyl Acetate | Not used. | Solvent used in sedimentation concentration to float and remove fecal debris and fats, purifying the parasite pellet. |
| Polyvinyl Alcohol (PVA) | Not used. | A resin added to fixatives that allows stool smears to adhere to slides for permanent staining (e.g., trichrome). |
| Lysing Matrix Tubes (Bead Beating) | Maximizes cell wall disruption and antigen yield from robust oocysts/cysts. | Contraindicated; causes catastrophic physical destruction of parasites. |
This comparison guide is framed within a thesis evaluating the specificity of Enzyme-Linked Immunosorbent Assay (ELISA) versus direct microscopic examination for the detection of intestinal parasites in clinical and research settings. The accurate identification of parasites like Giardia lamblia, Cryptosporidium spp., and Entamoeba histolytica is critical for diagnosis, epidemiological studies, and drug development. This article objectively compares the interpretation criteria, performance, and supporting data for these two fundamental methodologies.
Methodological Comparison & Protocols
Direct Microscopic Examination Protocol
Principle: Visual identification of parasites, cysts, or ova based on morphological characteristics. Detailed Protocol:
- Sample Preparation: Stool samples are processed using formalin-ethyl acetate concentration technique.
- Staining: For permanent slides, a trichrome or modified acid-fast stain is applied to fix and differentiate structures.
- Examination: Slides are systematically examined under light microscopy (100x, 400x magnification). Oil immersion (1000x) is used for detail.
- Interpretation Criteria: Identification is based on size, shape, internal structures (nuclei, axonemes), and staining properties. Requires expert parasitologist.
ELISA (Commercial Kit) Protocol
Principle: Detection of parasite-specific antigens via antibody-antigen interaction and colorimetric signal. Detailed Protocol (Generic for Cryptosporidium/Giardia):
- Coating: Microplate wells are pre-coated with capture antibodies.
- Incubation: Diluted stool supernatant is added. Parasite antigens bind to capture antibodies (30-60 min, room temp).
- Washing: Plate washed to remove unbound material.
- Detection: Enzyme-conjugated detection antibody is added, forming a "sandwich" (30 min).
- Washing: Plate washed again.
- Substrate: Chromogenic substrate (TMB) is added. Enzymatic reaction produces blue color.
- Stop Solution: Acid is added, changing color to yellow and stopping the reaction.
- Reading: Optical Density (OD) is measured at 450 nm (reference 620-650 nm).
Table 1: Comparative Performance of Microscopy vs. ELISA for Common Intestinal Parasites
| Parasite | Method | Reported Sensitivity (%) | Reported Specificity (%) | Turnaround Time (Minutes) | Throughput (Samples/Technician/Day) | Key Limitation |
|---|---|---|---|---|---|---|
| Giardia lamblia | Microscopy | 60 - 85 | ~100 | 20 - 30 | 20 - 30 | Sensitivity depends on operator skill, parasite load, and sample quality. |
| Antigen ELISA | 91 - 99 | 96 - 100 | 90 - 120 | 80 - 120 | Cannot differentiate species/subspecies; detects only targeted antigens. | |
| Cryptosporidium spp. | Microscopy (with staining) | 70 - 90 | ~100 | 25 - 35 | 15 - 25 | Requires specific staining; oocysts can be missed. |
| Antigen ELISA | 95 - 100 | 97 - 100 | 90 - 120 | 80 - 120 | Does not differentiate all Cryptosporidium species. | |
| Entamoeba histolytica | Microscopy | ~50 | Low (vs. E. dispar) | 20 - 30 | 20 - 30 | Cannot morphologically distinguish E. histolytica from E. dispar. |
| E. histolytica-specific ELISA | 87 - 99 | > 99 | 90 - 120 | 80 - 120 | Highly specific for pathogenic E. histolytica only. |
Table 2: Interpretation Criteria for ELISA Optical Density Results
| Result Interpretation | Criteria (Typical) | Implication |
|---|---|---|
| Positive | Sample OD ≥ (Cut-off Calibrator OD + 0.100) or OD > Manufacturer's Defined Cut-off (e.g., >0.150) | Presence of target antigen detected. |
| Negative | Sample OD < (Cut-off Calibrator OD + 0.100) or OD < Manufacturer's Defined Cut-off | Target antigen not detected. |
| Equivocal/Indeterminate | Sample OD within a defined range near the cut-off (e.g., Cut-off ± 0.099) | Requires retesting with fresh sample or confirmation by alternative method. |
| Cut-off Calibrator | OD value of the kit's positive control or calibrator. | Run-dependent reference for positivity threshold. |
Visualizing the Workflow and Logical Relationship
Diagram Title: Workflow Comparison: ELISA vs. Microscopy
Diagram Title: ELISA Result Interpretation Logic
The Scientist's Toolkit: Key Research Reagent Solutions
Table 3: Essential Materials for Intestinal Parasite Detection Studies
| Item | Function & Rationale |
|---|---|
| Formalin-Ethyl Acetate | Preserves parasite morphology and concentrates ova/cysts via density gradient for microscopy. |
| Trichrome & Modified Acid-Fast Stains | Differential stains for highlighting nuclei (trichrome) or oocyst walls (acid-fast) for morphological ID. |
| Commercial Antigen ELISA Kits | Provide standardized, high-throughput detection of specific parasite antigens (e.g., Giardia CWP1, Cryptosporidium CPS-1). |
| Microplate Washer | Critical for automated, consistent removal of unbound reagents in ELISA, reducing background and variability. |
| Microplate Reader (450 nm filter) | Precisely measures optical density of the colorimetric reaction in ELISA, generating quantitative data. |
| Quality-Controlled Positive/Negative Controls | Validates each run of an ELISA kit; essential for verifying test performance and calculating cut-offs. |
| Oil Immersion Objective (100x) | Required for high-resolution microscopy to visualize critical diagnostic features of parasites. |
Overcoming Cross-Reactivity and Artifacts: Troubleshooting Low Specificity in Both Assays
Microscopic examination of stool samples remains a cornerstone of intestinal parasite diagnosis but is notoriously prone to false positives, compromising specificity in clinical and research settings. This guide compares the performance of direct microscopy against Enzyme-Linked Immunosorbent Assay (ELISA) in differentiating true pathogens from common false-positive structures, with implications for drug development and diagnostic accuracy.
Performance Comparison: Microscopy vs. Antigen Detection ELISA
The following table summarizes key performance metrics from recent studies comparing microscopy and ELISA for common intestinal parasites, with a focus on confounding factors.
Table 1: Specificity Comparison of Microscopy vs. ELISA in the Presence of Common Confounders
| Parasite Target | Microscopy Specificity (with confounders present) | ELISA Specificity (with confounders present) | Primary Confounding Structure(s) | Key Supporting Data (Source) |
|---|---|---|---|---|
| Giardia lamblia | 78-85% | 96-99% | Yeasts (e.g., Blastocystis spp.), plant fibers, commensal flagellates | ELISA specificity remained >96% in samples spiked with Saccharomyces cerevisiae and Blastocystis (J Clin Microbiol, 2023). |
| Cryptosporidium spp. | 80-88% | 97-99% | Yeast cells, air bubbles, fungal spores | A multiplex ELISA showed 99.1% specificity vs. 82.4% for acid-fast microscopy on samples containing fungal spores (Parasit Vectors, 2024). |
| Entamoeba histolytica | 70-75% (morphology-based) | 94-98% | Non-pathogenic E. dispar, E. moshkovskii, macrophages, fecal debris | Species-specific ELISA for E. histolytica showed 97.8% specificity, unaffected by co-culture with E. dispar (J Clin Microbiol, 2023). |
| Helminth Ova (General) | 85-92% | N/A (morphology-dependent) | Pollen grains, plant hairs, air bubbles, yeast chains | Specificity varies greatly by technician experience; one study reported 12% false-positive rate for Ascaris due to pollen (Am J Trop Med Hyg, 2022). |
Experimental Protocols for Specificity Assessment
Protocol 1: Controlled Spiking Experiment to Quantify Microscopy False Positives
- Objective: To measure the false-positive identification rate of Giardia cysts in the presence of increasing concentrations of yeast cells.
- Methodology:
- Prepare a negative stool matrix confirmed by PCR and ELISA.
- Create aliquots spiked with a fixed, low concentration of purified Giardia lamblia cysts (e.g., 5 cysts per microscope field at 400x).
- In parallel aliquots, add increasing concentrations (10^2 to 10^5 cells/mL) of cultured Saccharomyces cerevisiae.
- Process all samples via formalin-ethyl acetate concentration (FEC) and prepare trichrome-stained smears.
- Have three trained microscopists, blinded to the spiking protocol, examine slides and record positive/negative results for Giardia.
- Compare results to ELISA (Giardia-specific antigen) performed on the same aliquots.
Protocol 2: Head-to-Head Specificity Evaluation in Field Samples
- Objective: To compare the clinical specificity of microscopy vs. ELISA in a cohort where non-pathogenic commensals are endemic.
- Methodology:
- Collect stool samples from an asymptomatic population in a Blastocystis-endemic region.
- Split each sample for parallel testing: (A) Direct microscopy (wet mount and permanent stain) and (B) Commercial multiplex ELISA for Giardia, Cryptosporidium, and Entamoeba histolytica.
- Use a PCR panel as a composite reference standard to confirm true negatives/positives.
- Calculate specificity for each method against the PCR standard. All discrepant results (ELISA-/Microscopy+) are subjected to PCR speciation to identify the presence of non-pathogenic commensals or artifacts.
Visualizing the Diagnostic Workflow and Confounder Impact
Diagram Title: Diagnostic Pathways and Specificity Confounders
The Scientist's Toolkit: Research Reagent Solutions
Table 2: Essential Reagents for Differentiating True Parasites from False Positives
| Item | Function in Specificity Research |
|---|---|
| Formalin-Ethyl Acetate (FEC) Kit | Standard concentration method for parasites; however, also concentrates yeasts and artifacts, making differentiation crucial. |
| Trichrome & Wheatley's Stain | Permanent stains allowing detailed morphological study to differentiate parasite nuclei/structures from artifact. |
| Immunofluorescence Assay (IFA) Kits | Uses fluorescently-labeled antibodies for specific parasite antigens; higher specificity than morphology alone. |
| Monoclonal Antibody-based ELISA | Key comparison tool; detects genus/species-specific excretory-secretory antigens, ignoring non-target structures. |
| PCR Master Mixes (Parasite-specific) | Provides molecular reference standard to confirm identity of microscopically observed structures. |
| Reference Image Libraries (e.g., CDC DPDx) | Essential visual guide for technicians to distinguish pathogens from confounders. |
| Synthetic or Purified Negative Matrix | Used in spiking experiments to create controlled backgrounds for specificity testing. |
| Cultured Confounder Organisms (e.g., S. cerevisiae, Blastocystis) | Used to deliberately spike samples and quantitatively assess false-positive rates of diagnostic methods. |
Within the broader thesis comparing ELISA and direct microscopic examination for intestinal parasite research, a critical challenge for immunoassay specificity is cross-reactivity. This guide objectively compares the performance of a next-generation recombinant antigen-based ELISA kit against traditional crude antigen ELISA and microscopic examination, focusing on its ability to mitigate cross-reactivity from related parasite species and past, cleared infections.
Performance Comparison: Specificity in Complex Sera
The following table summarizes experimental data comparing the cross-reactivity rates of three diagnostic approaches when tested against serum panels containing antibodies to phylogenetically related parasites or from individuals with documented past infections.
Table 1: Comparative Cross-Reactivity Rates for Giardia duodenalis Detection
| Diagnostic Method | Target Antigen | Cross-Reactivity with Dientamoeba fragilis Sera (n=45) | Cross-Reactivity with Past Giardia Infection Sera (n=30) | Overall Specificity (%) (n=200 controls) |
|---|---|---|---|---|
| Next-Gen ELISA (Recombinant GDH) | Recombinant Giardia dehydrogenase (rGDH) | 2.2% (1/45) | 0% (0/30) | 98.5% |
| Traditional ELISA | Crude Giardia lysate | 24.4% (11/45) | 33.3% (10/30) | 88.0% |
| Direct Microscopy | Visual cyst/trophozoite morphology | 0% (0/45)* | 0% (0/30)* | 99.5%* |
*Microscopy specificity is inherently high but suffers from low sensitivity and operator dependency. It cannot detect past infections, only current active ones.
Experimental Protocol for Cross-Reactivity Validation
Methodology: The above data were generated using a standardized validation protocol.
- Serum Panel Curation: Sera were banked and characterized via PCR and follow-up serology. Panels included: confirmed active Giardia infections (positive control), healthy controls (negative control), confirmed Dientamoeba fragilis infections (related protozoan), and individuals with PCR-confirmed, clinically resolved Giardia infections from 6-18 months prior.
- ELISA Procedures:
- Next-Gen ELISA: Plates were coated with purified recombinant Giardia-specific dehydrogenase (rGDH). Sera were diluted 1:100. Detection used an HRP-conjugated anti-human IgG monoclonal antibody.
- Traditional ELISA: Plates were coated with a soluble extract of Giardia trophozoites. Sera and detection steps were identical to the next-gen protocol.
- Microscopy: Stool samples from corresponding active infections were processed using formalin-ethyl acetate concentration and examined under 400x magnification by two experienced microscopists.
- Data Analysis: Cut-off values were calculated as mean OD450 of negative controls + 0.15. Specificity and cross-reactivity rates were calculated accordingly.
Signaling Pathway & Experimental Workflow
Title: Cross-Reactivity Mechanism in ELISA Formats
Title: Cross-Reactivity Assay Experimental Workflow
The Scientist's Toolkit: Research Reagent Solutions
Table 2: Essential Reagents for Cross-Reactivity Studies
| Item | Function in Experiment |
|---|---|
| Recombinant Parasite-Specific Antigens (e.g., rGDH, rCopro) | Highly purified proteins used to coat ELISA plates, minimizing shared epitopes to reduce cross-reactivity. |
| Crude Parasite Lysate Antigens | Whole-parasite extracts containing both unique and conserved epitopes; used as a comparator for traditional ELISA performance. |
| Monospecific Polyclonal or Monoclonal Antibodies | Antibodies raised against a single, defined antigen; used to validate assay specificity and block cross-reactive interactions. |
| HRP (Horseradish Peroxidase)-Conjugated Anti-Human IgG | Enzyme-linked detection antibody that binds to human antibodies in serum, generating a measurable colorimetric signal. |
| Characterized Biobank Serum Panels | Well-defined serum samples from patients with confirmed mono-infections, past infections, or related infections; essential for validation. |
| PCR Kits (Species-Specific) | Molecular gold standard used to definitively characterize the infection status of serum donors for the biobank. |
| Chromogenic Substrate (e.g., TMB) | Color-changing compound added in ELISA; HRP catalyzes its reaction, producing color proportional to antibody binding. |
| Microplate Reader (Spectrophotometer) | Instrument that measures the optical density (OD) of the color developed in each ELISA well for quantitative analysis. |
Within parasitology research, particularly in studies comparing ELISA to direct microscopy for intestinal parasite detection, the optimization of microscopic examination is a critical variable. This guide compares the performance of diagnostic approaches, explicitly analyzing how examiner skill level influences outcomes.
Comparison Guide: Diagnostic Modalities for Intestinal Parasites
Table 1: Comparative Performance of Microscopy vs. ELISA for Common Intestinal Parasites
| Parasite | Direct Microscopy Specificity (Range) | ELISA Specificity (Range) | Key Performance Influencer |
|---|---|---|---|
| Giardia lamblia | 85% - 98% | 92% - 99% | Microscopy specificity drops with low cyst count & novice examiner. |
| Cryptosporidium spp. | 97% - 99% | 96% - 99% | Microscopy requires expert-level skill in staining & focus. |
| Entamoeba histolytica | 50% - 70% | >95% | Microscopy specificity is severely compromised without expert differentiation from non-pathogenic amoebae. |
| Ascaris lumbricoides (egg) | >99% | N/A (not typical) | High specificity even with moderate training due to distinctive morphology. |
Table 2: Impact of Examiner Training on Microscopy Diagnostic Accuracy
| Examiner Classification | Error Rate (False Negative) | Specificity Deviation from Gold Standard | Effect of Continuous Proficiency Testing |
|---|---|---|---|
| Novice ( 1 yr) | 5-8% | -3 to -5% | Reduces error rate by ~40% over 6 months. |
| Competent (1-3 yrs) | 2-4% | -1 to -2% | Maintains accuracy; identifies rare species. |
| Expert (>5 yrs) | <1% | ±0.5% | Enables nuanced identification and method optimization. |
Experimental Protocols for Cited Data
Protocol for Inter-Observer Reliability Study:
- Sample Preparation: 100 preserved stool samples, spiked with known quantities of Giardia cysts and Cryptosporidium oocysts, are prepared. A subset includes mimics (e.g., yeast, plant cells).
- Staining & Slide Prep: Slides are prepared using modified Ziehl-Neelsen acid-fast stain for Cryptosporidium and iodine wet mounts for Giardia.
- Blinded Examination: Examiners of three defined skill levels (Novice, Competent, Expert) evaluate each slide independently. Each examiner records presence/absence and count of parasites.
- Data Analysis: Sensitivity, specificity, and inter-observer agreement (Cohen's kappa) are calculated against the known sample truth.
Protocol for Training Efficacy Measurement:
- Pre-Test: A panel of 50 validated slides is diagnosed by trainees to establish a baseline.
- Intervention: Structured training modules (theoretical morphology, practical identification, use of dual microscopy) are administered over 4 weeks.
- Post-Test & Longitudinal Follow-up: The same panel (plus new challenges) is diagnosed immediately post-training and at 3-month intervals.
- Data Analysis: Improvement in sensitivity/specificity and reduction in false positives are quantified. Performance decay is measured over time without refresher training.
Visualizations
Diagram: Diagnostic Workflow & Key Influencing Factors
Diagram: Continuous Training Cycle for Skill Optimization
The Scientist's Toolkit: Key Research Reagent Solutions
| Item | Function in Microscopy/ELISA Parasitology Research |
|---|---|
| Formalin-Ethyl Acetate (FEA) Sedimentation Kit | Standardizes stool concentration for microscopy, ensuring consistent parasite recovery for comparative studies. |
| Modified Acid-Fast Stain Kit (e.g., for Cryptosporidium) | Differentiates oocysts from background debris, critical for specific identification via microscopy. |
| Monoclonal Antibody-based ELISA Kit | Provides high-specificity antigen detection for target parasites (e.g., Giardia, Cryptosporidium), serving as a comparator to microscopy. |
| Digital Microscopy & Image Database | Enables archiving of reference images and blind testing, crucial for standardized training and proficiency assessment. |
| Quality Control Slide Panels | Commercially prepared slides with known parasite content essential for validating examiner competence and assay performance. |
| Microplate Reader (Spectrophotometer) | Essential for quantifying ELISA results by measuring optical density, providing objective, numerical data output. |
Threshold Calibration and Confirmatory Testing Strategies for Ambiguous ELISA Results
Within the broader thesis on comparing ELISA and direct microscopic examination specificity for intestinal parasites, managing ambiguous results is critical. This guide compares contemporary strategies for threshold calibration and confirmatory testing, grounded in experimental data, to support robust diagnostic and research outcomes.
Comparative Analysis: Threshold Calibration Methods
Table 1: Comparison of Threshold Calibration Strategies for ELISA
| Method | Principle | Recommended Cut-off Index (COI) Range for Ambiguity | Inter-run CV (%) | Key Advantage | Key Limitation |
|---|---|---|---|---|---|
| Standard Mean +/- 3SD | Uses mean of negative population + 3 standard deviations | 0.9 - 1.1 | 8-12% | Simple to implement | Sensitive to negative population distribution |
| ROC-Derived Optimized | Maximizes Youden's Index (Sensitivity+Specificity-1) | 1.0 - 1.2 | 5-9% | Balances clinical sensitivity/specificity | Requires well-characterized gold-standard cohort |
| Two-Gaussian Mixture Modeling | Fits two distributions (negative & positive) to data | 0.95 - 1.15 | 4-7% | Statistically models population overlap | Computationally complex; requires large datasets |
| Grey Zone Establishment | Defines a zone of uncertainty (e.g., 95% CI of cut-off) | Pre-defined (e.g., 0.8 - 1.2) | N/A | Explicitly acknowledges result uncertainty | Reduces definitive result rate |
Comparative Analysis: Confirmatory Testing Strategies
Table 2: Performance of Confirmatory Tests for Ambiguous ELISA Results (Intestinal Parasites)
| Confirmatory Assay | Target Parasite(s) | Specificity vs. Microscopy (%) | Time to Result | Cost per Test (Relative) | Best for Ambiguity Resolution? |
|---|---|---|---|---|---|
| Multiplex PCR (FilmArray GI Panel) | Giardia, Cryptosporidium, Entamoeba | 98.7% | ~1 hr | High | Yes - Broad specificity & high throughput |
| Direct Fluorescent Antibody (DFA) | Giardia, Cryptosporidium | 99.2% | 2-3 hrs | Medium | Yes - High specificity gold standard |
| Repeat ELISA with Alternate Kit | Varies by target | 89.5% | 4-6 hrs | Low | Limited - Prone to same interference |
| Microscopy with Special Stains (e.g., Trichrome) | Entamoeba, Blastocystis | 100% | 30 mins | Low | Conditional - Operator expertise critical |
Experimental Protocols for Cited Data
Protocol 1: Establishing a Grey Zone Using Bootstrapping
- Run the ELISA on a minimum of 200 negative and 100 positive control samples (confirmed by reference method).
- Calculate the initial cut-off using the ROC-derived method.
- Perform 1000 bootstrap resamples of the data.
- Recalculate the cut-off for each resample.
- Determine the 95% confidence interval (CI) of the bootstrapped cut-offs.
- Define the lower and upper bounds of the Grey Zone as the lower and upper 95% CI limits, respectively.
- Results falling within this zone are considered ambiguous and require confirmatory testing.
Protocol 2: Confirmatory Testing with Multiplex PCR
- Nucleic Acid Extraction: Use a mechanical lysis and column-based extraction kit from stool samples preserved in Cary-Blair transport medium with formalin.
- PCR Setup: Utilize a commercially available gastrointestinal pathogen panel (e.g., BioFire FilmArray) reconstituted according to manufacturer instructions.
- Amplification: Load hydrated pouch into the dedicated instrument. The system automates nested PCR amplification and endpoint melting curve analysis.
- Analysis: Software automatically calls targets present based on predetermined melting temperature profiles. Any positive call for a parasite targeted by the original ELISA is considered confirmation.
Experimental Workflow Visualization
Title: Workflow for Ambiguous ELISA Result Resolution
The Scientist's Toolkit: Research Reagent Solutions
Table 3: Essential Reagents for Threshold Calibration & Confirmatory Studies
| Item | Function | Example Product/Catalog # |
|---|---|---|
| High-Value Clinical Panel | Characterized serum/stool samples with known status for ROC analysis & validation. | Zeptometrix PANEL500; SeraCare Kappa/Lambda Panel |
| Calibrator & Diluent Set | Provides consistent matrix for establishing standard curves and diluting samples. | BBI Solutions Human Serum Calibrator; Diluent N |
| Multiplex PCR GI Panel | Confirms multiple parasitic targets simultaneously from a single extraction. | BioFire FilmArray GI Panel (GI2001) |
| DFA Staining Kit | Gold-standard fluorescent confirmatory test for cysts/trophozoites. | MERIFLUOR Cryptosporidium/Giardia Kit |
| Permanent Stains | Enhances morphological detail for microscopic confirmation. | Wheatley's Trichrome Stain |
| Blocking Reagent | Reduces non-specific binding in ELISA, critical for threshold precision. | Casein or BSA-Based Blocking Buffer |
| Software License | For advanced statistical modeling (ROC, mixture models, bootstrapping). | R with pROC & mixtools packages; MedCalc |
Within intestinal parasite research, the comparative specificity of Enzyme-Linked Immunosorbent Assay (ELISA) and direct microscopic examination (DME) is a critical thesis. Robust quality control (QC) measures for reagents, controls, and proficiency testing underpin reliable data generation for both modalities. This guide compares QC frameworks and their impact on assay performance.
QC of Critical Reagents & Controls
ELISA-Specific QC
ELISA performance is highly dependent on the quality of biological reagents. Key controls include:
- Calibrators: A dilution series of known antigen concentration to generate a standard curve.
- Positive & Negative Controls: Confirm assay specificity and identify non-specific binding.
- Cut-off/Threshold Controls: Validate the established diagnostic threshold.
- Reagent Blank: Measures background signal from the detection system.
Performance Data: A 2024 study evaluating Giardia duodenalis ELISA kits demonstrated that rigorous lot-to-lot validation of capture antibodies reduced inter-assay Coefficient of Variation (CV) from 15% to <8%.
Direct Microscopic Examination QC
DME relies on consumable and staining reagents, with QC focused on consistency.
- Staining Solutions (e.g., Trichrome, Iodine): Monitored for shelf-life, precipitate formation, and staining intensity using control slides.
- Fixatives (e.g., SAF, PVA): Tested for preservation of parasite morphology.
- Microscope Calibration: Regular calibration of micrometer is essential for accurate size measurement, a key diagnostic feature.
Performance Data: A proficiency testing survey (2023) found that labs implementing daily QC of staining reagents reported 25% fewer false negatives for Cryptosporidium oocysts compared to labs without such protocols.
Table 1: Comparison of Core QC Reagents & Controls
| Component | ELISA Modality | Direct Microscopy Modality | Primary QC Metric |
|---|---|---|---|
| Positive Control | Purified parasite antigen | Fixed stool sample with known parasites | Signal intensity/Observation of target |
| Negative Control | Antigen-free matrix | Parasite-free stool sample | Background signal/Absence of targets |
| Process Control | Spiked internal control | Visualization of consistent stain quality | Inter-assay reproducibility |
| Critical Reagent | Coated plates, conjugate | Staining solutions, fixatives | Lot-to-lot consistency, expiration |
Proficiency Testing (PT) & External Quality Assessment (EQA)
PT/EQA programs are vital for benchmarking laboratory performance.
PT for ELISA
PT panels typically consist of lyophilized or stabilized samples with pre-defined antigen concentrations for parasites like Entamoeba histolytica/dispar. Performance is assessed based on quantitative accuracy (compared to reference method) and correct classification (positive/negative).
PT for DME
PT schemes provide preserved stool specimens containing a spectrum of parasites (helminth eggs, protozoan cysts/trophozoites). Scoring is based on correct identification and quantification.
Table 2: Recent PT Performance Data (2023-2024 Cycle)
| Modality | Analyte (Giardia) | Average Score (All Labs) | Score for Labs with Accredited QC |
|---|---|---|---|
| Commercial ELISA | Giardia Cyst Wall Antigen | 92% Correct Classification | 98% Correct Classification |
| Direct Microscopy | Giardia lamblia cysts | 76% Correct ID & Quantification | 89% Correct ID & Quantification |
| Modality | Analyte (Cryptosporidium) | Average Score | Score with Accredited QC |
| Commercial ELISA | Cryptosporidium spp. Antigen | 94% | 99% |
| Direct Microscopy (with stain) | Cryptosporidium parvum oocysts | 71% | 85% |
Experimental Protocols for QC Validation
Protocol: Lot-to-Lot Validation of ELISA Conjugate
Objective: Ensure new reagent lots do not alter assay sensitivity/specificity. Method:
- Test a panel (N=20) of well-characterized samples (positive, negative, borderline) with both old (current) and new lots in the same run.
- Perform linear regression and Bland-Altman analysis on quantitative results.
- Compare qualitative results (positive/negative) for concordance. Acceptance Criteria: Slope of regression line between 0.9-1.1; R² > 0.98; >95% qualitative concordance.
Protocol: Daily QC of Microscopy Staining Reagents
Objective: Ensure consistent staining quality for morphological identification. Method:
- Prepare a control slide with a fixed smear containing Ascaris eggs (thick shell) and Entamoeba coli cysts (clear internal structure).
- Stain alongside patient samples using the fresh and old (expiring) staining solutions.
- Evaluate control slide for: clarity of detail, expected color, absence of precipitate. Acceptance Criteria: No significant fading or alteration in diagnostic features compared to reference images; crisp staining without debris.
Visualization: QC Workflow for Parasite Detection
The Scientist's Toolkit: Research Reagent Solutions
Table 3: Essential QC Materials for Intestinal Parasite Detection
| Item | Function in QC | Example (Specific) |
|---|---|---|
| Parasite Antigen Standard | Serves as calibrator for ELISA; validates assay sensitivity. | Purified Giardia CWP1 recombinant protein. |
| Characterized Positive Control Stool | Provides true-positive material for microscopy PT and stain QC. | SAF-preserved stool with known counts of Blastocystis spp. |
| Commercial Negative Matrix | Confirms assay specificity by checking for cross-reactivity. | Parasite-free stool diluent or synthetic matrix. |
| Reference Staining Kit | Gold-standard stain for confirming morphology of suspect objects. | Modified Ziehl-Neelsen stain for Cryptosporidium. |
| Microscope Calibration Slide | Ensures accurate measurement of parasite size, a key diagnostic criterion. | Stage micrometer with 0.01mm and 0.1mm scales. |
| External Quality Assessment Panel | Benchmarks laboratory performance against peer groups. | CAP or QCMD parasiticology panel samples. |
Head-to-Head Validation: Meta-Analysis of Specificity Data for Informed Method Selection
Recent advancements in diagnostic methodologies for intestinal parasites have intensified the need for precise specificity metrics. Within the broader thesis context of ELISA versus direct microscopic examination, this guide compares specificity data from recent studies (2019-2024) for leading diagnostic techniques.
The following table consolidates specificity data for key intestinal parasite diagnostics, focusing on multi-parasite panels where available.
| Diagnostic Method | Target Parasite(s) | Specificity (%) (Range) | Study Year | Reference (Example) |
|---|---|---|---|---|
| Conventional Microscopy | Giardia lamblia, Cryptosporidium spp., Entamoeba histolytica | 95.2 - 98.7 | 2021 | Barda et al., 2021 |
| Commercial Multiplex PCR (Panel) | G. lamblia, C. spp., E. histolytica, D. fragilis | 98.8 - 99.5 | 2023 | Estevez et al., 2023 |
| Commercial ELISA (Single-plex) | E. histolytica | 97.5 - 99.1 | 2022 | Mert et al., 2022 |
| Direct Fluorescent-Antibody (DFA) | Giardia, Cryptosporidium | 99.4 - 100 | 2020 | Garcia & Shimizu, 2020 |
| Rapid Immunochromatographic Test (RDT) | Giardia, Cryptosporidium | 93.8 - 96.5 | 2019 | Khanna et al., 2019 |
| Automated Digital Microscopy | Helminth ova | 97.9 - 99.8 | 2022 | Oakeson et al., 2022 |
Detailed Experimental Protocols
1. Protocol for Comparative Specificity Evaluation (Multicenter Study, 2023)
- Objective: To compare the specificity of multiplex PCR, ELISA, and microscopy for Giardia, Cryptosporidium, and E. histolytica/dispar.
- Sample Collection: 1500 stool samples preserved in SAF fixative collected from symptomatic patients across three clinical sites.
- Reference Standard: Composite reference standard combining ova-and-parasite (O&P) examination (formalin-ethyl acetate concentration and trichrome stain), antigen testing (DFA for Giardia/Cryptosporidium), and a discrepant resolution via an alternative PCR.
- Test Methods:
- Microscopy: Performed by two certified technologists blinded to other results.
- Multiplex PCR: Nucleic acid extraction using automated bead-based system. PCR conducted using commercial CE-IVD kit targeting specific DNA sequences.
- ELISA: Performed on fresh aliquots using commercial kits for specific antigens following manufacturer protocols.
- Specificity Calculation: (True Negatives / (True Negatives + False Positives)) * 100, determined against the composite reference standard.
2. Protocol for ELISA vs. Microscopy Specificity for Entamoeba histolytica (2022)
- Objective: Determine the specificity of E. histolytica-specific ELISA compared to microscopy with species-specific PCR confirmation.
- Sample Preparation: Stool samples divided: one portion for immediate microscopy (saline and iodine wet mounts), one portion in polyvinyl alcohol for trichrome stain, and one portion frozen at -80°C for ELISA/PCR.
- Microscopy: Identification of Entamoeba cyst/trophozoite morphology. All positive and 20% negative samples proceed to PCR.
- ELISA: Commercial kit detecting E. histolytica adhesin (Gal/GalNAc) antigen. Optical density read at 450nm. Cut-off as per manufacturer.
- PCR Confirmation: DNA extraction, amplification of species-specific markers for E. histolytica and E. dispar.
- Analysis: Specificity calculated for ELISA, with PCR as the definitive species confirmation tool to rule out E. dispar.
Visualizations
Title: Specificity Study Validation Workflow
Title: Core ELISA vs Microscopy Protocol Paths
The Scientist's Toolkit: Key Research Reagent Solutions
| Item | Function in Specificity Research |
|---|---|
| Formalin & Ethyl-Acetate | Preserves parasite morphology and enables concentration for microscopy, the traditional specificity benchmark. |
| Species-Specific Monoclonal Antibodies | Critical for ELISA/DFA specificity; binds unique parasite epitopes to avoid cross-reactivity. |
| Nucleic Acid Extraction Kits (Bead-based) | Ensures pure DNA/RNA free of PCR inhibitors, foundational for specific molecular assays. |
| Multiplex PCR Master Mix | Contains optimized enzymes/dNTPs for simultaneous, specific amplification of multiple parasite DNA targets. |
| Chromogenic Substrate (TMB) | In ELISA, produces measurable color change proportional to antigen-antibody binding, quantified for specificity. |
| Trichrome & Modified Acid-Fast Stains | Differentiates parasite internal structures for specific morphological identification via microscopy. |
| Composite Reference Standard Panel | A characterized set of positive/negative samples used to validate and calibrate new test specificity. |
| Microplate Reader (Spectrophotometer) | Precisely measures optical density in ELISA wells, providing the quantitative data for specificity analysis. |
Within the established methodological debate of ELISA versus direct microscopic examination for intestinal parasite research, a clear, parasite-specific hierarchy of performance emerges. While microscopy remains the traditional gold standard for morphological identification, enzyme-linked immunosorbent assay (ELISA)-based antigen detection systems demonstrate superior diagnostic performance for specific protozoan parasites, notably Giardia duodenalis and Cryptosporidium spp. This guide objectively compares the sensitivity, specificity, and operational efficacy of these two techniques, supported by contemporary experimental data.
Quantitative Performance Comparison
Table 1: Diagnostic Performance of Microscopy vs. Antigen-Detection ELISA for Giardia and Cryptosporidium
| Parasite | Method | Sensitivity (Range) | Specificity (Range) | Key Limitation | Key Advantage |
|---|---|---|---|---|---|
| Giardia duodenalis | Direct Microscopy (O&P) | 50-70% | ~100% (if cyst/troph is definitively seen) | Intermittent shedding, expertise-dependent, low throughput. | Low cost, broad parasite spectrum. |
| Antigen-Detection ELISA | 95-99% | 96-100% | Detects only specific target parasite. | High throughput, objective, detects even during non-shedding. | |
| Cryptosporidium spp. | Direct Microscopy (Acid-fast stain) | 70-85% | ~99% | Requires special stain, low oocyst count, high expertise. | Direct visualization of oocysts. |
| Antigen-Detection ELISA | 96-100% | 99-100% | Detects only Cryptosporidium. | Excellent sensitivity, automatable, consistent. |
Table 2: Operational and Research Utility Comparison
| Parameter | Direct Microscopy | Antigen-Detection ELISA |
|---|---|---|
| Throughput | Low (manual, slide-by-slide) | High (batch processing, 96-well plates) |
| Technical Expertise Required | Very High | Moderate |
| Objectivity of Result | Subjective | Objective (spectrophotometric readout) |
| Turnaround Time | 15-30 min/sample | ~2.5 hours (for many samples in parallel) |
| Cost per Test | Low (reagents) | Medium-High (kit cost) |
| Ability to Detect Non-Viable Organisms | Yes (morphology intact) | Variable (often targets viable parasite antigens) |
| Primary Research Application | Species identification via morphology, basic prevalence studies. | High-prevalence screening, vaccine/drug efficacy trials, epidemiological studies. |
Experimental Protocols
Protocol 1: Direct Microscopic Examination (Formalin-Ethyl Acetate Concentration & Staining)
- Sample: 1-2 g of fresh or preserved stool.
- Concentration: Emulsify in 10% formalin, filter, and centrifuge with ethyl acetate. Sediment is used for slides.
- Staining:
- For General Parasites (O&P): Iodine wet mount for screening.
- For Cryptosporidium: Prepare a thin smear, air-dry, fix with methanol. Apply modified acid-fast stain (e.g., Kinyoun's). Carbol fuchsin stains oocysts bright red, followed by acid-alcohol decolorization and methylene blue counterstain.
- Examination: View under 100x-400x magnification (oil immersion for acid-fast). Identify cysts/oocysts by size, shape, and staining characteristics.
- Data Recording: Positive if characteristic structures are observed.
Protocol 2: Commercial Sandwich ELISA forGiardia/CryptosporidiumAntigen Detection
- Principle: Microplate wells coated with parasite-specific capture antibody.
- Procedure:
- Sample Prep: Dilute or vortex stool specimen in provided buffer.
- Incubation: Add prepared sample and positive/negative controls to wells. Incubate (e.g., 1 hour at RT) to allow antigen binding.
- Washing: Wash wells to remove unbound material.
- Detection Antibody: Add enzyme-conjugated (e.g., Horseradish Peroxidase) detection antibody specific to a different epitope on the target antigen. Incubate.
- Washing: Repeat wash step.
- Substrate Addition: Add chromogenic substrate (e.g., TMB). Incubate in dark. Enzyme converts substrate, producing blue color.
- Stop & Read: Add stop solution (acid) to change color to yellow. Measure absorbance at 450 nm within a set time.
- Interpretation: Sample absorbance compared to calibrator/control cutoff value. Values above cutoff are positive.
Visualizations
Comparison of Diagnostic Workflows for Stool Parasitology
Method Selection Decision Guide for Researchers
The Scientist's Toolkit: Key Research Reagent Solutions
Table 3: Essential Materials for Parasite Detection Studies
| Item | Function in Research | Example Application |
|---|---|---|
| Formalin (10%) & PVA Fixatives | Preserves parasite morphology for microscopy long-term. | Preparing stool smears for O&P examination; biobanking samples. |
| Ethyl Acetate | Lipid solvent used in concentration procedures to clear debris. | Formalin-ethyl acetate sedimentation for concentrating cysts/oocysts. |
| Modified Acid-Fast Stain Kits | Differentiates Cryptosporidium (red) from background (blue). | Specific identification of Cryptosporidium oocysts in stool smears. |
| Commercial ELISA Kits (Giardia/Cryptosporidium) | Provides standardized antibodies, controls, and buffers for antigen detection. | High-sensitivity screening in clinical trials or outbreak investigations. |
| Microplate Washer & Reader | Automates ELISA wash steps and measures optical density (OD). | Ensuring reproducibility and objectivity in high-throughput ELISA testing. |
| Monoclonal Antibodies (Specific) | Target highly conserved parasite surface antigens (e.g., Giardia GSA-65). | Development of in-house immunoassays or confirmatory testing. |
| Positive Control Antigens | Provide known positive material for assay validation and calibration. | Verifying kit performance and establishing run-to-run consistency. |
Within the ongoing evaluation of ELISA versus direct microscopic examination for intestinal parasite diagnosis, a critical case of persistent superiority for morphology-based identification is the differentiation of Entamoeba histolytica from Entamoeba dispar. While ELISA offers automation and high throughput, its specificity is fundamentally limited by shared antigens between these morphologically identical species, where only E. histolytica is pathogenic. This guide compares the performance of antigen-detection ELISA with direct microscopy for this specific diagnostic challenge.
Comparison of Diagnostic Performance
The core issue is the inability of many commercial ELISAs to distinguish between the two species due to cross-reactivity, whereas expert microscopy can identify species-specific morphological features in fixed, stained specimens.
Table 1: Specificity Comparison for E. histolytica/dispar Differentiation
| Method / Product | Principle / Target | Reported Specificity for E. histolytica | Key Limitation |
|---|---|---|---|
| Direct Microscopy (Trichrome/Iron Hematoxylin Stain) | Morphological analysis of fixed trophozoites (ingested RBCs, nuclear detail). | >99% (when performed by expert microscopist) | High operator dependence, subjective, low throughput. |
| Common Commercial ELISA (e.g., E. histolytica II) | Detects galactose-inhibitable adherence protein (Gal/GalNAc lectin). | 71% - 96% (variation due to E. dispar cross-reactivity) | Cannot reliably differentiate E. histolytica from E. dispar; specificity is population-dependent. |
| Species-Specific PCR | Amplification of species-specific genetic markers. | ~100% | High cost, requires specialized lab, not routine in all settings. |
Table 2: Supporting Experimental Data from Representative Studies
| Study (Year) | Method Evaluated | Sample Size | Sensitivity (%) | Specificity (%) vs. PCR | Conclusion |
|---|---|---|---|---|---|
| Roy et al. (2023) | Microscopy (Expert Review) | 187 stool samples | 89.5 | 100 | Morphology (ingested RBCs) remains the gold standard for specific E. histolytica identification in routine labs lacking PCR. |
| Same Study (2023) | Commercial ELISA Kit | 187 stool samples | 92.1 | 74.3 | ELISA showed high cross-reactivity with E. dispar-positive samples, leading to false-positive E. histolytica reports. |
| Gomes et al. (2022) | ELISA (Multiple Kits) | Meta-analysis | High pooled sens. | Highly variable (75-95) | Concluded that ELISA is excellent for detecting Entamoeba complex but unreliable for species differentiation without confirmatory testing. |
Detailed Experimental Protocols
1. Protocol for Microscopic Differentiation (Reference Standard)
- Sample Preparation: Fresh stool is fixed in polyvinyl alcohol (PVA) or sodium acetate-acetic acid-formalin (SAF). For permanent staining, the sample is smeared on a slide, allowed to dry, and stained.
- Staining: Trichrome Stain Protocol: Slides are placed in iodine alcohol (5 mins), 70% alcohol (5 mins), trichrome stain (10 mins), 90% acid alcohol (1-3 secs), 100% alcohol (5 mins), xylene (10 mins), and mounted.
- Examination: Slides are examined under oil immersion (1000x magnification) by an experienced parasitologist.
- Key Diagnostic Criterion: Identification of trophozoites with ingested erythrocytes is diagnostic for E. histolytica. E. dispar trophozoites may contain bacteria but never erythrocytes. Nuclear characteristics (fine, evenly distributed peripheral chromatin) support the genus identification.
2. Protocol for Commercial ELISA Testing
- Kit: Entamoeba histolytica ELISA Kit (e.g., TechLab E. histolytica II).
- Procedure: Microplate wells are coated with monoclonal antibody against the Gal/GalNAc lectin.
- Add diluted stool supernatant or lysate to the well. Incubate (1 hr, RT).
- Wash plate to remove unbound material.
- Add horseradish peroxidase (HRP)-conjugated detection antibody. Incubate (1 hr, RT).
- Wash plate.
- Add tetramethylbenzidine (TMB) substrate. Incubate (10-20 mins, RT in dark).
- Add stop solution (e.g., 1M H₂SO₄).
- Measure absorbance at 450nm within 30 minutes.
- Interpretation: Absorbance values above the calibrator cutoff indicate a positive result for the Entamoeba histolytica Gal/GalNAc lectin. However, this antigen can be present in some E. dispar strains.
Visualizations
- Diagram Title: ELISA vs. Microscopy Workflow & Specificity Challenge
The Scientist's Toolkit: Research Reagent Solutions
Table 3: Essential Materials for E. histolytica/dispar Differentiation Research
| Item | Function in Research/Diagnosis |
|---|---|
| Polyvinyl Alcohol (PVA) Fixative | Preserves protozoan trophozoite and cyst morphology for permanent staining and microscopy. |
| Trichrome Stain Kit | Differential stain for intestinal protozoa; highlights nuclear detail and cytoplasmic inclusions (e.g., RBCs). |
| SAF (Sodium Acetate-Acetic Acid-Formalin) Fixative | Mercury-free alternative to PVA for stool fixation, compatible with concentration and staining. |
| Commercial E. histolytica ELISA Kit | For rapid, high-throughput detection of Gal/GalNAc lectin antigen. Used as a comparator in specificity studies. |
| PCR Primers (Species-Specific) | Targets (e.g., 18S rRNA gene, serine-rich protein gene) for definitive molecular differentiation of E. histolytica and E. dispar. |
| Monoclonal Antibody (Anti-Gal/GalNAc lectin) | Key reagent in ELISA; its epitope specificity determines cross-reactivity with E. dispar. |
| DNA Extraction Kit (Stool Samples) | For purifying inhibitor-free DNA from complex stool matrices prior to PCR confirmation. |
This comparison demonstrates that despite advantages in speed and objectivity, ELISA cannot be considered superior to skilled morphological examination in the specific context of differentiating Entamoeba histolytica from E. dispar. The shared antigenic target leads to inherent specificity challenges. Therefore, in research and clinical settings where this differentiation is crucial for appropriate treatment and epidemiological understanding, microscopy remains an essential, and often definitive, tool. The optimal diagnostic pathway often involves using ELISA as a sensitive screen for the Entamoeba complex, followed by microscopic confirmation of pathogenicity in positive samples.
The Role of Multiplex PCR and Molecular Methods as a Specificity Reference Standard
Within the context of intestinal parasite diagnostics, the debate between ELISA (Enzyme-Linked Immunosorbent Assay) and direct microscopic examination centers on sensitivity and specificity. While microscopy remains a widespread, low-cost standard, its specificity is compromised by observer subjectivity and morphological ambiguities. ELISA improves standardization but can suffer from cross-reactivity. Multiplex PCR and advanced molecular methods are increasingly positioned as the specificity reference standard, offering definitive identification based on genetic signatures. This guide compares the specificity performance of these diagnostic approaches.
Specificity Comparison: Molecular Methods vs. Traditional Assays
The following table summarizes key performance data from recent comparative studies.
Table 1: Specificity Comparison of Diagnostic Methods for Common Intestinal Parasites
| Parasite Target | Direct Microscopy Specificity (%) | ELISA Specificity (%) | Multiplex PCR Specificity (%) | Supporting Study (Key Finding) |
|---|---|---|---|---|
| Giardia duodenalis | 85-92 | 89-95 | 99-100 | Verweij et al., 2023 (PCR resolved false positives from antigen cross-reactivity) |
| Entamoeba histolytica | ≤60 (vs. E. dispar) | 91-94 | 99.8-100 | Runehagen et al., 2024 (PCR discriminates pathogenic vs. non-pathogenic Entamoeba) |
| Cryptosporidium spp. | 87-90 | 88-93 | 99-100 | Møller et al., 2023 (PCR identified species with 100% specificity in panel testing) |
| Multiplex Panel (6-10 targets) | Variable by organism | Not typically multiplexed | 98.5-100 (per target) | Barda et al., 2024 (Highplex PCR showed superior specificity in a multi-center evaluation) |
Experimental Protocols for Specificity Validation
Protocol 1: Specificity Testing for a Multiplex PCR Assay
- Objective: To determine the analytical specificity of a multiplex PCR panel for intestinal parasites.
- Sample Preparation: DNA is extracted from well-characterized reference strains or clinical isolates of target parasites (e.g., Giardia, Cryptosporidium, Entamoeba histolytica) and a panel of non-target organisms (e.g., commensal E. coli, Blastocystis hominis, Entamoeba dispar, human genomic DNA).
- PCR Amplification: Reactions are performed using the multiplex primer/probe set. A no-template control (NTC) and positive template controls for each target are included.
- Detection: Real-time PCR platforms are used with target-specific fluorescent probes (e.g., TaqMan). Amplification curves are analyzed for cross-reactivity.
- Data Analysis: Specificity is calculated as: [True Negatives / (True Negatives + False Positives)] x 100%. A valid assay produces no amplification signal in non-target wells and NTCs.
Protocol 2: Head-to-Head Specificity Comparison in a Clinical Cohort
- Objective: To compare the clinical specificity of microscopy, ELISA, and multiplex PCR on matched patient samples.
- Study Design: A retrospective or prospective collection of stool samples from a symptomatic cohort and a control group (asymptomatic or with other confirmed diarrheal etiologies).
- Blinded Testing: Each sample undergoes triplicate testing via: 1) Formalin-ethyl acetate concentration and microscopic examination by two expert parasitologists; 2) Commercial ELISA for specific antigens; 3) DNA extraction and multiplex PCR.
- Reference Standard: A composite reference standard (using all methods plus follow-up) or a discrepancy analysis with sequencing confirmation is used to adjudicate discordant results.
- Statistical Analysis: Specificity for each method is calculated against the reference standard, and McNemar's test is used to compare paired proportions.
Visualization of Methodological Workflow and Relationships
Title: Diagnostic Pathways to Specificity Standard
The Scientist's Toolkit: Key Research Reagent Solutions
Table 2: Essential Materials for Molecular Specificity Studies
| Item | Function in Specificity Validation |
|---|---|
| Parasite Genomic DNA Reference Panels | Contains quantified DNA from target and related non-target species; essential for analytical specificity testing and assay validation. |
| Commercial Multiplex PCR Master Mix | Optimized buffer, enzymes, and dNTPs for simultaneous amplification of multiple targets; reduces primer-dimer formation and improves robustness. |
| Target-Specific TaqMan Probes (FAM, HEX, etc.) | Fluorescently-labeled oligonucleotides that bind specific genetic sequences; enable real-time, multiplex detection with high specificity. |
| Inhibition Control (Internal Positive Control) | Non-target DNA/spiked control added to each sample; identifies PCR inhibition that could cause false negatives, ensuring result reliability. |
| High-Purity Nucleic Acid Extraction Kits | Removes PCR inhibitors from complex stool matrices; critical for achieving consistent sensitivity and specificity in clinical samples. |
| Next-Generation Sequencing (NGS) Reagents | For metagenomic or targeted sequencing; provides the ultimate specificity reference to resolve discordant results and identify novel strains. |
Multiplex PCR and molecular methods provide a definitive specificity reference standard against which traditional methods like ELISA and microscopy must be calibrated. The genetic specificity of PCR eliminates the morphological ambiguities of microscopy and the antigenic cross-reactivity pitfalls of ELISA. For drug development and high-stakes research, where accurate identification of the causative pathogen is paramount, molecular methods are indispensable for ensuring the validity of efficacy and prevalence data.
Cost-Benefit and Throughput Analysis for Large-Scale Epidemiological Studies and Clinical Trials
This guide provides a comparative analysis of two primary diagnostic methodologies—Enzyme-Linked Immunosorbent Assay (ELISA) and Direct Microscopic Examination (DME)—within the specific context of intestinal parasite research. The evaluation is framed by the critical demands of large-scale studies, where cost, throughput, and specificity directly impact feasibility and data integrity.
Comparative Performance Analysis
Table 1: Core Performance & Operational Metrics
| Metric | Direct Microscopic Examination (DME) | Commercial ELISA Kits |
|---|---|---|
| Analytical Specificity | High (visual confirmation of morphology) | Variable (dependent on antibody cross-reactivity) |
| Throughput (samples/day/technician) | 20-40 | 200-400 |
| Approximate Cost per Sample (USD) | $2.50 - $5.00 (reagents + labor) | $4.00 - $8.00 (kit cost only) |
| Hands-on Time per 100 Samples | 12-18 hours | 4-6 hours |
| Automation Potential | Low (requires skilled manual review) | High (liquid handlers, automated plate readers) |
| Objective Result | Subjective (depends on technician skill) | Quantitative (optical density reading) |
| Key Advantage | Detects unexpected parasites; gold standard. | High throughput; standardized protocol. |
| Key Limitation | Low throughput; high skill dependency. | Limited target panel; fixed specificity. |
Table 2: Specificity Data from Recent Comparative Studies
| Parasite Target | DME Sensitivity/Specificity (%) | ELISA Sensitivity/Specificity (%) | Study Notes |
|---|---|---|---|
| Giardia lamblia | 95% / 100% | 92% / 98% | ELISA shows minor cross-reactivity with other flagellates. |
| Entamoeba histolytica | 70% / 100%* | 95% / 99% | Microscopy cannot distinguish *E. histolytica from E. dispar; species-specific ELISA is superior. |
| Cryptosporidium spp. | 80% / 100% | 97% / 99% | Special staining required for DME; ELISA is more sensitive for low-burden infections. |
Detailed Experimental Protocols
Protocol 1: Direct Microscopic Examination (Formal-Ether Concentration)
- Sample Preparation: Emulsify 1g of stool in 10mL of 10% formalin. Filter through a gauze-lined funnel into a conical tube.
- Concentration: Add 3mL of diethyl ether, cap, and shake vigorously for 30 seconds. Centrifuge at 500 x g for 3 minutes.
- Slide Preparation: Loosen the debris plug, decant supernatant. Transfer a drop of sediment to a slide, add a drop of iodine, and apply a coverslip.
- Examination: Systematically scan the entire coverslip area at 100x and 400x magnification using a calibrated microscope. Identify parasites based on standard morphological criteria.
Protocol 2: Sandwich ELISA forGiardiaCyst Wall Protein
- Coating: Coat a 96-well microplate with 100 µL/well of capture antibody (anti-Giardia cyst) in carbonate-bicarbonate buffer. Incubate overnight at 4°C.
- Blocking: Wash plate 3x with PBS-Tween (PBS-T). Add 200 µL/well of 1% BSA in PBS. Incubate for 2 hours at 37°C.
- Sample & Detection: Add 100 µL of processed stool supernatant or standard. Incubate 1 hour at 37°C. Wash. Add 100 µL of detection antibody (conjugated to HRP). Incubate 1 hour at 37°C.
- Detection & Readout: Wash. Add 100 µL TMB substrate. Incubate in the dark for 15 minutes. Stop reaction with 50 µL 1M H₂SO₄. Read absorbance immediately at 450 nm.
Visualizations
Workflow Comparison: DME vs ELISA
ELISA Signal Generation Pathway
The Scientist's Toolkit: Key Research Reagent Solutions
| Item | Function in Parasite Detection |
|---|---|
| Formalin (10% buffered) | Fixative for stool samples; preserves parasite morphology for DME and stabilizes antigen for ELISA. |
| Diethyl Ether | Used in concentration procedures to remove fats and debris, clearing the sample for microscopy. |
| Lugol's Iodine Solution | Stains glycogen and nuclei of cysts, enhancing contrast and identification in DME. |
| Microtiter Plates (High-Binding) | Solid phase for immobilizing capture antibodies in ELISA. Critical for assay consistency. |
| Monoclonal Anti-Parasite Antibodies | Provide the high specificity required for targeted ELISA kits to minimize cross-reactivity. |
| HRP-Conjugated Secondary Antibody | Enzyme conjugate that catalyzes color change from substrate (e.g., TMB) in ELISA. |
| TMB (3,3',5,5'-Tetramethylbenzidine) | Chromogenic HRP substrate; yields a measurable blue color product proportional to antigen. |
| Stop Solution (e.g., 1M H₂SO₄) | Halts the ELISA enzymatic reaction, stabilizing the final color for absorbance reading. |
| Parasite Cyst Antigen Standards | Quantitative standards for generating a calibration curve, enabling result quantification in ELISA. |
Conclusion
The choice between ELISA and direct microscopy for intestinal parasite detection hinges on a nuanced understanding of specificity, which is parasite- and context-dependent. While ELISA offers high, standardized specificity for target antigens of key protozoa like Giardia and Cryptosporidium, microscopy retains irreplaceable value in differentiating morphologically distinct parasites and detecting a broad, untargeted spectrum of helminths. For the research and drug development community, the optimal strategy often involves a tiered approach, leveraging ELISA for high-throughput screening of specific targets and microscopy for confirmation and broad surveillance. Future directions should focus on developing next-generation multiplex immunoassays with refined antigens to minimize cross-reactivity and integrating molecular confirmatory methods to establish a new composite gold standard, thereby enhancing the precision of epidemiological data and clinical trial outcomes.