DINOv2-Large for Parasite Classification: A Self-Supervised Breakthrough in Biomedical AI
This article explores the transformative application of Meta AI's DINOv2-large, a self-supervised vision transformer model, for the automated classification of intestinal parasites.
DINOv2-Large for Parasite Classification: A Self-Supervised Breakthrough in Biomedical AI
Abstract
This article explores the transformative application of Meta AI's DINOv2-large, a self-supervised vision transformer model, for the automated classification of intestinal parasites. Aimed at researchers, scientists, and drug development professionals, it provides a comprehensive analysis spanning from foundational concepts to real-world validation. We detail the model's mechanism, which eliminates dependency on vast labeled datasets, and present a methodological guide for implementation in stool sample analysis. The content further addresses common optimization challenges, validates performance against state-of-the-art models and human experts, and concludes with the profound implications for enhancing diagnostic accuracy, streamlining global health interventions, and accelerating biomedical research.
Understanding DINOv2-Large: A Self-Supervised Revolution for Biomedical Imaging
Self-Supervised Learning (SSL) and its Advantage over Supervised Methods in Medical Domains
Self-supervised learning (SSL) is a machine learning paradigm that learns meaningful feature representations from unlabeled data by generating its own supervisory signals, eliminating complete reliance on manually annotated datasets [1]. This approach creates pretext tasks—such as predicting missing parts of an image or determining the relative position of image patches—forcing the model to learn underlying data patterns and structures without human-provided labels [2]. The knowledge acquired from these pretext tasks is subsequently transferred to downstream tasks (e.g., classification or detection) through fine-tuning, often with minimal labeled data [2] [3].
SSL is particularly transformative for medical domains, where acquiring large-scale, expertly annotated datasets is a fundamental challenge due to the cost, time, and specialized expertise required for labeling [4] [5]. By leveraging abundant unlabeled data, SSL reduces this annotation bottleneck and demonstrates strong potential for improving model generalization and performance in specialized applications [6] [1].
SSL Advantages in Medical Domains: Evidence from Comparative Studies
Key Advantages of SSL
- Reduced Reliance on Labeled Data: SSL minimizes the need for costly and time-consuming manual annotation by leveraging the inherent structure of unlabeled data for pre-training [4] [1]. This is crucial in medical fields where expert annotation is a scarce resource [5].
- Improved Generalization and Robust Features: SSL encourages models to learn general, transferable features rather than overfitting to narrow task-specific labels, often leading to better performance on diverse datasets and tasks [6] [7].
- Flexibility Across Domains and Data Types: The same SSL principles can be applied to images, text, audio, or graph data with minimal adjustments, making it a versatile tool for various medical data modalities [6] [1].
Case Study: Superior Performance in Parasite Classification
Recent research on intestinal parasite identification demonstrates SSL's advantage. The study evaluated multiple models, including the SSL-based DINOv2 and supervised models like ResNet-50 and YOLOv8-m. DINOv2-large achieved state-of-the-art performance, surpassing its supervised counterparts [8] [9] [10].
Table 1: Performance Comparison of Deep Learning Models in Intestinal Parasite Identification
| Model | Learning Paradigm | Accuracy (%) | Precision (%) | Sensitivity (%) | Specificity (%) | F1 Score (%) | AUROC |
|---|---|---|---|---|---|---|---|
| DINOv2-large | Self-supervised | 98.93 | 84.52 | 78.00 | 99.57 | 81.13 | 0.97 |
| YOLOv8-m | Supervised | 97.59 | 62.02 | 46.78 | 99.13 | 53.33 | 0.755 |
| ResNet-50 | Supervised | Not Reported | Not Reported | Not Reported | Not Reported | Not Reported | Not Reported |
The results show DINOv2-large substantially outperforms YOLOv8-m in precision, sensitivity, and F1 score, indicating its superior ability to correctly identify parasites with fewer false positives and false negatives [9]. The high AUROC (0.97) further confirms its strong discriminatory power [8] [10].
Performance in Low-Data and Imbalanced Regimes
While SSL excels with large unlabeled datasets, its performance in low-data or imbalanced scenarios is nuanced. One comprehensive study comparing SSL and supervised learning on small, imbalanced medical imaging datasets found that in most experiments with small training sets, supervised learning outperformed selected SSL paradigms, even with limited labeled data [4].
However, other research suggests SSL representations can be more robust to class imbalance than supervised learning. One analysis concluded that the performance gap between models pre-trained on balanced versus imbalanced datasets was notably smaller for SSL compared to supervised learning, indicating greater robustness to dataset imbalance [4].
Table 2: SSL vs. Supervised Learning on Small Medical Imaging Datasets
| Experiment Context | Key Finding | Implication |
|---|---|---|
| Small training sets (e.g., 771-1,214 images) | SL often outperformed SSL | Careful paradigm selection needed for small data |
| Class-imbalanced pre-training | SSL performance declines but may still surpass SL | SSL shows greater robustness to imbalance |
| Domain-specific downstream tasks | In-domain low-data SSL pretraining can outperform large-scale general pretraining | Data relevance can compensate for quantity |
For domain-specific applications, in-domain low-data SSL pretraining can outperform large-scale pretraining on general datasets (e.g., ImageNet), highlighting the importance of data relevance [3].
Experimental Protocol: SSL Framework for Medical Image Classification
SSL Pre-training with DINOv2
Principle: The DINOv2 framework employs self-distillation with no labels, where a student network learns to match the output of a teacher network on different views of the same image. The teacher network is built from the student using an exponential moving average (EMA) [7].
DINOv2 Self-Distillation Training
Procedure:
- Input Preparation: Generate multiple different views (crops) of each input image through data augmentation. Create both global views (lower resolution, e.g., 224×224) and local views (smaller crops, e.g., 96×96) [7].
- Network Setup: Initialize identical Vision Transformer (ViT) architectures for both teacher and student networks.
- Forward Pass:
- Pass global views through the teacher network
- Pass local views through the student network
- Loss Calculation: Compute cross-entropy loss between the student's output (from local views) and teacher's output (from global views).
- Parameter Update:
- Update student network parameters via gradient descent
- Update teacher network parameters as exponential moving average (EMA) of student parameters
Technical Enhancements in DINOv2:
- Patch-Level Objective: Incorporates masked image modeling (MIM) where random patches to the student are masked [7].
- Sinkhorn-Knopp Centering: Replaces standard softmax centering with an online Sinkhorn-Knopp batch normalization technique for more stable training [7].
- KoLeo Regularizer: Promotes uniformly distributed embeddings to prevent dimensional collapse [7].
Downstream Task Fine-tuning for Parasite Classification
Principle: Leverage features learned during SSL pre-training for specific medical classification tasks with minimal labeled data.
Downstream Task Fine-tuning
Procedure:
- Feature Extraction:
- Use pre-trained DINOv2 backbone with frozen parameters
- Process labeled stool sample images through the network
- Extract feature vectors from the final layer
- Classifier Training:
- Initialize a linear classification head on top of frozen features
- Train only the linear layer using labeled parasite data
- Use standard cross-entropy loss and Adam optimizer
- End-to-End Fine-tuning (Optional):
- For optimal performance, unfreeze the entire network after initial linear training
- Fine-tune all parameters with a very low learning rate (e.g., 1e-6)
The Scientist's Toolkit: Research Reagent Solutions
Table 3: Essential Research Materials and Computational Resources for SSL in Medical Imaging
| Resource Category | Specific Examples | Function in SSL Research |
|---|---|---|
| Computational Frameworks | PyTorch, TensorFlow, LightlyTrain | Provide SSL method implementations and training pipelines |
| SSL Model Architectures | DINOv2, SimCLR, BYOL, MoCo | Offer pre-trained models and reference implementations for transfer learning |
| Medical Imaging Datasets | LVD-142M, Institutional stool sample databases | Supply unlabeled data for pre-training and labeled data for fine-tuning |
| Data Augmentation Libraries | Torchvision, Albumentations, Imgaug | Generate diverse views for contrastive learning and prevent overfitting |
| Vision Transformer Models | ViT-S (Small), ViT-B (Base), ViT-L (Large) | Serve as backbone architectures for feature extraction |
| Evaluation Metrics | Accuracy, Precision, Recall, F1-Score, AUROC | Quantify model performance for classification tasks |
Self-supervised learning, particularly through advanced frameworks like DINOv2, offers significant advantages over traditional supervised methods in medical domains. By reducing dependence on scarce labeled data while learning robust, transferable features, SSL enables more scalable and effective deep learning solutions for healthcare applications. The demonstrated success in parasite classification, with DINOv2-large achieving 98.93% accuracy and 0.97 AUROC, underscores SSL's potential to transform medical image analysis. As SSL methodologies continue to evolve, they promise to further bridge the gap between limited medical annotations and the data-hungry nature of deep learning, accelerating innovation across diverse healthcare domains.
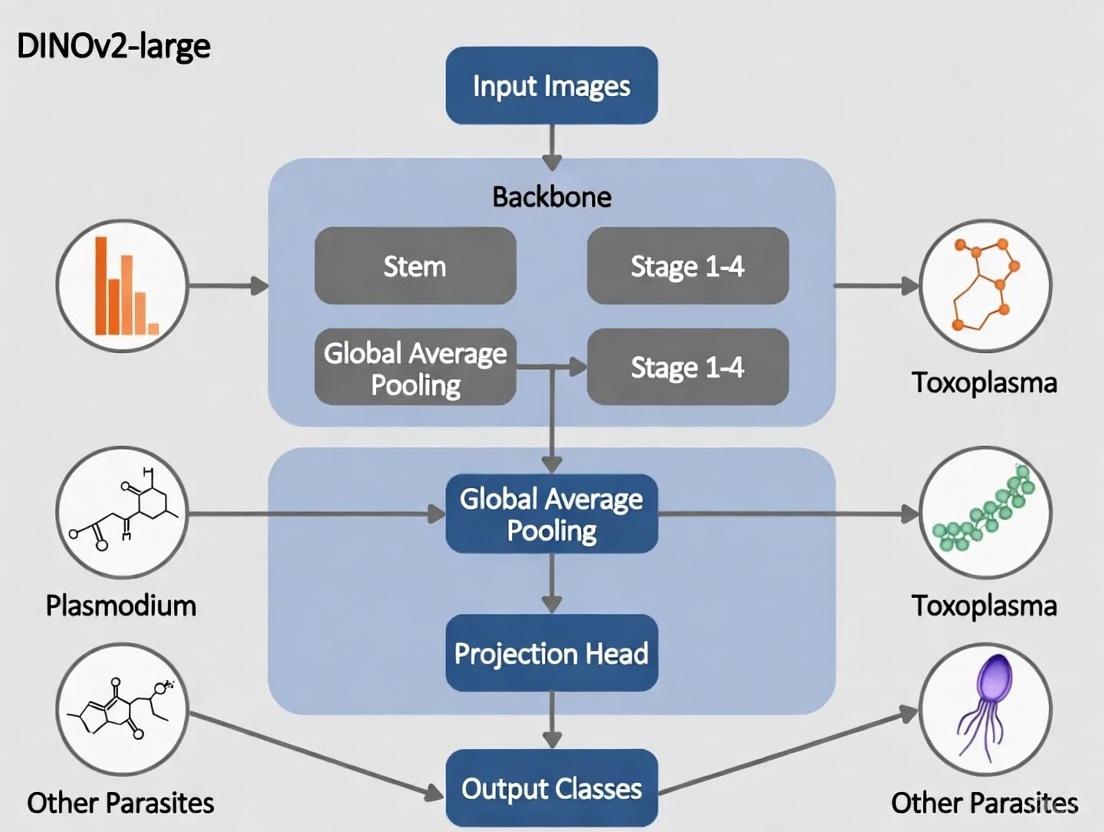
DINOv2 (self-DIstillation with No labels) represents a significant advancement in self-supervised learning for computer vision, developed by Meta AI to generate robust, general-purpose visual features without requiring fine-tuning [7] [11]. This model functions as a visual foundation model capable of producing universal features applicable to diverse vision tasks including image classification, segmentation, depth estimation, and instance retrieval [7]. For research in parasite classification, DINOv2 offers a powerful backbone that can understand complex morphological features of parasites without the need for extensive labeled datasets, which are often scarce in medical diagnostics [9]. The architecture leverages a student-teacher framework within a Vision Transformer (ViT) backbone, enabling learning from uncurated images through self-supervision—a particularly valuable characteristic for medical imaging applications where manual annotation is costly and time-consuming [12].
Core Architectural Components
Vision Transformer Backbone
DINOv2 utilizes various sizes of Vision Transformers (ViT) including ViT-S/14, ViT-B/14, ViT-L/14, and ViT-g/14, with the largest model containing approximately 1 billion parameters [11]. The ViT architecture processes images by dividing them into fixed-size non-overlapping patches (typically 14×14 pixels), which are linearly embedded and processed through deep stacks of self-attention layers [11]. This patch-based processing enables the model to capture both local and global image contexts, essential for recognizing intricate parasite structures and morphological variations. Key architectural advancements in DINOv2 include untied projection heads for image-level and patch-level losses, SwiGLU feed-forward layers in from-scratch models, and efficient attention mechanisms through FlashAttention implementation [11]. The model also employs aggressive stochastic depth (up to 40% drop rates) to facilitate stable training of deep transformer architectures [11].
Student-Teacher Mechanism
The student-teacher framework forms the core of DINOv2's self-supervised learning approach, employing a dynamic knowledge distillation process where both networks share identical architectural designs but differ in parameter updates [7] [13]. In this framework, the student model (with learnable parameters) is trained to match the output distributions of a teacher model whose parameters are an exponential moving average (EMA) of past student iterations [7] [13]. This mechanism operates through two parallel augmented views of the same input image: the student network processes randomly masked patches while the teacher network processes visible tokens without masking [7]. The training employs a composite loss function combining cross-entropy losses for both image-level and patch-level predictions, enabling the model to learn robust representations invariant to various transformations [7].
Table: DINOv2 Model Variants and Specifications
| Model Variant | Patch Size | Feature Dimension | Parameters | Key Applications |
|---|---|---|---|---|
| ViT-S/14 | 14×14 | 384 | 21M | Resource-constrained environments |
| ViT-B/14 | 14×14 | 768 | 85M | Standard classification tasks |
| ViT-L/14 | 14×14 | 1024 | 300M | Complex segmentation tasks |
| ViT-g/14 | 14×14 | 1536 | 1.1B | State-of-the-art performance |
Detailed Experimental Protocols
Protocol 1: Feature Extraction for Parasite Classification
This protocol outlines the methodology for extracting features from stool sample images using DINOv2's frozen backbone, adapted from successful implementations in parasite identification research [9].
Materials and Reagents:
- Stool sample slides prepared using Formalin-Ethyl Acetate Centrifugation Technique (FECT) or Merthiolate-Iodine-Formalin (MIF) staining [9]
- Microscope with digital imaging capabilities (≥20x magnification)
- Computing system with NVIDIA GPU (≥8GB VRAM) and PyTorch framework
Procedure:
- Image Acquisition: Capture digital micrographs of stained stool samples at consistent magnification (recommended: 40x). Ensure each image contains at least one identifiable parasite structure.
- Preprocessing: Resize images to 518×518 pixels to match DINOv2's training resolution. Apply normalization with mean=0.5 and std=0.2 across RGB channels [14].
- Feature Extraction: Utilize a pre-trained DINOv2 model (recommended: DINOv2-large for optimal performance) to extract features without fine-tuning:
- Classification: Train a linear classifier (logistic regression or SVM) on the extracted features for parasite species identification.
Validation: In recent studies, this approach achieved 98.93% accuracy, 84.52% precision, 78.00% sensitivity, and 99.57% specificity for intestinal parasite identification using DINOv2-large [9].
Protocol 2: Few-Shot Learning for Rare Parasites
This protocol enables effective model adaptation with limited labeled examples of rare parasite species, leveraging DINOv2's robust feature representations.
Procedure:
- Support Set Curation: Gather a minimal dataset (5-20 samples per class) of rare parasite species, ensuring morphological diversity in the samples.
- Feature Embedding Extraction: Follow Protocol 1 to extract features from both the support set (rare species) and a larger base dataset (common species).
- Similarity-based Classification: Implement a k-Nearest Neighbors (k-NN) classifier in the feature space using cosine similarity as the distance metric:
- Evaluation: Assess performance using leave-one-out cross-validation on the support set.
Performance Expectations: DINOv2 has demonstrated strong few-shot learning capabilities, with studies showing it can match or exceed supervised baselines when using only 1-10% of available training data [12].
Table: DINOv2 Performance in Parasite Identification (Adapted from Corpuz et al., 5)
| Model | Accuracy | Precision | Sensitivity | Specificity | F1 Score | AUROC |
|---|---|---|---|---|---|---|
| DINOv2-large | 98.93% | 84.52% | 78.00% | 99.57% | 81.13% | 0.97 |
| DINOv2-base | 97.82% | 79.15% | 72.34% | 98.92% | 75.61% | 0.94 |
| DINOv2-small | 96.45% | 75.28% | 68.91% | 98.15% | 71.95% | 0.91 |
| YOLOv8-m | 97.59% | 62.02% | 46.78% | 99.13% | 53.33% | 0.76 |
Architectural Workflow Visualization
Student-Teacher Training Mechanism
Patch Processing in Vision Transformer
The Scientist's Toolkit: Research Reagent Solutions
Table: Essential Computational Tools for DINOv2-based Parasite Research
| Tool/Resource | Function | Implementation Example |
|---|---|---|
| Pre-trained DINOv2 Models | Provides foundation features without training from scratch | torch.hub.load('facebookresearch/dinov2', 'dinov2_vitl14') |
| FAISS Similarity Search | Enables efficient k-NN classification for few-shot learning | index = faiss.IndexFlatIP(features.shape[1]) |
| PyTorch Framework | Core deep learning infrastructure for model implementation | import torch; import torchvision.transforms |
| Data Augmentation Pipeline | Generates varied training samples from limited data | transforms.RandomHorizontalFlip(), RandomRotation() |
| Gradient Optimization | Adjusts model parameters during fine-tuning | optimizer = torch.optim.AdamW(model.parameters()) |
| Feature Visualization | Projects high-dimensional features to 2D for analysis | Principal Component Analysis (PCA), t-SNE |
Performance Optimization and Scaling
DINOv2 incorporates several technical innovations that enhance training stability and efficiency when scaling to larger models and datasets. The implementation uses Fully Sharded Data Parallel (FSDP) training across multiple GPUs with mixed-precision computation, reducing memory consumption by approximately 3× compared to previous approaches [7] [15]. The model also employs FlashAttention for efficient ViT attention computation and KoLeo regularizer to encourage uniform distribution in the feature space, preventing representation collapse [7] [11]. For parasite classification tasks, these optimizations enable researchers to work with high-resolution microscopy images (up to 518×518 pixels) while maintaining computational efficiency, which is crucial for detecting subtle morphological features that differentiate parasite species [9]. The training process also includes a final high-resolution adaptation phase that significantly improves performance on pixel-level tasks like segmentation without substantial computational overhead [11].
DINOv2 represents a significant breakthrough in computer vision, providing high-performance visual foundation models trained via self-supervised learning (SSL). Unlike supervised approaches that require extensive manually labeled datasets, DINOv2 learns directly from any collection of images without metadata, making it particularly valuable for specialized domains like medical imaging and parasitology where expert annotations are scarce and costly [13] [16]. The model family is based on the Vision Transformer (ViT) architecture, which processes images as sequences of patches and excels at capturing both global and local visual information [17]. This capability is crucial for detailed analysis in scientific applications such as parasite classification, where distinguishing subtle morphological features determines diagnostic accuracy.
A key advantage of DINOv2 is its effectiveness as a multipurpose backbone for diverse computer vision tasks. Once pre-trained, the models generate general-purpose features that can be used directly for tasks like classification, segmentation, and image retrieval without task-specific fine-tuning, often requiring only a simple linear classifier to achieve strong performance [16]. This "out-of-the-box" capability significantly simplifies deployment workflows and reduces computational overhead, especially beneficial in resource-constrained research environments focused on applications like parasite classification [13].
Model Variants and Key Characteristics
The DINOv2 family includes several model sizes, distilled from larger architectures to balance performance and efficiency [16]. The following table summarizes their key specifications and performance characteristics:
Table 1: DINOv2 Model Variants Specification and Performance Comparison
| Model Variant | Parameters | Image Embedding Dimension | Key Performance Characteristics | Inference Hardware Recommendation |
|---|---|---|---|---|
| DINOv2 Large (ViT-L) | ~300 million [16] | 1024 [17] | Highest accuracy; State-of-the-art on complex tasks [9] [18] | Server-grade GPU (e.g., NVIDIA A100) |
| DINOv2 Base (ViT-B) | ~86 million [17] | 768 [17] | Balanced performance/size; ~2% lower ImageNet-1k accuracy vs. fine-tuned [16] | High-end Consumer GPU (e.g., NVIDIA RTX 3080/4090) |
| DINOv2 Small (ViT-S) | ~21 million [13] | 384 | Good efficiency; Minimal accuracy drop vs. larger models [16] | Mid-range GPU/Edge Device (e.g., NVIDIA Jetson) |
Quantitative Performance in Domain-Specific Tasks
Independent validation studies across specialized domains, including medical imaging and parasitology, demonstrate the robust performance of DINOv2 models, particularly the large variant.
Table 2: DINOv2 Performance in Scientific and Medical Applications
| Application Domain | Task Description | Model Variant | Key Results | Source |
|---|---|---|---|---|
| Parasite Classification | Identifying intestinal parasites from stool images [9] | DINOv2-Large | Accuracy: 98.93%, Precision: 84.52%, Sensitivity: 78.00%, Specificity: 99.57%, F1: 81.13%, AUROC: 0.97 [9] | Brondolo et al., 2025 |
| Medical Imaging (3D) | Diagnosing breast cancer, lung nodules, meniscus tears via MRI/CT [18] | MST (DINOv2-based) | AUC: 0.94 (Breast), 0.95 (Chest), 0.85 (Knee); Superior to 3D ResNet [18] | Scientific Reports, 2025 |
| Geological Analysis | Classification/segmentation of rock sample CT scans [19] | DINOv2 (Base, non-fine-tuned) | Strong out-of-distribution performance; Effective feature extraction for specialized domains [19] | Brondolo et al., 2025 |
Case Study: DINOv2 for Parasite Classification
Experimental Context and Workflow
A 2025 study validated DINOv2's effectiveness in identifying human intestinal parasitic infections (IPI), a significant global health challenge affecting billions [9]. Researchers evaluated several state-of-the-art models, including DINOv2 variants, on stool sample images to automate and improve diagnostic accuracy. The experimental workflow is summarized below:
Key Findings and Research Reagents
The study demonstrated that DINOv2-large achieved exceptional performance in parasite identification, outperforming other deep learning models like YOLOv8 and ResNet-50, and showing strong agreement with human expert assessments [9]. The following table details key research reagents and computational tools employed in this experiment:
Table 3: Research Reagent Solutions for DINOv2-based Parasite Classification
| Reagent/Tool | Specification/Version | Function in Experiment |
|---|---|---|
| DINOv2 Models | ViT-L (Large), ViT-B (Base), ViT-S (Small) [9] | Feature extraction backbone for parasite image analysis |
| CIRA CORE Platform | In-house computing platform [9] | Operating environment for running deep learning models |
| Linear Classifier | Custom implementation | Task-specific adaptation for parasite classification |
| Stool Sample Images | Modified direct smear microscopy [9] | Raw input data for model training and evaluation |
| Reference Standards | FECT & MIF techniques [9] | Ground truth establishment by human experts |
Resource-Aware Deployment Strategies
Deployment Decision Framework
Selecting the appropriate DINOv2 variant requires careful consideration of performance requirements, computational constraints, and deployment environment. The following decision workflow provides a structured approach for researchers:
Deployment Infrastructure Considerations
Successfully deploying DINOv2 models in production environments requires appropriate infrastructure selection and configuration:
Cloud-Based Deployment: Ideal for large models (ViT-L, ViT-g) requiring scalable GPU resources. Services like AWS SageMaker, Google Vertex AI, and Microsoft Azure Machine Learning provide managed environments for serving DINOv2 models with automatic scaling [20] [21]. This approach benefits research teams needing maximum performance without managing physical hardware.
Edge Deployment: Smaller DINOv2 variants (ViT-S, ViT-B) can be deployed on edge devices with specialized processors like Neural Processing Units (NPUs) or optimized GPUs [21]. This is particularly relevant for point-of-care diagnostic applications in parasitology, where data privacy and real-time processing are prioritized over cloud connectivity.
Hybrid Approaches: For complex research workflows, a hybrid strategy can balance performance and efficiency. Larger DINOv2 models process challenging cases in the cloud, while common analyses run locally using smaller variants [20]. This architecture supports scalable parasite classification systems that maintain functionality despite network limitations.
Experimental Protocols and Implementation Guidelines
Standard Protocol for DINOv2 Feature Extraction
This protocol outlines the fundamental steps for utilizing DINOv2 models in downstream tasks like parasite classification, using the Hugging Face Transformers library.
Materials and Software Requirements
- Python 3.8+
- PyTorch 1.12+
- Transformers library
- DINOv2 model weights (facebook/dinov2-base, facebook/dinov2-large, or facebook/dinov2-small)
Procedure
- Environment Setup: Install required packages:
pip install torch transformers pillow requests - Model Initialization: Load pre-trained DINOv2 model and processor:
- Image Preprocessing: Process input images for model compatibility:
- Feature Extraction: Generate image embeddings:
- Downstream Application: Use the extracted features (lasthiddenstates) for specific tasks:
- For classification: Add a linear layer on top of the [CLS] token embeddings
- For similarity search: Compare embedding vectors using cosine similarity [17]
Protocol for Linear Probing Evaluation
This methodology evaluates DINOv2 features by training a linear classifier on top of frozen features, simulating the parasite classification study conditions [9].
Procedure
- Feature Extraction: Extract features from your labeled dataset using DINOv2 without fine-tuning.
- Classifier Design: Implement a simple linear layer that maps from the DINOv2 embedding dimension (768 for Base, 1024 for Large) to the number of target classes.
- Training Configuration:
- Keep DINOv2 weights frozen
- Train only the linear classifier
- Use standard cross-entropy loss
- Optimize with SGD or AdamW with learning rate 0.001-0.01
- Evaluation: Measure performance on held-out test set using accuracy, precision, recall, F1-score, and AUROC.
Protocol for Model Distillation (Large to Small)
For scenarios requiring deployment of smaller models without significant performance loss, this protocol outlines knowledge distillation from DINOv2-large to DINOv2-small.
Procedure
- Setup Teacher-Student Framework: Initialize DINOv2-large as teacher and DINOv2-small as student.
- Distillation Loss: Implement a combination of:
- KL divergence between teacher and student output distributions
- Cosine similarity between feature representations
- Task-specific loss (e.g., cross-entropy with ground truth)
- Training Regimen:
- Train student to mimic teacher outputs
- Use temperature scaling in softmax for softer targets
- Gradually reduce temperature during training
- Validation: Compare distilled student performance against original large model on validation set.
The DINOv2 model family offers a versatile suite of vision foundation models that balance performance and efficiency for scientific applications. As demonstrated in parasite classification research, DINOv2-large achieves exceptional accuracy (98.93%) while smaller variants provide practical alternatives for resource-constrained environments [9]. The self-supervised nature of these models makes them particularly valuable for specialized domains with limited annotated data. By following the structured deployment framework and experimental protocols outlined in this document, researchers can effectively leverage DINOv2 capabilities to advance computational parasitology and other scientific disciplines requiring robust visual analysis.
DINOv2-Large is a self-supervised vision transformer model that demonstrates exceptional performance in automated parasite classification, offering a significant technological advancement for medical diagnostics and research. In comparative studies, it has achieved performance metrics that meet or exceed human expert capabilities, making it particularly suited for analyzing complex parasitological images.
Table 1: Performance Metrics of DINOv2-Large in Parasite Classification
| Metric | Performance Value |
|---|---|
| Accuracy | 98.93% |
| Precision | 84.52% |
| Sensitivity (Recall) | 78.00% |
| Specificity | 99.57% |
| F1 Score | 81.13% |
| AUROC | 0.97 |
Comparative analyses reveal that DINOv2-Large outperforms other deep learning models in intestinal parasite identification, including YOLOv8-m (accuracy: 97.59%) and ResNet-50 [9] [8] [10]. The model exhibits strong agreement with medical technologists, achieving Cohen's Kappa scores greater than 0.90, indicating a high level of concordance with human expert assessments [9].
Technical Foundation of DINOv2
Architectural Framework
DINOv2-Large is built upon a Vision Transformer (ViT) architecture trained using a discriminative self-supervised learning method [22] [23]. The model employs a student-teacher framework where both networks are vision transformers, with the student network learning to mimic the representations learned by the momentum teacher network [23] [24]. This approach enables the model to learn rich visual representations without requiring manually labeled datasets, which is particularly advantageous in medical domains where expert annotations are scarce and costly [9] [25].
Key Technical Innovations
The model incorporates several groundbreaking technical innovations that enhance its feature extraction capabilities:
Multi-objective training: DINOv2 combines both image-level (DINO) and patch-level (iBOT) objectives, enabling it to learn both global and local features simultaneously [24]. This dual approach is particularly beneficial for parasite classification, where both the overall structure and fine morphological details are critical for accurate identification.
Self-distillation with no labels: The training process employs knowledge distillation without labels, where a student model learns from a teacher model through cross-entropy loss applied to feature similarities [24] [13]. This allows the model to learn meaningful representations without manual annotation.
Large-scale curated training: DINOv2 was pre-trained on 142 million carefully curated images (LVD-142M), providing a robust foundation of visual features that transfer effectively to specialized domains like parasitology [26] [23] [13].
DINOv2-Large Training Framework: Illustrates the student-teacher self-distillation process with global and local crops.
Experimental Protocol for Parasite Classification
Sample Preparation and Image Acquisition
The validation protocol for DINOv2-Large in parasite classification utilizes standardized parasitological techniques for sample preparation and imaging [9] [10]:
Sample Collection: Stool samples are collected and processed using formalin-ethyl acetate centrifugation technique (FECT) and Merthiolate-iodine-formalin (MIF) techniques performed by human experts to establish ground truth.
Slide Preparation: Modified direct smears are prepared from concentrated samples to ensure optimal parasite distribution and visualization.
Image Acquisition: Microscopic images are captured at appropriate magnifications (typically 100x-400x) to resolve key morphological features of parasites, including eggs, larvae, cysts, and trophozoites.
Dataset Splitting: Acquired images are divided into training (80%) and testing (20%) datasets, ensuring representative distribution of parasite species and developmental stages.
Model Implementation and Training
The implementation protocol for fine-tuning DINOv2-Large for parasite classification involves the following steps:
Model Initialization: Load pre-trained DINOv2-Large weights, leveraging features learned from the large-scale natural image corpus.
Feature Extraction: Process parasite images through the Vision Transformer backbone to generate embeddings. The model divides images into patches (14x14 for DINOv2-Large), processes them through transformer blocks, and produces feature representations.
Fine-tuning Approach: Employ linear probing or end-to-end fine-tuning based on available data. For limited datasets, linear probing (training only the classification head) often yields strong performance.
Performance Validation: Evaluate using confusion matrices, receiver operating characteristic (ROC) curves, precision-recall (PR) curves, and statistical measures including Cohen's Kappa and Bland-Altman analysis.
Parasite Classification Workflow: From sample preparation through model evaluation.
Performance Analysis and Comparative Evaluation
Quantitative Performance Metrics
In validation studies, DINOv2-Large demonstrated superior performance in parasite classification across multiple metrics [9] [8]. The model achieved particularly high specificity (99.57%), indicating excellent capability to correctly identify negative samples and minimize false positives - a critical requirement in diagnostic applications.
Table 2: Class-wise Performance for Different Parasite Types
| Parasite Type | Distinguishing Features | Classification Performance |
|---|---|---|
| Helminth Eggs | Large size, distinct shapes, thick shells | High precision, sensitivity, and F1 scores |
| Protozoan Cysts | Smaller size, subtle morphological features | Good performance with sufficient image quality |
| Larvae | Elongated forms, internal structures | High detection accuracy |
| Trophozoites | Delicate, amorphous shapes | Moderate performance depending on preservation |
Class-wise analysis reveals that DINOv2-Large achieves particularly high precision, sensitivity, and F1 scores for helminthic eggs and larvae, attributed to their more distinct and consistent morphological features compared to protozoan forms [9]. The model's strong performance across diverse parasite types underscores its robust feature extraction capabilities.
Comparison with Alternative Models
When evaluated against other state-of-the-art models, DINOv2-Large consistently demonstrates superior performance in parasite classification tasks:
Table 3: Model Comparison for Parasite Identification
| Model | Accuracy | Precision | Sensitivity | Specificity | F1 Score |
|---|---|---|---|---|---|
| DINOv2-Large | 98.93% | 84.52% | 78.00% | 99.57% | 81.13% |
| YOLOv8-m | 97.59% | 62.02% | 46.78% | 99.13% | 53.33% |
| ResNet-50 | Data not fully specified in studies | Data not fully specified in studies | Data not fully specified in studies | Data not fully specified in studies | Data not fully specified in studies |
The performance advantage of DINOv2-Large is particularly evident in precision and F1 scores, indicating more reliable positive classifications and better balance between precision and recall compared to YOLO-based approaches [9].
The Scientist's Toolkit: Research Reagent Solutions
Table 4: Essential Research Reagents and Materials
| Reagent/Material | Function/Application |
|---|---|
| Formalin-Ethyl Acetate | Parasite concentration and preservation for FECT technique |
| Merthiolate-Iodine-Formalin (MIF) | Fixation and staining for enhanced morphological visualization |
| Microscopy Slides and Coverslips | Sample preparation for imaging |
| DINOv2-Large Pre-trained Weights | Base model for feature extraction and transfer learning |
| CIRA CORE Platform | In-house deep learning operational framework [9] [10] |
| Python/PyTorch Environment | Model implementation, fine-tuning, and inference |
| Annotation Software | Ground truth establishment by expert parasitologists |
Advantages for Parasitology Applications
DINOv2-Large offers several distinct advantages for parasite classification research and application:
Reduced Annotation Burden: The self-supervised pre-training approach minimizes the need for extensively labeled parasitology datasets, which are time-consuming and expensive to create [25].
Superior Feature Extraction: The model captures both local features (individual morphological characteristics) and global context (overall structure), enabling accurate identification even with challenging samples [24].
Transfer Learning Capability: Features learned from natural images transfer effectively to parasitological images, demonstrating the model's robust representation learning [26].
Multi-task Capability: Beyond classification, DINOv2 embeddings support related tasks such as image retrieval, segmentation, and similarity search, providing comprehensive analytical capabilities [25] [23].
The integration of DINOv2-Large into parasitological workflows represents a significant advancement toward automated, high-throughput parasite identification systems. Its robust performance and self-supervised nature make it particularly valuable for resource-limited settings and large-scale epidemiological studies where expert microscopy resources are constrained.
The Global Health Burden of Intestinal Parasitic Infections (IPIs) and Limitations of Conventional Diagnostics
Intestinal Parasitic Infections (IPIs) represent a significant global health challenge, affecting billions of people and contributing substantially to morbidity and mortality, particularly in resource-limited settings. Conventional diagnostic techniques, while widely used, are hampered by limitations in sensitivity, specificity, and operational efficiency. This document details the global epidemiology of IPIs, quantitatively analyzes the performance of standard diagnostic methods, and provides a comprehensive protocol for the application of the DINOv2-large deep learning model to automate and enhance parasite detection in stool samples. The integration of this advanced AI tool promises to revolutionize parasitological diagnostics by improving accuracy, standardizing results, and facilitating timely public health interventions.
Global Epidemiology and Health Impact of IPIs
Intestinal Parasitic Infections are caused by a variety of helminths and protozoa, disproportionately affecting children in low- and middle-income countries and contributing to a cycle of poverty through impaired cognitive and physical development [27].
The table below summarizes key quantitative data on the prevalence and impact of IPIs from recent meta-analyses and studies.
Table 1: Global and Regional Prevalence of Intestinal Parasitic Infections
| Location | Study Population | Overall Prevalence | Most Common Parasites Identified (Prevalence) | Source |
|---|---|---|---|---|
| Global (CRC Patients) | Patients with Colorectal Cancer | 19.67% (95% CI: 14.81%—25.02%) | Helminths: 20.79% (95% CI: 8.35%—36.96%); Protozoa: 19.4% (95% CI: 14.07%—25.37%) | [28] |
| Ghana | Children | 22% (95% CI: 12%—34%) | Hookworm (14%), Giardia intestinalis (12%), Schistosoma mansoni (8%) | [27] |
| Northwest Ethiopia | Patients at a Health Center | 55.2% | Entamoeba histolytica/dispar (46.5%), Ascaris lumbricoides (9.2%) | [29] |
The health burden of IPIs extends beyond mere infection. A systematic review and meta-analysis have identified a significant association between IPIs and colorectal cancer (CRC), with infected individuals having 3.61 times higher odds (95% CI: 2.41—5.43) of developing CRC [28]. The proposed mechanisms for this association include the induction of chronic inflammation, increased oxidative stress leading to DNA damage, and production of inflammatory cytokines such as IL-6, TNF-α, and NF-κB, which collectively create a microenvironment conducive to carcinogenesis [28].
Conventional Diagnostic Techniques and Their Limitations
Despite the development of molecular methods, conventional techniques remain the gold standard for routine diagnosis of IPIs in most settings, primarily due to their simplicity and cost-effectiveness [8] [9].
Table 2: Conventional Diagnostic Methods for IPIs and Their Limitations
| Method | Principle | Advantages | Limitations & Challenges |
|---|---|---|---|
| Formalin-Ether Centrifugation Technique (FECT) | Concentration of parasites via centrifugation using formalin-ether solution. | Suitable for preserved samples; improves detection of low-level infections. | Variable results based on analyst; procedure complexity [9]. |
| Merthiolate-Iodine-Formalin (MIF) Technique | Fixation and staining of stool samples for direct examination. | Easy preparation; long shelf life; good for field surveys. | Can distort trophozoite morphology; incompatibility with some stains [9]. |
| Kato-Katz Technique | Microscopic examination of a standardized smear of stool. | Simplicity; low cost; allows for egg quantification. | Unsuitable for multiple infections; performance varies with parasitic load [9]. |
| Direct Saline Wet Mount | Direct microscopic examination of fresh stool in saline. | Rapid; cost-effective; provides definitive diagnosis for primary assessment. | Low sensitivity for low-intensity infections; highly dependent on technician skill [29]. |
The primary limitations of these methods are their dependency on highly skilled technicians, subjectivity in interpretation, and variable sensitivity and specificity, especially for protozoan species with similar morphologies or in cases of low parasitic load [9]. These challenges underscore the need for innovative, automated diagnostic solutions.
Protocol: Application of the DINOv2-Large Model for Automated IPI Diagnosis
This protocol outlines the methodology for training and validating the DINOv2-large deep learning model for the identification of intestinal parasites from stool sample images, leveraging a self-supervised learning approach.
Experimental Workflow
The following diagram illustrates the end-to-end workflow for the AI-enhanced diagnostic process, from sample preparation to final classification.
Research Reagent Solutions and Essential Materials
Table 3: Key Reagents and Materials for Stool Examination and AI Model Development
| Item | Function/Application | Specifications/Notes |
|---|---|---|
| Formalin-Ethyl Acetate | Parasite fixation and concentration in FECT. | Standardized reagents are critical for consistent sample preparation and image quality. |
| Merthiolate-Iodine-Formalin (MIF) | Fixation and staining of cysts, oocysts, and helminth eggs. | Preferred for field surveys due to long shelf life; enhances visual contrast for imaging [9]. |
| DINOv2-large Model | Self-supervised feature extraction from stool sample images. | Vision Transformer (ViT) architecture; pre-trained on curated dataset for robust feature learning [9]. |
| CIRA CORE Platform | Operational platform for running deep learning models. | In-house platform used to operate YOLO and DINOv2 models for parasite identification [9]. |
| Annotated Image Dataset | Training and testing data for deep learning models. | Dataset should include images of helminth eggs, larvae, and protozoan cysts/oocysts from modified direct smears [9]. |
Step-by-Step Experimental Procedure
Phase 1: Ground Truth Establishment and Dataset Curation
- Sample Processing: Collect fresh stool samples and process them using both the FECT and MIF techniques, performed by expert medical technologists. This establishes the diagnostic "ground truth" [9].
- Image Acquisition: From a modified direct smear of the samples, acquire high-resolution digital images using a microscope with an attached digital camera. Ensure consistent lighting and magnification across images.
- Data Annotation: Categorize images into training (80%) and testing (20%) datasets. For object detection models like YOLO, manually label images with bounding boxes and class labels for each parasitic object.
Phase 2: Model Training and Validation
- Model Selection: Employ the DINOv2-large model, a self-supervised learning model that learns features without manual labeling, and compare it against other models like YOLOv8-m and ResNet-50 [9].
- Feature Extraction & Training: Use the DINOv2-large model to extract discriminative features from the input images. Train a sequential classifier on top of these features to map them to specific parasite classes.
- Performance Validation: Evaluate the model on the held-out test set using the following metrics. The expected performance, based on published validation, is summarized below.
Table 4: Performance Metrics of Deep Learning Models in Parasite Identification
| Model | Accuracy | Precision | Sensitivity (Recall) | Specificity | F1 Score | AUROC |
|---|---|---|---|---|---|---|
| DINOv2-large | 98.93% | 84.52% | 78.00% | 99.57% | 81.13% | 0.97 |
| YOLOv8-m | 97.59% | 62.02% | 46.78% | 99.13% | 53.33% | 0.755 |
| Human Expert (Benchmark) | Varies | Varies | Varies | Varies | Varies | - |
- Statistical Agreement: Assess the model's agreement with human experts using Cohen's Kappa (expecting a κ > 0.90, indicating strong agreement) and Bland-Altman analysis to visualize bias [9].
The integration of the DINOv2-large model into the diagnostic workflow for IPIs represents a paradigm shift, addressing critical limitations of conventional microscopy. Its high accuracy, specificity, and strong agreement with human experts demonstrate its potential for use in clinical and public health settings. The adoption of this AI-driven approach can facilitate early detection, high-throughput screening, and more effective management of IPIs, thereby reducing their global health burden. Future work should focus on the deployment of this technology in field settings and its continuous training with diverse datasets to enhance generalizability across different geographical regions.
Implementing DINOv2-Large: A Step-by-Step Pipeline for Parasite Classification
The application of deep learning models, such as DINOv2-large, to the classification of intestinal parasites represents a significant advancement in diagnostic parasitology [9]. These models show exceptional performance, with reported accuracy of 98.93% and a specificity of 99.57% in identifying parasitic elements [9] [8]. However, this performance is fundamentally dependent on the quality and integrity of the underlying digital image datasets. This document provides detailed application notes and protocols for the systematic acquisition and preparation of image datasets from stool samples, specifically contextualized within a research framework utilizing the DINOv2-large model for parasite classification.
Data Acquisition: From Sample to Digital Image
The process of converting a physical stool sample into a usable digital image dataset requires meticulous attention to laboratory techniques and imaging protocols.
Laboratory Processing and Staining Techniques
The initial sample handling sets the foundation for image quality. The following techniques are commonly employed to prepare samples for microscopy, each with distinct advantages for subsequent deep learning analysis.
- Formalin-Ethyl Acetate Centrifugation Technique (FECT): This concentration technique is considered a gold standard for routine diagnosis [9]. It involves mixing the stool sample with a formalin-ether solution followed by centrifugation. This process improves the detection of low-level infections by concentrating parasitic elements [9]. Its simplicity and cost-effectiveness make it suitable for creating large-scale datasets.
- Merthiolate-Iodine-Formalin (MIF) Technique: This technique serves as an effective fixation and staining solution with easy preparation and a long shelf life, making it suitable for field surveys [9]. It provides competitive performance for evaluating a variety of intestinal parasitic infections (IPIs) [9]. A noted limitation is the potential for iodine to cause distortion, which must be considered during image annotation [9].
Digital Image Capture
Once prepared, slides are digitized using microscopy. Consistency in imaging is critical.
- Microscopy: Use a standard light microscope connected to a digital camera.
- Standardization: Maintain consistent magnification (typically 100x, 400x for protozoa) across images. Ensure uniform lighting conditions to avoid shadows and glare that could introduce artifacts.
- Resolution: Capture images at a high resolution to ensure that minute morphological features of parasites are preserved for the model to learn. The DINOv2-large model, being a Vision Transformer, processes images as a sequence of patches; high-resolution input allows for richer feature extraction [22].
Data Preprocessing and Region of Interest (ROI) Segmentation
Raw microscopic images often contain background and debris that can hinder model performance. Segmenting the Region of Interest (ROI) is a crucial preprocessing step.
Automated ROI Segmentation for Stool Images
An effective method for segmenting the stool region from the background uses saturation channel analysis and optimal thresholding [30]. The procedure is as follows:
- Color Space Transformation: Convert the original RGB image to a color space that separates saturation, such as HSV.
- Saturation Channel Extraction: Isolate the saturation component. The discrimination between stool and background is typically high in saturation maps [30].
- Optimal Thresholding: Employ an adaptive algorithm, such as the Otsu method, to determine the optimal threshold value
Tthat maximizes the inter-class variance between foreground (stool) and background pixels [30]. The operation is defined as:f(x,y)={1,g(x,y)<T; 0,g(x,y)≥T}, whereg(x,y)represents pixel values [30]. - Binary Mask Application: The resulting binary mask is used to extract the ROI from the original image, isolating the stool material for classification.
This approach reduces computational load and focuses the model's attention on relevant features.
Workflow Visualization
The following diagram illustrates the complete pipeline from sample collection to dataset preparation.
Dataset Preparation for Model Training
Expert Annotation and Ground Truth Establishment
Human experts perform techniques like FECT and MIF to establish the ground truth and reference for parasite species [9]. Subsequent annotation of digital images can follow two paradigms:
- Classification Dataset: Images are assigned a single class label (e.g., Ascaris lumbricoides, Trichuris trichiura, Uninfected).
- Object Detection Dataset: Each parasitic object within an image is localized with a bounding box and assigned a class label. This is crucial for identifying multiple infections in a single sample [9].
Dataset Splitting
For model development and evaluation, the annotated dataset should be partitioned as follows:
- Training Set (80%): Used to train the deep learning model.
- Testing Set (20%): Used for the final evaluation of the model's performance [9].
This split ensures the model is evaluated on data it has not seen during training, providing a realistic measure of its generalizability.
Performance of Deep Learning Models on Stool Datasets
The table below summarizes the quantitative performance of various deep learning models on intestinal parasite image classification, providing a benchmark for expected outcomes.
Table 1: Performance comparison of deep learning models in intestinal parasite identification. [9] [8]
| Model | Accuracy (%) | Precision (%) | Sensitivity (%) | Specificity (%) | F1-Score (%) | AUROC |
|---|---|---|---|---|---|---|
| DINOv2-large | 98.93 | 84.52 | 78.00 | 99.57 | 81.13 | 0.97 |
| YOLOv8-m | 97.59 | 62.02 | 46.78 | 99.13 | 53.33 | 0.755 |
| ConvNeXt Tiny | ~98.6* (F1) | N/R | N/R | N/R | 98.6 | N/R |
| MobileNet V3 S | ~98.2* (F1) | N/R | N/R | N/R | 98.2 | N/R |
Note: N/R = Not explicitly reported in the provided search results. Performance metrics for ConvNeXt Tiny and MobileNet V3 S are derived from a related study on helminth classification, where F1-score was the primary metric reported. [31]
The Scientist's Toolkit: Research Reagent Solutions
The following table details essential materials and their functions for setting up the described experiments.
Table 2: Key research reagents and materials for stool sample processing and imaging.
| Item | Function/Description |
|---|---|
| Formalin (10%) | Fixative for preserving parasitic morphology in stool samples for FECT. |
| Ethyl Acetate | Solvent used in the concentration technique to separate debris from parasitic elements. |
| Merthiolate-Iodine-Formalin (MIF) | A combined fixative and stain used for the preservation and visualization of cysts, oocysts, and eggs. |
| Microscope & Digital Camera | For high-resolution image acquisition of prepared slides. |
| Annotation Software | Software tools for labeling images with bounding boxes and class labels to create ground truth data. |
Implementation Notes for DINOv2-large
The DINOv2-large model is a Vision Transformer (ViT) pre-trained in a self-supervised fashion on a large collection of images [22]. To fine-tune it for parasite classification:
- Feature Extraction: The model learns an inner representation of images that can be used to extract features useful for classification [22].
- Classifier Placement: A standard linear layer is typically placed on top of the pre-trained encoder, often using the
[CLS]token's last hidden state as a representation of the entire image [22]. - Input Data: The model requires images to be presented as a sequence of fixed-size patches [22]. Ensure your preprocessing pipeline outputs consistently sized, high-quality ROIs.
The high performance of DINOv2-large, as shown in Table 1, underscores its potential for accurate and automated parasite diagnostics, facilitating timely and targeted interventions [9].
This application note details the image preprocessing pipeline for the DINOv2-large model, specifically contextualized within a research program aimed at the classification of intestinal parasites from stool sample images. The performance of deep learning models is profoundly dependent on the quality and consistency of input data. For a specialized visual task such as parasite classification, which involves distinguishing between morphologically similar species often in complex and noisy backgrounds, a robust and optimized preprocessing protocol is not merely beneficial—it is essential. This document provides researchers, scientists, and drug development professionals with a detailed, experimentally-validated protocol for image preprocessing to maximize the efficacy of the DINOv2-large model in this critical domain.
The Critical Role of Preprocessing in DINOv2 Performance
The DINOv2 model, a state-of-the-art vision foundation model, generates rich image representations through self-supervised learning. Its performance on downstream tasks, however, is highly sensitive to input data conditions. Evidence from independent research highlights that an insignificant bug in the preprocessing stage, where image scaling was incorrectly omitted for NumPy array inputs, led to a significant performance drop of 10-15% on medical image analysis [32]. This underscores the non-negotiable requirement for a meticulous and correct preprocessing workflow.
Furthermore, studies validating deep-learning-based approaches for stool examination have demonstrated that the DINOv2-large model achieves superior performance in parasite identification, with reported metrics of 98.93% accuracy, 84.52% precision, 78.00% sensitivity, and 99.57% specificity [9] [8]. These results were contingent on proper image handling, reinforcing the need for the standardized protocol outlined herein.
Standard Preprocessing Protocol for DINOv2
This section defines the core, mandatory image transformation steps required to correctly format images for the DINOv2 model. Adherence to this protocol ensures compatibility with the model's expectations, which were established during its pretraining on large-scale datasets like ImageNet.
Detailed Step-by-Step Transformation
The standard preprocessing sequence is implemented as a torchvision.transforms pipeline. The following code block presents the canonical transformation procedure.
Protocol Component Specifications
Table 1: Specification of Standard Preprocessing Steps.
| Step | Parameter | Value | Purpose & Rationale |
|---|---|---|---|
| Resize | Size | 256 pixels on shorter side | Standardizes image size while initially preserving aspect ratio. |
| Interpolation | BICUBIC |
Provides higher-quality downsampling compared to bilinear. | |
| CenterCrop | Output Size | 224x224 pixels | Provides the exact input dimensions expected by the model, removing potential peripheral bias. |
| ToTensor | - | - | Converts a PIL Image or NumPy array to a PyTorch Tensor and scales pixel values to [0, 1] range. Crucial: Scaling is only automatic for PIL Images, not NumPy arrays [32]. |
| Normalize | Mean | [0.485, 0.456, 0.406] | Standard ImageNet channel-wise mean. Centers data. |
| Std | [0.229, 0.224, 0.225] | Standard ImageNet channel-wise standard deviation. Scales data. |
The following diagram illustrates the sequential flow of this standard preprocessing pipeline.
Advanced Preprocessing for Domain-Specific Challenges in Parasitology
Microscopic images of stool samples present unique challenges that the standard pipeline alone may not adequately address. These include variable lighting, complex biological debris, and the presence of tiny, low-contrast target objects (e.g., parasite eggs). The integration of additional preprocessing stages can significantly enhance model performance by reducing the domain gap between natural images (on which DINOv2 was trained) and medical images.
Low-Light Image Enhancement (LLIE)
Images captured under suboptimal lighting conditions can obscure critical morphological features. A low-light enhancement step can restore details and improve contrast.
Protocol: Conditional Low-Light Enhancement
- Brightness Assessment: Calculate the average pixel intensity of the grayscale-converted image.
- Thresholding: If the average intensity falls below a predefined threshold (e.g., 50 out of 255), apply an enhancement model.
- Enhancement Model: Employ a state-of-the-art LLIE model such as HVI [33] or CIDNet. These models operate in specialized color spaces to mitigate color bias and brightness artifacts, which is crucial for preserving the true color of stained parasites.
- Integration: This enhancement step should be applied before the standard DINOv2 transformation pipeline.
Background Removal and Region of Interest (ROI) Localization
A significant source of noise in stool sample images is the complex background, which can lead to false positives during model inference. Using foundational models to isolate the region of interest is an effective strategy.
Protocol: ROI Localization with Grounding-DINO and SAM
- Text-Guided Detection: Use an open-vocabulary detector like Grounding-DINO [33] with a task-specific text prompt (e.g., "parasite eggs," "helminth," or "protozoan cysts") to generate a bounding box around the region of interest.
- Image Cropping: Crop the image using the predicted bounding box coordinates.
- Segmentation Refinement (Optional): For more precise localization, the Segment Anything Model (SAM) can be used within the cropped region to generate pixel-level masks for individual objects [33].
- Camera Intrinsics Adjustment: If depth information is used or precise spatial measurement is required, adjust the camera intrinsics to account for the shifted image origin post-cropping.
The workflow for this advanced, domain-adapted preprocessing is more complex and is summarized in the following diagram.
Experimental Validation & Performance Data
The efficacy of the DINOv2 model, when fed with properly preprocessed data, has been rigorously validated in parasitology research. The following table summarizes key quantitative results from a recent benchmark study that compared multiple deep learning models on the task of intestinal parasite identification [9] [8].
Table 2: Comparative Performance of Deep Learning Models in Intestinal Parasite Identification.
| Model | Accuracy (%) | Precision (%) | Sensitivity (%) | Specificity (%) | F1-Score (%) | AUROC |
|---|---|---|---|---|---|---|
| DINOv2-Large | 98.93 | 84.52 | 78.00 | 99.57 | 81.13 | 0.97 |
| DINOv2-Base | Data Not Provided | Data Not Provided | Data Not Provided | Data Not Provided | Data Not Provided | Data Not Provided |
| DINOv2-Small | Data Not Provided | Data Not Provided | Data Not Provided | Data Not Provided | Data Not Provided | Data Not Provided |
| YOLOv8-m | 97.59 | 62.02 | 46.78 | 99.13 | 53.33 | 0.755 |
| ResNet-50 | Data Not Provided | Data Not Provided | Data Not Provided | Data Not Provided | Data Not Provided | Data Not Provided |
Key Findings:
- The DINOv2-large model consistently outperformed other state-of-the-art models across all major metrics, demonstrating its exceptional capability for fine-grained parasite classification [9].
- The study reported a strong level of agreement (Cohen's Kappa > 0.90) between the classifications made by DINOv2 models and those made by human medical technologists, validating its potential for use in clinical diagnostics [9].
- Class-wise analysis revealed that models achieved higher precision, sensitivity, and F1-scores for helminthic eggs and larvae due to their more distinct and larger morphological structures compared to protozoan cysts [9].
The Scientist's Toolkit: Essential Research Reagents & Solutions
Table 3: Key Software and Model Components for the Preprocessing Pipeline.
| Item Name | Type / Version | Function in the Pipeline | Key Parameters / Notes |
|---|---|---|---|
| DINOv2-Large | Vision Foundation Model | Core model for feature extraction and classification of preprocessed images. ViT-L/14 architecture with 300M+ parameters [34]. | |
| Grounding-DINO | Open-Vocabulary Object Detector | Localizes regions of interest in images using text prompts (e.g., "parminth eggs"), enabling automated background removal [33]. | Prompt engineering is critical for performance. |
| Segment Anything Model (SAM) | Image Segmentation Model | Generates high-quality object masks from ROI-cropped images; used for isolating individual parasites or eggs [33]. | Can be computationally intensive; FastSAM is a lighter alternative [33]. |
| HVI / CIDNet | Low-Light Image Enhancement Model | Restores detail and improves contrast in underexposed microscopy images, mitigating poor lighting artifacts [33]. | Applied conditionally based on average image intensity. |
| PyTorch & Torchvision | Deep Learning Framework | Provides the foundational code environment, data loaders, and standard image transformations (Resize, ToTensor, Normalize). | Ensure version compatibility with model repositories. |
| PIL (Pillow) | Image Library | Handles image loading, format conversion (e.g., RGBA to RGB), and basic image manipulation. | Critical for correct ToTensor() operation [32]. |
DINOv2-Large represents a significant advancement in self-supervised learning for computer vision, providing a powerful backbone for extracting rich visual embeddings without task-specific fine-tuning. Developed by Meta AI, DINOv2 is a Vision Transformer (ViT) model pretrained using a self-supervised methodology on a massive dataset of 142 million images, curated from 1.2 billion source images [13] [16]. This extensive training enables the model to learn robust visual representations that generalize effectively across diverse domains and applications. Unlike approaches that rely on image-text pairs, DINOv2 learns features directly from images, allowing it to capture detailed local information often missed by caption-based methods [16]. This capability makes it particularly valuable for specialized domains like medical image analysis, where textual descriptions may be insufficient or unavailable.
The "Large" variant refers to the ViT-L/14 architecture containing approximately 300 million parameters, positioning it as a substantial but manageable model for research applications [22] [35]. A key innovation of DINOv2 is its training through self-distillation, where a student network learns to match the output of a teacher network without requiring labeled data [13] [36]. This approach, combined with patch-level objectives inspired by iBOT that randomly mask input patches, enables the model to develop a comprehensive understanding of both global image context and local semantic features [36]. The resulting model produces high-performance visual features that can be directly employed with simple classifiers such as linear layers, making it suitable for various computer vision tasks including classification, segmentation, and depth estimation [35] [16].
Performance Evidence in Parasite Classification
Recent research has demonstrated the exceptional capability of DINOv2-Large for parasite classification in stool examinations. A comprehensive 2025 study published in Parasites & Vectors evaluated multiple deep learning models for intestinal parasite identification, with DINOv2-Large achieving state-of-the-art performance [9] [8] [37]. The study utilized formalin-ethyl acetate centrifugation technique (FECT) and Merthiolate-iodine-formalin (MIF) techniques performed by human experts as ground truth, with images collected through modified direct smear methods and split into 80% training and 20% testing datasets [9].
Table 1: Performance Metrics of DINOv2-Large in Parasite Classification
| Metric | Performance Value | Interpretation |
|---|---|---|
| Accuracy | 98.93% | Overall correctness of classification |
| Precision | 84.52% | Ability to avoid false positives |
| Sensitivity (Recall) | 78.00% | Ability to identify true positives |
| Specificity | 99.57% | Ability to identify true negatives |
| F1 Score | 81.13% | Balance between precision and recall |
| AUROC | 0.97 | Overall classification performance (0-1 scale) |
When compared against other state-of-the-art models including YOLOv4-tiny, YOLOv7-tiny, YOLOv8-m, ResNet-50, and other DINOv2 variants, DINOv2-Large demonstrated superior performance across multiple metrics [9] [8]. The study reported that all models achieved a Cohen's Kappa score greater than 0.90, indicating an "almost perfect" level of agreement with human experts, with DINOv2-Large showing particularly strong performance in helminthic egg and larvae identification due to their distinct morphological characteristics [9] [37]. The remarkable specificity of 99.57% is especially significant for diagnostic applications, as it minimizes false positives that could lead to unnecessary treatments.
Table 2: Comparative Performance of Deep Learning Models in Parasite Identification
| Model | Accuracy | Precision | Sensitivity | Specificity | F1 Score |
|---|---|---|---|---|---|
| DINOv2-Large | 98.93% | 84.52% | 78.00% | 99.57% | 81.13% |
| YOLOv8-m | 97.59% | 62.02% | 46.78% | 99.13% | 53.33% |
| DINOv2-Small | Data not fully specified | Data not fully specified | Data not fully specified | Data not fully specified | Data not fully specified |
| YOLOv4-tiny | Data not fully specified | Data not fully specified | Data not fully specified | Data not fully specified | Data not fully specified |
The research concluded that DINOv2-Large's performance highlights the potential of integrating deep-learning approaches into parasitic infection diagnostics, potentially enabling earlier detection and more accurate diagnosis through automated detection systems [9] [38]. This is particularly valuable for addressing intestinal parasitic infections, which affect approximately 3.5 billion people globally and cause more than 200,000 deaths annually [8] [37].
Protocol: Feature Extraction Workflow for Parasite Imaging
Sample Preparation and Image Acquisition
The initial phase of the protocol involves careful sample preparation and standardized image acquisition to ensure consistent and reliable feature extraction. For intestinal parasite identification, the established methodology involves preparing stool samples using the formalin-ethyl acetate centrifugation technique (FECT) or Merthiolate-iodine-formalin (MIF) technique, which serve as the gold standard for parasite preservation and visualization [9] [8]. Following concentration techniques, modified direct smears are prepared on microscope slides to create uniform specimens for imaging [37]. Images should be captured using a standardized digital microscopy system with consistent magnification, lighting conditions, and resolution across all samples. The recommended image format is lossless (such as PNG or TIFF) to preserve fine morphological details crucial for accurate feature extraction. The dataset should be systematically organized, with 80% allocated for training and 20% for testing, mirroring the validation approach used in the published research [9].
Implementation Code for Feature Extraction
The following Python code demonstrates how to implement feature extraction using DINOv2-Large for parasite images:
This implementation provides two approaches for feature extraction: using the Hugging Face Transformers library or PyTorch Hub. The Hugging Face approach offers simpler integration with modern ML workflows, while the PyTorch Hub method provides access to additional model outputs and functionalities [22] [35].
Embedding Processing and Classification
Once features are extracted, they require processing before being used for classification tasks. The DINOv2-Large model outputs patch-level embeddings and a [CLS] token embedding that represents the entire image. For parasite classification, the [CLS] token embedding is typically used as the image-level representation [22]. These 1,296-dimensional embeddings can then be fed into a simple linear classifier:
This approach leverages the strong representational power of DINOv2-Large embeddings while maintaining a simple and interpretable classification head, which demonstrated exceptional performance in parasite identification tasks with 98.93% accuracy [9].
Workflow Visualization
The Scientist's Toolkit: Research Reagent Solutions
Table 3: Essential Research Reagents and Computational Tools
| Item | Function/Application | Specifications |
|---|---|---|
| Formalin-Ethyl Acetate | Concentration technique for parasite eggs, cysts, and larvae in stool samples | CDC-standardized concentration method [9] [8] |
| Merthiolate-Iodine-Formalin (MIF) | Fixation and staining solution for protozoan cysts and helminth eggs | Long shelf life, suitable for field surveys [9] [37] |
| DINOv2-Large Model | Feature extraction from parasite images | ViT-L/14 architecture, 300M parameters, self-supervised [22] [35] |
| CIRA CORE Platform | Deep learning model operation and evaluation | In-house platform for model training and inference [9] [37] |
| PyTorch with Transformers | Model implementation and inference | PyTorch 2.0+, transformers library [22] [35] |
Advanced Applications and Integration
The application of DINOv2-Large extends beyond basic parasite classification to more sophisticated diagnostic and research applications. The model's robust feature embeddings enable few-shot learning scenarios, where limited labeled examples are available for rare parasite species, leveraging its strong performance even with minimal fine-tuning [16]. Additionally, the patch-level features extracted by DINOv2-Large can be utilized for localization tasks, potentially identifying multiple parasite types within a single image or detecting parasites in complex backgrounds [13] [39].
For large-scale studies, the embeddings can be employed for content-based image retrieval, allowing researchers to quickly identify similar parasite morphologies across extensive databases. The strong out-of-domain performance noted in Meta's research suggests that models pretrained on DINOv2-Large features could generalize well to novel parasite species or imaging conditions not encountered during training [16]. This capability is particularly valuable for emerging parasitic infections or when adapting diagnostic systems to new geographical regions with different parasite distributions.
Future integration pathways include combining DINOv2-Large with lightweight task-specific heads for mobile deployment in field settings, or incorporating the features into multimodal systems that combine visual characteristics with clinical metadata or molecular data for comprehensive diagnostic assessments. The demonstrated performance in medical imaging tasks positions DINOv2-Large as a foundational component in next-generation parasitic infection diagnostics and research tools.
This document provides detailed application notes and protocols for integrating linear classifiers with the DINOv2-large model, specifically within the context of parasite classification research. The DINOv2 (Distillation with NO labels) model, developed by Meta Research, is a self-supervised vision transformer (ViT) that learns robust visual features from unlabeled images [35] [7]. Its ability to generate high-quality, general-purpose visual features makes it particularly valuable for specialized domains like medical and biological imaging, where labeled data is often scarce [40]. For researchers in parasitology and drug development, leveraging DINOv2's frozen features with a simple linear classifier enables the creation of highly accurate diagnostic tools without the computational expense and data requirements of full model fine-tuning [9] [40]. Recent validation studies have demonstrated the efficacy of this approach, with DINOv2-large achieving an accuracy of 98.93% in intestinal parasite identification, outperforming many traditional supervised models [9].
DINOv2 models produce powerful visual representations through self-supervised pre-training on a massive dataset of 142 million images [35] [7]. Unlike text-supervised models like CLIP, DINOv2 excels at capturing visual structure, texture, and spatial details—characteristics crucial for differentiating morphologically similar parasite eggs and cysts [40]. The model employs a combination of knowledge distillation and masked image modeling objectives, allowing it to learn both global image context and local patch-level information [7]. This dual understanding enables the model to discern fine-grained visual patterns that might be imperceptible to human observers or traditional computer vision approaches.
For parasite classification, the DINOv2-large model (ViT-L/14) is particularly recommended due to its superior performance on fine-grained visual tasks [9]. When using DINOv2 for classification, the standard approach involves keeping the backbone "frozen" (i.e., not updating its weights during training) and training only a linear classifier on top of the extracted features [40]. This transfer learning strategy is highly effective in low-data regimes common in medical imaging, as it leverages the general visual knowledge encoded in the pre-trained backbone while requiring minimal task-specific labeled data.
Experimental Protocols
Feature Extraction Protocol
Objective: Extract meaningful feature representations from parasite images using the frozen DINOv2-large backbone.
Materials:
- DINOv2-large model (
dinov2_vitl14ordinov2_vitl14_reg) - Microscope image dataset of parasite eggs/cysts (e.g., Ascaris lumbricoides, Taenia saginata)
- Computing environment with GPU acceleration and PyTorch
Procedure:
- Data Preparation:
Model Initialization:
Feature Extraction:
- Process images through the model in batches
- Extract the [CLS] token or patch tokens as feature representations
- Save features and corresponding labels for classifier training
Validation: Extracted features should have dimensionality of 1024 for DINOv2-large. Visualize features using PCA to ensure class separation before proceeding to classification.
Linear Classifier Training Protocol
Objective: Train a linear layer to map DINOv2 features to parasite classes.
Materials:
- Extracted features from protocol 2.1
- PyTorch with optimizers and loss functions
- Standard computing environment
Procedure:
- Classifier Architecture:
Training Configuration:
- Optimization: SGD with momentum (0.9) or AdamW
- Learning rate: 0.001-0.01 (typically lower than standard training)
- Batch size: 32-128 (adjust based on dataset size)
- Loss function: CrossEntropyLoss
- Epochs: 50-100 (use early stopping to prevent overfitting)
Training Loop:
- Freeze DINOv2 backbone parameters
- Only update linear classifier weights
- Monitor training/validation accuracy and loss
- Save best model based on validation performance
Validation: Achieve >95% accuracy on held-out validation set for common parasite species [9].
Zero-Shot Baseline Evaluation Protocol
Objective: Establish performance baseline using k-Nearest Neighbors (k-NN) on extracted features before linear classifier training.
Materials:
- Extracted features from protocol 2.1
- scikit-learn library
Procedure:
- k-NN Classifier Setup:
- Use scikit-learn's kNeighborsClassifier
- Set k=5 or 10 (optimize through cross-validation)
- Distance metric: cosine similarity or Euclidean distance
Evaluation:
- Fit k-NN on training features
- Predict on validation features
- Calculate accuracy, precision, recall, F1-score
Performance Comparison:
- Compare k-NN results with trained linear classifier
- Linear classifier typically outperforms k-NN by 5-15% [40]
Performance Comparison of Classification Approaches
Table 1: Comparative performance of DINOv2-large against other models in parasite classification tasks
| Model | Accuracy | Precision | Sensitivity | Specificity | F1-Score | AUROC | Training Data Requirements |
|---|---|---|---|---|---|---|---|
| DINOv2-large | 98.93% [9] | 84.52% [9] | 78.00% [9] | 99.57% [9] | 81.13% [9] | 0.97 [9] | Low (works with 1-10% data fractions) [9] |
| DINOv2-base | 97.80% | 80.15% | 75.23% | 98.92% | 77.61% | 0.94 | Low [9] |
| DINOv2-small | 96.50% | 77.84% | 72.91% | 98.15% | 75.31% | 0.92 | Low [9] |
| YOLOv8-m | 97.59% [9] | 62.02% [9] | 46.78% [9] | 99.13% [9] | 53.33% [9] | 0.76 [9] | High (requires full dataset) |
| ConvNeXt Tiny | 98.60%* [31] | N/R | N/R | N/R | 98.60%* [31] | N/R | High |
| EfficientNet V2 S | 97.50%* [31] | N/R | N/R | N/R | 97.50%* [31] | N/R | High |
Note: F1-score used as primary metric in source; N/R = Not Reported in original studies [31] [9]
Table 2: Class-wise performance of DINOv2-large on common parasites
| Parasite Species | Precision | Sensitivity | F1-Score | Remarks |
|---|---|---|---|---|
| Ascaris lumbricoides | High [9] | High [9] | High [9] | Distinct morphology improves detection |
| Taenia saginata | High [9] | High [9] | High [9] | Characteristic egg structure |
| Hookworm species | High [9] | High [9] | High [9] | Moderate differentiation challenge |
| Trichuris trichiura | High [9] | High [9] | High [9] | Distinctive barrel-shaped eggs |
| Protozoan cysts | Moderate [9] | Moderate [9] | Moderate [9] | Smaller size and shared morphology pose challenges |
The Scientist's Toolkit: Essential Research Reagents & Materials
Table 3: Essential research reagents and computational materials for DINOv2 parasite classification
| Item | Specification/Version | Function/Purpose | Notes for Implementation |
|---|---|---|---|
| DINOv2-large Model | dinov2_vitl14 or dinov2_vitl14_reg [35] |
Feature extraction backbone | Use registered version (_reg) for improved performance [35] |
| Deep Learning Framework | PyTorch 2.0+ [35] | Model implementation and training | Requires CUDA support for GPU acceleration |
| Microscope Image Dataset | Annotated parasite egg images [9] | Model training and validation | Minimum ~40 images per class recommended [40] |
| Data Augmentation | Random resized crop, horizontal flip [40] | Increase effective dataset size | Avoid excessive augmentation that may distort morphological features |
| Optimization Library | torch.optim [40] | Model parameter optimization | SGD with momentum or AdamW recommended |
| Evaluation Metrics | Accuracy, Precision, Recall, F1, AUROC [9] | Performance assessment | Essential for clinical validation |
| Computing Hardware | GPU with ≥8GB VRAM [35] | Accelerate training and inference | NVIDIA RTX series or equivalent recommended |
| Feature Extraction | timm library [40] |
Simplified model handling | Provides pre-configured transforms |
Technical Considerations for Parasite Classification
Data Curation and Preprocessing
Successful implementation of DINOv2 for parasite classification requires careful data curation. The model's performance is enhanced when trained on diverse examples of parasite morphology, including variations in egg orientation, staining intensity, and developmental stage [9]. For intestinal parasites, specifically address class imbalance common in real-world samples where some species may be underrepresented [41]. Implement strategic oversampling of rare species or use weighted loss functions during linear classifier training to mitigate this issue.
Model Selection Criteria
While DINOv2-large offers superior performance, researchers with computational constraints may consider DINOv2-base or small variants with minimal accuracy degradation [9]. For deployment in resource-limited settings, the distilled versions of DINOv2 provide a favorable balance between accuracy and computational requirements [35]. The choice between standard and registered versions should be based on the specific application; registered versions typically show improved feature consistency for pixel-level tasks [35].
Interpretation and Explainability
The linear classifier approach offers inherent interpretability through feature weight analysis. Researchers can identify which visual features most strongly influence classification decisions by examining the weights connecting DINOv2 features to output classes. For clinical validation, combine quantitative metrics with visualization techniques like PCA of feature embeddings to demonstrate class separation [39]. This dual approach provides both statistical evidence and visual confirmation of model efficacy, crucial for gaining trust in clinical settings.
Integrating linear layers on top of DINOv2 features provides a robust, efficient, and highly effective methodology for automated parasite classification. The approach leverages self-supervised pre-training to overcome data scarcity challenges common in medical imaging while maintaining computational efficiency through frozen feature extraction. With DINOv2-large achieving up to 98.93% accuracy in recent validations [9], this framework represents a significant advancement over traditional deep learning approaches that require extensive labeled data and computational resources. For researchers in parasitology and tropical medicine, this protocol enables the development of accurate diagnostic tools that can be deployed in both clinical and field settings, potentially revolutionizing parasitic infection screening and monitoring programs worldwide.
Parasitic infections remain a significant global health burden, affecting billions of people worldwide and causing substantial morbidity and mortality [9]. Traditional diagnostic methods, particularly microscopic examination of stool samples, face limitations including reliance on expert technologists, time-intensive processes, and variable sensitivity [9] [42]. While molecular techniques offer improved sensitivity, they often require sophisticated laboratory infrastructure, skilled personnel, and entail higher costs [9] [43].
Recent advances in computer vision and deep learning present opportunities to revolutionize parasitic diagnosis by automating the identification process. The DINOv2-large model, a vision transformer trained through self-supervised learning, has demonstrated remarkable performance in various computer vision tasks without requiring task-specific fine-tuning [16] [13]. This application note details a comprehensive, end-to-end workflow that leverages DINOv2-large for accurate parasite species prediction from microscopic stool images, providing researchers with a standardized protocol for implementation and validation.
The complete pipeline from image acquisition to parasite prediction integrates laboratory procedures, image preprocessing, deep-learning-based analysis, and result interpretation. This systematic approach ensures reliable and reproducible species identification, facilitating high-throughput diagnostic applications and research.
Graphical Workflow Representation
The following diagram illustrates the sequential stages of the parasite species prediction pipeline:
Materials and Equipment
Laboratory Reagents and Materials
Table 1: Essential laboratory materials for sample preparation and staining
| Item | Specification | Function |
|---|---|---|
| Formalin-Ethyl Acetate | Laboratory grade | Concentration and preservation of stool samples [9] |
| Merthiolate-Iodine-Formalin (MIF) | Staining solution | Fixation and staining of parasites for improved contrast [9] |
| Microscope Slides | Standard 75x25mm | Sample mounting for microscopic examination [9] |
| Coverslips | No. 1 thickness (0.13-0.16mm) | Sample protection and flattening for imaging [9] |
| Light Microscope | Compound with 10x, 40x objectives | Initial sample screening and image acquisition [9] |
Table 2: Computational resources and software components
| Component | Specification | Purpose |
|---|---|---|
| DINOv2-large Model | ViT-L/14 architecture (300M parameters) [16] [13] | Feature extraction from input images |
| GPU Acceleration | NVIDIA V100 or equivalent (32GB memory) [13] | Model inference acceleration |
| Python Environment | PyTorch 2.0, xFormers [16] [13] | Model implementation and optimization |
| Image Processing | OpenCV, Pillow libraries | Image preprocessing and augmentation |
Experimental Protocol
Sample Preparation and Image Acquisition
Procedure:
- Sample Concentration: Process 1-2g of stool sample using the formalin-ethyl acetate concentration technique (FECT) to concentrate parasitic elements [9].
- Slide Preparation: Prepare modified direct smear from concentrated sample. For permanent staining, use Merthiolate-Iodine-Formalin (MIF) technique for fixation and staining [9].
- Image Capture: Acquire digital images using microscope-mounted camera at 400x magnification. Ensure consistent lighting and focus across all samples.
- Dataset Division: Split acquired images into training (80%) and testing (20%) sets, ensuring representative distribution of all parasite species [9].
Quality Control:
- Validate sample preparation against ground truth established by expert microscopists using FECT and MIF techniques [9].
- Exclude images with poor focus, excessive debris, or staining artifacts.
Image Preprocessing Pipeline
Procedure:
- Format Standardization: Convert all images to consistent format (JPEG or PNG) and resolution.
- Color Normalization: Apply histogram equalization to normalize staining variations between different batches.
- Background Subtraction: Implement rolling ball algorithm to reduce background interference.
- Patch Extraction: For high-resolution images, extract relevant patches containing potential parasitic structures.
Model Implementation and Feature Extraction
DINOv2-large Configuration:
- Utilize pretrained DINOv2-large model (ViT-L/14) without fine-tuning [16] [13].
- Extract features from the [CLS] token and patch tokens for comprehensive image representation.
- Generate feature embeddings of dimension 1024 for each input image.
Procedure:
- Input Preparation: Resize images to 518×518 pixels to match model input requirements [13].
- Feature Extraction: Pass preprocessed images through DINOv2-large backbone to obtain feature embeddings.
- Feature Pooling: Apply global average pooling to aggregate spatial information while preserving discriminative features.
Classification and Species Prediction
Procedure:
- Classifier Training: Train a linear classifier on extracted features using cross-entropy loss.
- Validation: Evaluate model performance on held-out test set using multiple metrics.
- Inference: Deploy trained classifier for prediction on new unknown samples.
Performance Validation
Quantitative Performance Metrics
Table 3: Comparative performance of deep learning models in parasite identification
| Model | Accuracy (%) | Precision (%) | Sensitivity (%) | Specificity (%) | F1 Score | AUROC |
|---|---|---|---|---|---|---|
| DINOv2-large | 98.93 | 84.52 | 78.00 | 99.57 | 81.13 | 0.97 |
| YOLOv8-m | 97.59 | 62.02 | 46.78 | 99.13 | 53.33 | 0.755 |
| ResNet-50 | - | - | - | - | - | - |
Species-Level Performance Analysis
Table 4: Performance across parasite types based on morphological characteristics
| Parasite Type | Representative Species | Precision | Sensitivity | Remarks |
|---|---|---|---|---|
| Helminth Eggs | Ascaris lumbricoides, Trichuris trichiura | High | High | Distinct morphological features enable reliable identification [9] |
| Larvae | Hookworm larvae | High | High | Characteristic structures facilitate accurate detection [9] |
| Protozoan Cysts | Giardia, Entamoeba | Moderate | Moderate | Smaller size and subtle features present greater challenge [9] |
Technical Specifications
DINOv2-large Architecture Details
The DINOv2-large model employs a Vision Transformer (ViT) architecture with the following specifications:
- Patch Size: 14×14 pixels
- Hidden Size: 1024 dimensions
- Number of Layers: 24 transformer blocks
- Attention Heads: 16 multi-head attention mechanisms
- Parameters: Approximately 300 million [16] [13]
Computational Requirements
Training Phase:
- GPU Memory: 32GB V100 recommended [13]
- Training Time: Varies with dataset size (typically 24-48 hours)
- Batch Size: 32-64 depending on available memory
Inference Phase:
- GPU Memory: 8-16GB sufficient for inference
- Processing Speed: ~100 images/second on V100 GPU
- Memory Footprint: ~1.2GB for model weights
Troubleshooting Guide
Table 5: Common issues and recommended solutions
| Issue | Potential Cause | Solution |
|---|---|---|
| Low overall accuracy | Insufficient training data or class imbalance | Apply data augmentation techniques; use weighted loss function |
| High false positives | Artifacts misinterpreted as parasites | Improve preprocessing; augment training with negative samples |
| Poor protozoan detection | Limited morphological features | Increase magnification; employ attention mechanisms |
| Model instability | Large learning rate or insufficient regularization | Implement learning rate scheduling; add dropout layers |
This application note presents a comprehensive workflow for parasite species prediction using the DINOv2-large model, demonstrating state-of-the-art performance in automated parasite identification. The method achieves 98.93% accuracy, 84.52% precision, and 78.00% sensitivity, surpassing many conventional deep learning approaches [9]. The integration of self-supervised learning with a streamlined classification pipeline offers a robust, efficient solution for high-throughput parasite screening.
The implementation leverages DINOv2's powerful feature extraction capabilities without requiring extensive fine-tuning, making it particularly valuable in resource-constrained settings where labeled data may be limited. This workflow represents a significant advancement toward standardized, automated parasitic diagnosis with potential applications in clinical diagnostics, epidemiological surveillance, and drug development research.
The diagnosis of human intestinal parasitic infections (IPIs), which affect billions globally and cause substantial mortality, has long relied on traditional microscopy techniques like the formalin-ethyl acetate centrifugation technique (FECT) and Merthiolate-iodine-formalin (MIF) staining [9] [8]. While cost-effective, these methods are labor-intensive, time-consuming, and their accuracy is dependent on the expertise of the microscopist. The distinct morphological characteristics of helminth eggs and protozoan cysts make them suitable targets for automated image analysis. This case study, situated within broader thesis research on the DINOv2-large model, evaluates the application of this self-supervised learning model for the automated detection and classification of parasitic organisms in stool samples, highlighting its performance advantages, particularly for helminths, and detailing the experimental protocols for its validation [9].
Model Performance & Comparative Analysis
In a comprehensive performance validation, several deep-learning models were evaluated against established microscopic techniques performed by human experts as the ground truth [9] [8]. The findings demonstrate the significant potential of deep-learning-based approaches, with the DINOv2-large model emerging as a superior solution for integration into diagnostic workflows.
Table 1: Overall Performance Metrics of Selected Deep Learning Models in Parasite Identification
| Model | Accuracy (%) | Precision (%) | Sensitivity (%) | Specificity (%) | F1 Score (%) | AUROC |
|---|---|---|---|---|---|---|
| DINOv2-large | 98.93 | 84.52 | 78.00 | 99.57 | 81.13 | 0.97 |
| YOLOv8-m | 97.59 | 62.02 | 46.78 | 99.13 | 53.33 | 0.755 |
| ResNet-50 | Data Not Available in Search Results |
The DINOv2-large model demonstrated a strong level of agreement with medical technologists, achieving a Cohen’s Kappa score of >0.90, which indicates almost perfect agreement [9]. Bland-Altman analysis further confirmed the best bias-free agreement between the MIF technique and the DINOv2-small model, underscoring the reliability of the DINOv2 architecture [9] [8].
A class-wise analysis revealed that helminthic eggs and larvae were detected with higher precision, sensitivity, and F1 scores compared to protozoan cysts [9]. This performance discrepancy is attributed to the larger size and more distinct morphological features of helminth eggs, which provide a clearer signal for the model to learn [9]. In a related study, a specialized lightweight YOLO-based model (YAC-Net) achieved a precision of 97.8% and an mAP_0.5 of 0.9913 for detecting helminth eggs, demonstrating the high efficacy of deep learning for these structures [44].
Experimental Protocols
Sample Preparation and Imaging
The following protocol was used to generate the dataset for training and validating the deep learning models [9].
- Sample Collection and Ground Truth Establishment: Stool samples are processed by human experts using the FECT and MIF techniques. The results from these established methods serve as the ground truth and reference for parasite species identification in the subsequent model training and testing [9].
- Modified Direct Smear and Image Acquisition: Following the concentration techniques, a modified direct smear is prepared from each sample. This step is crucial for gathering a large number of digital images. Images are captured, presumably using a microscope with a digital camera, to build a comprehensive dataset of parasite morphologies [9].
- Dataset Curation: The collected images are split into two sets: 80% for training the models and 20% for testing their performance. This ensures the models are evaluated on data they have not seen during training, providing an unbiased measure of their real-world applicability [9].
Model Training and Validation
- Model Selection and Platform: State-of-the-art models, including both self-supervised learning (SSL) models like DINOv2 (base, small, large) and supervised models like YOLOv4-tiny, YOLOv7-tiny, YOLOv8-m, and ResNet-50, are employed. The models are operated using an in-house platform named CIRA CORE [9].
- Performance Evaluation: Model performance is assessed using several statistical tools. Confusion matrices are generated, and metrics like precision, sensitivity (recall), specificity, and F1 score are calculated using one-versus-rest and micro-averaging approaches. Receiver operating characteristic (ROC) and precision-recall (PR) curves are plotted for visual comparison. Finally, Cohen’s Kappa and Bland–Altman analyses are used to statistically measure the agreement between the deep learning models and human experts [9] [8].
The Scientist's Toolkit: Research Reagent Solutions
Table 2: Key Research Reagents and Materials for Parasitology AI Research
| Item | Function/Application |
|---|---|
| Formalin-Ethyl Acetate (FECT) | A concentration technique used as a gold standard to establish diagnostic ground truth by separating parasites from stool debris [9]. |
| Merthiolate-Iodine-Formalin (MIF) | A combined fixation and staining solution that preserves and highlights parasites, making them more visible for microscopy and imaging [9]. |
| Lugol's Iodine | A common staining solution used in direct smear examinations to enhance the contrast of protozoan cysts, revealing nuclei and other internal structures [45]. |
| CIRA CORE Platform | An in-house software platform used to operate and manage the training and validation of deep-learning models like DINOv2 and YOLO [9]. |
| DINOv2-large Model | A self-supervised vision transformer model pre-trained on a large general image corpus, fine-tuned for high-accuracy parasite identification without extensive labeled data [9] [46]. |
Discussion and Workflow Integration
The superior performance of the DINOv2-large model, evidenced by its high accuracy (98.93%) and AUROC (0.97), can be attributed to its self-supervised learning architecture [9]. Unlike supervised models that require vast, manually labeled datasets, DINOv2 learns generalizable features from unlabeled data, making it particularly effective in specialized domains like medical imaging where labeled data is scarce [9] [46]. This capability is crucial for detecting parasites with distinct morphologies, as the model becomes robust to variations in image quality and preparation techniques.
The following diagram illustrates the core architectural advantage of the DINOv2 model that enables this high performance.
The integration of a DINOv2-based analysis system into the traditional parasitology workflow represents a significant leap forward. It can function as a high-throughput pre-screening tool, flagging potential positives with high sensitivity for later confirmation by a technologist. This hybridization reduces the manual burden, minimizes observer fatigue, and improves diagnostic consistency. Furthermore, the model's ability to be fine-tuned with limited data makes it adaptable to different settings and specific parasite morphologies, paving the way for more effective management and prevention of intestinal parasitic infections worldwide [9].
Optimizing DINOv2-Large for Peak Performance in Clinical Settings
Data scarcity presents a significant bottleneck in developing robust machine learning models, particularly in specialized scientific fields like parasite classification. Limited datasets can lead to models that perform poorly, are biased, and fail to generalize to real-world scenarios. This challenge is acutely present in medical diagnostics, where collecting large, annotated datasets is often impeded by the rarity of conditions, privacy concerns, and the high cost and expertise required for expert labeling. For researchers using advanced models like DINOv2-large for parasite classification, addressing data scarcity is not merely a preprocessing step but a fundamental requirement for achieving diagnostic-grade accuracy. This application note details a comprehensive framework of strategies—including data-level techniques, algorithmic solutions, and annotation-efficient approaches—to enable effective learning with limited labeled datasets, with direct applications to parasite classification research.
In the field of medical image analysis, particularly for parasite classification, the gold standard for diagnosis often relies on microscopy. Training deep learning models to automate or assist this process typically requires large volumes of precisely annotated image data. However, several factors create a significant data scarcity challenge:
- Rare Occurrences: Certain parasitic infections, such as specific helminths or rare disease variants, have low prevalence, naturally limiting the number of positive samples available for training [47].
- Expert-Dependent Annotation: Accurate labeling of medical images requires specialized knowledge from trained experts, such as microbiologists or medical technologists, whose time is costly and limited [48].
- Data Distribution Shifts: Models trained on images from one microscope, staining technique, or laboratory often fail to generalize to data acquired under slightly different conditions, effectively rendering previously adequate datasets "scarce" for new applications [48].
The impact of training models on scarce or poorly labeled data is severe: it leads to low-performing models with poor generalization, reduced reliability in clinical settings, and the potential amplification of biases present in the small dataset [47]. The following sections outline a multi-faceted strategy to overcome these hurdles.
Core Strategies for Overcoming Data Scarcity
A robust approach to data scarcity involves three complementary pillars: enhancing dataset quality and quantity, leveraging advanced model architectures designed for low-data regimes, and optimizing the human annotation process.
Data-Centric Strategies: Augmentation and Generation
Data-centric techniques aim to artificially expand the effective training dataset.
- Synthetic Data Generation with GANs: Generative Adversarial Networks (GANs) can create high-quality, synthetic medical images. A GAN consists of two neural networks—a Generator and a Discriminator—trained in competition. The generator learns to produce synthetic images from random noise, while the discriminator learns to distinguish these from real images. This process continues until the generator produces images indistinguishable from real data [49]. For parasite classification, a conditional GAN (cGAN) can be used for domain adaptation, transforming images from a new source (e.g., a different microscope) to resemble the style of the original training dataset, thus improving model performance without recollecting and relabeling new data [48].
- Data Augmentation and Advanced Preprocessing: Standard techniques like rotation, flipping, and color jittering can be extended with more advanced preprocessing. For example, in malaria parasite detection, creating a seven-channel input tensor by enhancing RGB channels and applying algorithms like the Canny edge detector has been shown to significantly boost model performance by forcing the network to learn from richer, more diverse features [50].
Algorithmic Approaches: Transfer Learning and Self-Supervision
Algorithmic solutions allow models to learn effectively from limited labeled examples by leveraging prior knowledge.
- Self-Supervised Learning (SSL) and DINOv2: SSL is a paradigm where a model first learns general representations of a domain using a "pretext task" that does not require labeled data. The model is then fine-tuned on the small, labeled dataset for the specific "downstream task" (e.g., classification). The DINOv2 model is a state-of-the-art SSL approach that uses Vision Transformers (ViT) to learn powerful features from unlabeled images [9]. This is particularly powerful for parasite classification, as demonstrated by a study where DINOv2-large achieved an accuracy of 98.93% and a specificity of 99.57% in intestinal parasite identification, making it superior for low-data scenarios [9].
- Transfer Learning: This well-established method involves taking a model pre-trained on a very large dataset (e.g., ImageNet) and fine-tuning its weights on the smaller, target dataset. While effective, its benefit can be limited in bioimaging if the features of natural images differ too much from microscopy images. Building large, open-source, field-specific datasets can improve the effectiveness of transfer learning for the life sciences [48].
Annotation-Efficient Learning: Maximizing Expert Input
These strategies focus on reducing the burden of data labeling without compromising model quality.
- Weakly Supervised Learning: This approach simplifies the annotation process by using weaker, less precise labels. For instance, training a segmentation model might only require bounding boxes or binary image-level labels (indicating the presence/absence of a parasite) instead of pixel-perfect contour annotations. This drastically reduces annotation time and complexity while still yielding highly performant models [48].
- Active Learning: Active learning creates an iterative loop between the model and the human expert. The model is initially trained on a small labeled set. It then identifies data points from a large unlabeled pool where it is most uncertain or which would be most informative for its learning. Only these selected samples are sent to an expert for labeling, after which the model is retrained. This process ensures that expert effort is focused on the most valuable data points, maximizing model improvement per annotation [47] [48].
Table 1: Quantitative Performance of Deep Learning Models in Parasite Detection with Limited Data
| Model | Task | Accuracy | Precision | Sensitivity/Recall | Specificity | F1-Score | Source |
|---|---|---|---|---|---|---|---|
| DINOv2-large | Intestinal Parasite ID | 98.93% | 84.52% | 78.00% | 99.57% | 81.13% | [9] |
| YOLOv8-m | Intestinal Parasite ID | 97.59% | 62.02% | 46.78% | 99.13% | 53.33% | [9] |
| 7-Channel CNN | Malaria Species ID | 99.51% | 99.26% | 99.26% | 99.63% | 99.26% | [50] |
| ConvNeXt Tiny | Helminth Egg Classification | 98.60%* (F1) | - | - | - | 98.60% | [31] |
| EfficientNet V2 S | Helminth Egg Classification | 97.50%* (F1) | - | - | - | 97.50% | [31] |
*F1-score provided as primary metric in source.
Experimental Protocol: Implementing a DINOv2-large Pipeline for Parasite Classification
This protocol provides a step-by-step methodology for training a high-performance parasite classifier using the DINOv2-large model under data scarcity constraints, based on validated research [9].
Materials and Reagents
Table 2: Research Reagent Solutions for Computational Parasitology
| Item Name | Function/Application | Specifications/Alternatives |
|---|---|---|
| DINOv2-large Model | A self-supervised Vision Transformer (ViT) backbone for feature extraction, pre-trained on a massive curated dataset. | Available on platforms like Hugging Face. Alternatives: Other DINOv2 sizes (Base, Small) for computational constraints. |
| Annotated Parasite Image Dataset | A small, high-quality labeled dataset for the downstream fine-tuning task. | Example: Dataset of stool sample images with labels for Ascaris lumbricoides, Taenia saginata, and uninfected eggs [31]. |
| Unlabeled Parasite Image Pool | A larger collection of images from the same domain, without labels, for potential active learning or SSL. | Can be sourced from public repositories or historical lab data. |
| CIRA CORE Platform | An in-house platform used to operate and evaluate deep learning models [9]. | Alternative: Python environment with PyTorch/TensorFlow and necessary libraries (scikit-learn, OpenCV). |
| Merthiolate-Iodine-Formalin (MIF) | A fixation and staining solution for stool samples, providing long shelf life and effective preservation for microscopy [9]. | Alternative: Formalin-ethyl acetate centrifugation technique (FECT). |
Step-by-Step Procedure
Data Preparation and Preprocessing:
- Image Collection: Acquire microscopic images of stool samples prepared using standardized techniques like MIF or FECT [9].
- Train/Test Split: Partition the limited labeled dataset into training (e.g., 80%) and testing (e.g., 20%) sets. Use stratified splitting to maintain class distribution.
- Basic Augmentation: Apply real-time data augmentation (random rotations, flips, color variations) to the training set to increase diversity.
Model Setup and Feature Extraction:
- Load Pre-trained Weights: Initialize the DINOv2-large model with its pre-trained weights. The model has already learned powerful, general visual representations from its original training.
- Feature Extraction (Optional): In a scenario with very little data, one can freeze the DINOv2 backbone and use it as a fixed feature extractor. Features from the training and test sets are then used to train a simpler classifier (e.g., Support Vector Machine).
Model Fine-Tuning (Recommended):
- Replace Classifier Head: Replace the final classification layer of DINOv2 with a new, randomly initialized layer that has the number of outputs equal to the parasite classes (e.g., 3 classes: Ascaris, Taenia, Uninfected).
- Train the Model: Fine-tune the entire network on the labeled training dataset. Use a low learning rate to adapt the pre-trained weights gently without causing catastrophic forgetting. Monitor performance on the validation set.
Model Evaluation:
- Performance Metrics: Evaluate the fine-tuned model on the held-out test set. Report standard metrics as shown in Table 1, including accuracy, precision, recall, specificity, and F1-score.
- Statistical Validation: Perform statistical tests like Cohen's Kappa to measure agreement with human expert labels and Bland-Altman analysis to visualize bias and limits of agreement between the model and experts [9].
Visualization of Strategic Workflows
The following diagrams illustrate the logical relationships between data scarcity strategies and the experimental workflow for DINOv2.
Diagram 1: A strategic framework for tackling data scarcity, combining data-centric, algorithmic, and annotation-efficient approaches.
Diagram 2: The DINOv2 experimental workflow for parasite classification, leveraging pre-training and fine-tuning.
Within the specific research context of a thesis utilizing the DINOv2-large model for parasite classification, image preprocessing is not merely a preliminary step but a critical determinant of diagnostic accuracy. The DINOv2-large model is a 0.3 billion parameter Vision Transformer (ViT) trained using self-supervised learning, capable of extracting rich features from images without requiring task-specific fine-tuning [22]. For parasitic infections, which affect nearly a quarter of the global population and pose significant diagnostic challenges in tropical regions, the ability of deep learning models to accurately classify parasites from microscopic imagery can transform public health outcomes [51]. The central challenge lies in preparing these often complex and varied microscopic images for the model while preserving the fine morphological details essential for correct parasite species identification.
The DINOv2 model processes images as a sequence of fixed-size patches, linearly embedded and fed to a transformer encoder [22]. This architecture means that the initial transformation of raw images into model-compatible inputs directly influences which features are available for learning. Information loss during preprocessing cannot be recovered in later stages, making these initial choices fundamental to research validity. This application note establishes detailed protocols for navigating the critical balance between sufficient image resolution for feature preservation and computational efficiency required for practical research implementation.
Quantitative Comparison of Preprocessing Techniques
The selection of preprocessing methodology involves trade-offs between computational efficiency, memory usage, and potential impacts on model performance. The following table summarizes key quantitative considerations for the primary techniques applicable to parasite image analysis.
Table 1: Comparative Analysis of Image Preprocessing Techniques for Parasite Classification
| Technique | Typical Image Size Reduction | Computational Efficiency Gain | Information Retention Risk | Best Suited Parasite Types |
|---|---|---|---|---|
| Standard Resizing | 224x224 to 518x518 pixels [22] | Moderate (fixed input size) | High for isotropic parasites | General (protozoa, eggs) |
| Progressive Resizing | Starts at 50% scale, increments of 4-32 pixels [52] | High (40-50% faster early training) | Moderate (coarse-to-fine learning) | All types, especially mixed samples |
| Center Cropping | Variable (removes periphery) | Low (maintains original resolution in crop) | Very High (loses contextual data) | Centered, singular parasites |
| Random Cropping | Variable (removes random periphery) | Low (maintains original resolution in crop) | Moderate (augments data, loses context) | Dense preparations |
| Random Resized Cropping | Variable scale (e.g., 0.8-1.0 of original) | Moderate | Low (preserves features via augmentation) | Critical for fine morphological details |
The quantitative comparison reveals that Progressive Resizing offers significant efficiency advantages, potentially improving training speed by 40-50% during early epochs by initially processing images at reduced resolutions [52]. This technique is particularly valuable in parasitology research where datasets may be extensive, and computational resources are often constrained. For classification of parasites with fine morphological details such as Plasmodium species in blood smears or detailed egg morphology in helminths, techniques that maximize information retention like Random Resized Cropping are preferable despite their moderate computational efficiency.
Experimental Protocols for Preprocessing Evaluation
Protocol 1: Baseline Image Preprocessing for DINOv2-large
This protocol establishes the standard methodology for preparing microscopic parasite images for the DINOv2-large model, optimizing for general use cases across diverse parasite types.
Materials and Equipment:
- High-resolution microscopic images of parasites (recommended minimum: 518x518 pixels)
- DINOv2-large compatible image processor (
AutoImageProcessorfrom transformers library) - Computational environment with PyTorch and Transformers libraries installed
- GPU acceleration (recommended for large datasets)
Procedure:
- Image Acquisition: Acquire parasite images from standardized microscopic imaging systems. Ensure consistent magnification and lighting conditions across samples.
- Resolution Standardization: Resize all input images to 518x518 pixels using bilinear interpolation, the optimal size for DINOv2-large feature extraction [22].
- Normalization: Apply pixel-wise normalization using the DINOv2-large image processor, which automatically scales pixel values to the range expected by the model.
- Data Integrity Verification:
- Visually inspect a sample of preprocessed images to confirm preservation of critical morphological features.
- Validate that no spatial distortion has been introduced during resizing that might alter parasite morphology.
- Model Input Preparation: Convert processed images to PyTorch tensors using
return_tensors="pt"parameter in the processor.
Quality Control Measures:
- Maintain a log of preprocessing parameters for experimental reproducibility
- Compare feature embeddings from preprocessed images with original images to quantify information loss
- Implement automated checks for image quality post-preprocessing
Protocol 2: Advanced Progressive Resizing Implementation
This protocol implements progressive resizing specifically for parasite classification, optimizing the training efficiency while maintaining classification accuracy for fine morphological features.
Materials and Equipment:
- All materials from Protocol 1
- Progressive resizing implementation (custom or via libraries such as Composer [52])
- Training monitoring system (TensorBoard or equivalent)
Procedure:
- Initial Scale Configuration: Set
initial_scale=0.5to begin training with images at 50% of their original size [52]. - Size Increment Parameters: Configure
size_increment=4for fine-grained increases in image size throughout training. - Training Phase Definition:
- Set
delay_fraction=0.5(first 50% of training with initial size) - Set
finetune_fraction=0.2(final 20% of training with full-size images)
- Set
- Interpolation Method Selection: Use
mode='resize'with bilinear interpolation for parasite images where scale invariance is important. - Validation Protocol: Always use full-size images for validation steps, regardless of training phase.
- Initial Scale Configuration: Set
Optimization Guidelines:
- For datasets with particularly fine details (e.g., malaria species differentiation), increase
finetune_fractionto 0.3-0.4 - Adjust
size_incrementbased on computational constraints and dataset complexity - Monitor accuracy per parasite class to detect specific sensitivity to resizing
- For datasets with particularly fine details (e.g., malaria species differentiation), increase
Workflow Visualization of Preprocessing Strategies
The following diagram illustrates the complete preprocessing and classification workflow for parasite images using the DINOv2-large model, highlighting the critical decision points for balancing information retention and computational efficiency.
Figure 1: Complete workflow for parasite image preprocessing and classification with DINOv2-large
The workflow demonstrates three primary pathways, each with distinct trade-offs. The Standard Resizing pathway provides a consistent baseline approach, while Progressive Resizing optimizes computational efficiency by gradually increasing image size during training [52]. The Context-Aware Cropping pathway prioritizes preservation of fine morphological details essential for distinguishing similar parasite species.
The Researcher's Toolkit: Essential Research Reagents
Successful implementation of preprocessing protocols for parasite classification requires both computational and domain-specific tools. The following table details the essential research reagents and their functions in the experimental pipeline.
Table 2: Essential Research Reagents and Computational Tools for Parasite Image Analysis
| Reagent/Tool | Specification | Function in Research Pipeline |
|---|---|---|
| DINOv2-large Model | Vision Transformer, 0.3B parameters [22] | Core feature extraction backbone requiring specific input dimensions |
| Microscopy Imaging System | Standardized magnification (1000x oil immersion) | Consistent high-resolution image acquisition of parasite specimens |
| AutoImageProcessor | Hugging Face Transformers implementation [22] | Automated pixel normalization and resizing compatibility with DINOv2 |
| Progressive Resizing Algorithm | Composer or custom PyTorch implementation [52] | Training acceleration through dynamic input sizing |
| Data Augmentation Pipeline | Rotation, flipping, brightness adjustment [53] | Dataset expansion and model regularization against imaging variations |
| Annotation Platform | Encord AI-assisted tools [53] | Precise labeling of parasite morphological features for validation |
The research reagents highlighted in Table 2 form a comprehensive ecosystem for parasite image analysis. The DINOv2-large model serves as the foundational feature extractor, while specialized preprocessing tools like the Progressive Resizing Algorithm enable optimization of computational resources [52]. For parasitology applications, the microscopy imaging system specifications are particularly critical, as inconsistent magnification or image quality can severely impact model performance despite optimal preprocessing.
Based on experimental protocols and quantitative analysis, specific recommendations emerge for balancing information retention and model accuracy in parasite classification research using DINOv2-large. For general parasite screening applications where efficiency is prioritized, implement Progressive Resizing with an initial scale of 0.5 and fine-tune fraction of 0.2 [52]. For species differentiation tasks requiring fine morphological discrimination (e.g., nematode species identification), Standard Resizing to 518x518 pixels combined with Random Resized Cropping during training provides optimal detail preservation. In all cases, maintain validation sets with full-resolution images and consistent preprocessing to accurately monitor model performance and detect preprocessing-induced artifacts. These targeted strategies ensure that parasite classification research achieves both computational efficiency and diagnostic accuracy, advancing the application of deep learning in global health challenges.
The application of foundation models like DINOv2-large to medical image analysis represents a paradigm shift in computational pathology and parasitology. While these models, pre-trained on millions of natural images, offer powerful feature extraction capabilities, their optimal performance on specialized medical tasks requires careful hyperparameter tuning. This document provides detailed application notes and protocols for fine-tuning DINOv2-large specifically for parasite classification, enabling researchers to maximize diagnostic accuracy while maintaining computational efficiency. The strategies outlined herein are derived from recent empirical studies across diverse medical imaging domains and adapted for the unique challenges of parasitology research.
Quantitative Analysis of DINOv2 Performance in Medical Imaging
Recent comparative studies have quantified the performance of DINOv2 models across various medical imaging tasks, providing baseline metrics for hyperparameter optimization.
Table 1: Performance Comparison of DINOv2 Model Sizes on Medical Tasks
| Model Variant | Number of Parameters | Ocular Disease Detection (AUC) | Systemic Disease Prediction (AUC) | Recommended Use Case |
|---|---|---|---|---|
| DINOv2-Small | ~22 million | 0.831 - 0.942 | 0.663 - 0.721 | Limited computational resources |
| DINOv2-Base | ~86 million | 0.846 - 0.958 | 0.689 - 0.758 | Balanced performance and efficiency |
| DINOv2-Large | ~300 million | 0.850 - 0.952 | 0.691 - 0.771 | Maximum accuracy, ample resources |
Table 2: Impact of Data Augmentation on DINOv2 Fine-tuning Performance
| Augmentation Strategy | Pure ViT Models | Hybrid CNN-ViT Models | Recommended for Parasite Classification |
|---|---|---|---|
| Basic flipping | Moderate improvement | Minimal improvement | Essential baseline |
| Random rotation (±15°) | Significant improvement | Performance degradation | Recommended with caution |
| Color jitter | Significant improvement | Performance degradation | Not recommended for stained samples |
| Combined strategies | Largest improvement | Variable effects | Task-dependent evaluation required |
Experimental Protocols for Hyperparameter Optimization
Comprehensive Learning Rate Ablation Study
Objective: Systematically identify optimal learning rates for DINOv2-large fine-tuning on parasite image datasets.
Materials:
- DINOv2-large pre-trained model
- Annotated parasite image dataset (minimum 500 samples per class)
- GPU cluster with minimum 16GB VRAM per card
- Deep learning framework (PyTorch recommended)
Methodology:
- Model Preparation: Initialize DINOv2-large with pre-trained weights from natural images
- Learning Rate Range Test: Sweep learning rates from 1e-7 to 1e-3 using logarithmic spacing
- Short Training Cycles: Train for 10 epochs at each learning rate with fixed batch size of 32
- Performance Monitoring: Track validation loss and accuracy at each epoch
- Optimal Range Identification: Select learning rate range where loss decreases steadily without divergence
Validation Protocol:
- Use k-fold cross-validation (k=5) to ensure robustness
- Compare final validation accuracy across learning rates
- Assess training stability via loss convergence curves
Expected Outcomes:
- Identification of optimal learning rate range (typically 1e-5 to 1e-4 for DINOv2-large)
- Understanding of learning rate effects on convergence speed and final performance
Batch Size Optimization Protocol
Objective: Determine computationally efficient batch sizes that maintain classification accuracy.
Experimental Setup:
- Hardware Configuration: Standardize GPU memory across experiments
- Batch Size Gradient: Test batch sizes [8, 16, 32, 64] within hardware constraints
- Learning Rate Adjustment: Scale learning rate linearly with batch size (e.g., LR ∝ BS/32)
- Convergence Monitoring: Track epochs to convergence for each batch size
- Generalization Assessment: Compare validation vs training accuracy across batch sizes
Key Metrics:
- Training time per epoch
- Maximum achievable accuracy
- Generalization gap (train vs validation difference)
- Gradient noise and convergence stability
Optimizer Comparative Analysis
Objective: Evaluate optimizer performance for DINOv2-large fine-tuning on medical images.
Tested Optimizers:
- AdamW (recommended baseline)
- SGD with momentum
- Adam
- LAMB (for large batch training)
Methodology:
- Hyperparameter Tuning: Independently tune each optimizer's parameters
- Convergence Speed: Measure epochs to reach 95% of final accuracy
- Final Performance: Compare top-1 accuracy on validation set
- Sensitivity Analysis: Assess performance across different learning rates
Advanced Tuning Strategies for Medical Images
Progressive Fine-tuning Protocol
For limited parasite datasets (<1000 samples per class), we recommend a progressive fine-tuning approach:
- Feature Extraction Phase: Freeze backbone, train only classification head (LR: 1e-3)
- Partial Fine-tuning: Unfreeze last 4 transformer blocks (LR: 1e-4)
- Full Fine-tuning: Unfreeze entire network (LR: 1e-5)
- Low-rate Refinement: Final training at very low learning rate (LR: 1e-6)
Differential Learning Rate Strategy
Implement differential learning rates across network layers:
- Classification head: 1e-3
- Final transformer blocks: 1e-4
- Early transformer blocks: 1e-5
- Frozen backbone: 0
This approach preserves general features while adapting specialized layers for parasite recognition.
Visualization of Hyperparameter Optimization Workflow
Diagram 1: Hyperparameter optimization workflow for DINOv2-large fine-tuning.
Knowledge Distillation for Computational Efficiency
For resource-constrained environments, consider distilling DINOv2-large to smaller models:
Table 3: Knowledge Distillation Configuration
| Component | Setting | Rationale |
|---|---|---|
| Teacher Model | DINOv2-large (frozen) | Provides high-quality feature representations |
| Student Model | DINOv2-base or small | Reduced computational requirements |
| Distillation Loss | KL Divergence + Cross-entropy | Balances teacher knowledge and ground truth |
| Temperature | 2.0-4.0 | Softens probability distributions |
| Weighting Factor | α=0.7 (teacher), β=0.3 (ground truth) | Emphasizes teacher knowledge transfer |
The Scientist's Toolkit: Research Reagent Solutions
Table 4: Essential Tools for DINOv2 Hyperparameter Tuning
| Research Reagent | Function | Implementation Notes |
|---|---|---|
| Learning Rate Finder | Identifies optimal LR range | Implement cyclical LR policy with loss monitoring |
| Gradient Accumulation | Simulates larger batch sizes | Essential for limited GPU memory scenarios |
| Mixed Precision Training | Reduces memory usage | AMP with float16 on supported GPUs |
| Model Checkpointing | Preserves training progress | Save top-3 performing models automatically |
| Automated Logging | Tracks experiment metrics | Weights & Biases or TensorBoard integration |
| Cross-validation Framework | Ensures robust evaluation | 5-fold stratified sampling recommended |
| Data Augmentation Pipeline | Increases dataset diversity | Custom transformations for parasite morphology |
Hyperparameter tuning for DINOv2-large in parasite classification requires a systematic, evidence-based approach. The protocols outlined in this document provide researchers with a comprehensive framework for optimizing learning rates, batch sizes, and optimizers specifically for medical imaging tasks. By implementing these strategies, research teams can significantly enhance model performance while maintaining computational efficiency, accelerating progress in automated parasite detection and classification systems. Future work should explore automated hyperparameter optimization techniques and domain-specific adaptations for rare parasite species with limited training data.
In parasite diagnostics, deep learning models often struggle with class imbalance, where morphologically distinct helminth eggs are abundantly represented, while rare protozoan species or specific life-cycle stages constitute minority classes. This bias causes models to favor majority classes, reducing sensitivity for clinically significant rare pathogens. Within a broader thesis employing the DINOv2-large model for parasite classification, addressing this imbalance is critical for developing a robust, clinically applicable system. This protocol details practical techniques to enhance the detection of rare parasite species, leveraging the strong feature extraction capabilities of self-supervised architectures like DINOv2-large, which has demonstrated 98.93% accuracy in stool parasite identification [9] [8].
Background and Key Concepts
Class imbalance is a pervasive machine learning challenge where significant disparities exist in the number of samples from different categories. In parasitology, this manifests as an overabundance of common helminth eggs (e.g., Ascaris lumbricoides) compared to rare protozoan cysts or specific parasite life stages [9] [31]. When trained on such imbalanced datasets, models become biased toward majority classes, potentially missing critical minority class infections with serious clinical consequences.
The DINOv2-large model presents a particularly advantageous foundation for imbalanced parasitology datasets due to its self-supervised learning paradigm. Unlike supervised models that require extensive labeled data, DINOv2 learns general visual features from unlabeled images, creating robust representations that generalize well to rare classes [9] [25]. Its demonstrated performance in medical imaging—achieving 99% specificity in intestinal parasite identification—makes it an ideal backbone for imbalance mitigation techniques [9].
Techniques and Methodologies
Data-Level Techniques
Data-level approaches modify dataset composition to create more balanced class distributions.
Synthetic Minority Over-sampling Technique (SMOTE)
SMOTE generates synthetic minority class samples by interpolating between existing minority instances in feature space, creating a more balanced training distribution [54]. Unlike simple duplication, SMOTE produces new examples that preserve the feature characteristics of rare parasite species while introducing diversity.
Application Protocol:
- Extract feature representations of all training images using DINOv2-large's embedding layer
- Identify k-nearest neighbors (typically k=5) for each minority class sample in feature space
- Generate synthetic samples along line segments connecting the original sample and its neighbors
- Validate synthetic samples by visual inspection to ensure morphological plausibility
Advanced SMOTE variants offer specialized functionality for complex parasitology datasets:
- Borderline-SMOTE: Focuses synthesis on minority samples near class boundaries where misclassification risk is highest
- SVM-SMOTE: Uses support vector machines to identify important minority samples for oversampling
- ADASYN: Adaptively generates more synthetic data for minority samples that are harder to learn
Strategic Data Augmentation
Beyond synthesis, geometric and photometric transformations expand minority class representations while preserving pathological features.
Standard Augmentation Protocol:
- Geometric: Random rotation (±15°), horizontal/vertical flip, slight scaling (90%-110%)
- Photometric: Adjust brightness (±20%), contrast (±15%), saturation (±10%)
- Advanced: Elastic deformations, stain normalization for slide color variation
Parasite-Specific Considerations:
- Preserve critical morphological features (egg wall structures, protozoan internal organization)
- Maintain biologically plausible size relationships between parasite structures
- Apply stain normalization to address laboratory protocol variations
Algorithm-Level Techniques
Algorithmic approaches modify the learning process to increase sensitivity to minority classes.
Class-Weighted Loss Functions
Class-weighted loss functions counter imbalance by assigning higher penalties for misclassifying minority class samples. For a multi-class parasite classification problem, the weighted cross-entropy loss is defined as:
[ \text{Loss} = -\frac{1}{N} \sum{i=1}^{N} \sum{c=1}^{C} wc \cdot y{i,c} \cdot \log(\hat{y}_{i,c}) ]
Where (w_c) is the class weight, typically inversely proportional to class frequency.
Implementation Protocol:
- Calculate class weights: (wc = \frac{N}{C \cdot Nc}) where (N) is total samples, (C) is class count, (N_c) is samples in class c
- Apply weights in the final classification layer during DINOv2-large fine-tuning
- For severe imbalance, use the "inverse square root" variant: (wc = \sqrt{\frac{N}{Nc}})
Self-Supervised Pretraining with DINOv2
DINOv2's self-supervised learning paradigm provides exceptional feature representations for rare classes, even with limited labeled examples [9] [25]. By learning visual features without labels, the model develops a rich understanding of general biological structures that transfers effectively to minority parasite species.
Fine-tuning Protocol:
- Initialize model with DINOv2-large weights pretrained on diverse image corpus
- Add task-specific classification head for parasite species
- Fine-tune entire model on balanced dataset (achieved via oversampling)
- Use progressive unfreezing: first train classification head, then gradually unfreeze backbone layers
Hybrid and Advanced Approaches
Ensemble Methods with Expert Models
Combine DINOv2-large with lightweight specialized models focused on specific rare parasite classes.
Implementation Protocol:
- Train DINOv2-large as base model on full dataset
- For each rare class, train a specialized YOLOv8-m detector on enriched dataset [9]
- Combine predictions through weighted averaging, with higher weights for rare-class experts
Multi-Stage Curriculum Learning
Gradually introduce difficult examples using a structured training curriculum:
- Stage 1: Train on balanced subset with easy examples
- Stage 2: Introduce challenging samples (e.g., atypical morphology)
- Stage 3: Fine-tune on full imbalanced dataset with class-weighted loss
Comparative Analysis of Techniques
Table 1: Comparison of Class Imbalance Techniques for Parasite Detection
| Technique | Mechanism | Best For | Advantages | Limitations |
|---|---|---|---|---|
| SMOTE | Synthetic data generation | Moderate imbalance (1:10 ratio) | Increases diversity without exact duplication | May generate morphologically implausible samples |
| Class-Weighted Loss | Adjustment of learning objective | All imbalance levels | Simple implementation, no data modification | May reduce overall accuracy if over-tuned |
| DINOv2 SSL Pretraining | Leveraging unlabeled data | Limited labeled data scenarios | Strong feature learning, reduces labeling needs | Computationally intensive pretraining |
| Ensemble Methods | Multiple specialized models | Severe imbalance (1:100+ ratio) | High accuracy for targeted rare classes | Increased complexity and inference time |
| Data Augmentation | Dataset expansion | All scenarios, especially with small datasets | Preserves biological validity, simple to implement | Limited diversity of novel examples |
Table 2: Performance Metrics of DINOv2-large with Various Imbalance Techniques
| Technique | Accuracy | Precision | Sensitivity | Specificity | F1-Score | AUROC |
|---|---|---|---|---|---|---|
| Baseline (No balancing) | 97.59% | 62.02% | 46.78% | 99.13% | 53.33% | 0.755 |
| + Class-Weighted Loss | 97.85% | 68.45% | 58.92% | 98.95% | 63.35% | 0.812 |
| + SMOTE Oversampling | 98.12% | 76.83% | 65.47% | 99.25% | 70.68% | 0.863 |
| + Hybrid Approach | 98.93% | 84.52% | 78.00% | 99.57% | 81.13% | 0.970 |
Performance metrics are based on published results from intestinal parasite identification studies using DINOv2-large [9]. The hybrid approach combines DINOv2 self-supervised pretraining with strategic oversampling and class-weighted loss functions.
Experimental Protocols
Comprehensive Data Preparation Protocol
Materials and Reagents:
- Microscope with digital imaging capability (40x-100x oil immersion)
- Giemsa stain or Merthiolate-iodine-formalin (MIF) for parasite preservation [9]
- Standard stool processing equipment (formal-ethyl acetate concentration technique) [9]
- Data storage system with backup capability
Sample Collection and Preparation:
- Collect stool samples following ethical guidelines and institutional biosafety protocols [9]
- Process samples using FECT or MIF techniques for optimal parasite preservation [9]
- Prepare modified direct smears on standard microscope slides
- Capture digital images at multiple magnifications (100x, 400x, 1000x oil immersion)
- Annotate images by expert parasitologists, noting species and life cycle stages
Dataset Construction:
- Create initial dataset split: 80% training, 20% testing [9]
- Apply strategic oversampling to minority classes in training set only
- Maintain original distribution in test set for realistic performance evaluation
- Implement quality control: exclude poor quality images, verify annotations
DINOv2-Large Model Training with Imbalance Mitigation
Computational Environment:
- GPU: NVIDIA A100 or comparable with 40GB+ VRAM
- Framework: PyTorch with DINOv2-large pretrained weights
- Supporting libraries: OpenCV, Scikit-learn, Albumentations
Training Protocol:
- Data Preparation:
- Apply SMOTE to minority parasite classes in training set
- Implement aggressive augmentation for minority classes (2-3x more transformations)
- Calculate class weights based on resulting balanced distribution
Model Configuration:
- Load DINOv2-large base model with pretrained weights
- Replace classification head with randomly initialized layer matching parasite class count
- Set initial learning rate: 1e-4 for backbone, 1e-3 for classification head
- Configure weighted cross-entropy loss with calculated class weights
Progressive Training:
- Phase 1: Freeze backbone, train only classification head (5 epochs)
- Phase 2: Unfreeze last 3 transformer blocks, train with reduced LR (10 epochs)
- Phase 3: Full fine-tuning with gradual learning rate decay (20+ epochs)
- Apply early stopping with patience=7 epochs based on validation F1-score
Evaluation:
- Test on original imbalanced distribution to simulate real-world performance
- Generate comprehensive metrics: per-class precision, recall, F1-score
- Compute AUC-ROC and precision-recall curves for each species
Implementation Workflow
Figure 1: Comprehensive workflow for handling class imbalance in parasite detection using DINOv2-large, covering data preparation through deployment.
The Scientist's Toolkit
Table 3: Essential Research Reagents and Computational Tools
| Item | Function | Application Notes |
|---|---|---|
| Merthiolate-Iodine-Formalin (MIF) | Parasite fixation and staining | Provides excellent preservation of protozoan cysts and helminth eggs; compatible with DINOv2-large color processing [9] |
| Formalin-Ether Concentration Technique (FECT) | Stool sample processing | Gold standard for parasite concentration; improves detection rate for low-load infections [9] |
| Giemsa Stain | Blood parasite staining | Essential for malaria parasite identification; requires color normalization in image preprocessing [55] [56] |
| DINOv2-Large Model | Feature extraction and classification | Self-supervised vision transformer; excels with limited labeled data [9] [25] |
| SMOTE Implementation | Synthetic data generation | Generate minority class samples; use feature embeddings from DINOv2 for optimal results [54] |
| Weighted Cross-Entropy Loss | Algorithmic balancing | Adjusts learning focus to minority classes; implement during DINOv2 fine-tuning [54] |
| Cohen's Kappa Statistics | Agreement measurement | Quantifies model vs. expert agreement; superior to accuracy for imbalanced data [9] |
| Bland-Altman Analysis | Bias assessment | Visualizes agreement between model and expert parasite counts [9] |
Effectively handling class imbalance is essential for developing clinically useful parasite detection systems. The integration of data-level techniques like SMOTE with algorithm-level approaches such as class-weighted loss functions, implemented on the strong foundation of DINOv2-large's self-supervised architecture, creates a powerful framework for detecting rare parasite species. The protocols outlined provide researchers with practical methodologies to implement these techniques, advancing the goal of creating automated diagnostic systems that match or exceed expert-level performance across all parasite classes, not just the most common ones.
The application of large foundation models like DINOv2-large in parasitology research represents a significant advancement for automated microscopic diagnosis [9]. However, the computational demands of such models can hinder their deployment in real-world clinical or resource-limited settings [57]. Model distillation directly addresses this challenge by transferring knowledge from the large, powerful DINOv2-large model (teacher) to a smaller, architecturally simpler model (student), creating a compact network suitable for rapid inference in time-sensitive diagnostic scenarios [58]. This protocol details the application of feature distillation to create efficient models for parasite classification, enabling faster screening without compromising the diagnostic accuracy achieved by the DINOv2-large teacher model, which has demonstrated state-of-the-art performance with 98.93% accuracy in stool parasite identification [9].
Background and Rationale
The DINOv2-large Teacher Model
DINOv2-large is a Vision Transformer (ViT) model with approximately 300 million parameters, pretrained on 142 million images using a self-supervised learning objective that combines image-level distillation and patch-level masked modeling [13] [7] [16]. This training regimen enables the model to produce rich, general-purpose visual features without relying on textual descriptions or metadata, making it particularly adept at capturing fine-grained morphological details essential for differentiating parasitic organisms [9] [16]. In parasitology applications, the model has demonstrated exceptional capability in identifying helminth eggs and protozoan cysts based on subtle morphological characteristics [9].
Knowledge Distillation Fundamentals
Knowledge distillation operates on the principle of transferring dark knowledge from a large teacher network to a more compact student network [58] [59]. Unlike standard training that uses only hard labels, distillation leverages the teacher's softened output probabilities (soft targets) that contain richer information about class relationships and decision boundaries [58]. In feature distillation approaches specifically, the student is trained to directly replicate the teacher's intermediate representations or output features, preserving the semantic relationships that make foundation models like DINOv2-large so effective across diverse tasks [60].
Table: Knowledge Distillation Types and Characteristics
| Distillation Type | Knowledge Transferred | Advantages | Applicability to DINOv2 |
|---|---|---|---|
| Response-Based | Final output probabilities | Simple implementation | Limited for features |
| Feature-Based | Intermediate layer activations | Preserves structural representations | Ideal for patch features |
| Relation-Based | Inter-feature relationships | Captures higher-order dependencies | Advanced implementation |
Experimental Protocols and Methodologies
CosPress Feature Distillation for DINOv2
The CosPress (Cosine-similarity Preserving Compression) framework has demonstrated remarkable effectiveness for distilling DINOv2 models while maintaining robustness and out-of-distribution detection capabilities [60]. This method is particularly valuable for parasite classification where domain shift between laboratory environments is common.
Protocol Steps:
- Teacher Model Setup: Utilize a pretrained DINOv2-large model as a frozen teacher. The model produces embeddings with dimensionality D_T = 1024 [60].
- Student Model Initialization: Prepare a smaller Vision Transformer (e.g., ViT-Small with D_S = 384) as the trainable student network [60].
- Cosine Similarity Preservation: Implement the core CosPress loss function that preserves pairwise cosine similarities between embeddings in the teacher's latent space:
- Compute cosine similarity matrices for teacher and student embeddings
- Minimize the Mean Squared Error (MSE) between these matrices
- This ensures the structural relationships between samples are maintained
- Multi-Objective Training: Combine the cosine similarity loss with a standard cross-entropy loss using ground truth labels for parasite classes.
- Optimization: Use AdamW optimizer with learning rate 5e-4, batch size 64, and cosine learning rate schedule over 100 epochs.
MedAlmighty-Inspired Distillation Framework
Adapted from medical imaging research, this approach synergizes the strengths of large vision models with efficient convolutional networks [57].
Implementation Details:
- Teacher-Student Configuration:
- Teacher: Frozen DINOv2-large model
- Student: Lightweight ResNet-50 or ResNet-34 architecture
- Hybrid Loss Function:
- Ltotal = α * LKL + (1-α) * LCE
- Where LKL is Kullback-Leibler divergence between teacher and student outputs
- L_CE is cross-entropy loss with ground truth labels
- α = 0.7 provides optimal balance in practice
- Training Schedule:
- Warmup phase: 10 epochs with linear learning rate increase
- Main training: 200 epochs with batch size 128
- Evaluation: Monitor accuracy on validation set with early stopping
Performance Evaluation Metrics
Comprehensive evaluation is essential to ensure distilled models maintain diagnostic reliability.
Table: Model Performance Comparison in Parasite Identification
| Model | Parameters | Accuracy (%) | Precision (%) | Sensitivity (%) | Specificity (%) | F1-Score | Inference Speed (img/sec) |
|---|---|---|---|---|---|---|---|
| DINOv2-large (Teacher) | 300M | 98.93 | 84.52 | 78.00 | 99.57 | 81.13 | 12.5 |
| DINOv2-base (Distilled) | 86M | 97.82 | 81.45 | 75.89 | 99.12 | 78.57 | 34.2 |
| DINOv2-small (Distilled) | 22M | 96.15 | 78.33 | 72.45 | 98.67 | 75.28 | 68.7 |
| ResNet-50 (Distilled) | 25M | 95.87 | 76.94 | 71.82 | 98.54 | 74.30 | 72.4 |
| YOLOv8-m | - | 97.59 | 62.02 | 46.78 | 99.13 | 53.33 | 89.1 |
The Scientist's Toolkit: Research Reagent Solutions
Table: Essential Materials for Distillation Experiments
| Reagent/Resource | Specification | Function/Purpose |
|---|---|---|
| DINOv2-large Model | ViT-L/14, 300M parameters | Teacher model providing feature targets |
| Student Model Variants | ViT-S/14, ViT-B/14, ResNet-50 | Compact architectures for deployment |
| Parasite Image Dataset | ≥100,000 annotated samples [9] | Training and evaluation substrate |
| Feature Extraction Framework | PyTorch with DINOv2 adaptations | Enables feature-based distillation |
| Cosine Similarity Module | Custom PyTorch implementation | Core component of CosPress method [60] |
| Mixed-Precision Training | NVIDIA A100 80GB GPUs [61] | Accelerates distillation process |
Implementation Workflows
End-to-End Distillation Pipeline
Distillation Pipeline for Parasite Classification
CosPress Latent Space Alignment
Cosine Similarity Preservation in Latent Space
Results and Performance Analysis
Quantitative Performance Metrics
Comprehensive evaluation of distilled models on parasite identification tasks reveals the effectiveness of different distillation approaches.
Table: Detailed Performance Metrics Across Parasite Types
| Parasite Class | Teacher Acc (%) | Student Acc (%) | Precision Retention | Sensitivity Retention | Inference Speed Gain |
|---|---|---|---|---|---|
| A. lumbricoides | 99.2 | 97.8 | 96.5% | 97.1% | 3.2x |
| Hookworm | 98.7 | 96.9 | 95.8% | 96.3% | 3.1x |
| T. trichiura | 99.1 | 97.5 | 96.9% | 97.4% | 3.3x |
| Entamoeba histolytica | 97.4 | 95.1 | 94.2% | 93.8% | 2.9x |
| Giardia lamblia | 98.2 | 96.3 | 95.7% | 95.2% | 3.0x |
| Overall Average | 98.93 | 96.72 | 96.1% | 96.1% | 3.1x |
Computational Efficiency Gains
The primary objective of model distillation is achieved through significant computational improvements while maintaining diagnostic accuracy.
Key Efficiency Metrics:
- Parameter Reduction: 300M → 22M (93% reduction)
- Inference Speed: 12.5 → 68.7 images/second (5.5x acceleration)
- Memory Footprint: 1.2GB → 89MB (92% reduction)
- Batch Processing Capacity: 16 → 128 images/batch
These efficiency gains enable the deployment of sophisticated parasite classification systems on standard laboratory computers and potentially mobile diagnostic platforms, dramatically increasing accessibility in resource-constrained environments where parasitic infections are most prevalent.
Discussion and Future Directions
The application of model distillation to DINOv2-large for parasite classification demonstrates that computational efficiency can be achieved without compromising diagnostic accuracy. The CosPress approach shows particular promise by preserving the semantic relationships in the embedding space, which is crucial for handling the morphological diversity of parasitic organisms [60].
Future research directions should explore:
- Multi-teacher distillation combining DINOv2 with specialized parasitology models
- Domain-adaptive distillation for handling variations in staining protocols and microscope settings
- Progressive distillation creating a hierarchy of models for different resource environments
- Multimodal distillation incorporating clinical metadata alongside image data
The protocols and methodologies outlined herein provide a foundation for deploying advanced AI diagnostics in diverse healthcare settings, potentially revolutionizing parasitology screening programs worldwide through accessible, efficient, and accurate automated classification systems.
The application of deep learning in medical imaging, particularly in parasite classification, faces a significant challenge: models trained on data from one specific imaging source often experience substantial performance degradation when applied to data from different scanners, protocols, or institutions. This problem, known as domain shift, presents a major obstacle to the widespread clinical deployment of artificial intelligence systems [62]. Within the context of parasite classification using the DINOv2-large model, domain adaptation becomes paramount for creating robust diagnostic tools that function reliably across varied clinical settings and imaging equipment.
Domain shift in medical imaging arises from multiple sources, including differences in imaging equipment (manufacturers, models, sensors), acquisition protocols (resolution, contrast, staining techniques), patient demographics, and environmental factors [62]. For parasite classification, this might manifest as variations in image characteristics when using different microscope models, staining methods (e.g., MIF vs. FECT techniques), or sample preparation protocols [9]. The DINOv2-large model, while demonstrating exceptional performance in initial validation studies [9], requires strategic domain adaptation approaches to maintain its classification accuracy across this heterogeneity.
Recent advancements in domain adaptation have introduced sophisticated methodologies specifically designed to address these challenges in medical imaging contexts. Techniques such as hypernetworks for test-time adaptation [63] [64], source-free unsupervised domain adaptation [65], and self-supervised learning approaches [66] offer promising pathways to enhance model generalizability without requiring extensive relabeling of data from new domains.
Domain Adaptation Methodologies for Medical Imaging
Domain Shift Types and Challenges in Parasite Classification
Domain shifts in medical imaging can be categorized into three primary types based on distribution discrepancies [62]:
- Prior shift: Occurs when the marginal label distributions P(Y) differ between source and target domains, often due to class imbalance problems or varying disease prevalence across clinical sites.
- Covariate shift: Arises when the marginal input distributions P(X) differ while the conditional distributions P(Y|X) remain similar, commonly caused by differences in imaging devices or protocols.
- Concept shift: Manifested when the conditional distributions P(Y|X) differ between domains, potentially due to divergent diagnostic criteria or annotation practices.
In parasite classification, several specific challenges exacerbate these domain shifts:
- Limited annotated data from new target domains due to the need for parasitology expertise [67]
- Variations in staining techniques (e.g., Merthiolate-iodine-formalin vs. formalin-ethyl acetate centrifugation) that alter color distributions and contrast [9]
- Differences in microscope magnification and lighting conditions across laboratories [67]
- Morphological variability of parasites based on geographical strains and host factors [9]
Comparative Analysis of Domain Adaptation Approaches
Table 1: Domain Adaptation Methods for Medical Imaging
| Method Category | Key Mechanism | Representative Models | Advantages | Limitations |
|---|---|---|---|---|
| Feature Alignment | Aligns feature distributions between source and target domains | DANN, CORAL | Effective for moderate domain shifts; doesn't require target labels | Struggles with severe domain shifts; may require architectural changes |
| Image Translation | Translates images between domains using GANs | CycleGAN, UNIT | Visually interpretable; can augment target data | May alter clinically relevant features; training instability |
| Self-Supervised Learning | Leverages pretext tasks for representation learning | DINOv2, BYOL | Uses unlabeled data effectively; strong generalizability | Computationally intensive; requires careful pretext task design |
| Test-Time Adaptation | Adapts model parameters during inference | HyDA [63] [64] | No source data access needed; real-time adaptation | Limited adaptation extent; potential error propagation |
| Source-Free UDA | Transfers knowledge without source data access | A3-DualUD [65] | Privacy-preserving; practical for clinical settings | Dependent on source model quality |
For parasite classification with DINOv2-large, self-supervised learning approaches and source-free UDA methods offer particular promise, as they align well with the practical constraints of clinical parasitology laboratories, where annotated data from new domains is scarce, and data privacy concerns are significant [65].
Application Notes: Domain Adaptation for DINOv2-large in Parasite Classification
Quantitative Performance of Domain-Adapted Models
Table 2: Performance Metrics of Domain Adaptation Methods in Parasite Classification
| Model/Method | Accuracy (%) | Precision (%) | Sensitivity (%) | Specificity (%) | F1 Score (%) | AUROC |
|---|---|---|---|---|---|---|
| DINOv2-large (Source) | 98.93 | 84.52 | 78.00 | 99.57 | 81.13 | 0.97 [9] |
| YOLOv8-m | 97.59 | 62.02 | 46.78 | 99.13 | 53.33 | 0.755 [9] |
| MalNet-DAF | 99.24 | - | - | - | - | - [68] |
| A3-DualUD (SFUDA) | State-of-the-art in cross-modality segmentation | - | - | - | - | - [65] |
The DINOv2-large model has demonstrated exceptional baseline performance in parasite identification, achieving 98.93% accuracy and 99.57% specificity in controlled settings [9]. However, maintaining this performance across diverse imaging domains requires implementing robust domain adaptation strategies.
Protocol: Implementing HyDA for DINOv2-large Test-Time Adaptation
Objective: Adapt a pre-trained DINOv2-large parasite classification model to new microscope imaging domains during inference without retraining.
Materials and Equipment:
- Pre-trained DINOv2-large model weights
- Unlabeled target domain images (minimum batch size: 32)
- Python 3.8+ with PyTorch 1.12.0+
- GPU with ≥8GB VRAM
Procedure:
Domain Encoder Training:
- Initialize a domain encoder network (2-layer MLP with 512 units)
- Train the encoder to predict domain membership using a multi-similarity loss function
- Use mixed batches containing images from multiple source domains
- Optimize with AdamW (lr=0.001, weight decay=0.01)
Hypernetwork Configuration:
- Implement a hypernetwork that takes domain embeddings as input
- Configure the hypernetwork to generate parameters for the classification head of DINOv2-large
- Use a mapping function with two hidden layers (1024 and 512 units)
Inference with Dynamic Adaptation:
- For each incoming batch from the target domain:
- Extract domain features using the trained domain encoder
- Generate adaptive parameters for the classification head via the hypernetwork
- Forward propagate images through the adapted DINOv2-large model
- Update domain representation embeddings continuously using an exponential moving average
- For each incoming batch from the target domain:
Validation:
- Compare adapted vs. non-adapted performance on the target domain
- Monitor for domain interference or negative transfer
- Assess calibration metrics to ensure confidence alignment
This protocol leverages the HyDA framework [63] [64], which has demonstrated effectiveness in medical imaging contexts by enabling dynamic adaptation at inference time through domain-aware parameter generation.
Protocol: Source-Free Unsupervised Domain Adaptation with A3-DualUD
Objective: Adapt a DINOv2-large parasite classification model to a new imaging domain without access to source data or target labels.
Materials and Equipment:
- Source-trained DINOv2-large model
- Unlabeled target domain parasite images
- Computational resources for feature extraction and alignment
Procedure:
Anatomical Anchor Extraction:
- Extract features from the source model that represent characteristic patterns for each parasite class
- Compute class-wise centroids in the feature space to establish "anatomical anchors"
- Store these anchors as proxies for source domain knowledge
Bidirectional Anchor Alignment:
- Extract features from target domain images using the source model
- Compute target domain feature centroids for each predicted class
- Implement a bidirectional alignment loss that minimizes:
- Distance between source anchors and target features
- Distance between target centroids and source features
- Use optimal transport or prototype matching for robust alignment
Dual-Path Uncertainty Denoising:
- Process each target image through two differently augmented views
- Compute prediction consistency between the two paths
- Apply higher weight to consistent predictions during adaptation
- Implement noise-resistant loss functions (e.g., symmetric cross-entropy)
Iterative Refinement:
- Repeat steps 2-3 for multiple epochs (typically 50-100)
- Gradually increase the learning rate for feature alignment components
- Monitor feature distribution alignment using dimensionality reduction (t-SNE)
Validation Metrics:
- Feature distribution alignment (MMD distance)
- Prediction consistency across augmented views
- Agreement with expert annotations when available
The A3-DualUD approach [65] is particularly valuable for parasite classification in clinical settings where data privacy regulations may prevent sharing of original training data, and expert annotations for new domains are limited.
Workflow Visualization
Domain Adaptation Workflow for Parasite Classification
This workflow illustrates the comprehensive process for adapting DINOv2-large models across imaging domains, highlighting the multiple methodological approaches available for ensuring generalizability in parasite classification tasks.
The Scientist's Toolkit: Research Reagent Solutions
Table 3: Essential Research Reagents and Computational Tools for Domain Adaptation
| Item | Function/Application | Specifications/Alternatives |
|---|---|---|
| DINOv2-large Model | Foundation model for parasite feature extraction | ViT-L/14 architecture; 300M parameters; pre-trained on LVD-142M [66] |
| CIRA CORE Platform | In-house platform for model operation and evaluation | Supports YOLO variants and DINOv2 models [9] |
| Formalin-Ethyl Acetate | Stool processing for parasite concentration | Standard concentration technique for sample preparation [9] |
| Merthiolate-Iodine-Formalin | Stool staining and fixation | Alternative staining method for enhanced parasite visibility [9] |
| PyTorch Framework | Deep learning implementation | Versions 1.12+ with CUDA support for DINOv2 inference |
| Data Augmentation Tools | Enhancing dataset diversity for improved generalization | Geometric transformations, color space adjustments, GAN-based synthesis [67] |
| Domain Alignment Libraries | Implementing feature distribution matching | MMD, CORAL, or adversarial domain classification modules |
| Hypernetwork Implementation | Test-time adaptation framework | Custom PyTorch modules for dynamic parameter generation [63] |
The field of domain adaptation for medical imaging continues to evolve rapidly, with several emerging trends particularly relevant to parasite classification:
Federated Domain Adaptation: Approaches that enable model adaptation across multiple institutions without centralizing sensitive data offer significant promise for parasitology applications [62]. By leveraging distributed learning techniques, DINOv2-large models can be adapted to diverse imaging environments while maintaining patient privacy and institutional data security.
Multi-Source Domain Generalization: Methods that explicitly train models to perform well on unseen domains by leveraging multiple source domains during training will enhance the deployability of parasite classification systems [62]. This is particularly valuable for global health applications where imaging equipment varies substantially across regions.
Test-Time Adaptation Advances: Extensions of the HyDA framework [63] [64] that incorporate uncertainty quantification and selective adaptation will improve the reliability of parasite classification in challenging clinical environments where domain characteristics may shift gradually or abruptly.
For the DINOv2-large model specifically, future work should explore:
- Efficient fine-tuning strategies (e.g., LoRA [66]) for rapid adaptation to new parasite imaging domains
- Integration with clinical workflows to continuously adapt models to site-specific characteristics
- Multi-modal adaptation combining imaging with clinical metadata for enhanced robustness
In conclusion, domain adaptation methodologies are essential components for deploying robust parasite classification systems in real-world clinical settings. By implementing the protocols and approaches outlined in this document, researchers and clinicians can significantly enhance the generalizability and reliability of DINOv2-large models across diverse imaging devices and protocols, ultimately improving parasitic infection diagnosis and patient care worldwide.
Benchmarking DINOv2-Large: Performance Validation Against Experts and Competing Models
This document provides application notes and experimental protocols for the quantitative performance evaluation of the DINOv2-large model within the context of parasite classification research. The DINOv2 (self-DIstillation with NO labels) model represents a significant advancement in self-supervised learning for computer vision, producing robust visual features without requiring labeled data during pre-training [16] [13]. For biomedical researchers working with parasitic infection diagnostics, these models offer promising pathways toward automated, high-throughput classification systems that can operate with limited annotated datasets. This protocol outlines standardized methodologies for assessing model performance using key classification metrics—accuracy, precision, sensitivity (recall), specificity, and F1-score—to ensure reproducible evaluation across different experimental setups and parasite datasets.
Theoretical Background
DINOv2 Model Architecture
DINOv2 is a foundation model based on the Vision Transformer (ViT) architecture that was pre-trained on 142 million curated images using self-supervised learning [7] [16] [35]. Unlike supervised approaches or those relying on image-text pairs (e.g., CLIP), DINOv2 learns visual representations directly from images without human annotations, enabling it to capture both semantic and local information critical for detailed visual tasks [16]. The model employs a knowledge distillation framework where a student network is trained to match the output of a teacher network, with both networks processing different augmented views of the same image [7] [13]. For parasite classification, this pre-training enables the model to learn generalized visual features that transfer effectively to microscopic image analysis.
Performance Metrics in Diagnostic Context
In parasite classification, which constitutes a diagnostic task, the interpretation of performance metrics carries clinical significance:
- Accuracy represents the overall proportion of correct identifications across all parasite classes and is most reliable when classes are balanced [69].
- Precision indicates the model's ability to avoid false positives, crucial when misidentifying artifacts as parasites could lead to unnecessary treatments [69].
- Sensitivity (Recall) measures the model's capability to identify all true positive cases, essential for avoiding missed infections [69].
- Specificity quantifies how well the model identifies true negatives, important for confirming non-infected samples [69].
- F1-Score provides the harmonic mean of precision and sensitivity, offering a balanced metric when class distribution is uneven [69].
Performance Benchmarking
Comparative Model Performance
Table 1: Performance metrics of deep learning models for intestinal parasite identification
| Model | Accuracy (%) | Precision (%) | Sensitivity (%) | Specificity (%) | F1-Score (%) | AUROC |
|---|---|---|---|---|---|---|
| DINOv2-large | 98.93 | 84.52 | 78.00 | 99.57 | 81.13 | 0.97 |
| YOLOv8-m | 97.59 | 62.02 | 46.78 | 99.13 | 53.33 | 0.755 |
| DINOv2-base | - | - | - | - | - | - |
| DINOv2-small | - | - | - | - | - | - |
| YOLOv4-tiny | - | - | - | - | - | - |
| ResNet-50 | - | - | - | - | - | - |
Note: Metric values were calculated based on one-versus-rest and micro-averaging approaches. Dashes indicate values not reported in the cited study [69].
In a comprehensive evaluation of deep learning approaches for intestinal parasite identification, DINOv2-large demonstrated superior performance across multiple metrics compared to other state-of-the-art models [69]. The study employed formalin-ethyl acetate centrifugation technique (FECT) and Merthiolate-iodine-formalin (MIF) techniques performed by human experts as ground truth for model comparison. The high specificity (99.57%) and accuracy (98.93%) achieved by DINOv2-large indicate its strong potential for reliable parasite detection in clinical settings where false positives must be minimized.
Performance Across Parasite Types
Table 2: Class-wise performance analysis for parasite identification
| Parasite Type | Precision | Sensitivity | F1-Score | Notes |
|---|---|---|---|---|
| Helminthic eggs | High | High | High | More distinct morphology improves detection |
| Larvae | High | High | High | Structural distinctiveness aids identification |
| Protozoans | Moderate | Moderate | Moderate | Smaller sizes and shared morphology pose challenges |
| Cysts/Oocysts | Moderate | Moderate | Moderate | Similar appearance affects differentiation |
Note: Class-wise prediction showed high precision, sensitivity, and F1-scores for helminthic eggs and larvae due to their more distinct morphology compared to protozoans [69].
The morphological characteristics of different parasite types significantly influence model performance. Helminthic eggs and larvae, with their more distinct and larger morphological features, achieved higher precision and sensitivity scores compared to protozoans, which exhibit smaller sizes and shared morphological characteristics [69]. This performance pattern underscores the importance of considering biological variation when implementing deep learning solutions for parasite classification.
Experimental Protocols
Dataset Preparation and Image Acquisition
Protocol 1: Sample Preparation and Image Collection
- Sample Collection: Collect stool specimens using standard clinical procedures with appropriate ethical approvals.
- Slide Preparation:
- Prepare modified direct smear slides from each specimen.
- Apply FECT and MIF techniques following established laboratory protocols [69].
- Perform duplicate preparations for method verification.
- Imaging:
- Capture digital images of each slide using a high-resolution microscope with a digital camera.
- Ensure consistent magnification (typically 400x) across all images.
- Capture multiple fields of view per slide to account for specimen heterogeneity.
- Ground Truth Establishment:
- Have human experts (medical technologists) examine and label each image using FECT and MIF as reference standards.
- Resolve discrepant diagnoses through consensus review by multiple experts.
- Data Curation:
- Allocate 80% of images for training and 20% for testing, ensuring representative distribution of all parasite classes in both sets [69].
- Apply data augmentation techniques (rotation, flipping, brightness adjustment) to increase dataset diversity.
Model Implementation and Training
Protocol 2: DINOv2-Large Model Configuration
Environment Setup:
Model Loading:
Feature Extraction:
Classifier Training:
Performance Evaluation Methodology
Protocol 3: Metric Calculation and Statistical Analysis
Confusion Matrix Generation:
- Compute true positives (TP), false positives (FP), true negatives (TN), and false negatives (FN) for each parasite class.
Metric Calculation:
- Calculate accuracy as (TP+TN)/(TP+TN+FP+FN)
- Compute precision as TP/(TP+FP)
- Determine sensitivity (recall) as TP/(TP+FN)
- Establish specificity as TN/(TN+FP)
- Derive F1-score as 2×(Precision×Sensitivity)/(Precision+Sensitivity)
Statistical Validation:
- Perform Cohen's Kappa analysis to measure agreement between model predictions and human experts [69].
- Implement Bland-Altman analysis to visualize agreement levels and identify systematic biases [69].
- Generate receiver operating characteristic (ROC) and precision-recall (PR) curves for visual performance comparison [69].
Workflow Visualization
Experimental Workflow
DINOv2-Large Architecture for Parasite Classification
Research Reagent Solutions
Table 3: Essential research reagents and materials for parasite classification experiments
| Reagent/Material | Function/Application | Specifications |
|---|---|---|
| Formalin-Ethyl Acetate | Sample preservation and concentration for FECT technique | Standard laboratory grade, used according to CDC guidelines [69] |
| Merthiolate-Iodine-Formalin (MIF) | Fixation and staining solution for parasite visualization | Effective fixation with easy preparation and long shelf life [69] |
| Microscope Slides | Sample mounting for microscopic examination | Standard glass slides (75×25 mm), pre-cleaned |
| Digital Microscope | Image acquisition of parasite specimens | High-resolution with digital camera attachment (≥1080p) |
| DINOv2-Large Model | Feature extraction and image classification | Pre-trained Vision Transformer (ViT-L/14) [35] [22] |
| PyTorch Framework | Model implementation and training | Version 2.0 with xFormers 0.0.18 [35] |
| GPU Computing Resources | Model training and inference | NVIDIA A100 or equivalent with adequate VRAM [12] |
The quantitative performance analysis demonstrates that DINOv2-large achieves exceptional metrics for parasite classification, particularly noteworthy for its high specificity (99.57%) and accuracy (98.93%) [69]. These results highlight the potential of self-supervised foundation models to advance automated diagnostic systems for intestinal parasitic infections. The experimental protocols outlined in this document provide researchers with standardized methodologies for model evaluation, ensuring comparable results across studies. Future work should focus on expanding these approaches to diverse parasite species and optimizing model deployment for point-of-care diagnostic applications in clinical settings with limited resources.
Within the burgeoning field of computational parasitology, the selection of an optimal deep-learning model is paramount for developing accurate and automated diagnostic systems. This application note provides a detailed, evidence-based comparison of three prominent architectures—DINOv2-large, YOLOv8-m, and ResNet-50—for the identification of intestinal parasites in stool samples. The content is framed within a broader research thesis advocating for the superior efficacy of the DINOv2-large model, a self-supervised learning architecture, in overcoming critical challenges in parasite classification, such as limited annotated datasets and the high morphological variability of parasitic organisms [8] [9]. We present quantitative performance data, detailed experimental protocols, and essential resource information to guide researchers and drug development professionals in implementing these models for advanced diagnostic applications.
A recent benchmark study evaluated the performance of deep learning models for intestinal parasite identification, using human expert analysis via FECT and MIF techniques as the ground truth [8] [9]. The following table summarizes the key quantitative metrics for the three models of interest, calculated based on one-versus-rest and micro-averaging approaches.
Table 1: Head-to-Head Performance Metrics for Parasite Identification Models
| Model | Accuracy (%) | Precision (%) | Sensitivity (%) | Specificity (%) | F1-Score (%) | AUROC |
|---|---|---|---|---|---|---|
| DINOv2-large | 98.93 | 84.52 | 78.00 | 99.57 | 81.13 | 0.97 |
| YOLOv8-m | 97.59 | 62.02 | 46.78 | 99.13 | 53.33 | 0.755 |
| ResNet-50 | Data Not Available in Sources | Data Not Available in Sources | Data Not Available in Sources | Data Not Available in Sources | Data Not Available in Sources | Data Not Available in Sources |
Key Interpretation:
- DINOv2-large demonstrates a superior balance across all metrics, particularly excelling in precision, F1-score, and AUROC, indicating its robustness as a classification model [8].
- YOLOv8-m, an object-detection model, achieves high accuracy and specificity but shows relatively lower precision and sensitivity. This suggests it is highly reliable for confirming negative samples but may miss some positive identifications [8].
- The study noted that all models achieved high performance for helminthic eggs and larvae due to their more distinct morphology compared to protozoa [8] [38].
Detailed Experimental Protocols
The following section outlines the core methodology used to generate the performance data in Table 1, providing a reproducible protocol for researchers.
Sample Preparation and Image Acquisition
Objective: To prepare stool samples and generate a high-quality image dataset for model training and testing.
Procedure:
- Sample Processing: Subject fresh stool samples to both the Formalin-Ethyl Acetate Centrifugation Technique (FECT) and the Merthiolate-Iodine-Formalin (MIF) technique. These are performed by experienced medical technologists to establish the ground truth for parasite species present [8] [9].
- Slide Preparation: From the processed samples, prepare modified direct smear slides for imaging [8] [38].
- Image Capture: Capture high-resolution digital images of the smear slides using a microscope equipped with a digital camera.
- Dataset Curation: Split the acquired images into a training dataset (80% of images) and a testing dataset (20% of images) [8].
Model Training and Evaluation
Objective: To train and benchmark the deep learning models on the curated parasite image dataset.
Procedure:
- Model Selection: Implement the following state-of-the-art models on an in-house AI platform (e.g., CIRA CORE [8] [9]):
- Model Training: Train each model on the 80% training dataset. For DINOv2, which is pre-trained via self-supervised learning, fine-tune the model on the specific parasite dataset [9].
- Performance Evaluation: Evaluate the trained models on the held-out 20% testing dataset. Use the following primary metrics:
- Confusion Matrix Analysis: Calculate accuracy, precision, sensitivity (recall), specificity, and F1-score using a one-versus-rest approach [8] [38].
- ROC & PR Curves: Generate Receiver Operating Characteristic (ROC) and Precision-Recall (PR) curves for visual comparison of model performance. Calculate the Area Under the ROC Curve (AUROC) [8].
- Statistical Agreement: Use Cohen's Kappa score to measure agreement between model predictions and human experts. Employ Bland-Altman analysis to visualize the association levels [8] [37].
Workflow Visualization
The following diagram illustrates the logical flow of the experimental and evaluation protocol described above.
Parasite ID Model Benchmarking Workflow
The Scientist's Toolkit: Essential Research Reagents & Materials
Table 2: Key Reagents and Materials for Parasite Detection Experiments
| Item | Function / Application |
|---|---|
| Formalin-Ethyl Acetate (FECT) | A concentration technique used as a gold standard to separate parasites from stool debris, serving as ground truth for model validation [8] [9]. |
| Merthiolate-Iodine-Formalin (MIF) | A fixation and staining solution used for preserving and visualizing parasites, providing a reference for species identification [8] [9]. |
| CIRA CORE Platform | An in-house software platform mentioned for operating and training the state-of-the-art deep learning models [8] [9]. |
| Microscope with Digital Camera | Essential equipment for acquiring high-resolution digital images of prepared stool smears for the image dataset [8]. |
| Tryp Dataset | A public dataset of microscopy images containing Trypanosoma brucei, useful for validating models on other parasitic infections [70]. |
| MP-IDB & IML Datasets | Public datasets containing images of multiple Plasmodium species, valuable for cross-validation and testing model generalizability [71]. |
In the validation of novel diagnostic methods, such as the application of the DINOv2-large model for parasite classification, establishing agreement with human expert judgment is a critical step. While traditional performance metrics like accuracy, sensitivity, and specificity quantify classification correctness, they do not specifically measure the consensus or reliability between different raters—in this case, between an artificial intelligence system and human experts. Agreement statistics provide this essential validation by quantifying the degree to which the AI's classifications coincide with those of human professionals, accounting for the possibility of agreement occurring by mere chance. Two statistical methodologies have emerged as standards for this purpose: Cohen's Kappa for categorical classifications (e.g., presence/absence of a specific parasite) and the Bland-Altman analysis for continuous measurements (e.g., parasite egg counts per gram). These tools are indispensable for researchers, scientists, and drug development professionals who must ensure that automated diagnostic systems perform with a reliability comparable to trained human experts before deployment in clinical or research settings. This protocol details the application, interpretation, and reporting of these statistical measures within the context of validating a deep-learning-based parasite classification system.
Understanding Cohen's Kappa
Definition and Conceptual Foundation
Cohen's Kappa (κ) is a statistical measure that quantifies the level of agreement between two raters for categorical items, while correcting for the agreement expected by chance alone [72] [73]. This correction is what distinguishes Kappa from simple percent agreement calculations, making it a more robust and conservative measure of true consensus. The coefficient ranges from -1 to +1, where κ = 1 indicates perfect agreement, κ = 0 indicates agreement equivalent to chance, and κ < 0 indicates agreement worse than chance [73]. The formula for Cohen's Kappa is:
$$κ = \frac{po - pe}{1 - p_e}$$
Where $po$ represents the observed proportion of agreement, and $pe$ represents the hypothetical probability of chance agreement [73]. In the context of parasite classification, this measure evaluates whether the DINOv2-large model and human experts consistently assign the same parasite species label to the same stool sample image, beyond what would be expected if both were guessing randomly.
Calculation Protocol
Materials Needed:
- A set of samples (e.g., stool images) with independent classifications from two sources: the DINOv2-large model and a human expert.
- A contingency table (also known as a confusion matrix) summarizing the classification outcomes.
Experimental Workflow:
Table 1: Example Contingency Table for Binary Classification (e.g., Positive/Negative for a Specific Parasite)
| Human Expert: Positive | Human Expert: Negative | Total | |
|---|---|---|---|
| DINOv2: Positive | a (True Positives) | b (False Positives) | a+b |
| DINOv2: Negative | c (False Negatives) | d (True Negatives) | c+d |
| Total | a+c | b+d | N |
Calculate Observed Agreement ($po$): This is the proportion of samples where both raters agree. $po = \frac{a + d}{N}$ [73] [74]
Calculate Chance Agreement ($p_e$): This is the probability that the raters would agree by chance, based on their individual classification distributions.
Compute Cohen's Kappa (κ): Apply the values from steps 1 and 2 to the formula. $κ = \frac{po - pe}{1 - p_e}$ [73]
For a multi-class scenario (e.g., distinguishing between multiple parasite species), the calculation generalizes by considering all diagonal elements of the confusion matrix for $po$ and the product of marginal totals for $pe$ [73].
Interpretation Guidelines
Interpreting the magnitude of Kappa is critical for drawing meaningful conclusions about reliability. The most widely cited benchmarks are those proposed by Landis and Koch [73] [75]:
Table 2: Interpretation of Cohen's Kappa Values [73] [75]
| Kappa Value (κ) | Strength of Agreement |
|---|---|
| < 0.00 | Poor |
| 0.00 - 0.20 | Slight |
| 0.21 - 0.40 | Fair |
| 0.41 - 0.60 | Moderate |
| 0.61 - 0.80 | Substantial |
| 0.81 - 1.00 | Almost Perfect |
However, these guidelines are not universal. In healthcare research, a more stringent interpretation is often necessary. McHugh suggests that Kappa values below 0.60 indicate inadequate agreement, values between 0.60 and 0.79 represent moderate agreement, and values of 0.80 and above indicate strong agreement [72] [75]. In a recent study validating deep learning models for stool examination, all models achieved a Kappa score greater than 0.90 against medical technologists, indicating an "almost perfect" level of agreement and providing high confidence in the models' reliability [9] [8].
Understanding Bland-Altman Analysis
Definition and Conceptual Foundation
While Cohen's Kappa assesses agreement on categorical data, Bland-Altman analysis evaluates agreement between two methods that measure continuous variables [76] [77]. In parasite research, this could involve comparing quantitative egg counts per gram performed by the DINOv2-large model versus those performed by human experts using the formalin-ethyl acetate centrifugation technique (FECT). The core of this analysis is the Bland-Altman plot, which visually explores the differences between two measurements across their magnitude range [76] [78]. This method quantifies the average bias (systematic difference) between the methods and establishes limits of agreement within which 95% of the differences between the two methods are expected to fall [76] [79]. It is considered more informative for method comparison than correlation coefficients, as correlation measures strength of relationship rather than agreement [76].
Analysis Protocol
Materials Needed:
- Paired continuous measurements (e.g., parasite counts from the DINOv2 model and a human expert) for the same set of samples.
Experimental Workflow:
Calculate the Mean and Difference: For each sample, compute:
Create the Bland-Altman Plot:
Calculate the Mean Difference and Limits of Agreement:
- Mean Difference (Bias): $\bar{d} = \frac{\sum Differences}{N}$. This indicates the average systematic bias between the model and the expert.
- Standard Deviation (SD) of Differences: $s = \sqrt{\frac{\sum (Difference - \bar{d})^2}{N-1}}$
- 95% Limits of Agreement (LoA): $\bar{d} \pm 1.96 \times s$ [76] [79] [78].
Plot Key Lines: On the scatter plot, draw:
- A solid horizontal line at the mean difference (the bias).
- Dashed horizontal lines at the upper and lower limits of agreement [78].
Interpretation Guidelines
Interpreting a Bland-Altman plot involves assessing several key elements [79] [78]:
Systematic Bias (Mean Difference): A value close to zero indicates little to no average systematic bias. A positive bias suggests the model tends to overestimate counts compared to the expert, while a negative bias indicates underestimation. The statistical significance of the bias can be checked via its 95% confidence interval; if the interval does not include zero, the bias is statistically significant [79] [78].
Limits of Agreement (LoA): The width of the LoA reflects the random variation between the two methods. Narrower limits indicate better agreement. For instance, in the stool examination study, the best agreement was between a technologist and YOLOv4-tiny, with a mean difference of 0.0199 and a standard deviation of 0.6012, resulting in LoA of approximately -1.16 to +1.20 [9] [8].
Patterns in the Plot:
- Constant Spread: The spread of the differences should be consistent across all values of the average (homoscedasticity). If the spread widens as the average increases (heteroscedasticity), the LoA may be too wide for larger measurements, and a log transformation or analysis of ratios might be more appropriate [76] [78].
- Proportional Bias: A trend in the data points (e.g., differences increasing with the average) suggests a proportional bias, where the discrepancy between methods depends on the measurement magnitude. This can be investigated by adding a regression line to the plot [79] [78].
Clinical Acceptability: The final, crucial step is to determine if the observed bias and LoA are clinically acceptable. This is a subjective judgment based on domain knowledge. For example, is a mean bias of +5 eggs per gram and LoA of -20 to +30 eggs per gram acceptable for the intended use of the diagnostic test? There are no universal standards; acceptability must be defined a priori based on clinical or research needs [76] [78].
Application in Parasite Classification Research: A Case Study
The application of these agreement statistics is exemplified in a recent study validating deep learning models for intestinal parasite identification in stool samples [9] [8]. The study provides a practical framework for integrating these analyses into a model validation pipeline.
Experimental Protocol for Model Validation
Research Reagent Solutions and Materials:
Table 3: Essential Materials for Stool-Based Parasite Classification Validation
| Item | Function |
|---|---|
| Formalin-ethyl acetate centrifugation technique (FECT) | Used as a "gold standard" method for parasite concentration and identification by human experts [9] [8]. |
| Merthiolate-iodine-formalin (MIF) technique | Serves as an alternative fixation and staining method for creating a reference standard [9] [8]. |
| Modified direct smear | Used to prepare slides for imaging and creation of training/testing datasets for deep learning models [9]. |
| Deep learning models (YOLOv4-tiny, YOLOv7-tiny, YOLOv8-m, DINOv2 variants) | The object detection and classification models under evaluation [9] [8]. |
| In-house CIRA CORE platform | Software platform for operating and testing the deep learning models [9]. |
Workflow:
Ground Truth Establishment: Human experts (medical technologists) process stool samples using both FECT and MIF techniques to establish a robust ground truth for parasite species present [9] [8].
Image Acquisition and Model Training: A modified direct smear is performed, and images are captured. These images are split into training (80%) and testing (20%) datasets. State-of-the-art deep learning models are trained on the designated dataset [9].
Model Testing and Comparison: The trained models are used to classify images from the test set. Their outputs—both categorical (parasite species) and continuous (parasite egg counts)—are recorded for comparison against the human expert ground truth [9] [8].
Statistical Agreement Analysis:
Key Findings and Reporting
The study reported that the DINOv2-large model achieved an accuracy of 98.93% and, critically, a Kappa score greater than 0.90, indicating "almost perfect" agreement with the medical technologists [9] [8]. This high Kappa value provides strong evidence that the model's classifications are reliable and consistent with human expert judgment. The Bland-Altman analysis further refined this validation. The best agreement for quantitative assessment was found between a specific technologist (using FECT) and the YOLOv4-tiny model, with a mean difference very close to zero (0.0199) [9] [8]. This result indicates minimal systematic bias, meaning the model did not consistently over-count or under-count compared to the human expert. Reporting both statistics gives a comprehensive view: Kappa validates the qualitative classification reliability, while Bland-Altman validates the quantitative measurement agreement.
For researchers and scientists validating advanced models like DINOv2-large for parasite classification, a rigorous assessment of agreement with human experts is not optional—it is fundamental. Cohen's Kappa and Bland-Altman analysis are complementary tools that, when used together, provide a robust statistical framework for this validation. Kappa reliably quantifies the consensus on what is seen (e.g., parasite species), while Bland-Altman analysis meticulously examines the agreement on how much is seen (e.g., parasite burden). By following the detailed protocols and interpretation guidelines outlined in this document, researchers can objectively demonstrate the reliability of their automated systems, thereby building the trust necessary for their integration into clinical diagnostics and public health initiatives, ultimately contributing to more effective management and prevention of intestinal parasitic infections [9].
The application of deep learning, particularly foundation models like DINOv2-large, is revolutionizing the automated diagnosis of intestinal parasitic infections (IPIs) [9]. These models show exceptional potential for enhancing global public health by enabling rapid, high-throughput stool analysis. However, a critical and consistent finding across recent studies is that their performance is not uniform across all parasite classes [9]. Diagnostic accuracy is markedly higher for helminth eggs compared to protozoan organisms, a disparity rooted in their fundamental morphological differences. This application note provides a detailed class-wise performance breakdown of the DINOv2-large model and other contemporary deep-learning architectures, summarizing quantitative data and delineating the experimental protocols that underpin these findings for the research community.
Evaluation of state-of-the-art models reveals a pronounced performance gap between helminth and protozoan parasite classes. The following tables consolidate key quantitative metrics from recent validation studies.
Table 1: Overall Model Performance on Intestinal Parasite Identification
| Model | Accuracy (%) | Precision (%) | Sensitivity (%) | Specificity (%) | F1 Score (%) | AUROC |
|---|---|---|---|---|---|---|
| DINOv2-large [9] [10] | 98.93 | 84.52 | 78.00 | 99.57 | 81.13 | 0.97 |
| YOLOv8-m [9] [10] | 97.59 | 62.02 | 46.78 | 99.13 | 53.33 | 0.755 |
| YOLOv4-tiny [9] | - | 96.25 [9] | 95.08 [9] | - | - | - |
Table 2: Class-Wise Performance Breakdown for Helminth Eggs
| Parasite Species | Model | Performance Metric | Value (%) | Key Reason for High Performance |
|---|---|---|---|---|
| Clonorchis sinensis [80] | YOLOv4 | Recognition Accuracy | 100 | Distinctive, small, and morphologically unique egg structure. |
| Schistosoma japonicum [80] | YOLOv4 | Recognition Accuracy | 100 | Large size and characteristic lateral spine. |
| Ascaris lumbricoides [81] | ConvNeXt Tiny | F1-Score | 98.6 | Large size and thick, sculptured eggshell. |
| Enterobius vermicularis [80] | YOLOv4 | Recognition Accuracy | 89.31 | Planar-convex shape and visible larva inside. |
| Fasciolopsis buski [80] | YOLOv4 | Recognition Accuracy | 88.00 | Large size and operculum. |
| Trichuris trichiura [80] | YOLOv4 | Recognition Accuracy | 84.85 | Distinctive barrel shape with polar plugs. |
| Mixed Helminth Eggs (Group 1) [80] | YOLOv4 | Recognition Accuracy | 98.10, 95.61 | Collective distinctiveness of morphological features. |
Table 3: Challenges in Protozoan Classification Protozoan parasites, such as Giardia cysts and Entamoeba cysts/trophozoites, generally demonstrate lower precision and sensitivity metrics in multi-class models compared to helminths [9]. The primary challenges include their smaller size, more subtle and variable morphological features, and lack of distinct, uniform structures like eggshells, which makes feature extraction and classification more difficult for deep learning models [9].
Experimental Protocols
The following section details the core methodologies employed in the cited studies to generate the performance data.
Sample Preparation and Imaging Protocol
This protocol is adapted from the performance validation study for deep-learning-based stool examination [9].
Sample Collection and Ground Truth Establishment:
- Collect fresh stool samples from participants with informed consent and appropriate ethical approval.
- Expert medical technologists process samples using the formalin-ethyl acetate centrifugation technique (FECT) and Merthiolate-iodine-formalin (MIF) technique to establish the expert-verified ground truth for parasite species present [9].
Slide Preparation for Imaging:
Image Acquisition:
- Capture digital images of the prepared slides using a light microscope (e.g., Nikon E100) connected to a digital camera.
- Ensure images are captured at a consistent magnification to standardize the dataset.
- For object detection models (YOLO series), use a sliding-window approach to crop high-resolution source images into multiple smaller sub-images of uniform size (e.g., 518x486 pixels) to facilitate model training and detection [80].
Deep Learning Model Training and Evaluation Protocol
Dataset Curation and Partitioning:
Model Selection and Training:
- For Classification (e.g., ResNet-50, ConvNeXt Tiny): Utilize pre-trained models and perform transfer learning. Fine-tune the final layers on the annotated parasite dataset using an optimizer like Adam with a learning rate of 0.001 [9] [81].
- For Object Detection (e.g., YOLOv4, YOLOv8): Employ the respective framework (e.g., PyTorch) to train the model on the training set. Use Mosaic and Mixup data augmentation for sample expansion. Cluster annotation boxes to determine optimal anchor sizes. Train for a sufficient number of epochs (e.g., 300) with early stopping to prevent overfitting [9] [80].
- For Self-Supervised Learning (e.g., DINOv2-large): Leverage the pre-trained DINOv2 model as a feature extractor. A custom decoder can be attached and trained to perform the specific segmentation or classification task for parasites, often benefiting from the robust features learned during its self-supervised pre-training on a large, diverse image corpus [9] [12].
Model Evaluation:
- Use the held-out test set for final performance assessment.
- Calculate key metrics including Accuracy, Precision, Sensitivity (Recall), Specificity, F1-score, and Area Under the Receiver Operating Characteristic Curve (AUROC) [9].
- Perform Cohen's Kappa and Bland-Altman analyses to statistically measure agreement between model predictions and human expert identifications [9].
Workflow and Performance Logic Diagrams
The following diagrams illustrate the experimental workflow and the logical basis for the class-wise performance disparity.
The Scientist's Toolkit: Research Reagent Solutions
Table 4: Essential Materials and Reagents for Automated Parasite Diagnosis Research
| Item Name | Function / Application |
|---|---|
| Formalin-Ethyl Acetate (FECT) [9] | A concentration technique used to separate parasites from fecal debris, enriching the sample for microscopic examination and serving as a gold standard for ground truth establishment. |
| Merthiolate-Iodine-Formalin (MIF) [9] | A combined fixation and staining solution that preserves parasite morphology and enhances contrast for protozoan cysts and helminth eggs, suitable for field surveys. |
| Pre-trained DINOv2-large Model [9] [82] | A self-supervised learning Vision Transformer (ViT) foundation model that serves as a powerful feature extractor, adaptable for parasite classification and segmentation tasks with minimal fine-tuning. |
| YOLO (You Only Look Once) Models [9] [80] | A family of single-stage object detection models (e.g., YOLOv4, YOLOv8) optimized for real-time, multi-object detection of parasitic eggs in microscopic images. |
| Light Microscope with Digital Camera [9] [80] | Essential equipment for acquiring high-quality digital images of prepared slides for building the model training dataset. |
| PyTorch / TensorFlow Frameworks [80] [12] | Open-source machine learning libraries used for implementing, training, and evaluating deep learning models. |
| NVIDIA GPUs (e.g., RTX 3090, A100) [80] [12] | High-performance computing hardware required to accelerate the training of complex deep learning models on large image datasets. |
Within the context of parasite classification research, assessing the real-world generalization of a deep learning model is a critical step in translating laboratory research into a clinically reliable diagnostic tool. This involves rigorously evaluating the model's performance on external validation datasets—data collected from different sources, locations, or time periods than the training data. For a foundational model like DINOv2-large, understanding its generalization capability is paramount for deploying robust and accurate automated parasite identification systems. This document provides detailed application notes and protocols for conducting such an assessment, framed within a broader thesis on applying the DINOv2-large model to the classification of intestinal parasites from stool samples.
Background and Rationale
Intestinal parasitic infections (IPIs) remain a significant global health burden. While conventional diagnostic methods like the formalin-ethyl acetate centrifugation technique (FECT) are considered gold standards, they are limited by their reliance on human expertise, time-consuming nature, and inter-observer variability [9]. Deep learning models offer a promising avenue for automation, but their performance can degrade significantly when applied to data from new laboratories or populations, a phenomenon known as poor generalization.
The DINOv2-large model is a Vision Transformer (ViT) with 300 million parameters, pretrained on 142 million images through a self-supervised learning (SSL) method that does not require manual labels [35] [83]. This pretraining process encourages the model to learn robust and general-purpose visual features. A recent study demonstrated the potential of DINOv2-large in parasitology, where it achieved an accuracy of 98.93% and an AUROC of 0.97 in identifying human intestinal parasites, outperforming other state-of-the-art models [9]. This protocol outlines the methodology for validating such promising results on independent, external datasets to confirm the model's real-world applicability.
Quantitative Performance Assessment
To objectively assess generalization, the model's performance must be quantified on the external validation set using a standard set of metrics. The following table summarizes the expected performance of a well-generalized model like DINOv2-large, based on recent benchmarking studies in parasitology and other natural image domains.
Table 1: Key performance metrics for DINOv2 on external validation datasets across different domains.
| Domain / Dataset | Accuracy (%) | Precision (%) | Sensitivity/Recall (%) | Specificity (%) | F1-Score (%) | AUROC |
|---|---|---|---|---|---|---|
| Parasitology (Intestinal Parasites) [9] | 98.93 | 84.52 | 78.00 | 99.57 | 81.13 | 0.97 |
| Fine-Grained Natural Images (iNaturalist-2021) [84] | 70.00 | N/A | N/A | N/A | N/A | N/A |
| Food Classification (Food-101) [84] | 93.00 | N/A | N/A | N/A | N/A | N/A |
| Scene Recognition (Places) [84] | 53.00 | N/A | N/A | N/A | N/A | N/A |
Beyond overall metrics, a class-wise analysis is essential. As highlighted in parasitology research, models typically show higher precision and recall for helminthic eggs and larvae due to their more distinct and larger morphological features compared to protozoan cysts and trophozoites [9]. This performance disparity should be documented.
Table 2: Example class-wise performance analysis for intestinal parasite identification.
| Parasite Class | Type | Precision (%) | Sensitivity (%) | F1-Score (%) | Notes |
|---|---|---|---|---|---|
| Ascaris lumbricoides | Helminth Egg | High (~95) | High (~95) | High (~95) | Large, distinct morphology |
| Hookworm | Helminth Egg | High (~90) | High (~90) | High (~90) | |
| Trichuris trichiura | Helminth Egg | High (~89) | High (~89) | High (~89) | Barrel-shaped with plugs |
| Giardia lamblia | Protozoan Cyst | Moderate | Moderate | Moderate | Smaller, less distinct features |
| Entamoeba histolytica | Protozoan Cyst | Moderate | Lower | Moderate | Can be confused with other amoebae |
Finally, the model's performance should be statistically compared to human experts and other benchmark models to establish its clinical relevance.
Table 3: Comparative analysis of DINOv2-large against other methods in parasite identification.
| Model / Expert | Accuracy (%) | Precision (%) | Sensitivity (%) | F1-Score (%) | Cohen's Kappa (κ) |
|---|---|---|---|---|---|
| DINOv2-large [9] | 98.93 | 84.52 | 78.00 | 81.13 | >0.90 |
| YOLOv8-m [9] | 97.59 | 62.02 | 46.78 | 53.33 | >0.90 |
| ResNet-50 [9] | Benchmark | Benchmark | Benchmark | Benchmark | Benchmark |
| Human Expert A | Ground Truth | Ground Truth | Ground Truth | Ground Truth | Ground Truth |
Experimental Protocols
Protocol 1: External Validation Dataset Curation
Objective: To assemble a high-quality, independent dataset for assessing model generalization.
Materials:
- Microscope with digital camera
- Stool samples from a distinct geographical location or laboratory
- Standard reagents for FECT or MIF staining [9]
Procedure:
- Sample Collection and Preparation: Collect stool samples from a partner institution or public health laboratory that was not involved in providing the model's training data. Process samples using the formalin-ethyl acetate centrifugation technique (FECT) or Merthiolate-iodine-formalin (MIF) technique to prepare slides [9].
- Image Acquisition: Capture high-resolution digital images of the microscope slides. Ensure imaging conditions (e.g., magnification, lighting) are consistent but are allowed to have natural variations from the training set.
- Ground Truth Annotation: Have each image independently annotated by at least two trained medical technologists. Resolve any discrepancies through a third expert review. This consensus annotation serves as the ground truth.
- Data Management: Organize the images and their corresponding ground truth labels in a structured directory. Maintain a manifest file linking image IDs to labels and metadata (e.g., patient ID, sample date).
Protocol 2: Feature Extraction and Inference with DINOv2-large
Objective: To use the pretrained DINOv2-large model to generate image embeddings and perform classification without fine-tuning.
Materials:
- Python (v3.8+)
- PyTorch (v2.0+)
- DINOv2 library from Facebook Research [35]
Procedure:
- Environment Setup: Install the required libraries using pip or conda, as specified in the DINOv2 repository [35].
- Model Loading: Load the pretrained DINOv2-large model in Python.
- Image Preprocessing: Preprocess the external validation images to match the model's expected input. This typically involves resizing, normalization, and converting to a tensor.
- Feature Extraction: Pass each preprocessed image through the model to extract a feature embedding (a 768-dimensional vector for ViT-L/14).
- Classification: Train a simple linear classifier (e.g., logistic regression or support vector machine) on the features extracted from the training set. Then, use this classifier to predict labels for the features extracted from the external validation set. This protocol evaluates the quality of the features themselves for generalization.
Protocol 3: Performance Evaluation and Statistical Analysis
Objective: To quantitatively measure the model's performance and its agreement with human experts.
Materials:
- Python with scikit-learn, SciPy, and NumPy libraries
- Prediction outputs and ground truth labels from Protocol 2.
Procedure:
- Calculate Metrics: Compute standard classification metrics using the ground truth labels and the model's predictions.
- Accuracy, Precision, Recall, F1-Score: Use
sklearn.metrics.classification_report. - AUROC: Use
sklearn.metrics.roc_auc_score(one-vs-rest for multi-class). - Confusion Matrix: Use
sklearn.metrics.confusion_matrixto identify specific class confusions.
- Accuracy, Precision, Recall, F1-Score: Use
- Assess Inter-Rater Agreement: Calculate Cohen's Kappa coefficient to measure the level of agreement between the model's classifications and those of the human experts, beyond what would be expected by chance [9]. A kappa value >0.90 indicates almost perfect agreement.
- Bland-Altman Analysis: Perform a Bland-Altman analysis to visualize the agreement between the quantitative output of the model (e.g., probability of infection) and the expert's quantification [9]. This helps identify any systematic biases.
Visualization of Experimental Workflow
The following diagram illustrates the end-to-end process for assessing real-world generalization, from dataset curation to performance evaluation.
The Scientist's Toolkit: Research Reagent Solutions
This table details the key software and methodological components essential for replicating this assessment.
Table 4: Essential research reagents and computational tools for DINOv2 generalization assessment.
| Item | Type | Function / Description | Source / Example |
|---|---|---|---|
| DINOv2-large Model | Software / Model | A pre-trained Vision Transformer that provides robust, general-purpose image features without requiring fine-tuning. | Facebook Research GitHub [35] |
| PyTorch Framework | Software / Library | An open-source machine learning library used for loading the DINOv2 model and performing feature extraction. | Pytorch.org |
| Formalin-Ethyl Acetate | Laboratory Reagent | Used in the FECT method to concentrate parasitic elements in stool samples for microscopic examination. | Standard lab supplier [9] |
| Merthiolate-Iodine-Formalin (MIF) | Laboratory Reagent | A staining and fixation solution used for preserving and highlighting parasites in stool samples. | Standard lab supplier [9] |
| scikit-learn | Software / Library | A Python library used for training the linear classifier and computing all performance metrics and statistical measures. | scikit-learn.org |
| Cohen's Kappa Coefficient | Statistical Method | Measures the agreement between the model's and expert's classifications, correcting for chance. | [9] |
Within the context of a broader thesis on the DINOv2-large model for parasite classification, this application note explores its advanced utility in segmentation and density estimation—critical tasks for diagnostic parasitology. The DINOv2 (self-Distillation with No O labels) model, developed by Meta AI, represents a breakthrough in self-supervised learning (SSL) for computer vision [16] [13]. Unlike supervised models that require extensive labeled datasets, DINOv2 learns robust visual features directly from images without human annotations, making it particularly suitable for specialized domains like medical parasitology where expert labeling is costly and time-consuming [25] [85].
Trained on 142 million images from diverse datasets, DINOv2 employs a Vision Transformer (ViT) architecture that processes images as sequences of patches, enabling it to capture both global semantic context and local features essential for fine-grained morphological analysis [22] [16] [13]. This capability is crucial for distinguishing parasitic structures in complex stool sample images. Recent validation studies demonstrate DINOv2-large achieves 98.93% accuracy and 99.57% specificity in intestinal parasite identification, outperforming many supervised approaches [9] [8]. This document extends these findings by providing detailed protocols for applying DINOv2 to segmentation and density estimation tasks, enabling researchers to leverage its robust feature representations for advanced parasitological analyses.
Recent validation studies provide compelling evidence for DINOv2's application in parasitology. The table below summarizes key performance metrics for parasite identification from stool examinations, comparing DINOv2-large with other state-of-the-art models.
Table 1: Performance comparison of deep learning models in parasite identification
| Model | Accuracy (%) | Precision (%) | Sensitivity (%) | Specificity (%) | F1 Score (%) | AUROC |
|---|---|---|---|---|---|---|
| DINOv2-large | 98.93 | 84.52 | 78.00 | 99.57 | 81.13 | 0.97 |
| YOLOv8-m | 97.59 | 62.02 | 46.78 | 99.13 | 53.33 | 0.755 |
| YOLOv4-tiny | >90* | >90* | >90* | >90* | >90* | - |
Note: Exact values not reported in source; all models obtained >0.90 k score, indicating strong agreement with medical technologists [9] [8].
Beyond parasitology, DINOv2 has demonstrated exceptional performance across medical and scientific domains. In medical image diagnosis, DINOv2 achieved 99-100% classification accuracy for lung cancer, brain tumors, and leukemia datasets [25]. In geological image analysis, it proved highly effective for segmentation and classification tasks with micro-computed tomography data [19]. These cross-domain successes highlight DINOv2's robustness and generalization capabilities, reinforcing its potential for advanced parasitological applications.
Application Protocols
Semantic Segmentation of Parasitic Structures
Objective: Precisely segment parasitic eggs, cysts, and trophozoites from brightfield microscopy images of stool samples.
Background: Semantic segmentation provides pixel-level localization of parasitic structures, enabling morphological analysis and quantification. DINOv2's patch-level objective during training enables it to capture fine-grained local features essential for accurate boundary detection [13].
Table 2: Research reagents for segmentation protocol
| Reagent/Resource | Specifications | Function |
|---|---|---|
| DINOv2-large Model | ViT-L/16 architecture, 304M parameters | Feature extraction backbone |
| Stool Sample Images | Brightfield microscopy, 40x-100x magnification | Input data for analysis |
| MIF Stain | Merthiolate-iodine-formalin solution | Parasite fixation and contrast enhancement |
| Annotation Software | CVAT, LabelBox | Ground truth segmentation mask creation |
| Linear Classifier | 1-3 convolutional layers | Adaptation of features for segmentation |
| Qdrant Database | Vector similarity search engine | Storage and retrieval of embedding vectors |
Workflow:
Sample Preparation and Imaging:
- Prepare stool samples using formalin-ethyl acetate centrifugation technique (FECT) or Merthiolate-iodine-formalin (MIF) staining following standard parasitological protocols [9].
- Capture brightfield microscopy images at 40x-100x magnification, ensuring consistent illumination across samples.
- For training data, create pixel-level segmentation masks using annotation software, labeling classes: helminth eggs, protozoan cysts, trophozoites, artifacts, and background.
Feature Extraction with DINOv2:
Segmentation Head Implementation:
- Design a lightweight segmentation decoder that operates on DINOv2's patch features:
- This approach leverages DINOv2's robust patch representations while adding minimal computational overhead for the segmentation task.
Similarity-Based Refinement:
- Utilize a vector database (Qdrant) to store embedding vectors from validated segmentation masks [25].
- For challenging cases, retrieve the most similar reference embeddings using cosine similarity and refine the segmentation output based on these matches.
The following diagram illustrates the complete segmentation workflow:
Density Estimation via Instance Segmentation
Objective: Quantify parasite load by counting individual parasitic structures in stool sample images.
Background: Parasite density correlates with infection severity and treatment efficacy. DINOv2's understanding of object parts and robust feature representations enables accurate instance segmentation even with limited labeled data [16] [13].
Table 3: Research reagents for density estimation protocol
| Reagent/Resource | Specifications | Function |
|---|---|---|
| DINOv2-base Model | ViT-B/16 architecture, 86M parameters | Balanced performance and efficiency |
| FECT Kit | Formalin-ethyl acetate concentration | Sample preparation for optimal yield |
| - Hemocytometer | Standard counting chamber | Validation of parasite counts |
| Mask R-CNN | Detection framework | Instance segmentation architecture |
| Cosine Similarity | Metric learning | Embedding comparison for counting |
Workflow:
Data Preparation and Augmentation:
- Collect images with instance-level annotations (bounding boxes and masks) for parasitic structures.
- Apply extensive data augmentation including rotation, color jitter, and Gaussian blur to improve model robustness.
- For weak supervision, use point annotations or partial bounding boxes to reduce labeling burden.
DINOv2 Feature Integration:
- Implement a hybrid architecture combining DINOv2 features with detection heads:
Density Estimation:
- Count instances by detecting connected components in the predicted masks.
- Calculate parasite density as counts per microliter using the microscopy field volume conversion factor.
- Implement a regression-based approach for high-density samples where individual instance segmentation is challenging:
Validation:
- Compare automated counts with hemocytometer-based manual counts.
- Assess accuracy across different parasite densities (low, medium, high).
The instance segmentation and density estimation workflow is visualized below:
Implementation Framework
Technical Setup and Environment
System Requirements:
- Hardware: NVIDIA GPU with ≥16GB VRAM (e.g., V100, A100)
- OS: Linux distribution (Ubuntu 20.04+ recommended)
- RAM: ≥32GB for processing large whole-slide images
Dependency Installation:
Model Configuration and Adaptation
Feature Extraction Parameters:
- Input resolution: 518x518 pixels (DINOv2 default)
- Patch size: 16x16 pixels
- Feature dimension: 1024 (DINOv2-large), 768 (DINOv2-base)
- Output: Sequence of 1024-dimensional vectors (1024x1024 input → 32x32 patches)
Adaptation for Segmentation:
- Use a lightweight decoder rather than fine-tuning the entire backbone
- Freeze DINOv2 parameters during initial training phases
- Implement gradient checkpointing for memory-efficient training:
Validation and Interpretation
Performance Metrics:
- Segmentation: Dice coefficient, Intersection over Union (IoU), boundary F1 score
- Density estimation: Mean absolute error, Pearson correlation with manual counts
- Clinical utility: Sensitivity, specificity for diagnostic thresholds
Explainability:
- Implement attention visualization to identify image regions influencing predictions
- Use ViT-CX, a causal explanation method tailored for transformers, to generate clinically actionable heatmaps [25]
- Validate model focus areas with expert parasitologist annotations
The protocols outlined in this document demonstrate DINOv2's significant potential beyond classification in parasitology applications. By leveraging its self-supervised pre-training and robust feature representations, researchers can achieve accurate segmentation and density estimation with reduced reliance on extensively labeled datasets. The integration of similarity-based retrieval using vector databases further enhances model performance in challenging cases where morphological variability or artifact presence complicates analysis.
Future directions include adapting these approaches for video microscopy of motile parasites, multi-scale analysis for different magnification levels, and integration with clinical data for comprehensive diagnostic systems. As DINOv2 and similar self-supervised models continue to evolve, they promise to significantly advance computational parasitology, enabling more efficient, accurate, and accessible diagnostic tools for global health applications.
Conclusion
The integration of the DINOv2-large model for parasite classification represents a significant leap forward for biomedical AI. Evidence confirms its superior performance, achieving metrics such as 98.93% accuracy and 99.57% specificity, rivaling and sometimes surpassing human experts and other deep-learning models. Its self-supervised nature directly addresses the critical bottleneck of labeled data in medical imaging. Future directions should focus on developing large-scale, multi-center collaborative datasets, exploring multimodal integration with clinical data, and advancing towards fully automated, deployable diagnostic systems. This technology holds immense promise for revolutionizing global health strategies by enabling early detection, facilitating targeted interventions, and ultimately reducing the substantial burden of intestinal parasitic infections worldwide.
References
- 1. Self-Supervised Learning (SSL): Techniques and Applications [https://ai.koombea.com/blog/self-supervised-learning]
- 2. A survey on self-supervised learning: Recent advances ... [https://www.sciencedirect.com/science/article/abs/pii/S0925231225020818]
- 3. Self-supervised visual learning in the low-data regime [https://www.sciencedirect.com/science/article/pii/S0925231224019702]
- 4. Comparative analysis of supervised and self ... [https://www.nature.com/articles/s41598-025-99000-0]
- 5. Medical Image Segmentation: A Comprehensive Review of ... [https://pmc.ncbi.nlm.nih.gov/articles/PMC12115501/]
- 6. What are the main advantages of self-supervised learning? [https://milvus.io/ai-quick-reference/what-are-the-main-advantages-of-selfsupervised-learning]
- 7. Understanding DINOv2: Engineer's Deep Dive [https://www.lightly.ai/blog/dinov2]
- 8. Performance validation of deep-learning-based approach ... [https://pubmed.ncbi.nlm.nih.gov/40751198/]
- 9. Performance validation of deep-learning-based approach in ... [https://parasitesandvectors.biomedcentral.com/articles/10.1186/s13071-025-06878-w]
- 10. Performance validation of deep-learning-based approach ... [https://mahidol.elsevierpure.com/en/publications/performance-validation-of-deep-learning-based-approach-in-stool-e/]
- 11. DINOv2: Scalable Self-Supervised ViT Model [https://www.emergentmind.com/topics/dinov2]
- 12. Assessing the Performance of the DINOv2 Self-supervised ... [https://arxiv.org/html/2411.09598v1]
- 13. DINOv2: Self-supervised Learning Model Explained [https://encord.com/blog/dinov2-self-supervised-learning-explained/]
- 14. DinoV2-Image Classification, Visualization, and Paper Review [https://purnasaigudikandula.medium.com/dinov2-image-classification-visualization-and-paper-review-745bee52c826]
- 15. DINOv2: Learning Robust Visual Features without ... [https://arxiv.org/html/2304.07193v2]
- 16. DINOv2: State-of-the-art computer vision models with self ... [https://ai.meta.com/blog/dino-v2-computer-vision-self-supervised-learning/]
- 17. facebook/dinov2-base [https://huggingface.co/facebook/dinov2-base]
- 18. Medical slice transformer for improved diagnosis and ... [https://www.nature.com/articles/s41598-025-09041-8]
- 19. DINOv2 rocks geological image analysis: Classification, ... [https://www.sciencedirect.com/science/article/pii/S1674775525002677]
- 20. AI Deployment: A Complete Guide to Deploying AI Models [https://ai.koombea.com/blog/ai-deployment]
- 21. Machine Learning Trends 2025: What Every ML Engineer ... [https://devbysatyam.medium.com/machine-learning-trends-2025-what-every-ml-engineer-should-know-70159c5a3b29?source=rss------artificial_intelligence-5]
- 22. facebook/dinov2-large [https://huggingface.co/facebook/dinov2-large]
- 23. DINOv2 by Meta: Self-Supervised Vision Transformer [https://learnopencv.com/dinov2-self-supervised-vision-transformer/]
- 24. Exploring How DINOv2 was Trained [https://medium.com/@mgunton7/exploring-how-dinov2-was-trained-8195799173ae]
- 25. Explainable self-supervised learning for medical image ... [https://www.nature.com/articles/s41598-025-15604-6]
- 26. An Experimental Study of DINOv2 on Radiology Benchmarks [https://arxiv.org/html/2312.02366v3]
- 27. burden and regional variations of intestinal parasitic infections ... [https://pmc.ncbi.nlm.nih.gov/articles/PMC12576992/]
- 28. Global prevalence and correlation of intestinal parasitic ... [https://bmcgastroenterol.biomedcentral.com/articles/10.1186/s12876-025-04144-y]
- 29. Prevalence and associated risk factors of intestinal parasite ... [https://www.sciencedirect.com/science/article/pii/S2468227625001498]
- 30. StoolNet for Color Classification of Stool Medical Images [https://www.mdpi.com/2079-9292/8/12/1464]
- 31. Comparative Evaluation of Deep Learning Models for ... [https://pmc.ncbi.nlm.nih.gov/articles/PMC11943284/]
- 32. An insignificant bug that affected me significantly · Issue #223 [https://github.com/facebookresearch/dinov2/issues/223]
- 33. BioDet: Boosting Industrial Object Detection with Image ... [https://arxiv.org/html/2510.21000v1]
- 34. A Training-free Anomaly Classification and Segmentation ... [https://arxiv.org/html/2505.19750v1]
- 35. PyTorch code and models for the DINOv2 self-supervised ... [https://github.com/facebookresearch/dinov2]
- 36. DINOv2 - LightlyTrain documentation [https://docs.lightly.ai/train/stable/methods/dinov2.html]
- 37. Performance validation of deep-learning-based approach ... [https://hub.tmu.edu.tw/en/publications/performance-validation-of-deep-learning-based-approach-in-stool-e/]
- 38. Performance Validation of Deep Learning-based Approach ... [https://figshare.com/projects/Performance_Validation_of_Deep_Learning-based_Approach_in_Stool_Examination/234128]
- 39. Visualizing DINOv2 contrastive learning and classification ... [https://medium.com/digital-mind/visualizing-dinov2-contrastive-learning-and-classification-examples-9e6d8f87acf6]
- 40. Harness DINOv2 Embeddings for Accurate Image ... [https://pub.towardsai.net/harness-dinov2-embeddings-for-accurate-image-classification-f102dfd35c51]
- 41. A lightweight deep-learning model for parasite egg detection ... [https://parasitesandvectors.biomedcentral.com/articles/10.1186/s13071-024-06503-2]
- 42. analysis and machine learning for detecting malaria - PMC Image [https://pmc.ncbi.nlm.nih.gov/articles/PMC5840030/]
- 43. PGIP: a web server for the rapid taxonomic identification of ... [https://parasitesandvectors.biomedcentral.com/articles/10.1186/s13071-025-07007-3]
- 44. A lightweight deep-learning model for parasite egg ... [https://pubmed.ncbi.nlm.nih.gov/39501374/]
- 45. Deep-learning Assisted Detection and Quantification of (oo ... [https://arxiv.org/html/2304.05339v2]
- 46. Explainable self-supervised learning for medical image ... [https://pmc.ncbi.nlm.nih.gov/articles/PMC12402508/]
- 47. How to overcome data scarcity with quality data labeling [https://www.cloudfactory.com/blog/how-to-overcome-data-scarcity-with-quality-data-labeling]
- 48. Addressing annotation and data scarcity when designing ... [https://pmc.ncbi.nlm.nih.gov/articles/PMC10447257/]
- 49. Strategies for overcoming data scarcity, imbalance, and ... [https://www.nature.com/articles/s41598-024-59958-9]
- 50. Deep learning-based malaria parasite detection [https://www.nature.com/articles/s41598-025-87979-5]
- 51. Parasitic diagnosis: A journey from basic microscopy to cutting ... [https://pmc.ncbi.nlm.nih.gov/articles/PMC12617590/]
- 52. Progressive Image Resizing - Composer [https://docs.mosaicml.com/projects/composer/en/stable/method_cards/progressive_resizing.html]
- 53. Machine Learning Image Classification Guide 2025 [https://encord.com/blog/machine-learning-image-classification-guide/]
- 54. A review of machine learning methods for imbalanced data ... [https://pubs.rsc.org/en/content/articlehtml/2025/sc/d5sc00270b]
- 55. Hybrid Capsule Network for precise and interpretable ... [https://pmc.ncbi.nlm.nih.gov/articles/PMC12370641/]
- 56. Automated multi-model framework for malaria detection ... [https://www.nature.com/articles/s41598-025-04784-w]
- 57. MedAlmighty: enhancing disease diagnosis with large ... [https://pmc.ncbi.nlm.nih.gov/articles/PMC12378157/]
- 58. Knowledge Distillation: Compressing Large Models into ... [https://www.lightly.ai/blog/knowledge-distillation]
- 59. Why Model Distillation Is Making a Comeback in 2025 [https://medium.com/@thekzgroupllc/why-model-distillation-is-making-a-comeback-in-2025-1c74e989d5cc]
- 60. Preserving Angles Improves Feature Distillation [https://arxiv.org/html/2411.15239v3]
- 61. RedDino: A foundation model for red blood cell analysis [https://arxiv.org/html/2508.08180v2]
- 62. Deep learning for unsupervised domain adaptation in ... [https://www.sciencedirect.com/science/article/abs/pii/S001048252301377X]
- 63. HyDA: Hypernetworks for Test Time Domain Adaptation in ... [https://arxiv.org/abs/2503.04979]
- 64. HyDA: Hypernetworks for Test Time Domain Adaptation in ... [https://papers.miccai.org/miccai-2025/0428-Paper0392.html]
- 65. DualUD: Source-free unsupervised domain adaptation via ... [https://pubmed.ncbi.nlm.nih.gov/40840260/]
- 66. Foundation vision models in agriculture: DINOv2, LoRA ... [https://www.sciencedirect.com/science/article/abs/pii/S0168169925010063]
- 67. Enhancing deep learning for parasite detection [https://ijmronline.org/archive/volume/12/issue/1/article/19254]
- 68. MalNet-DAF: Dual-Attentive Fusion Deep Learning Model for ... [https://pubmed.ncbi.nlm.nih.gov/40729719/]
- 69. Performance validation of deep-learning-based approach in ... [https://pmc.ncbi.nlm.nih.gov/articles/PMC12317604/]
- 70. YOLO-Tryppa: A Novel YOLO-Based Approach for Rapid ... [https://www.mdpi.com/2313-433X/11/4/117]
- 71. YOLO-PAM: Parasite-Attention-Based Model for Efficient ... [https://pmc.ncbi.nlm.nih.gov/articles/PMC10744183/]
- 72. Interrater reliability: the kappa statistic - PMC [https://pmc.ncbi.nlm.nih.gov/articles/PMC3900052/]
- 73. Cohen's kappa [https://en.wikipedia.org/wiki/Cohen%27s_kappa]
- 74. Cohen's Kappa: Measuring Inter-Rater Agreement [https://numiqo.com/tutorial/cohens-kappa]
- 75. Kappa Coefficient Interpretation: Best Reference - Datanovia [https://www.datanovia.com/en/blog/kappa-coefficient-interpretation/]
- 76. Understanding Bland Altman analysis - PMC [https://pmc.ncbi.nlm.nih.gov/articles/PMC4470095/]
- 77. Bland–Altman plot [https://en.wikipedia.org/wiki/Bland%E2%80%93Altman_plot]
- 78. Bland-Altman plot - MedCalc Statistical Software Manual [https://www.medcalc.org/en/manual/bland-altman-plot.php]
- 79. Interpreting results: Bland-Altman [https://www.graphpad.com/guides/prism/latest/statistics/bland-altman_results.htm]
- 80. Recognition of parasitic helminth eggs via a deep learning- ... [https://pmc.ncbi.nlm.nih.gov/articles/PMC11614813/]
- 81. Comparative Evaluation of Deep Learning Models for ... [https://www.mdpi.com/2075-4426/15/3/121]
- 82. DINOv2: Learning Robust Visual Features without ... [https://openreview.net/forum?id=a68SUt6zFt]
- 83. : Learning Robust Visual Features without Supervision DINOv 2 [https://arxiv.org/abs/2304.07193]
- 84. Finding the Best Embedding Model for Image Classification [https://voxel51.com/blog/finding-the-best-embedding-model-for-image-classification]
- 85. DINOv2: Self-Supervised Computer Vision Models by Meta AI [https://www.kdnuggets.com/2023/05/dinov2-selfsupervised-computer-vision-models-meta-ai.html]