Comparing Semi-Landmark Methods for Shape Discrimination: A Practical Guide for Biomedical Research
This article provides a comprehensive comparison of semi-landmark methods for geometric morphometric analysis, tailored for researchers and professionals in drug development and biomedical science.
Comparing Semi-Landmark Methods for Shape Discrimination: A Practical Guide for Biomedical Research
Abstract
This article provides a comprehensive comparison of semi-landmark methods for geometric morphometric analysis, tailored for researchers and professionals in drug development and biomedical science. It explores the foundational principles of landmark types and the biological rationale for semi-landmarks, reviews prevalent methodologies including sliding, patch-based, and particle-based approaches, and offers practical guidance for troubleshooting common issues like sample size and algorithmic choice. Through a critical evaluation of validation studies and performance benchmarks across anatomical structures, it synthesizes key trade-offs to inform robust methodological selection for shape discrimination tasks in clinical and research applications.
Understanding Semi-Landmarks: From Biological Homology to Mathematical Correspondence
In geometric morphometrics, the analysis of biological form relies on capturing shape through defined points. This guide compares two fundamental paradigms for defining these points: homologous landmarks, rooted in biological ancestry and developmental homology, and mathematical semi-landmarks, defined by algorithmic correspondence and spatial sampling. While landmarks provide a direct link to evolutionary biology, semi-landmarks enable the quantification of shape from surfaces and curves lacking discrete homologous points. This article objectively compares the performance, applications, and limitations of these approaches, providing a structured framework for selecting appropriate methodologies in shape discrimination research.
In geometric morphometrics, the comparison of shapes requires a set of corresponding points across all specimens in a study. The definition of these points, however, can follow two fundamentally different philosophies, each with distinct implications for biological interpretation.
Homologous Landmarks are defined by biological correspondence. A landmark is a point that is considered equivalent in each individual due to shared evolutionary ancestry and developmental origins [1] [2]. Examples include the junction of cranial sutures or the tips of teeth cusps. The homology (sameness) of these points is a biological hypothesis based on prior knowledge of anatomy, development, and evolution [3] [4].
Mathematical Semi-Landmarks are defined by geometric or algorithmic correspondence. These are points placed on curves or surfaces to capture their form, but their specific locations are not justified by independent biological homology [1] [5]. Instead, their equivalence across specimens is determined by mathematical procedures, such as sliding along a curve or projecting onto a surface between "true" homologous landmarks [1] [6].
The core distinction lies in the basis for claiming that point A in specimen X is "the same" as point A in specimen Y. Is it because they share a developmental and evolutionary history (homology), or because an algorithm has placed them in topographically similar positions (mathematical correspondence)? This guide explores the practical consequences of this distinction for research outcomes.
Theoretical Foundations: Homology, Homoplasy, and Correspondence
The Biological Basis of Homology
In biology, homology signifies a similarity in structures or genes between different taxa that arises from their shared ancestry [2]. A classic example is the forelimbs of vertebrates, where the wings of bats, the arms of primates, and the flippers of whales are all homologous as forelimbs, despite their different functions, because they derive from the same ancestral tetrapod structure [2]. Homology is a relation of correspondence between parts of individuals (e.g., organs, organisms, lineages) that can be traced back to a common ancestral precursor [3] [4]. This relationship is transitive, meaning that if A corresponds to B, and B to C, then A corresponds to C, regardless of how much the structures may have diverged in form [3].
The Challenge of Homoplasy
Contrasting with homology, homoplasy is a similarity that arises through independent evolution rather than common descent [7]. This includes convergence (where different developmental processes produce similar forms), parallelism, and reversals [3] [7]. The wings of birds and insects are analogous, not homologous, as they evolved independently. This is crucial for morphometrics because a mathematical correspondence established by an algorithm could inadvertently match homoplastic structures, potentially leading to misleading biological inferences [1].
Mathematical Correspondence as an Operational Tool
Mathematical correspondence methods do not rely on prior biological knowledge. Instead, they operationalize "sameness" through geometry and algorithms. Common approaches include:
- Sliding Semi-Landmarks: Points are placed between homologous landmarks and then "slid" to minimize bending energy or Procrustes distance, effectively removing the tangential component of variation that is arbitrary due to their initial placement [1] [5].
- Dense Correspondence Analysis: Algorithms like Non-rigid Iterative Closest Point (NICP) or Large Deformation Diffeomorphic Metric Mapping (LDDMM) deform a template specimen onto target specimens, transferring a dense set of points [1] [8].
- Conformal Mapping: Used in 2D analyses, this method transforms complex shapes (like a leaf outline) into a simpler space (like a circle) where correspondences are easier to establish [6].
These methods prioritize dense shape coverage over biological point homology, which is both their primary strength and their primary weakness.
Comparative Methodologies and Experimental Protocols
Several experimental studies have directly compared the performance of different landmarking approaches. The protocols and findings from key studies are summarized below.
Protocol 1: Comparing Semi-Landmarking Approaches on Ape Crania
Shui et al. [1] conducted a comparison of three landmark-driven semilandmarking approaches using surface mesh datasets of ape crania and human heads.
Methodologies Compared:
- Optic Flow: Estimates dense correspondences based on image intensity patterns.
- Thin-Plate Spline (TPS) and Gaussian Process (GP): Uses known landmarks to guide the interpolation of correspondences across surfaces.
- Non-rigid Iterative Closest Point (NICP): Iteratively matches points between a template and a target surface using a non-rigid transformation.
Key Experimental Steps:
- A template specimen was manually landmarked.
- Semilandmarks were transferred to each target specimen using the different algorithms.
- Transferred points were slid to minimize bending energy.
- The resulting point configurations were analyzed using Procrustes ANOVA and other morphometric tools to compare patterns of shape variation.
Findings: While the non-rigid approaches (NICP and Optic Flow) produced more consistent results with each other, all methods yielded different semilandmark locations, which in turn led to differences in statistical results. This highlights that the choice of algorithm introduces a source of error and that results should be considered approximations [1].
Protocol 2: Evaluation of Dense Sampling Strategies on Great Ape Skulls
Another study [5] implemented and compared three dense sampling strategies for analyzing 3D images of great ape skulls (Pan troglodytes, Gorilla gorilla, Pongo pygmaeus).
Methodologies Compared:
- Patch-based Sampling: Triangular patches defined by three manual landmarks are projected onto the specimen's surface independently for each specimen.
- Patch-TPS: Patches are defined on a single template and transferred to all specimens via a Thin-Plate Spline (TPS) transform and projection.
- Pseudo-landmark Sampling: A template model is regularly sampled at arbitrary locations, and points are transferred via TPS.
Key Experimental Steps:
- Manual landmarks were collected on all specimens.
- Each dense sampling method was used to generate hundreds to thousands of additional points.
- The accuracy of each method was quantified by using the landmark sets to estimate a transform between an individual and the population average template. The average mean root squared error between the transformed mesh and the template was the performance metric.
Findings: All methods provided shape estimations comparable to or better than using manual landmarks alone. The patch method was most sensitive to noise and missing data, while Patch-TPS and pseudo-landmarking were more robust [5].
Protocol 3: Landmark-Free Morphometrics Across Diverse Mammals
A large-scale study [8] assessed the application of a landmark-free method, Deterministic Atlas Analysis (DAA), across 322 mammals spanning 180 families, comparing it to a high-density geometric morphometric approach.
Methodologies Compared:
- Manual Landmarking with Semi-Landmarks: The traditional standard.
- Deterministic Atlas Analysis (DAA): A landmark-free method that computes diffeomorphic deformations from a sample-derived atlas to each specimen. Control points guide the comparison without predefined homology.
Key Experimental Steps:
- Specimens were processed with both methods.
- The correlation between shape matrices from each method was assessed using Mantel tests and PROTEST.
- Downstream macroevolutionary analyses (phylogenetic signal, morphological disparity, evolutionary rates) were computed from both datasets and compared.
Findings: After standardizing mesh data, DAA showed a significant correlation with manual landmarking results. However, differences emerged, particularly for certain clades like Primates and Cetacea. Downstream evolutionary metrics were comparable but not identical, indicating that methodological choice can influence biological inference [8].
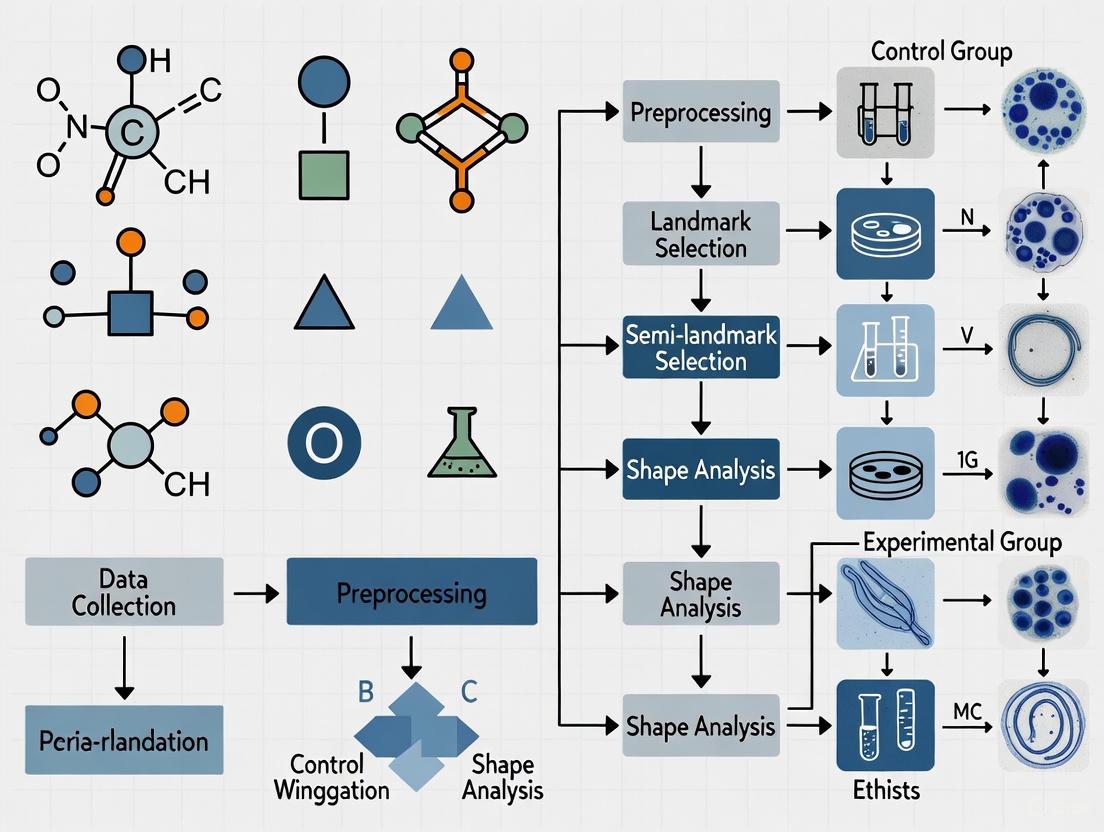
The following workflow diagram synthesizes the general process for comparing these methods, as used across the cited studies.
Performance Data: A Quantitative Comparison
The following tables synthesize quantitative and qualitative findings from the experimental studies cited, providing a direct comparison of methodological performance.
Table 1: Performance Comparison of Different Semi-Landmark and Landmark-Free Methods
| Method | Theoretical Basis | Key Strength | Key Limitation | Reported Performance/Outcome |
|---|---|---|---|---|
| Homologous Landmarks [1] [5] | Biological Homology | Direct biological interpretability; clear evolutionary context. | Limited to discrete, identifiable points; sparse shape representation. | Gold standard for biological inference, but captures limited morphological information [5]. |
| Sliding Semi-Landmarks [1] [5] | Mathematical (Bending Energy/Procrustes Distance) | Enables quantification of smooth curves and surfaces. | Arbitrary initial placement; sliding requires landmarks as anchors. | Greatly increases shape information, but results are sensitive to sliding criterion (TPS vs. Procrustes) [1]. |
| Patch & Patch-TPS [5] | Geometric (Template Projection) | Good coverage of user-defined regions; repeatable. | Sensitive to surface noise and patch definition. | Patch-TPS more robust than direct Patch method; outliers occur with noise/missing data [5]. |
| Pseudo-Landmarks [5] [8] | Mathematical (Arbitrary Sampling) | Very high density; can cover entire surface automatically. | No biological homology; correspondence is purely algorithmic. | Provides robust performance and high-density coverage, but biological meaning of variation is less direct [5]. |
| Landmark-Free (DAA) [8] | Mathematical (Diffeomorphic Mapping) | No manual landmarking needed; applicable across disparate taxa. | Complex setup; results depend on parameters (e.g., kernel width). | Correlates with manual landmarking but shows clade-specific differences; impacts downstream evolutionary metrics [8]. |
Table 2: Impact on Downstream Macroevolutionary Analyses [8]
| Analysis Type | Comparison Finding (Manual vs. Landmark-Free) | Implication |
|---|---|---|
| Phylogenetic Signal | Produced comparable but varying estimates. | Methodological choice can influence the perceived integration of shape with phylogeny. |
| Morphological Disparity | Patterns were broadly similar but not identical. | Estimates of morphological diversity within clades may be method-dependent. |
| Evolutionary Rates | Inferred rates were correlated but showed differences in magnitude. | Conclusions about the tempo of evolution could be affected by the chosen morphometric approach. |
The Scientist's Toolkit: Essential Research Reagents and Software
Successful implementation of landmark and semi-landmark analyses requires a suite of software tools and methodological considerations. The following table details key "research reagents" for this field.
Table 3: Essential Software and Methodological "Reagents" for Morphometrics
| Tool/Reagent | Function | Example Use-Case |
|---|---|---|
| 3D Slicer / SlicerMorph [5] | Open-source platform for 3D visualization and image analysis. | Used for manual landmarking, and implementing patch-based and pseudo-landmark sampling protocols [5]. |
| R packages (Morpho, geomorph) [5] | Statistical analysis and visualization of shape data. | Used for Procrustes superimposition, sliding semi-landmarks, and performing statistical tests (e.g., Procrustes ANOVA) [5]. |
| Deformetrica [8] | Software for implementing landmark-free methods like Deterministic Atlas Analysis (DAA). | Used for large-scale studies across disparate taxa where manual landmarking is not feasible [8]. |
| Thin-Plate Spline (TPS) Transformation [1] [5] | A mathematical function for smooth interpolation of deformations. | Core to many semilandmarking approaches for warping a template onto a target specimen [1]. |
| Poisson Surface Reconstruction [8] | Algorithm for creating watertight, closed surface meshes from scan data. | Critical for standardizing data from mixed modalities (CT vs. surface scans) before landmark-free analysis [8]. |
| Conformal Mapping & DTW Algorithm [6] | Transforms 2D outlines into a "fingerprint" function for automatic landmark matching. | Used for automatic landmarking of 2D leaf shapes, achieving <5% coordinate deviation from manual placement [6]. |
The choice between homologous landmarks and mathematical semi-landmarks is not a matter of which is universally superior, but which is most appropriate for the specific research question and dataset.
Use Homologous Landmarks when the research goal is to test explicit evolutionary hypotheses about the transformation of specific, identifiable anatomical structures. This approach is ideal for studies of closely related species or when analyzing modularity and integration of known anatomical units [1] [2].
Use Semi-Landmarks when the study requires quantification of overall form, especially from smooth curves and surfaces lacking discrete landmarks. This approach is powerful for quantifying gross morphological differences and is essential for capturing geometric information from regions like cranial vaults or leaf outlines [1] [5] [6].
Consider Landmark-Free Methods for large-scale, macroevolutionary studies across highly disparate taxa where identifying numerous homologous points is impractical. These methods offer unparalleled efficiency for big datasets, but researchers must be cautious, as the resulting patterns of shape variation may not be directly equivalent to those derived from homologous points [8].
In practice, many modern studies employ a hybrid approach, using a core set of homologous landmarks to provide a biological framework and a dense cloud of semi-landmarks to capture comprehensive shape information. This combines the biological grounding of homology with the rich geometric power of mathematical correspondence, offering a robust solution for the complex challenge of quantifying biological form.
In the field of geometric morphometrics, biological structures are often quantified using landmarks—discrete, homologous points that can be reliably identified across specimens. However, many biologically significant structures, such as the cranial vault or long bone surfaces, present extensive smooth areas devoid of such discrete landmarks. This fundamental challenge has led to the development of semi-landmark methods, which use algorithmic approaches to densely match points between surfaces lacking readily identifiable landmarks. These methods have become indispensable for capturing comprehensive shape information, yet their application involves critical choices that directly impact research outcomes in evolutionary biology, anthropology, and related fields [1].
This guide provides an objective comparison of predominant semi-landmark approaches, their performance characteristics, and detailed experimental protocols to inform methodological selection for shape discrimination research.
Methodological Approaches: A Comparative Framework
Three primary strategies have emerged for the dense sampling of three-dimensional biological surfaces, each with distinct operational characteristics and theoretical foundations.
Table 1: Core Semi-Landmark Methodologies
| Method | Core Principle | Homology Assurance | Key Requirement |
|---|---|---|---|
| Patch-Based | Projects points from triangular patches defined by manual landmarks onto the specimen surface | High (geometric relationship to manual landmarks) | Manual landmarks defining patch boundaries |
| Patch-TPS | Transfers semi-landmarks from a template to targets via Thin-Plate Spline (TPS) transformation | Moderate (guided by template landmarks) | Representative template specimen |
| Pseudo-Landmark | Automatically samples points on surfaces with no direct relationship to manual landmarks | Low (mathematical correspondence only) | High-quality surface meshes |
Patch-Based Semi-Landmarking
This approach operates independently on each specimen. Researchers first define triangular regions bounded by three manual landmarks. A template grid with a user-specified density is then registered to these boundaries using thin-plate spline deformation and projected onto the specimen surface along calculated normal vectors. The method preserves a clear geometric relationship between semi-landmarks and manual landmarks, maintaining stronger homology claims. However, it demonstrates sensitivity to surface noise and may produce placement errors in regions with sharp curvatures [5].
Patch-Based with TPS Transfer
This template-dependent method applies patch-based semi-landmarking to a single representative specimen (either a synthetic average or an actual sample). These points are then transferred to all specimens in a dataset through a TPS transformation calculated from manual landmark correspondences, followed by projection along the template's normal vectors. This approach improves robustness against noise and missing data compared to the basic patch method, though it introduces dependency on template selection [5].
Pseudo-Landmark Sampling
This landmark-free approach generates points directly on a template model through regular sampling, assuming spherical topology. A spatial filter enforces minimum distances between points to prevent clustering. These points are transferred to individual samples via TPS and normal projection. While this method offers extensive coverage independent of manual landmark placement, it completely severs the connection with biological homology, relying instead on mathematical correspondence [5].
Experimental Performance Comparison
Recent studies have systematically evaluated these methods using great ape cranial datasets, providing quantitative performance data. The evaluation typically involves estimating a transformation between an individual specimen and a population average template, then calculating the mean root squared error (MRSE) between the transformed mesh and the template.
Table 2: Performance Comparison of Semi-Landmark Methods
| Method | Shape Estimation Accuracy | Robustness to Noise | Computational Demand | Sample Coverage |
|---|---|---|---|---|
| Manual Landmarks Only | Baseline reference | High | Low | Limited to defined points |
| Patch-Based | Comparable or superior to manual landmarks | Low (produces outliers) | Moderate | Dependent on manual landmark placement |
| Patch-TPS | Comparable or superior to manual landmarks | High | Moderate to High | Good (template-dependent) |
| Pseudo-Landmark | Comparable or superior to manual landmarks | High | High | Excellent |
Key Performance Findings
Studies implementing these methods on great ape cranial data have demonstrated that all three automated strategies can produce shape estimations of population average templates that are generally comparable to, and often exceed, the accuracy achieved using manual landmarks alone. This accuracy improvement comes while dramatically increasing the density of shape information [5].
The patch method demonstrates the greatest sensitivity to data quality issues, resulting in outliers with substantial deviations in mean shape estimates when surface noise or irregularities are present. Both patch-TPS and pseudo-landmark methods provide more robust performance across datasets with varying quality and morphological variability [5].
Research Reagent Solutions
The implementation of semi-landmark methodologies requires specific software tools and technical components.
Table 3: Essential Research Materials and Tools
| Research Reagent | Function/Description | Application Context |
|---|---|---|
| 3D Slicer with SlicerMorph | Open-source platform for visualization and analysis of 3D image data | Primary environment for implementing semi-landmark protocols [5] |
| Surface Meshes | 3D digital representations of biological structures (e.g., crania) | Fundamental input data for all semi-landmark analyses [1] [5] |
| Manual Landmark Sets | Expert-placed homologous points defining biological correspondences | Foundation for patch-based methods and TPS transformations [5] |
| Thin-Plate Spline (TPS) | Mathematical transformation for interpolation between landmark points | Core algorithm for transferring semi-landmarks in template-based approaches [1] [5] |
Workflow Visualization
The following diagram illustrates the logical relationships and decision pathways for selecting and implementing semi-landmark methodologies:
Critical Considerations for Method Selection
When implementing semi-landmark approaches in research, several critical factors require consideration:
Trade-offs in Method Selection: The choice between methods involves balancing correspondence quality, point spacing consistency, sample coverage, repeatability, and computational time. No single method optimizes all parameters simultaneously [5].
Interpretation Limitations: Results from semi-landmark analyses should be considered approximations of biological reality. Different approaches produce varying semi-landmark locations, which can lead to differences in statistical outcomes, necessitating cautious interpretation [1].
Template Sensitivity: Template-based methods (patch-TPS and pseudo-landmarks) demonstrate dependency on template selection. The ideal template exhibits high geometric similarity to the sample population to minimize projection artifacts [1].
Sliding Procedures: Most methodologies include an optional sliding step where semi-landmarks are adjusted to minimize bending energy or Procrustes distance. This refinement reduces potential artifacts introduced by initial point placement but adds computational complexity [1].
Semi-landmark methods have substantially advanced our ability to quantify biological shape on smooth surfaces where traditional landmarks are scarce. The patch, patch-TPS, and pseudo-landmark approaches each offer distinct advantages, with the optimal choice dependent on research questions, data quality, and biological constraints. While these methods significantly increase shape information density, researchers must acknowledge that all semi-landmark placements represent estimates rather than true biological homologies. As methodological refinement continues, these approaches will remain essential tools for extracting comprehensive shape data in evolutionary morphology, paleontology, and biological anthropology.
In geometric morphometrics, landmarks are defined as discrete, homologous points of biological correspondence that can be precisely located and measured across specimens. These points serve as the fundamental data for quantifying biological form, enabling researchers to statistically analyze shape variation within and between populations, species, and higher taxa. The conceptualization and classification of landmarks proposed by Fred Bookstein in the 1990s have profoundly influenced how researchers select points for morphological analysis, establishing a theoretical framework for evaluating the biological relevance and methodological reliability of landmark data [9] [10].
Bookstein's typology emerged during a pivotal period when morphometrics transitioned from traditional measurement-based approaches to geometry-based statistical frameworks. This classification system provides critical guidance for identifying points that best capture biologically meaningful shape variation rather than arbitrary geometric locations. The theoretical foundation of this typology rests on the principle of biological homology, where landmarks represent corresponding biological loci across specimens, thus enabling valid comparisons of form [11]. This review examines the three landmark types within Bookstein's framework, their biological and methodological characteristics, and their evolving role in contemporary morphometric research, particularly in relation to emerging semi-landmark methods for shape discrimination.
Bookstein's Landmark Typology: Definitions and Examples
Bookstein's classification system categorizes landmarks into three distinct types based on their anatomical locations and biological significance. This typology assists researchers in selecting landmarks that maximize biological information while considering practical constraints in identification and measurement.
Table 1: Bookstein's Three Landmark Types: Definitions and Biological Basis
| Landmark Type | Definition | Biological Basis | Examples | Methodological Considerations |
|---|---|---|---|---|
| Type I | Points at discrete juxtapositions of tissues | Highest degree of biological homology; defined by local topology | Foramina, suture intersections, enamel junctions | Considered most reliable; limited in number on many biological structures |
| Type II | Points at maxima of curvature or other local morphometric phenomena | Defined by geometric properties rather than specific tissue interactions | Tips of processes, furthest points on bulges | More abundant than Type I; may have less precise biological correspondence |
| Type III | Points at extreme points or constructed locations | Minimal biological homology; often defined by extremal points | Extremities of longest axes, tangent points | Most numerous but contain deficient information about shape variation |
Type I Landmarks
Type I landmarks represent the highest order of biological homology in Bookstein's classification, defined by discrete juxtapositions of tissues or structures. These points have a precise biological definition independent of the overall geometry of the form. Common examples include foramina (openings for nerves and blood vessels), intersections of cranial sutures, and junctions between different dental tissues. In craniometric analyses, Type I landmarks might include the intersection of the sagittal and coronal sutures (bregma) or the various cranial foramina such as the infraorbital foramen or mental foramen. These landmarks are considered the most reliable for morphometric analyses because their precise anatomical definition theoretically enables different researchers to identify the same location consistently across specimens [9].
Type II Landmarks
Type II landmarks are defined by local geometric properties rather than specific tissue interactions. These points typically occur at maxima of curvature, tips of processes, or the most concave or convex points on a structure. Examples include the tip of the chin (gnathion), the tip of the nasal bones (rhinion), or the furthest point on the occipital condyles. While Type II landmarks lack the precise tissue-level definition of Type I landmarks, they still represent locations that can be reliably identified based on their geometric properties and often correspond to functionally or developmentally significant aspects of morphology. In practice, Type II landmarks are more abundant on biological structures than Type I landmarks, making them essential for capturing comprehensive shape information [9].
Type III Landmarks
Type III landmarks represent the most geometrically defined category, consisting of extremal or constructed points with minimal biological homology. These points are defined primarily by their positional relationships to other landmarks or by being the most distant points in a particular direction. Examples include the furthest posterior point on the skull (opisthocranion) or the most lateral points on the zygomatic arches (euryon). Bookstein and others have argued that Type III landmarks contain deficient information about shape variation and are less reliably measured than Type I or II landmarks because their definition depends heavily on the overall orientation of the specimen and may not correspond to developmentally or functionally discrete entities [9].
Methodological Considerations and Contemporary Critique
While Bookstein's landmark typology provides a valuable theoretical framework for understanding biological correspondence in morphometric analyses, its practical application faces significant challenges that have led to contemporary critiques and methodological evolution.
Theoretical Basis for Landmark Selection
The hierarchical valuation of landmarks in Bookstein's typology stems from theoretical concerns about the biological meaningfulness of shape information captured by each type. Type I landmarks are privileged because their precise tissue-level definition theoretically makes them optimal for studying biological processes such as development, evolution, and functional adaptation. The decreasing preference for Type II and III landmarks reflects concerns about their potential measurement error and less direct relationship to underlying biological processes [9] [11].
This theoretical framework has practical implications for research design. Studies prioritizing tests of specific biological hypotheses might emphasize Type I landmarks, while those focused on comprehensive shape characterization might incorporate more Type II and III landmarks to increase the density of shape information. This balance exemplifies the constant trade-off in morphometrics between biological specificity and geometric comprehensiveness [5].
Empirical Challenges in Application
Recent empirical investigations have revealed substantial challenges in consistently applying Bookstein's typology. A comprehensive review of geometric morphometrics studies found considerable variation in landmark classifications among different researchers, with disagreement in the application of both Bookstein's landmark typology and individual landmark definitions [9]. This inconsistency stems from several factors:
- Ambiguity in classification criteria: Many anatomical locations display characteristics of multiple landmark types
- Structural variation: The same anatomical feature may present differently across specimens
- Disciplinary conventions: Different research traditions apply typology differently
Perhaps more significantly, literature review has shown little correlation between landmark type and measurement reproducibility, especially when considering factors such as differences in measurement tools (calipers, digitizer, or computer software) and data sources (dry crania, 3D models, or 2D images) [9]. This finding challenges a fundamental assumption underlying the typology—that Type I landmarks are inherently more reliably measured.
Limitations and Contemporary Critique
In their seminal critique, Wärmländer et al. (2019) argue that while landmark typology is valuable for teaching biological shape analysis, "employing it in research design introduces confusion without providing useful information" [9]. This perspective is supported by several observations:
- The typology does not consistently predict measurement error in practical applications
- Over-reliance on Type I landmarks severely limits the number of points available for analysis
- Many biological structures lack sufficient Type I landmarks for comprehensive shape analysis
- The classification often becomes arbitrary for complex morphological structures
Instead, these researchers recommend that "researchers should choose landmark configurations based on their ability to test specific research hypotheses, and research papers should include justifications of landmark choices along with landmark definitions, details on landmark collection methods, and appropriate interobserver and intraobserver analyses" [9]. This approach emphasizes methodological transparency and empirical validation over theoretical categorization.
Landmark Typology in Contemporary Morphometric Methods
The evolution of morphometric methodologies, particularly the development of semi-landmark and landmark-free approaches, has transformed the practical relevance of Bookstein's typology while maintaining focus on the fundamental challenge of capturing biologically meaningful shape data.
Semi-Landmarks and Landmark Typology
Semi-landmarks were developed to quantify the shape of curves and surfaces between traditional landmarks, effectively bridging the information gap between discrete points [5]. These points are not individually homologous but capture information about boundaries and surfaces between Type I and II landmarks. The application of semi-landmarks represents both an extension and a departure from Bookstein's original typology:
- Relaxed homology requirements: Semi-landmarks sacrifice individual homology to capture comprehensive shape information
- Geometric correspondence: Points are placed based on geometric spacing rather than biological correspondence
- Statistical optimization: Final positions are determined through algorithms that minimize bending energy or Procrustes distance
Different semi-landmarking approaches navigate the trade-offs between correspondence, spacing, coverage, and repeatability differently. The patch-based approach projects points from triangular patches constructed from manual landmarks, maintaining some geometric relationship to Type I/II landmarks. The patch-TPS method transfers semi-landmarks from a template using thin-plate spline transformation, while pseudo-landmark sampling generates points with no direct relationship to manual landmarks [5]. As these methods demonstrate, contemporary morphometrics increasingly prioritizes comprehensive shape capture over strict adherence to traditional landmark typologies.
Landmark-Free Methods and Their Implications
Recent advances in landmark-free morphometrics represent a further departure from Bookstein's framework by eliminating the need for discrete landmarks altogether. Methods such as Large Deformation Diffeomorphic Metric Mapping (LDDMM) and Deterministic Atlas Analysis (DAA) compare entire shapes using control points that have no necessary relationship to biologically homologous locations [12]. These approaches offer particular advantages for analyzing morphologically disparate taxa where homologous landmarks are obscure or few in number [12].
Landmark-free methods address several limitations of traditional landmark-based approaches:
- Overcoming homology constraints: Enable comparisons across phylogenetically diverse taxa
- High-throughput capability: Automate shape analysis for large datasets
- Comprehensive shape capture: Quantify global shape differences beyond discrete points
However, these methods also face challenges in ensuring biological meaningfulness and may require validation against traditional landmark-based approaches [12]. The emergence of these techniques reflects an ongoing methodological evolution from discrete homologous points to comprehensive shape characterization.
Experimental Protocols and Research Applications
Comparative Evaluation of Landmarking Strategies
Research evaluating different landmarking approaches typically follows standardized protocols to ensure methodological rigor. In a comparative study of semi-landmarking approaches for analyzing great ape cranial morphology, researchers implemented three sampling strategies: patch, patch-TPS, and pseudo-landmark sampling [5]. The experimental workflow involved:
- Specimen preparation: DICOM stacks of great ape skulls (Pan troglodytes, Gorilla gorilla, and Pongo pygmaeus) were converted to volumes and reviewed for completeness
- Manual landmarking: Expert placement of traditional Type I and II landmarks using 3D Slicer software
- Semi-landmark generation: Application of each sampling strategy to generate dense point sets
- Template estimation: Use of semi-landmarks to estimate transforms between individuals and population average templates
- Error quantification: Calculation of mean root squared error between transformed meshes and templates
This study found that while all semi-landmarking strategies produced shape estimations comparable to manual landmarks alone, they differed significantly in their robustness to noise and missing data. The patch method demonstrated highest sensitivity to noise, while patch-TPS and pseudo-landmarking provided more consistent performance across variable datasets [5].
Figure 1: Experimental workflow for comparing semi-landmarking approaches, showing three strategies evaluated for shape analysis of great ape cranial morphology [5].
Automated Landmark Identification Protocols
Studies evaluating automated landmark placement typically employ rigorous validation protocols to assess accuracy and reliability. In a comprehensive analysis of automated landmark identification on mouse skulls, researchers compared manually and automatically generated landmarks using a large sample (n=1205) representing 62 mouse genotypes [11]. The experimental methodology included:
- Dataset preparation: Micro-computed tomography (μCT) images of adult mouse skulls
- Manual landmarking: Expert placement of 32 anatomical landmarks on each specimen
- Automated landmarking: Atlas-based registration using genotype-specific templates
- Accuracy assessment: Comparison of landmark positions between methods
- Morphometric analysis: Comparison of shape variation and covariance structures
This research found that although automated landmark placement was significantly different than manual placement, it successfully captured skull shape covariation structure and could identify shape differences between inbred mouse genotypes with similar power to manual methods [11]. The study also noted that automated methods demonstrated reduced shape variance estimates, partially reflecting underestimation of extreme genotypes but also the elimination of intra-observer error inherent in manual landmarking.
Table 2: Comparison of Manual and Automated Landmarking Methods in Mouse Skull Analysis
| Analysis Aspect | Manual Landmarking | Automated Landmarking | Research Implications |
|---|---|---|---|
| Landmark placement time | Time-consuming (hours to days) | Rapid (batch processing) | Enables high-throughput phenotyping |
| Measurement reproducibility | Subject to intra-observer error | Algorithmically standardized | Improves consistency across studies |
| Biological signal detection | Captures extreme shapes well | May underestimate morphological extremes | Important consideration for outlier detection |
| Shape variance estimates | Includes observer error | Reduced variance due to standardization | Affects statistical power in group comparisons |
| Applicability to large datasets | Limited by practical constraints | Scalable to very large samples | Facilitates phenomic analysis |
Contemporary morphometric research utilizes a diverse array of computational tools and methodological approaches. The following essential resources represent the current state of the field for landmark-based shape analysis:
Table 3: Essential Research Tools for Landmark-Based Morphometric Analysis
| Tool/Resource | Function | Application Context | Methodological Role |
|---|---|---|---|
| 3D Slicer with SlicerMorph | Open-source platform for 3D visualization and analysis | Great ape cranial morphology studies [5] | Provides semi-automated landmarking protocols and geometric morphometrics workflows |
| R packages (Morpho, geomorph) | Statistical shape analysis | Generalized Procrustes analysis, phylogenetic comparisons [5] | Standardized implementation of shape statistics and visualization |
| Atlas-based registration | Automated landmark identification | High-throughput mouse phenotyping [11] | Enables scalable landmark placement across large datasets |
| Deterministic Atlas Analysis (DAA) | Landmark-free shape comparison | Macroevolutionary analyses across mammalian taxa [12] | Facilitates shape comparisons without homologous landmarks |
| Elliptical Fourier Analysis | Outline-based shape quantification | Archaeological artifact analysis [13] | Captures shape information from boundaries rather than discrete points |
Bookstein's landmark typology represents a foundational conceptual framework that continues to inform discourse on biological correspondence in morphometrics, though its practical application has been tempered by empirical challenges and methodological evolution. While the theoretical hierarchy from Type I to Type III landmarks provides a valuable heuristic for understanding biological meaningfulness, contemporary research demonstrates that strict adherence to this typology may limit analytical scope without guaranteeing improved measurement reliability.
The development of semi-landmark and landmark-free methods reflects an ongoing methodological progression toward more comprehensive shape characterization, with researchers increasingly selecting landmark configurations based on their ability to test specific biological hypotheses rather than theoretical classifications. This pragmatic approach, coupled with transparent reporting of landmark definitions and measurement protocols, represents the current best practice in morphometric research.
As the field continues to evolve with advances in automated landmarking and dense shape correspondence methods, the core principles embodied in Bookstein's typology—attention to biological meaningfulness, concern for measurement reliability, and critical evaluation of landmark choices—remain essential guides for rigorous shape analysis. Future methodological development will likely further bridge the gap between discrete landmark-based approaches and comprehensive shape characterization, expanding our ability to address fundamental questions in evolutionary biology, functional morphology, and developmental genetics.
Geometric morphometrics (GM) has revolutionized the quantitative analysis of biological form. However, a significant limitation of traditional landmark-based methods is their sparse characterization of morphology, particularly across smooth surfaces and complex curves lacking discrete anatomical points. Semi-landmarks have emerged as an essential methodological innovation that addresses this constraint by dramatically increasing the density of shape information captured. This guide objectively compares the performance of leading semi-landmark methodologies, evaluating their experimental outcomes, technical requirements, and applicability across research contexts from evolutionary biology to medical imaging.
In geometric morphometrics, landmarks are defined as discrete, homologous anatomical points that can be reliably identified across all specimens in a study. While powerful, this approach captures only a fraction of morphological variation because many biologically significant structures—such as cranial vaults, feather outlines, or arm contours—contain few, if any, true homologous points [1]. This creates an information density problem, where sparse landmark configurations inadequately represent the continuous biological surfaces and curves that interest researchers.
Semi-landmarks solve this fundamental problem by providing a mathematically rigorous framework for quantifying shape along curves and surfaces between traditional landmarks. Unlike landmarks, which represent developmental or evolutionary homologies, semi-landmarks establish geometric correspondences through algorithmic placement and sliding procedures [1]. This methodological advancement has transformed morphometrics by enabling dense sampling of form while maintaining compatibility with established statistical shape spaces.
Comparative Performance of Semi-Landmark Methods
Classification Accuracy Across Biological Structures
Table 1: Discrimination Performance of Semi-Landmark vs. Alternative Approaches
| Biological Structure | Method Category | Specific Technique | Classification Accuracy | Study Reference |
|---|---|---|---|---|
| Feather outlines | Semi-landmark | Bending energy alignment | Roughly equal performance | [14] |
| Feather outlines | Semi-landmark | Perpendicular projection | Roughly equal performance | [14] |
| Feather outlines | Outline-based | Elliptical Fourier analysis | Similar to semi-landmarks | [14] |
| Feather outlines | Outline-based | Extended eigenshape method | Similar to semi-landmarks | [14] |
| Arthropod wings | Landmark-based | Traditional landmarks | 79% average correct assignment | [15] |
| Arthropod wings | Outline-based | Elliptic Fourier analysis | 85% average correct assignment | [15] |
| Great ape crania | Patch semi-landmarks | Direct projection | Comparable to manual landmarks | [5] |
| Great ape crania | Patch-TPS | Template-based transfer | Comparable or superior to manual landmarks | [5] |
| Great ape crania | Pseudo-landmarks | Automated sampling | Comparable to manual landmarks | [5] |
Technical Implementation and Robustness
Table 2: Methodological Characteristics of Semi-Landmark Approaches
| Method | Implementation Process | Correspondence Quality | Sensitivity to Noise | Computational Demand |
|---|---|---|---|---|
| Patch-based | Projects points from triangular patches defined by 3 landmarks | High (geometric relationship to manual landmarks) | High (vulnerable to surface artifacts) | Moderate |
| Patch-TPS | Transfers template semi-landmarks via Thin-Plate Spline transformation | High | Low (robust to noise and variability) | High |
| Pseudo-landmark | Automatically samples points with minimal landmark guidance | Variable (no guaranteed homology) | Low | Moderate |
| Sliding Semi-landmarks | Iteratively slides points to minimize bending energy or Procrustes distance | Improved after sliding | Moderate | High (iterative process) |
Experimental Protocols and Workflows
Patch-Based Semi-Landmarking
The patch method enables specimen-specific semi-landmark placement without a pre-defined template [5]. The workflow proceeds as follows:
Patch Definition: Select three previously digitized landmarks that define the triangular biological region of interest.
Grid Registration: Register a template triangular grid with user-specified point density to the landmark-bounded triangle using thin-plate spline deformation.
Surface Projection:
- Smooth surface normal vectors via Laplacian smoothing to minimize noise impact
- Calculate average surface normal from the three defining landmarks as projection vector
- Cast rays from grid points toward surface, selecting first intersection
- If no intersection found, reverse direction or select nearest mesh point
Grid Merging:
- Identify unique triangle edges in complex multi-patch configurations
- Place uniformly sampled lines between endpoints
- Project additional points to ensure continuous coverage
- Combine with manual landmarks into final configuration
Template-Based Semi-Landmark Transfer
Template approaches improve consistency across specimens by propagating semi-landmarks from a reference specimen [5]:
Template Selection: Choose specimen with greatest geometric similarity to sample members as reference.
Template Marking: Apply patch-based or other semi-landmark method to template specimen.
Landmark Transfer:
- Compute thin-plate spline transformation based on manual landmark correspondences between template and target
- Warp template semi-landmarks to target specimen using TPS transformation
- Project each warped semi-landmark to target surface along template normal vector
- Apply reversal procedure or nearest point selection for failed intersections
Optional Sliding: Iteratively slide semi-landmarks to minimize bending energy or Procrustes distance, replacing template with mean shape after first iteration.
Table 3: Key Software and Analytical Tools for Semi-Landmark Research
| Tool Name | Function | Application Context |
|---|---|---|
| 3D Slicer with SlicerMorph | 3D visualization and landmark collection | Medical image analysis, 3D morphometrics |
| Morpho R package | Sliding semi-landmarks, Procrustes analysis | Statistical shape analysis |
| Geomorph R package | GM analyses integration with comparative methods | Evolutionary biology, organismal shape |
| Viewbox 4 | Digitization template creation | Archaeological materials, osteology |
| auto3dgm | Landmark-free correspondence algorithm | Comparative morphology without landmarks |
| Artec Eva Scanner | High-resolution 3D surface scanning | Specimen digitization, mesh creation |
Discussion: Method Selection Guidelines
The comparative data indicates that semi-landmark methods generally achieve classification accuracy comparable to or exceeding traditional landmark and outline-based approaches [14] [15]. However, method selection involves important trade-offs between correspondence quality, robustness, and computational requirements.
For highly variable datasets or those with substantial missing data, template-based approaches (especially Patch-TPS) demonstrate superior robustness compared to direct patch projection [5]. The integration of TPS transformation with surface projection accommodates greater shape variation while maintaining correspondence.
In applications where computational efficiency is prioritized or template selection is challenging, direct patch-based semi-landmarking provides a viable alternative, though with increased vulnerability to surface noise and artifacts.
For outline analysis of two-dimensional structures, both semi-landmark and elliptical Fourier methods perform equivalently in discrimination tasks, suggesting methodological choice can be based on researcher familiarity and software access [14].
Critically, all semi-landmark approaches introduce some degree of geometric approximation, as their locations are algorithmically determined rather than biologically homologous [1]. Consequently, results from such analyses should be interpreted as approximations of biological reality, with appropriate acknowledgment of methodological uncertainty.
Future Directions
Emerging methodologies continue to refine the balance between shape information density and biological correspondence. Machine learning approaches show promise for automating landmark and semi-landmark placement while learning optimal representations from large datasets. Additionally, integration with biomedical applications such as nutritional assessment from arm shapes [16] and craniofacial studies [17] demonstrates the expanding translational potential of dense shape quantification.
As semi-landmark methodologies mature, standardization of protocols and validation across diverse biological structures will be essential for comparative morphological research. The development of open-access templates and workflows, such as those for human ossa coxae [18], represents a crucial step toward reproducible morphometric science.
Geometric morphometrics relies on the precise capture of form to analyze biological shape variation. While traditional anatomical landmarks provide sparse but biologically homologous points, semi-landmarking methods have become indispensable for quantifying shape across surfaces and curves lacking discrete landmarks. These methods, however, involve significant methodological choices. Researchers must navigate key trade-offs between point correspondence, sample coverage, repeatability, and computational cost. This guide objectively compares the performance of major semi-landmarking approaches, providing experimental data to inform method selection for shape discrimination research in evolutionary biology, biomedicine, and beyond.
Method Comparison at a Glance
The table below summarizes the core characteristics and trade-offs of three prominent semi-landmarking approaches: patch-based, patch-TPS, and pseudo-landmarking.
| Method | Correspondence Basis | Sample Coverage | Repeatability | Computational Cost | Best Suited For |
|---|---|---|---|---|---|
| Patch-Based [5] | Geometric relationship to manual landmarks defining triangular patches | Dependent on manual landmark placement; risk of gaps or uneven density | Sensitive to surface noise and missing data; can produce outliers | Lower for individual specimens | Studies with abundant, reliable manual landmarks and low-noise surfaces |
| Patch-TPS [5] | Transferred from template via Thin-Plate Spline (TPS) transform | Consistent, template-driven coverage across all specimens | High; more robust to noise and dataset variability | Moderate; requires TPS warp and projection for each specimen | Standardized analyses where a representative template is available |
| Pseudo-Landmarking [5] | Automatically sampled points with no biological homology; correspondence is algorithmic | Comprehensive and even, based on template spherical topology | High; robust performance with noise and variability | Higher initial setup; efficient projection to new specimens | High-density shape capture for complex surfaces without requiring manual landmarks between templates |
Experimental Performance Data
A comparative study implemented these three strategies to analyze cranial morphology in three species of great apes (Pan troglodytes, Gorilla gorilla, Pongo pygmaeus). The goal was to evaluate the shape information each method added when estimating a transform between an individual specimen and a population average template. The average mean root squared error (MRSE) between the transformed mesh and the template quantified performance [5] [19].
| Method | Average MRSE Performance | Sensitivity to Noise/Missing Data | Key Strength | Key Weakness |
|---|---|---|---|---|
| Patch-Based | Comparable to manual landmarks alone [5] | High; resulted in outliers with large deviations [5] | Does not require a prior template; geometric interpretation is preserved per specimen [5] | Coverage is dependent on the availability of manual landmarks [5] |
| Patch-TPS | Comparable or exceeded manual landmark accuracy [5] | Low; provides robust performance [5] | Improves robustness over the basic patch method [5] | Requires a representative template specimen [5] |
| Pseudo-Landmarking | Comparable or exceeded manual landmark accuracy [5] | Low; provides robust performance [5] | Excellent sample coverage and repeatability [5] | Points have no geometric relationship to original landmarks [5] |
Detailed Experimental Protocols
To ensure reproducibility and provide context for the performance data, this section details the key experimental methodologies from the cited studies.
Great Ape Cranial Morphology Study
This study serves as the primary source for the performance data in the previous section [5] [19].
- Imaging and Data: The analysis used DICOM stacks of great ape crania from the National Museum of Natural History collections, converted to 3D volumes. Manual landmarks were previously placed using 3D Slicer [5].
- Patch-Based Landmarking: For a defined triangular patch bounded by three manual landmarks, a template grid of points was generated. This grid was deformed to the patch using a Thin-Plate Spline (TPS) and projected onto the actual specimen surface. Projection involved casting a ray in the direction of the average surface normal of the three bounding landmarks. Adjacent patches were merged to prevent overlap [5].
- Patch-TPS Landmarking: A single template specimen was densely landmarked using the patch method. These semi-landmarks were then transferred to every other specimen in the dataset by first warping the specimen to the template using a TPS transformation defined by the manual landmarks. The template semi-landmarks were then projected onto the warped specimen's surface along the template's normal vectors [5].
- Pseudo-Landmarking: A template model was regularly sampled to generate a dense set of points, which were projected to the model's external surface assuming spherical topology. A spatial filter enforced a minimum distance between points. These pseudo-landmarks were transferred to target specimens via a TPS transform and projection [5].
- Evaluation Metric: The transformed mesh of an individual specimen was compared to the population average template, and the Mean Root Squared Error (MRSE) between them was calculated to quantify transform success [5].
Comparison of Semi-Landmarking Approaches
This study assessed the performance of three landmark-driven semilandmarking approaches on ape crania and human heads, analyzing how different methods influence results [1].
- Methodology: The study compared different algorithms for establishing dense point correspondences, including sliding semilandmarks (minimizing bending energy or Procrustes distance), and landmark-free algorithms like Iterative Closest Point (ICP). The consistency of statistical results from morphometric analyses based on these different point placements was evaluated [1].
- Findings: The different approaches produced semilandmarks at different locations, leading to discrepancies in statistical results. However, non-rigid semilandmarking approaches showed greater consistency with each other. Landmark-free algorithms, while powerful, could project points to different anatomical features on target specimens, especially when shape differences were large [1].
Outline Analysis in Feather Shape Discrimination
This study compared geometric morphometric methods for classifying specimens based on outlines, providing insights into semi-landmark alignment methods [14].
- Data: The research used rectrices (tail feathers) from Ovenbirds (Seiurus aurocapilla) of different age categories to compare outline methods [14].
- Semi-Landmark Alignment: Two semi-landmark alignment methods were tested: Perpendicular Projection (PP) and Bending Energy Minimization (BEM) [14].
- Performance: Both semi-landmark methods, along with Elliptical Fourier Analysis and the Extended Eigenshape method, produced roughly equal rates of correct classification in Canonical Variates Analysis (CVA). Classification success was not highly dependent on the number of points used to represent the curve [14].
Workflow and Relationship Diagram
The following diagram illustrates the logical workflow for selecting a semi-landmarking method, based on the key trade-offs identified in the experimental data.
The Scientist's Toolkit: Essential Research Reagents and Software
Successful implementation of semi-landmarking methods requires a suite of specialized software tools and packages.
| Tool/Software | Primary Function | Relevance to Semi-Landmarking |
|---|---|---|
| 3D Slicer / SlicerMorph [5] | Open-source platform for biomedical image visualization and analysis | Provides the environment in which the patch, patch-TPS, and pseudo-landmarking methods were implemented and tested [5]. |
| R Package: Morpho [5] | Geometric morphometrics analysis in R | Offers tools for statistical analysis of landmark data, including sliding semi-landmarks to minimize bending energy or Procrustes distance [5]. |
| R Package: geomorph [5] [19] | Geometric morphometric analysis of landmark shapes in R | Used for the collection and analysis of geometric morphometric shape data, supporting the evaluation of semi-landmark approaches [5] [19]. |
| auto3dgm [1] | Landmark-free algorithm for establishing point correspondences | An ICP-based package that automatically projects semilandmarks from a template to target specimens, without requiring manual landmarks [1]. |
The choice of a semi-landmarking method is a fundamental step in shape analysis that directly influences research outcomes. No single method is universally superior; each occupies a distinct point in the trade-off space between correspondence, coverage, repeatability, and cost. Patch-based methods offer direct geometric interpretation but are fragile with noisy data. Patch-TPS and pseudo-landmarking provide superior robustness and consistency at the cost of increased computational complexity and reduced direct biological homology for pseudo-landmarks. Researchers should align their choice with specific research goals, data quality, and the importance of biological homology versus dense, repeatable shape capture. As the field advances, results from these analyses should be viewed as powerful, yet cautious, approximations of biological reality.
A Practical Guide to Prevalent Semi-Landmarking Methodologies
In geometric morphometrics, the analysis of biological form often extends beyond the use of traditional landmarks to include outlines and surfaces. This is facilitated by sliding semi-landmarks, points that are slid along curves or surfaces to remove tangential variation and establish geometric, rather than strictly biological, homology across specimens [20] [21]. Two principal criteria govern this sliding process: minimizing bending energy (BE) and minimizing Procrustes distance (D). The choice between these criteria is not merely a technicality; it influences the estimation of shape variation and can alter the outcomes of statistical analyses, particularly when studying groups with low morphological disparity, such as modern human populations [20] [22]. This guide provides an objective comparison of these two methods, detailing their theoretical foundations, experimental performance, and practical implications for shape discrimination research.
Methodological Comparison: Core Principles and Assumptions
The two sliding methods operate on different philosophical and mathematical principles, which underlie their distinct behaviors in morphometric analyses.
| Feature | Minimizing Bending Energy (BE) | Minimizing Procrustes Distance (D) |
|---|---|---|
| Core Principle | Slides points to minimize the bending energy of the Thin-Plate Spline (TPS) deformation from a reference form [20] [1]. | Slides points to minimize the partial Procrustes distance between the specimen and a reference form [20] [1]. |
| Underlying Assumption | Assumes the observed contour is the result of the smoothest possible deformation of the reference contour [20]. | Assumes the best correspondence is achieved when specimen points lie along lines perpendicular to the reference curve [20]. |
| Philosophical Basis | A model-based approach that imposes a specific (smooth) deformation model [1]. | A phenomenological approach that seeks a direct geometric fit without a specific deformation model [1]. |
| Spatial Influence | Sliding is localized, as bending energy gives greater weight to landmarks and semilandmarks that are spatially close [1]. | Sliding is global, as all landmarks and semilandmarks influence the minimization of Procrustes distance, regardless of proximity [1]. |
Experimental Data and Performance Comparison
Empirical studies comparing these two methods reveal that while they sometimes yield similar results, key differences can emerge, particularly in the estimation of variation and the resulting morphospace.
A seminal study by Perez et al. (2006) compared BE and D methods using human molars and craniofacial data, employing bootstrapped Goodall's F-tests, Foote's measurement, Principal Component Analysis (PCA), and Discriminant Function Analysis [20] [22]. The table below summarizes the quantitative outcomes.
| Analysis Type | Findings for Bending Energy (BE) vs. Procrustes Distance (D) | Interpretation |
|---|---|---|
| Goodall's F-test | F-scores and P-values were similar for both criteria [20] [22]. | Both methods detect group mean shape differences with comparable statistical power in this context. |
| Foote's Measurement | BE and D yielded different estimates of within- and between-sample variation [20] [22]. | The methods disagree on the apportionment of morphological variance, which can impact evolutionary inferences. |
| Principal Component Analysis (PCA) | Low correlation between the first principal component axes obtained by D and BE [20] [22]. | The major axes of shape variation in the morphospace are method-dependent. |
| Discriminant Function Analysis | Percentage of correct classification was similar for BE and D, but the ordination of groups along discriminant scores differed between them [20] [22]. | While predictive accuracy may be comparable, the biological interpretation of group separation can vary. |
Practical Considerations in Implementation
Beyond the statistical outcomes, practical aspects of implementation are critical for researchers.
- Effect of Iterations: The process of sliding semi-landmarks is iterative. Research on 3D facial images shows that classification accuracy is affected by the number of iterations, but not in a simple, progressive manner. Stability and highest accuracy were achieved at 12 iterations, with a decline in performance thereafter [23]. This indicates that more iterations are not necessarily better, and an optimal, dataset-specific number should be determined.
- Template Dependency and Alternatives: Some methodologies use a template-dependent approach for collecting and aligning semi-landmarks. This method, which projects semi-landmarks onto a target specimen using perpendiculars from a template, has been shown to produce shape distortion comparable to or lower than BE and D methods, though it can result in a greater loss of degrees of freedom [24].
- Comparative Performance with Other Techniques: When compared to other morphometric techniques like Elliptic Fourier Analysis (EFA) and landmark-only analysis, semi-landmark methods (of which BE and D are a part) show superior performance for analyzing complex, ornamented structures where landmarks are sparse [25].
Essential Workflows and Research Toolkit
Generalized Workflow for Sliding Semi-Landmarks
The following diagram illustrates the standard workflow for processing sliding semi-landmarks, highlighting the key decision point between the BE and D criteria.
Successful implementation of sliding semi-landmark studies requires a suite of software tools and methodological choices. The table below details key "research reagents" for this field.
| Tool / Resource | Function / Purpose | Examples & Notes |
|---|---|---|
| Digitization Software | To manually locate anatomical landmarks and initial semi-landmarks on 2D images or 3D models. | tpsDig [20], MakeFan [20] |
| Sliding & Analysis Software | To perform the iterative sliding of semi-landmarks and subsequent statistical shape analysis. | Morpho [23], geomorph [23], EVAN Toolbox [23], Viewbox [23] |
| Template Mesh | A reference specimen with predefined landmarks and semi-landmarks, used to warp and transfer points to target specimens. | Crucial for surface semi-landmark analysis; often a specimen with average shape [21] [1]. |
| Sliding Criterion | The algorithmic rule (BE or D) that defines how semi-landmarks are adjusted to establish correspondence. | A core methodological choice that influences results [20] [1]. |
| Alignment Algorithm | Methods for non-rigidly registering a template to a target specimen to transfer semi-landmarks. | Thin-Plate Spline (TPS) [23], Iterative Closest Point (ICP) [1] |
The choice between minimizing bending energy and minimizing Procrustes distance for sliding semi-landmarks is consequential. While both methods can effectively discriminate between groups, they can lead to different interpretations of morphological variation and group ordination [20] [22]. Bending energy, with its localized and model-based smoothing, is well-suited for hypotheses involving smooth biological deformations. In contrast, Procrustes distance provides a direct geometric fit without a strong prior model of deformation.
Recommendations for Researchers:
- Justify Your Choice: The selection of a sliding criterion should be driven by the biological question and the assumptions one is willing to make about the nature of shape change.
- Conduct Sensitivity Analyses: Especially in studies of groups with low morphological variation (e.g., modern human populations), it is prudent to analyze data using both criteria to test the robustness of the findings [20].
- Optimize Iterations: Avoid arbitrarily high iteration counts. Experiment to find the optimal number that provides stable results for your specific dataset [23].
- Report Methodology in Detail: Always clearly state the software, sliding algorithm, number of iterations, and template used to ensure the reproducibility of your research.
The ongoing development of methods, including functional data analysis and landmark-free algorithms, promises to further refine our ability to capture and analyze complex biological shapes [1] [26]. However, the BE and D approaches for sliding semi-landmarks remain foundational tools, and understanding their nuances is critical for rigorous shape discrimination research.
In geometric morphometrics, the quantitative assessment of three-dimensional shape often relies on landmark points. However, manual landmarks provide a sparse representation of anatomy. Semi-landmarks, particularly those placed via patch-based sampling, address this limitation by enabling the dense sampling of surface regions, thereby capturing richer morphological information. This guide objectively compares three predominant semi-landmarking strategies—Patch, Patch-TPS, and Pseudo-landmark sampling—evaluating their performance based on robustness, computational efficiency, and accuracy in shape estimation for shape discrimination research.
Semi-landmarks are points that are placed on an object's surface to supplement the information provided by manually placed anatomical landmarks. They relax the strict requirement of biological homology to capture shape information from regions where traditional landmarks are scarce or difficult to identify, such as smooth surfaces or areas with large morphological differences [5]. The core challenge in semi-landmarking lies in managing the trade-offs between point correspondence across specimens, sample coverage, repeatability, and computational time [5].
Patch-based sampling is a specific approach to semi-landmarking that defines regions of interest on a 3D surface using triangles bounded by manual landmarks. A template grid of points is generated within each triangular patch and then projected onto the actual specimen surface. This method provides a direct geometric relationship between the semi-landmarks and the manual landmarks defining the patch [5]. This guide details the protocols for this method and compares it with other prominent sampling strategies, providing researchers in morphometrics and drug development with the data needed to select an appropriate method for their shape discrimination work.
Methodologies and Experimental Protocols
The following section details the experimental setup and specific protocols for the three semi-landmarking strategies compared in this guide. The foundational research for this comparison analyzed cranial morphology across three species of great apes (Pan troglodytes, Gorilla gorilla, and Pongo pygmaeus) using 3D surface meshes [5].
Patch-Based Semi-Landmarking (Patch)
The patch method operates on each specimen independently.
- Step 1: Patch Definition: A user selects three pre-digitized manual landmarks on a specimen's surface to define the vertices of a triangular patch [5].
- Step 2: Grid Generation: A template triangular grid, with a user-specified density of points, is registered to the bounding triangle using a thin-plate-spline (TPS) deformation [5].
- Step 3: Surface Projection: The grid points are projected onto the specimen's mesh surface.
- The mesh surface is smoothed using Laplacian smoothing to mitigate the impact of surface noise [5].
- The surface normal vectors at the three manual landmarks are averaged to define the projection direction for the entire patch [5].
- A ray is cast from each grid point in the direction of this averaged normal vector. The first intersection of the ray with the mesh surface is taken as the location of the semi-landmark [5].
- If no intersection is found, the ray direction is reversed. If still no intersection is found, the closest mesh point to the grid point is selected [5].
- Step 4: Merging Patches: After all patches are processed, their points are merged into a single landmark set. To prevent overlap and ensure coverage, the edges of adjacent triangles are uniformly sampled, and these points are also projected onto the surface [5].
Patch-Based Semi-Landmarks Applied through Thin-Plate Splines (Patch-TPS)
This method uses a single template specimen to define the semi-landmark set, which is then transferred to all other specimens.
- Step 1: Template Landmarking: A single template (a representative specimen or a synthetic model) is used to define triangular patches and generate semi-landmarks using the patch method described above [5].
- Step 2: Thin-Plate Spline Warping: For each target specimen, a TPS transformation is calculated based on the correspondence between the manual landmarks on the template and the target specimen. This transformation warps the entire template mesh, including its semi-landmarks, toward the target specimen's shape [5].
- Step 3: Surface Projection: Each warped semi-landmark point is projected onto the target specimen's surface.
- A ray is cast from the template semi-landmark point in the direction of the template's surface normal vector.
- The final intersection of this ray with the warped target specimen's mesh is selected as the semi-landmark location [5].
- The same fallback procedures (ray reversal, closest point selection) as the standard patch method are used if no intersection is found [5].
Pseudo-Landmark Sampling
Pseudo-landmarks are points placed automatically on a surface with no direct geometric relationship to manual landmarks.
- Step 1: Template Sampling: A dense set of points is regularly sampled on the surface of a template mesh. This is often achieved by assuming spherical topology and applying a spatial filter to enforce a minimum distance between points, removing coincident ones [5].
- Step 2: Transfer to Specimens: The pseudo-landmarks are transferred to each specimen in the dataset using the same TPS warping and surface projection protocol described in the Patch-TPS method [5].
The following diagram illustrates the core workflow for the Patch-TPS and Pseudo-landmark methods, which rely on a template specimen.
Performance Comparison and Experimental Data
To evaluate the performance of the three dense sampling strategies, researchers estimated the transform between an individual specimen and a population average template. The accuracy was quantified using the average mean root squared error between the transformed mesh and the template [5]. The following table summarizes the key findings.
Table 1: Performance Comparison of Semi-Landmarking Strategies
| Method | Shape Estimation Accuracy | Robustness to Noise & Missing Data | Correspondence | Sample Coverage | Computational Demand |
|---|---|---|---|---|---|
| Patch | Comparable to manual landmarks alone [5] | Low: Highly sensitive to noise and missing data, can produce outliers with large deviations [5] | High: Direct geometric relationship to manual landmarks [5] | Dependent on manual landmark placement [5] | Lower (processed per specimen) |
| Patch-TPS | High: Comparable or exceeding manual landmark accuracy; more robust than Patch [5] | High: More robust performance [5] | High: Maintains relationship via template [5] | Consistent, defined by template [5] | Medium (requires TPS warp) |
| Pseudo-Landmark | High: Comparable or exceeding manual landmark accuracy [5] | High: More robust performance [5] | Low: No direct relationship to manual landmarks [5] | Excellent, can cover entire surface uniformly [5] | Medium (requires TPS warp) |
The experimental data revealed that while all three methods could produce shape estimations comparable to using manual landmarks alone, they differed significantly in robustness. The standard Patch method demonstrated the highest sensitivity to noise and missing data, leading to outliers. Both Patch-TPS and Pseudo-landmark sampling provided more robust and reliable performance across the dataset [5].
The Researcher's Toolkit
The table below lists key resources and software used in the featured experiments and relevant for implementing these methods in related research.
Table 2: Essential Research Tools and Reagents
| Tool / Resource | Function / Description | Relevance in Featured Experiments |
|---|---|---|
| 3D Slicer | An open-source platform for medical image informatics, image processing, and three-dimensional visualization [5]. | Primary software environment used for data handling, visualization, and analysis [5]. |
| SlicerMorph | An extension for 3D Slicer designed for geometric morphometrics [5]. | Provided the specific modules and tools for placing manual landmarks and implementing the Patch, Patch-TPS, and Pseudo-landmark sampling protocols [5]. |
| R package: Morpho | An R package for geometric morphometrics, providing tools for shape analysis, including sliding semi-landmarks [5]. | Used for post-processing steps like Generalized Procrustes Analysis (GPA) and statistical shape analysis [5]. |
| R package: geomorph | An R package for the geometric analysis of morphological structures [5]. | Used for statistical evaluation of shape data and visualization of results [5]. |
| Great Ape Cranial Meshes | 3D surface models of crania from Pan troglodytes, Gorilla gorilla, and Pongo pygmaeus [5]. | The experimental dataset on which the semi-landmarking methods were tested and compared [5]. |
The selection of a semi-landmarking strategy is a critical step in 3D geometric morphometrics, directly impacting the quality and reliability of shape discrimination results. As the comparison demonstrates, the choice involves a direct trade-off:
- For studies where a direct, specimen-specific geometric interpretation of semi-landmarks is paramount and data quality is high, the Patch method is suitable.
- For larger, more variable datasets where robustness is a priority, Patch-TPS offers an excellent balance of correspondence and reliability.
- When the goal is maximum surface coverage and the biological homology of individual points is less critical than overall shape representation, Pseudo-landmark sampling is a powerful option.
Future research in shape discrimination, particularly in applied fields like drug development where distinguishing molecular shapes is critical [27], will continue to rely on robust 3D morphometric techniques. The trend is moving towards fully 3D topographical analyses, which can resolve interpretive challenges present in 2D data [28]. The integration of these geometric methods with machine learning, such as Functional Data Geometric Morphometrics (FDGM) [29] and computer vision [28], promises to further enhance the sensitivity and power of shape-based classification in scientific research.
Template-based approaches using Thin-Plate Splines (Patch-TPS) represent a significant methodological advancement in geometric morphometrics for transferring landmark configurations across biological specimens. This approach addresses the fundamental challenge of establishing correspondence between homologous points on complex anatomical structures, which is crucial for shape discrimination research. By combining the geometric precision of patch-based semi-landmark generation with the spatial transformation capabilities of TPS, the Patch-TPS method enables robust transfer of dense landmark sets from a template to individual specimens while maintaining biological correspondence. Experimental comparisons demonstrate that Patch-TPS provides substantial improvements in handling dataset variability and noise compared to direct patch-based methods, while offering greater biological interpretability than fully automated pseudo-landmark approaches. This guide provides a comprehensive comparison of Patch-TPS performance against alternative semi-landmark methods, detailed experimental protocols for implementation, and essential computational tools required for adoption in shape-based research.
Geometric morphometrics has revolutionized quantitative shape analysis in biological and medical research by enabling precise quantification of morphological variation. The core challenge in this field lies in establishing accurate correspondence between homologous points across biological structures, which is essential for meaningful statistical shape comparison. Semi-landmark methods were developed to address the limitations of traditional landmark-based approaches, which capture only sparse shape information due to the limited number of biologically homologous points available on most anatomical structures [5].
Semi-landmarks relax the strict requirement for biological homology by incorporating geometrically defined points that capture shape information between traditional landmarks. This allows researchers to access biologically relevant variability in regions with smooth surfaces, poorly defined tissue boundaries, or large morphological differences that traditional landmark analysis cannot adequately capture [5]. Template-based approaches, particularly the Patch-TPS method, have emerged as powerful tools for establishing correspondence across entire datasets by leveraging a common template configuration that is propagated to individual specimens through thin-plate spline transformations.
The evolution of semi-landmark methods reflects an ongoing trade-off between several critical factors: correspondence accuracy across specimens, sampling regularity, coverage completeness, methodological repeatability, and computational efficiency [5]. Understanding these trade-offs is essential for selecting appropriate methods for specific research applications in shape discrimination.
Patch-TPS Methodology: Core Principles and Workflow
Theoretical Foundations
The Patch-TPS method integrates two powerful conceptual frameworks: patch-based semi-landmark generation and thin-plate spline spatial transformations. The thin-plate spline (TPS) represents a fundamental mathematical tool for spatial interpolation, functioning as a versatile non-rigid transformation model that minimizes bending energy while precisely mapping corresponding points between configurations [30] [31]. In biological terms, this approach enables the modeling of complex morphological deformations that occur between individual specimens while maintaining the geometric relationships defined by the template.
The method operates on the principle that while many biological structures lack sufficient truly homologous points for comprehensive shape analysis, they contain regions of biological correspondence that can be captured through careful template design. By generating semi-landmarks on a single template specimen and transferring them consistently to all specimens in a dataset, Patch-TPS ensures that corresponding points are compared across the entire sample, thus enabling statistically powerful shape analyses [5].
Step-by-Step Implementation Protocol
Template Selection and Preparation: Choose a representative specimen as a template. This should exhibit average morphology for the dataset with minimal artifacts or damage. Manually place traditional landmarks on the template following standard protocols for the anatomical structure of interest.
Patch-Based Semi-Landmark Generation on Template: Define triangular regions bounded by three manual landmarks on the template specimen. For each patch, create a template triangular grid with a user-specified density of semi-landmark points. Register this grid to the vertices of the bounding triangle using a thin-plate spline deformation [5].
Projection to Template Surface: Project the vertices of the triangular sampling grid to the template surface using ray casting in the direction of the averaged surface normal vectors at the manual landmark points defining each patch. Apply Laplacian smoothing to the surface normal vectors to reduce the impact of mesh noise [5].
Thin-Plate Spline Transformation Calculation: For each specimen in the dataset, compute the TPS transformation that warps the specimen to the template space based on the correspondence between manual landmarks on both specimens.
Landmark Transfer via TPS and Projection: Transfer the semi-landmarks from the template to each specimen using the calculated TPS transformation. For each transferred semi-landmark point, cast a ray in the direction of the template's normal vector and select the final intersection with the warped specimen mesh as the corresponding point [5].
Handling of Non-Intersection Cases: Implement fallback procedures for cases where no intersection is found, including ray direction reversal and selection of the closest mesh point [5].
Optional Sliding Optimization: Apply sliding algorithms to minimize bending energy or Procrustes distance, reducing potential artifacts introduced by the initial point placement [5].
The following diagram illustrates the core workflow of the Patch-TPS method:
Comparative Performance Analysis
Experimental Framework and Evaluation Metrics
To objectively evaluate the performance of Patch-TPS against alternative semi-landmark approaches, we established a standardized experimental framework using cranial data from three species of great apes: Pan troglodytes (N=11), Gorilla gorilla (N=22), and Pongo pygmaeus (N=18) [5]. The evaluation metric focused on the accuracy of shape estimation, quantified as the average mean root squared error (MRSE) between the transformed mesh and the population average template after applying the transform calculated from each landmark set.
Three dense sampling strategies were compared: (1) Patch-based semi-landmarking - generating semi-landmarks independently on each specimen using triangular patches defined by manual landmarks; (2) Patch-TPS - generating semi-landmarks on a single template and transferring to specimens via TPS; and (3) Pseudo-landmark sampling - generating regularly sampled points on a template with no geometric relationship to manual landmarks, then transferring via TPS [5].
Table 1: Comparative Performance of Semi-Landmark Methods in Shape Estimation
| Method | Shape Estimation Accuracy (MRSE) | Noise Sensitivity | Missing Data Robustness | Computational Efficiency | Biological Interpretability |
|---|---|---|---|---|---|
| Manual Landmarks Alone | Baseline Reference | Low | High | High | High |
| Patch-Based | Comparable to manual landmarks | High | Low | Medium | Medium |
| Patch-TPS | Comparable or superior to manual landmarks | Medium | Medium | Medium-High | Medium-High |
| Pseudo-Landmark | Comparable to manual landmarks | Low | High | Medium | Low |
Performance Across Methodological Challenges
The comparative analysis revealed distinct performance profiles for each method across key methodological challenges in shape analysis. The standard patch-based approach demonstrated high sensitivity to noise and missing data, resulting in outliers with substantial deviations in mean shape estimates [5]. This method's performance is highly dependent on underlying surface geometry and can be compromised by sharp curves or edges in sampled regions, potentially leading to placement errors such as interior surface sampling.
In contrast, the Patch-TPS approach showed markedly improved robustness to noise and dataset variability while maintaining the geometric relationship between semi-landmarks and manual landmarks [5]. The template-based nature of this method ensures consistent point correspondence across specimens, though it introduces dependency on template selection quality. The pseudo-landmark method provided the highest robustness to noise and missing data but completely sacrifices the geometric interpretability of semi-landmarks in relation to manual landmarks, potentially limiting biological insights [5].
Table 2: Application-Based Method Selection Guidelines
| Research Context | Recommended Method | Rationale | Implementation Considerations |
|---|---|---|---|
| High-Quality Data with Minimal Artifacts | Patch-Based | Maximizes geometric relationship preservation | Requires sufficient manual landmarks for adequate coverage |
| Variable Quality Data with Moderate Noise | Patch-TPS | Optimal balance of correspondence and robustness | Dependent on template selection; requires validation |
| Large-Scale Population Studies | Patch-TPS | Ensures correspondence across large datasets | Template selection critical; computational cost scales well |
| Exploratory Shape Analysis | Pseudo-Landmark | Maximum coverage with minimal manual annotation | Limited biological interpretability of individual points |
| Developmental or Evolutionary Trajectories | Patch-TPS | Maintains biological correspondence across forms | Enables direct comparison of specific morphological regions |
Advanced Research Applications
Cross-Disciplinary Methodological Validation
The efficacy of template-based landmark transfer approaches extends across multiple biological domains, demonstrating their versatility for shape discrimination research. In taxonomic discrimination of Early Pleistocene hominin mandibular molars, methods ensuring correspondence across specimens significantly outperformed traditional landmark-based approaches in classification accuracy [32]. Similarly, in population-level studies of marine species, geometric morphometric approaches utilizing semi-landmarks have demonstrated sensitivity in detecting subtle morphological differences indicative of environmental influences [33].
These cross-disciplinary validations highlight a crucial methodological insight: the correspondence of points across specimens, ensured by template-based methods like Patch-TPS, frequently contributes more to discriminatory power than simply increasing the number of landmarks. Recent research has demonstrated that small subsets of landmarks with high discriminatory power can outperform full landmark sets when correspondence is carefully maintained [34].
Integration with Advanced Shape Analysis Frameworks
The Patch-TPS methodology serves as a foundational element that integrates seamlessly with more advanced shape analysis frameworks. Diffeomorphic Surface Matching (DSM) approaches, which model deformation between continuous surfaces rather than discrete points, can leverage Patch-TPS as an initialization step to establish initial correspondence [32]. Similarly, statistical shape analysis pipelines incorporating principal component analysis, canonical variates analysis, or partial least squares regression benefit from the consistent correspondence provided by Patch-TPS, particularly when analyzing shape changes across developmental trajectories or between populations [14].
The template-based nature of Patch-TPS also facilitates comparison with emerging landmark-free methods, providing a crucial bridge between traditional landmark-based morphometrics and fully automated surface matching approaches. This integration capability positions Patch-TPS as a versatile tool within increasingly sophisticated shape analysis workflows.
Essential Research Toolkit
Implementation of Patch-TPS methodology requires specialized software tools capable of landmark management, thin-plate spline calculation, and surface processing. The following table summarizes essential resources for researchers implementing this approach:
Table 3: Essential Software Tools for Patch-TPS Implementation
| Tool Name | Primary Function | Key Features | Access |
|---|---|---|---|
| 3D Slicer with SlicerMorph | Core Platform | Open-source visualization and analysis; implements Patch-TPS protocol; supports landmarking on 3D surface models [5] | https://github.com/SlicerMorph/SlicerMorph |
| TPS Series Software | Shape Analysis | Specialized utilities for TPS computation, relative warp analysis, and regression of shape data [31] | https://sbmorphometrics.org/soft-tps.html |
| Morpho R Package | Statistical Analysis | Semi-landmark sliding tools; Procrustes analysis; integration with statistical workflows [5] | CRAN Repository |
| StereoMorph | Data Digitization | Conversion between landmark file formats; digitization support for 3D data [35] | https://rdrr.io/cran/StereoMorph/man/TPSToShapes.html |
Methodological Optimization Guidelines
Successful implementation of Patch-TPS requires careful attention to several methodological considerations. Template selection should prioritize specimens with average morphology and minimal artifacts, as template quality directly impacts downstream analyses. Manual landmark placement must be performed with particular care, as these points define both the TPS transformation and the patch boundaries for semi-landmark generation.
The density of semi-landmarks within patches represents a critical trade-off between shape capture completeness and computational burden. Studies comparing outline methods have demonstrated that classification rates are not highly dependent on the number of points used to represent a curve, suggesting that moderate densities may be sufficient for many applications [14]. Additionally, researchers should implement validation procedures to assess landmark transfer accuracy, particularly when analyzing highly variable datasets or structures with complex topography.
Template-based approaches using Thin-Plate Splines for landmark transfer represent a robust and versatile methodology for geometric morphometrics, striking an effective balance between biological interpretability, computational efficiency, and robustness to dataset variability. The Patch-TPS method specifically addresses fundamental challenges in shape correspondence establishment while integrating seamlessly with advanced statistical analysis frameworks.
The comparative data presented in this guide demonstrates that Patch-TPS consistently outperforms direct patch-based methods in handling noise and morphological variability, while maintaining the geometric interpretability that pseudo-landmark approaches sacrifice. This performance profile, combined with the method's compatibility with established morphometric software tools, positions Patch-TPS as a methodology of choice for researchers conducting shape discrimination studies across biological, medical, and anthropological domains.
As geometric morphometrics continues to evolve toward increasingly automated surface analysis methods, template-based landmarking approaches provide a crucial bridge between traditional landmark-based analyses and fully automated shape matching, ensuring biological relevance while leveraging computational advances. The continued refinement of these methods promises enhanced capabilities for quantifying and interpreting morphological variation across diverse research applications.
Point cloud registration is a fundamental problem in computer vision and geometric morphometrics, with critical applications in areas ranging from medical imaging and robotics to biological shape analysis [36] [37]. The core challenge involves finding the optimal spatial transformation that aligns two sets of 3D points—a source point cloud with a target point cloud—within a common coordinate system [38]. While numerous approaches exist, landmark-free algorithms that operate without pre-defined homologous points are particularly valuable for analyzing biological structures lacking clearly identifiable landmarks [39] [40].
This guide provides a comprehensive comparison of three pivotal landmark-free registration algorithms: the classical Iterative Closest Point (ICP), its non-rigid extension (NICP), and the probabilistic Coherent Point Drift (CPD). We examine their underlying principles, performance characteristics, and experimental protocols to assist researchers in selecting appropriate methods for shape discrimination research.
Algorithmic Fundamentals
Iterative Closest Point (ICP)
ICP is a widely-used classical algorithm for rigid point cloud registration that iteratively refines alignment by alternating between correspondence estimation and transformation calculation [38]. The standard ICP pipeline comprises:
- Initialization: Starting with an initial guess of the transformation that roughly aligns the source cloud to the target cloud.
- Correspondence Search: For each point in the transformed source cloud, finding the closest point in the target cloud using Euclidean distance, typically accelerated with k-d trees.
- Transformation Estimation: Computing the optimal rigid transformation (rotation and translation) that minimizes the sum of squared errors between corresponding points using Singular Value Decomposition (SVD).
- Iteration: Applying the transformation and repeating steps 2-3 until convergence criteria are met [38].
ICP's simplicity and efficiency make it popular, but it has notable limitations: sensitivity to initial alignment (often converging to local minima), vulnerability to outliers and partial overlaps, and restriction to rigid transformations only [36].
Non-Rigid ICP (NICP)
NICP extends the classical ICP framework to handle non-rigid deformations, making it suitable for registering biological structures that undergo shape changes [41]. Instead of estimating a single global transformation, NICP optimizes an energy function that includes local regularization and stiffness constraints, often assigning an affine transformation to each vertex [40]. Recent advances have incorporated neural fields into the NICP framework. For instance, Neural ICP (NICP) queries a neural field on target shape vertices and pairs them with template vertices corresponding to predicted offsets with minimum norm, fine-tuning the neural field through backpropagation in a self-supervised manner [42]. This approach enables robust registration across varied poses, identities, and noise conditions.
Coherent Point Drift (CPD)
CPD represents a paradigm shift from correspondence-based methods to a probabilistic approach. CPD formulates point cloud alignment as a probability density estimation problem where one point set represents Gaussian Mixture Model (GMM) centroids and the other represents data points [36]. Registration occurs by moving the GMM centroids coherently to maximize the likelihood of the data points, effectively "dragging" the GMM centroids to fit the data points while preserving the topological structure of the point set [36]. This probabilistic framework makes CPD inherently more robust to noise, outliers, and missing points compared to ICP [36].
The following diagram illustrates the conceptual relationships and evolutionary progression between these three algorithms:
Comparative Performance Analysis
Algorithm Characteristics and Applications
Table 1: Fundamental Characteristics of Landmark-Free Registration Algorithms
| Characteristic | ICP | NICP | CPD |
|---|---|---|---|
| Transformation Type | Rigid | Non-rigid | Rigid & Non-rigid |
| Correspondence Approach | Hard (binary) assignments | Hard assignments with local regularization | Soft (probabilistic) assignments |
| Theoretical Basis | Least-squares optimization | Regularized energy minimization | Maximum likelihood (GMM) |
| Optimal Use Cases | Clean, rigid objects with good initialization | Biological structures with shape variation | Noisy data, outliers, partial overlaps |
| Biological Applicability | Limited for non-rigid structures | High for anatomical structures | High for diverse biological specimens |
Experimental Performance Metrics
Recent evaluations on real-world scans, including biological specimens, provide quantitative insights into algorithm performance:
Table 2: Experimental Performance Comparison Across Registration Methods
| Performance Metric | ICP | GO-ICP | NICP | CPD | RANSAC | FGR |
|---|---|---|---|---|---|---|
| Registration Accuracy | Moderate | High [37] | High [42] | High [36] | High (with ICP refinement) [37] | Variable [37] |
| Robustness to Noise | Low [36] | High [37] | High [42] | High [36] | High [37] | Moderate [37] |
| Robustness to Partiality | Low [36] | High [37] | Moderate [41] | High [36] | High [37] | Moderate [37] |
| Computation Time | Fast | Slow (several seconds) [37] | Moderate (seconds) [42] | Moderate | Fast [37] | Fast [37] |
| Implementation Complexity | Low | Moderate | High | Moderate | Moderate | Moderate |
Experimental Protocols and Methodologies
Standard ICP Workflow
The following diagram illustrates the iterative ICP process:
A typical ICP experiment follows this protocol:
- Data Preparation: Acquire source and target point clouds through 3D scanning (e.g., LiDAR, stereovision) or sampling from CAD models [37]. For biological specimens, micro-CT or optical coherence tomography (OCT) may be used [41].
- Preprocessing: Apply filtering to reduce noise, downsample to manage computational complexity, and roughly align point clouds using principal component analysis (PCA) or manual placement [38].
- Parameter Initialization: Set convergence thresholds (e.g., relative change in error < 0.001), maximum iterations (e.g., 50-100), and distance thresholds for outlier rejection [38].
- Execution: Implement the iterative process of correspondence search and transformation estimation using k-d trees for efficient nearest-neighbor search [38].
- Validation: Quantify registration error using metrics like mean squared error (MSE), Hausdorff distance, or ground-truth comparison when available [37].
NICP for Biological Specimens
NICP experiments for biological shapes require specialized protocols:
- Template Selection: Choose a template specimen with greatest overall geometric similarity to the sample members [39].
- Non-Rigid Initialization: Employ Thin-Plate Splines (TPS) for initial non-rigid registration of template to target specimens [40].
- Local Regularization: Apply NICP to further warp the deformed template surface to each specimen using cost functions with stiffness constraints [40].
- Correspondence Transfer: Transfer semilandmarks from the template to the nearest point on the target specimen surfaces [40].
In neural NICP approaches, the process involves training a localized neural field on large motion capture datasets (e.g., AMASS), then applying Neural ICP for fine-tuning through backpropagation at inference time [42].
CPD Implementation
The CPD experimental framework involves:
- GMM Parameterization: Model the source point set as GMM centroids with a noise tolerance parameter to account for outliers and missing points [36].
- Expectation-Maximization: Implement the iterative process of (E-step) estimating posterior probabilities and (M-step) updating transformation parameters [36].
- Coherence Constraints: Apply motion coherence constraints to ensure points close together move similarly [36].
- Convergence Monitoring: Track the likelihood function to determine algorithm convergence [36].
The Scientist's Toolkit
Essential Research Reagents and Computational Solutions
Table 3: Essential Tools for Landmark-Free Point Cloud Registration Research
| Tool/Resource | Function/Purpose | Implementation Examples |
|---|---|---|
| Open3D Library | Open-source library for 3D data processing | Provides implementations of ICP, RANSAC, and FGR registration methods [37] |
| k-d Tree Structures | Accelerated nearest-neighbor search for correspondence matching | Critical for efficient ICP implementation; reduces computational complexity [38] |
| Fast Point Feature Histograms (FPFH) | Local feature descriptors for improved correspondence matching | Used in RANSAC and FGR for feature extraction and robust registration [37] |
| Thin-Plate Splines (TPS) | Non-rigid initial registration | Used in TPS&NICP approach for initial template-to-target alignment [40] |
| Neural Field Architectures | Learning deformation priors for improved registration | Used in Neural ICP (NICP) for handling diverse shapes and noise conditions [42] |
The comparative analysis of ICP, NICP, and CPD reveals a trade-space between algorithmic simplicity, computational efficiency, and registration robustness. ICP remains valuable for rigid alignments with good initialization, while NICP excels where non-rigid deformations occur in biological specimens. CPD offers superior performance with noisy data and outliers but at higher computational cost. The emerging integration of neural fields with traditional registration frameworks, as demonstrated in Neural ICP, points toward increasingly robust and generalizable solutions for landmark-free shape analysis in scientific research.
Statistical Shape Modeling (SSM) provides a quantitative framework for analyzing anatomical variations across populations, with applications spanning disease diagnosis, implant design, and evolutionary biology [43]. A fundamental challenge in SSM is the correspondence problem—establishing anatomically consistent points across a set of shapes for meaningful statistical comparison [1]. Correspondence methods generally fall into two categories: pairwise approaches, which map individual shapes to a predefined template, and groupwise approaches, which optimize correspondences by considering the entire shape ensemble simultaneously [43] [44].
ShapeWorks implements a groupwise, particle-based modeling (PBM) approach that optimizes landmark placements without relying on a fixed parameterization [45] [46]. This guide objectively compares ShapeWorks against other widely used SSM tools—Deformetrica and SPHARM-PDM—by synthesizing data from controlled experiments and clinical validation studies. Understanding the performance characteristics of these tools is crucial for researchers selecting appropriate methods for morphometric analyses in fields such as drug development and biomedical research.
ShapeWorks: Particle-Based Optimization
ShapeWorks employs a groupwise entropy optimization scheme where corresponding points, called particles, are optimized across an entire shape ensemble [45] [46]. The algorithm uses a set of interacting particle systems that place landmarks through a trade-off between model compactness (statistical simplicity) and accurate surface representation [45]. This approach requires minimal preprocessing and learns a population-specific metric that respects natural anatomical variability without penalizing it [43] [44].
Alternative SSM Approaches
- Deformetrica: A groupwise method that estimates shape correspondences using diffeomorphic registration, modeling the deformation of a template shape to each subject in the population [43] [44].
- SPHARM-PDM: A pairwise approach that maps each shape instance to a common spherical parameterization, establishing correspondences through a predefined template [43] [44]. This method relies on spherical harmonic coefficients for surface description and correspondence placement.
Table 1: Key Characteristics of Statistical Shape Modeling Tools
| Tool | Correspondence Approach | Core Methodology | Template Dependency |
|---|---|---|---|
| ShapeWorks | Groupwise | Particle-based entropy optimization | No (population-learned) |
| Deformetrica | Groupwise | Diffeomorphic registration | Yes (atlas-based) |
| SPHARM-PDM | Pairwise | Spherical harmonic parameterization | Yes (fixed template) |
Experimental Protocols for SSM Evaluation
Quantitative Evaluation Metrics
Standardized quantitative metrics enable objective comparison of SSM tools [47]:
- Compactness: Measures how effectively a shape model describes population variability with fewer parameters. Calculated as the cumulative variance explained by successive principal components [47].
- Generalization: Assesses a model's ability to represent unseen shape instances. Typically evaluated via leave-one-out cross-validation, where the model is built on all but one sample and then reconstructs the excluded sample [47].
- Specificity: Evaluates whether randomly generated shape instances from the model are plausible members of the original population, calculated as the average distance between random samples and the nearest training sample [47].
Clinical Validation Frameworks
Beyond intrinsic metrics, SSM tools require validation in clinically relevant scenarios [43] [44]:
- Anatomical Measurement Inference: Validates how well computationally derived correspondences can predict clinically established anatomical measurements (e.g., femoral antetorsion or scapular inclination) compared to ground-truth manual annotations [43].
- Lesion Screening: Tests the capability to identify pathological shape deviations by building a model from control subjects and detecting abnormal variations in pathological cases not included in model construction [43] [44].
Comparative Performance Analysis
Quantitative Benchmarking Results
Comprehensive benchmarking across multiple anatomical structures reveals consistent performance patterns [43] [44]:
Table 2: Performance Comparison Across Anatomical Structures [43] [44]
| Anatomy | Tool | Generalization Error (mm) | Compactness (variance) | Specificity (mm) |
|---|---|---|---|---|
| Left Atrial Appendage | ShapeWorks | 0.87 ± 0.02 | Highest | 0.94 ± 0.01 |
| Deformetrica | 0.90 ± 0.02 | Intermediate | 0.97 ± 0.01 | |
| SPHARM-PDM | 1.27 ± 0.03 | Lowest | 1.25 ± 0.02 | |
| Scapula | ShapeWorks | 0.74 ± 0.02 | Highest | 0.84 ± 0.01 |
| Deformetrica | 0.76 ± 0.02 | Intermediate | 0.86 ± 0.01 | |
| SPHARM-PDM | 1.05 ± 0.03 | Lowest | 1.09 ± 0.02 | |
| Femur | ShapeWorks | 0.81 ± 0.02 | Highest | 0.89 ± 0.01 |
| Deformetrica | 0.84 ± 0.02 | Intermediate | 0.92 ± 0.01 | |
| SPHARM-PDM | 1.18 ± 0.03 | Lowest | 1.21 ± 0.02 |
Qualitative Assessment of Correspondence Quality
Visual inspection of correspondence placement reveals fundamental methodological differences:
- ShapeWorks and Deformetrica: Both groupwise methods place correspondences that consistently adhere to anatomical features across population variability. For example, on scapular anatomy, both tools maintain consistent point placement along the scapular spine and borders despite shape variations [43].
- SPHARM-PDM: The pairwise approach demonstrates less biological plausibility in correspondence placement, with points drifting along surfaces and failing to maintain consistent anatomical positions across significant shape variations [43].
Workflow and Logical Relationships in SSM
The following diagram illustrates the conceptual workflow and logical relationships between different SSM approaches, highlighting key decision points and methodological differences:
SSM Methodology Selection Workflow
The Researcher's Toolkit for Shape Analysis
Table 3: Essential Computational Tools for Statistical Shape Modeling
| Tool/Resource | Primary Function | Application Context |
|---|---|---|
| ShapeWorks | Groupwise correspondence optimization | General-purpose SSM for complex anatomies |
| Deformetrica | Diffeomorphic shape registration | Atlas-based population analysis |
| SPHARM-PDM | Spherical harmonic parameterization | Template-based modeling of spherical topologies |
| 3D Slicer/SlicerMorph | 3D visualization and landmarking | Data preprocessing and visualization |
| MorphoJ | Statistical analysis of shape variants | Shape statistics and visualization |
| R (shapes package) | Statistical shape analysis | Multivariate shape statistics |
Discussion and Research Implications
Performance Synthesis and Tool Selection
Synthesizing results across multiple studies indicates that groupwise methods (ShapeWorks and Deformetrica) consistently outperform pairwise approaches (SPHARM-PDM) in both quantitative metrics and qualitative correspondence quality [43] [44]. This performance advantage stems from their fundamental ability to learn population-specific metrics that capture natural anatomical variability without imposing a rigid template-based correspondence map.
For research applications requiring detailed characterization of population variability or detection of subtle pathological shape changes, ShapeWorks' particle-based approach provides superior performance. However, for studies with strong prior anatomical assumptions embodied in a well-defined template, Deformetrica may offer a viable alternative [43].
Limitations and Methodological Considerations
All semilandmark and automated correspondence methods present trade-offs between correspondence accuracy, point spacing regularity, computational efficiency, and repeatability [1] [5]. Even optimized correspondences should be interpreted as approximations of biological reality, as algorithmically determined point locations cannot guarantee developmental or evolutionary homology [1].
Future methodological development should focus on improving computational efficiency for large-scale population studies and enhancing integration with deep learning approaches for end-to-end shape analysis from medical images [43] [44]. As no single evaluation metric captures all aspects of model quality, researchers should employ multiple validation strategies appropriate to their specific application context [43] [47].
In shape discrimination research, quantifying the morphology of two-dimensional (2D) contours is a fundamental challenge. Among the various geometric morphometric approaches, outline-based methods allow for the analysis of shapes that lack discrete, homologous landmarks. This guide provides an objective comparison of two principal outline-based techniques: Elliptical Fourier Analysis (EFA) and the Eigenshape method. We frame this comparison within a broader examination of semi-landmark methods, detailing their operational protocols, presenting supporting experimental data, and discussing their applicability in scientific research, including drug development and cellular studies.
Theoretical Foundations and Methodologies
Outline-based methods capture shape information from a curve or closed contour by treating the entire outline as a single, continuous entity. This contrasts with landmark-based methods that rely on discrete, homologous points.
Elliptical Fourier Analysis (EFA) decomposes a closed contour into a sum of harmonically related ellipses. The analysis is performed separately on the x- and y-coordinates of the outline as functions of a cumulative chordal distance around the contour [48] [49]. Each harmonic, denoted by the index n, is described by four coefficients (a_n, b_n, c_n, d_n), which define the ellipse for that harmonic [48] [50]. The first harmonic approximates the best-fitting ellipse to the outline and effectively normalizes for size. Higher harmonics capture increasingly fine details of the shape, from broad contours to subtle textures [51] [49]. A key advantage of EFA is that it does not require equally spaced points or the prior definition of a centroid, making it highly flexible [48].
Eigenshape Analysis operates by first measuring the angular deviation of the outline from a baseline at a large number of equally spaced points [52]. This function, known as the φ(s) function, represents the shape. A Principal Component Analysis (PCA) is then performed on the matrix of these φ(s) functions from all specimens in a dataset. The resulting eigenvectors are termed "eigenshapes," which represent the major, independent modes of shape variation within the sample. Specimen shapes are expressed as scores (or projections) along these eigenshape axes.
The following diagram illustrates the typical workflow for applying these two methods to a set of biological contours, from image acquisition to statistical analysis.
Comparative Analysis: EFA vs. Eigenshape
The choice between EFA and Eigenshape analysis involves trade-offs between mathematical properties, analytical goals, and practical implementation.
Table 1: Methodological Comparison of EFA and Eigenshape
| Feature | Elliptical Fourier Analysis (EFA) | Eigenshape Analysis |
|---|---|---|
| Mathematical Basis | Decomposition into elliptical harmonics [49] | PCA of outline tangent angles [52] |
| Shape Variables | Normalized Fourier coefficients [51] | Scores on eigenshape axes [52] |
| Invariance | Can be normalized for size, rotation, and starting point [51] [48] | Invariance must be handled during the φ(s) calculation [52] |
| Shape Reconstruction | Directly possible from inverse Fourier transform [51] | Possible by combining mean shape and eigenshapes |
| Primary Advantage | Intuitive multi-level shape description; direct reconstruction [51] | Directly extracts major, data-driven axes of variation |
A critical experimental comparison of these methods was conducted on feather outlines from Ovenbirds (Seiurus aurocapilla) to classify individuals by age [52]. The study evaluated the classification performance of EFA and Eigenshape alongside semi-landmark methods.
Table 2: Experimental Performance in Classifying Bird Feathers by Age [52]
| Method | Classification Performance |
|---|---|
| Elliptical Fourier Analysis (EFA) | Roughly equal classification rates to Eigenshape analysis. |
| Eigenshape Analysis | Roughly equal classification rates to EFA. |
| Semi-landmark Methods (BEM & PP) | Produced classification rates roughly equal to EFA and Eigenshape. |
Key Finding: The study concluded that the rate of correct classification was not highly dependent on the choice of outline method, suggesting that EFA, Eigenshape, and semi-landmark methods can perform similarly for shape discrimination tasks on biological outlines [52].
Experimental Protocols and Applications
Key Experimental Protocol: Shape-Based Taxonomic Classification
A common application of these methods is classifying specimens into taxonomic or diagnostic groups.
- Sample Preparation & Imaging: Specimens are prepared and imaged under consistent conditions. For biological cells, this may involve staining [50]; for plants, imaging seeds or leaves against a contrasting background [53].
- Outline Digitization: Closed contours are extracted from images. Software tools like SHAPE [53], DiaOutline [48], or Momocs [48] are often used for this step.
- Data Analysis:
- For EFA, outlines are processed to obtain normalized Fourier coefficients. These coefficients are used as input for a Linear Discriminant Analysis (LDA) to build a classifier [48] [53].
- For Eigenshape, φ(s) functions are computed and PCA is performed. The resulting eigenshape scores are then used in the LDA.
- Validation: The classifier's performance is tested using cross-validation, where a subset of specimens is left out of the model-building process and then classified to estimate a realistic success rate [52] [16].
Application in Drug Development and Cell Biology
While direct applications in drug development from the provided results are limited, the principles are well-established in cell biology, a critical field for preclinical research.
- Cellular Morphology: EFA has been used to characterize the shapes of cells and their nuclei, providing an exhaustive definition of nucleoplasmic configuration [50]. Changes in nuclear shape are often indicators of cell state or disease (e.g., cancer), and EFA offers a quantitative way to monitor these changes in response to compounds.
- Cranial Morphology in Forensic Anthropology: EFA is applied to complex skeletal features like the greater sciatic notch of the pelvis for sex estimation, demonstrating its utility in analyzing subtle morphological differences relevant to human health and identification [54].
The Scientist's Toolkit: Essential Research Reagents & Software
Success in outline-based morphometrics relies on a suite of computational tools and reagents.
Table 3: Essential Materials for Outline-Based Shape Analysis
| Item | Function | Example Tools/Notes |
|---|---|---|
| High-Contrast Imaging Setup | To acquire clear, consistent images of specimens for accurate outline extraction. | VideometerLab [53]; standard microscopes with cameras [50]. |
| Image Pre-processing Software | To clean images, enhance contrast, and segment the object of interest from the background. | ImageJ, Fiji [48]. |
| Outline Digitization Software | To extract the (x,y) coordinates of the contour. | DiaOutline [48], SHAPE [53], PAST. |
| Geometric Morphometrics Package | To perform EFA, Eigenshape, and statistical analyses (PCA, LDA). | SHAPE [53], Momocs [48], R packages (e.g., Morpho, geomorph). |
| Statistical Software | To conduct advanced multivariate statistics and validation. | R, PAST, NTSYSpc [53]. |
Both Elliptical Fourier Analysis and Eigenshape analysis are powerful, objective methods for quantifying 2D contours. Experimental evidence suggests they can achieve comparable performance in shape discrimination tasks [52]. The choice between them often comes down to researcher preference and the specific analytical goal: EFA provides an intuitive, hierarchical description of shape and allows for direct reconstruction, while Eigenshape directly identifies the primary sources of variation within a specific dataset. Within the broader context of semi-landmark methods, these outline-based approaches are indispensable when studying structures that lack well-defined homologous landmarks, offering robust solutions for shape comparison in fields from botany and anthropology to cell biology and drug discovery.
Navigating Pitfalls and Optimizing Semi-Landmarking Protocols
The Impact of Sample Size on Mean Shape and Shape Variance Estimates
In shape discrimination research, geometric morphometrics (GM) has become an indispensable methodology for quantifying and analyzing biological form in a statistically rigorous framework. This approach relies heavily on landmark-based data to characterize morphological evolution, distinguish closely related taxa, and analyze macroevolutionary trends. The reliability of these analyses, however, is profoundly influenced by methodological decisions made during study design, particularly regarding sample size and the choice of semi-landmark methods. As research increasingly focuses on subtle shape differences within and between species, understanding how these factors impact estimates of mean shape and shape variance becomes critical for drawing accurate biological conclusions. This review synthesizes current evidence on how sample size affects shape characterization and how these effects interact with different semi-landmark approaches, providing researchers with evidence-based guidance for robust study design in shape discrimination research.
The Fundamental Role of Sample Size in Geometric Morphometrics
Theoretical Foundations and Practical Implications
Sample size determination represents a critical consideration in geometric morphometric studies, balancing statistical power with practical constraints. Inadequate sample sizes can lead to Type II errors (false negatives), reducing the ability to detect true morphological differences, while excessively large samples may identify statistically significant but biologically irrelevant differences, creating false positives. The relationship between sample size, power, effect size, and statistical significance forms the foundation for robust morphological analyses. Power, defined as the probability of correctly rejecting a false null hypothesis, is typically targeted at 0.8 (80%) for reliable study design, with significance levels (α) often set at 0.05 or lower depending on the research context [55].
Empirical Evidence of Sample Size Effects
Recent empirical investigations have quantified how sample size influences shape estimation. A 2024 systematic study using large intraspecific sample sizes for two bat species (Lasiurus borealis, n = 72; Nycticeius humeralis, n = 81) demonstrated that reducing sample size directly impacted mean shape calculations and increased shape variance estimates [56]. The research found that smaller samples produced less stable mean shape estimates and failed to capture the full spectrum of morphological variation present in populations. Similarly, in neuroanatomical normative modeling, systematic evaluations revealed that model performance improved consistently with increasing sample sizes, with rapid gains observed between n = 10 and n = 50, more gradual improvements between n = 50 and n = 200, and performance plateauing beyond n = 300 specimens [57].
Table 1: Impact of Sample Size on Shape Estimation Metrics Based on Empirical Studies
| Sample Size | Mean Shape Stability | Shape Variance Estimation | Morphological Disparity Capture |
|---|---|---|---|
| Small (n < 30) | Low stability | Overestimated variance | Limited morphological range captured |
| Moderate (n = 50-100) | Moderate stability | More accurate variance | Improved disparity representation |
| Large (n > 200) | High stability | Most accurate variance | Comprehensive morphological representation |
Comparative Analysis of Semi-Landmark Methodologies
Defining Semi-Landmark Approaches
Semi-landmarks are essential for quantifying shape variation in structures lacking clearly defined homologous landmarks. These algorithmic methods generate densely matched points along curves and surfaces between traditional landmarks, enabling comprehensive shape characterization. The three primary semi-landmarking approaches include [39] [40]:
- Sliding Semi-Landmarks: Points are slid along tangents to minimize either bending energy (BE) or Procrustes distance (D) relative to a reference form
- Landmark-Driven Approaches: Combine least-squares (LS) and iterative closest point (ICP) algorithms for rigid registration
- Non-Rigid Registration: Employs thin-plate splines (TPS) with non-rigid ICP (NICP) for more flexible surface matching
Methodological Performance in Shape Discrimination
Different semi-landmarking approaches yield meaningfully different results in shape analyses. Studies comparing these methods have found that while sliding TPS and TPS&NICP approaches produce relatively consistent results, methods based on rigid registration (LS&ICP) can generate substantially different outcomes [40]. These differences become particularly important when analyzing samples with low morphological variation, such as modern human populations, where methodological choices can alter biological interpretations [20].
Table 2: Comparison of Semi-Landmarking Approaches for Shape Analysis
| Method | Theoretical Basis | Strengths | Limitations | Consistency with Other Methods |
|---|---|---|---|---|
| Sliding TPS (BE) | Minimizes bending energy | Smooth deformations; biological plausibility | Sensitive to template choice; computational intensity | High consistency with TPS&NICP |
| Sliding TPS (Procrustes D) | Minimizes Procrustes distance | Direct shape correspondence | All points influence sliding equally | Moderate consistency with BE approach |
| LS&ICP | Rigid registration with least-squares | Computational efficiency; simple implementation | Poor handling of non-affine transformations | Low consistency with other methods |
| TPS&NICP | Non-rigid registration | Handles complex deformations; good for surfaces | Parameter sensitivity; implementation complexity | High consistency with sliding TPS |
Experimental Protocols for Methodological Evaluation
Standardized Workflow for Shape Analysis
A systematic protocol for evaluating shape differences typically involves several standardized steps [56] [58]:
- Specimen Imaging: Standardized photographing or scanning of specimens with consistent orientation and scale
- Landmark Digitization: Placement of Type I, II, and III landmarks using software such as tpsDIG2
- Semi-Landmark Placement: Application of chosen semi-landmark method (BE, Procrustes D, LS&ICP, or TPS&NICP)
- Generalized Procrustes Analysis (GPA): Superimposition to remove non-shape variation (position, scale, rotation)
- Statistical Analysis: Principal component analysis (PCA), discriminant function analysis, or other multivariate methods
- Visualization and Interpretation: Shape difference visualization and biological inference
Sample Size Evaluation Protocol
The Landmark Sampling Evaluation Curve (LaSEC) method provides a systematic approach for determining the adequacy of landmark sampling [58]. This computational tool:
- Incrementally increases landmark sampling from a minimal starting point
- Calculates Procrustes sum of squares (PSS) between subsampled and full datasets at each step
- Assesses convergence toward the pattern of shape variation in the full dataset
- Identifies under-sampling, over-sampling, and optimal landmark numbers for specific research questions
Interplay Between Sample Size and Semi-Landmark Methods
Method-Dependent Sensitivity to Sample Size
The influence of sample size on shape estimation is not uniform across different semi-landmark methods. Approaches that incorporate more biological assumptions (e.g., sliding semi-landmarks with bending energy) may stabilize more quickly with increasing sample size than purely mathematical approaches (e.g., rigid registration methods). Research indicates that methods assuming smooth deformations (sliding TPS, TPS&NICP) produce more consistent results across different sample sizes compared to rigid registration approaches [40] [20].
View and Element Concordance
The impact of sample size varies across different anatomical views and elements. Studies evaluating multiple skull views (lateral cranial, ventral cranial, lateral mandibular) found that shape differences were not consistent across views or skull elements, and trends shown by different views were not always strongly correlated [56]. This suggests that adequate sample size requirements may depend on the specific anatomical structure being analyzed and the research question being addressed.
Table 3: Essential Tools for Geometric Morphometrics Research
| Tool/Resource | Function/Purpose | Implementation Considerations |
|---|---|---|
| tpsDIG2 | Landmark and semi-landmark digitization | Free software; standardized landmark placement critical |
| Geomorph R Package | Statistical shape analysis | Comprehensive GM analysis toolkit; requires R proficiency |
| LaSEC (Landmark Sampling Evaluation Curve) | Evaluate landmark sampling adequacy | Determines optimal landmark number; avoids over/under-sampling |
| MorphoJ | User-friendly GM analysis | Java-based; good for beginners in morphometrics |
| EVAN Toolbox | Paleontological applications | Specialized for fossil material; handles incomplete specimens |
| Landmark Editor | 3D landmark digitization | For 3D coordinate data; visualization capabilities |
The evidence consistently demonstrates that sample size significantly impacts both mean shape estimation and shape variance characterization in geometric morphometric studies. Reducing sample size increases instability in mean shape calculations and inflates variance estimates, potentially leading to erroneous biological interpretations. The optimal sample size depends on multiple factors including morphological complexity, research questions, and the specific semi-landmark methods employed.
While general guidelines suggest samples of 50-200 specimens provide reasonable stability for many applications, researchers should conduct pilot studies using multiple views, elements, and sample sizes to determine appropriate sampling for their specific research context [56]. The integration of evaluation tools like LaSEC can further optimize landmark sampling strategies [58]. Critically, choices between semi-landmark methods should align with research goals, with recognition that different approaches make different assumptions and may yield varying results, particularly when morphological variation is subtle.
As geometric morphometrics continues to evolve as a powerful tool for shape discrimination, conscious attention to these methodological considerations will enhance the reliability and biological relevance of research findings across evolutionary biology, paleontology, biomedical research, and beyond.
Geometric morphometrics (GM) has revolutionized the study of biological shape by providing a statistically rigorous, coordinate-based framework for quantifying morphology [21]. A significant advancement within this field is the use of semi-landmarks, which allow researchers to capture shape information from curves and surfaces that lack discrete, homologous anatomical points [21]. Unlike traditional landmarks, which are limited to specific homologous structures, semi-landmarks enable the dense sampling of morphology, providing a more comprehensive representation of biological form [21]. However, a fundamental and often challenging question for researchers is: how many semi-landmarks are sufficient to accurately capture this shape without introducing unnecessary analytical complexity? The answer is not a single universal number but is influenced by the specific biological question, the structure being studied, and the chosen methodology. This guide objectively compares approaches to selecting semi-landmark density, drawing on experimental data to inform researchers in shape discrimination studies.
Understanding Semi-Landmarks and Their Applications
Semi-landmarks act as an intermediary between homology-based landmark approaches and homology-free pseudolandmark methods [21]. They are used to quantify two primary types of morphological data:
- Curve Sliding Semi-landmarks: Define outlines, such as the margins of bones, fins, or anatomical ridges [21].
- Surface Sliding Semi-landmarks: Define entire surfaces that are demarcated by previously placed landmarks and curves, allowing for a high-density, comprehensive quantification of 3D shape [21].
The application of these methods has been demonstrated across a diverse array of taxa and structures, including the quantification of hominin crania, bat skulls, fish fins, and turtle shells [21] [56]. The primary advantage of semi-landmarks over pseudolandmark methods (e.g., cPDist, auto3dgm) is the retention of biological correspondence. Semi-landmarks allow for the allocation of points into different biologically defined regions, making it possible to link patterns of shape variance to specific developmental or functional mechanisms [21].
Comparative Performance of Outline Methods
A key methodological study compared the performance of different geometric morphometric outline methods, including semi-landmark approaches, in discriminating age-related differences in the tail feathers of Ovenbirds (Seiurus aurocapilla) [14]. The research evaluated two semi-landmark alignment methods—bending energy minimization (BEM) and perpendicular projection (PP)—alongside Elliptical Fourier Analysis (EFA) and the extended eigenshape method.
Table 1: Comparison of Outline Method Performance in Discriminating Feather Shapes [14]
| Method | Classification Performance | Dependence on Point Number |
|---|---|---|
| Semi-landmarks (BEM) | Roughly equal classification rates to PP; high performance. | Not highly dependent on the number of points used. |
| Semi-landmarks (PP) | Roughly equal classification rates to BEM; high performance. | Not highly dependent on the number of points used. |
| Elliptical Fourier Analysis | Roughly equal classification rates to semi-landmark methods. | Performance was consistent across methods. |
| Extended Eigenshape | Roughly equal classification rates to semi-landmark methods. | Performance was consistent across methods. |
The study concluded that the rate of correct classification was not highly dependent on the number of points used to represent a curve or the specific method of data acquisition (manual tracing vs. template-based digitization) [14]. This suggests that for outline-based analyses, the exact density of semi-landmarks may be flexible, provided a sufficient baseline is met to capture the curve's geometry.
Factors Influencing Semi-Landmark Density Selection
The appropriate density of semi-landmarks is not determined by a single factor but by a combination of biological and methodological considerations.
Complexity of the Morphology
Intricate structures with high curvature require a greater density of points to accurately capture their form without oversimplification. Simpler, smoother curves can be represented with fewer points [21].
Level of Analysis (Intraspecific vs. Interspecific)
Studies focusing on subtle intraspecific variation may require a higher density of points to detect small-scale shape differences. In contrast, broader interspecific comparisons might be adequately served with a lower density that captures major shape trends [56].
Alignment and Sliding Algorithms
The choice of algorithm for sliding semi-landmarks (e.g., minimizing bending energy vs. Procrustes distance) can influence how points distribute themselves along a curve or surface. The density must be high enough to allow the algorithm to smoothly slide points into geometrically homologous positions [21] [14].
Statistical Power and Sample Size
The total number of variables (coordinates from landmarks and semi-landmarks) must be considered in relation to the available sample size. Excessively high semi-landmark density can lead to a high-dimensional data problem, where the number of variables approaches or exceeds the number of specimens, complicating subsequent statistical analyses [14].
Experimental Protocols for Determining Point Density
Protocol 1: Sensitivity Analysis for Outline Data
This protocol is based on methodologies used in feather shape discrimination [14].
- Data Collection: Digitize your curves using a generously high number of points (e.g., 200-300 semi-landmarks) to ensure the initial capture of all shape details.
- Subsampling: Create multiple datasets from the original by systematically reducing the number of points (e.g., 150, 100, 50, 25 points) through equidistant subsampling.
- Alignment and Analysis: For each subsampled dataset, perform a Generalized Procrustes Analysis (GPA) with sliding to align the semi-landmarks.
- Statistical Comparison: Conduct a Principal Components Analysis (PCA) and a Canonical Variates Analysis (CVA) on each dataset. Track key outcomes such as the proportion of shape variance explained by the first few PCs, the cross-validation rate of correct assignment in CVA, and the statistical significance of group differences (e.g., via Procrustes ANOVA).
- Determine Optimal Density: Identify the point density at which the classification rate and variance explanation plateau. Further increases beyond this point provide diminishing returns and add unnecessary analytical complexity.
Protocol 2: Assessing the Impact of Sample Size on 3D Mean Shape
This protocol is informed by research on bat skull morphology, which evaluated how sample size impacts estimates of mean shape and shape variance [56].
- Establish a Baseline: Use a large intraspecific sample size (e.g., n > 70) to establish a robust "true" mean shape for a structure [56].
- Create Sub-samples: Randomly select smaller subsets of specimens from the full dataset (e.g., n = 10, 20, 30, 40).
- Calculate Mean Shape: For each sub-sample, calculate the mean shape.
- Measure Divergence: Quantify the Procrustes distance between the mean shape of each sub-sample and the "true" mean shape from the full dataset.
- Analyze Variance: Observe how the estimated shape variance changes with decreasing sample size. The study on bat crania predicted that "distance from the true mean and mean shape variance will increase with decreasing sample size" [56]. This principle can be extended to the density of points defining each specimen's shape.
The following workflow generalizes the process of selecting an appropriate semi-landmark density:
The Researcher's Toolkit: Essential Materials and Software
Successfully implementing a semi-landmark study requires a suite of specialized tools and software for data acquisition, processing, and analysis.
Table 2: Essential Research Reagent Solutions for Semi-Landmark Studies
| Tool / Resource | Function | Application in Research |
|---|---|---|
| CT / Surface Scanners | Generation of high-resolution 3D specimen reconstructions (e.g., mesh files). | Creates the digital raw data on which landmarks and semi-landmarks are placed [21]. |
| Digitizing Software (tpsDig2) | Software used to manually place landmarks and semi-landmarks on 2D images or 3D models. | The primary tool for data collection; allows for precise placement of points on curves and surfaces [56]. |
| Geometric Morphometrics Suites (geomorph in R) | R packages that perform Generalized Procrustes Analysis (GPA), sliding of semi-landmarks, and statistical shape analysis. | Used to align specimens in shape space, slide semi-landmarks, and conduct PCA, CVA, and other statistical tests [56]. |
| Semi-landmark Sliding Algorithms | Mathematical procedures (e.g., Bending Energy Minimization) that slide semi-landmarks to establish geometric homology. | Crucial for removing the arbitrary placement of points and making shapes comparable across specimens [21] [14]. |
| Color Contrast Analyzer | Tools to ensure sufficient visual contrast in diagrams and presentations. | While not for shape analysis, it is critical for creating accessible scientific communications that adhere to WCAG guidelines [59] [60] [61]. |
Selecting the optimal semi-landmark density is a critical step in geometric morphometrics that balances biological accuracy with statistical practicality. Evidence from comparative studies indicates that classification success for outline data is often robust across a range of point densities and methodologies [14]. There is no one-size-fits-all answer; the optimal density is context-dependent. Researchers are advised to conduct preliminary sensitivity analyses using their specific datasets to determine the point at which shape characterization becomes stable and reliable. By systematically evaluating factors such as morphological complexity, research question, and sample size, and by employing the experimental protocols outlined herein, scientists can make informed, evidence-based decisions to ensure their semi-landmark data is both sufficient and efficient for shape discrimination research.
In shape discrimination research, particularly in fields like evolutionary biology and medical diagnostics, the robustness of analytical methods to noise and missing data is paramount. Real-world data are often imperfect, contaminated by noise or incomplete due to various collection challenges. This guide objectively compares the performance of semi-landmark and related methods, focusing on their sensitivity to these disruptive factors. Framed within a broader thesis on comparing semi-landmark methods, this analysis provides researchers and drug development professionals with experimental data and protocols to inform their methodological choices.
Comparative Performance Data
Quantitative Comparison of Method Robustness
The following tables summarize experimental data on the performance of various methods when handling noise and missing data, as reported in simulation studies and empirical validations.
Table 1: Performance of Methods in Noisy Conditions (Shape Discrimination)
| Method | Noise Type | Performance Metric | Result | Key Finding |
|---|---|---|---|---|
| Global Shape Detectors [62] | Orientation & Position Noise | Coherence Threshold (% signal elements needed for detection) | ~10% for circles; up to ~50% for high-frequency shapes | Highly sensitive to both element orientation and position; thresholds rise with shape complexity (RF frequency, amplitude). |
| RIBG Imputation [63] | Noisy Data (Benchmark Datasets) | Robustness (Comparison vs. 4 other methods) | More robust to noise | Introducing GMDH mechanism effectively handles incomplete data with noise. |
| Patch Semi-Landmarking [5] | General Data Noise | Sensitivity (Qualitative Evaluation) | High sensitivity | Most sensitive to noise and missing data, resulting in outliers with large deviations. |
| Patch-TPS Semi-Landmarking [5] | General Data Noise | Sensitivity (Qualitative Evaluation) | Robust performance | More robust performance in the presence of noise and variability. |
| Pseudo-Landmark Sampling [5] | General Data Noise | Sensitivity (Qualitative Evaluation) | Robust performance | More robust performance in the presence of noise and variability. |
Table 2: Performance of Methods with Missing Data
| Method / Approach | Missing Data Mechanism | Scenario / Condition | Performance / Recommendation |
|---|---|---|---|
| Complete Case Analysis (CCA) [64] | MCAR | Small sample size, high proportion of missing values | Good results |
| CCA [64] | MAR | Small sample size, low prevalence | Severely biased |
| CCA [64] | MNAR | Low correlation, small sample size, low prevalence | Biased, but recommended to discuss limitations |
| Multiple Imputation (MI) [64] | MCAR | Large sample size | Performs well |
| Augmented Inverse Probability Weighting [64] | MAR | High prevalence, larger sample size | Performs well |
| Standard MI & Augmented IPW [64] | MNAR | Low correlation | Biased |
| δ-Adjustment Sensitivity Analysis [65] | MNAR (e.g., BP data) | Varying offset (δ) from 0 to -20 mmHg | Allows exploration of inferences under different MNAR scenarios. |
Table 3: Performance of Functional Data Analysis (FDA) Pipelines in Classification
| Pipeline Name | Brief Description | Key Feature | Reported Outcome |
|---|---|---|---|
| GM [26] | Geometric Morphometrics (Baseline) | Generalised Procrustes Analysis | Baseline for comparison |
| Arc-GM [26] | GM with Arc-Length Parameterisation | Uniform arc-length parameterisation | Innovative approach |
| FDM [26] | Functional Data Morphometrics | Models outline as multivariate functional data | Innovative approach |
| Soft-SRV-FDM [26] | FDM with Soft Elastic Alignment | Blends identity mapping with SRVF warp | Improved classification accuracy versus GM |
| Elastic-SRV-FDM [26] | FDM with Full Elastic Alignment | SRVF-based elastic alignment | Improved classification accuracy versus GM |
Experimental Protocols
To evaluate the robustness of shape analysis methods, researchers employ specific experimental protocols designed to test performance under controlled conditions of noise and missing data.
Protocol for Testing Sensitivity to Noise in Shape Discrimination
This protocol, based on the work by Schmidtmann et al. [62], tests the ability of global shape mechanisms to detect signals in noise.
- 1. Stimulus Generation:
- Signal Elements: Create global shapes (e.g., circles, Radial Frequency patterns) using oriented Gabor elements. The orientation of each signal element is set to be tangential to the shape's contour at the element's location.
- Noise Elements: Generate a background of randomly oriented Gabor elements.
- Coherence Control: The proportion of signal elements within the entire array is varied. This is the "coherence" level.
- 2. Task & Psychophysical Procedure:
- Present stimulus arrays to observers in a detection task (e.g., determine if a shape is present or absent).
- Use an adaptive staircase procedure (e.g., a 2-alternative forced-choice or 2AFC design) to estimate the minimum coherence level required for reliable detection. This threshold is the primary performance metric.
- 3. Independent Variables:
- Shape Complexity: Manipulate the global shape by varying RF pattern frequency (number of corners) and amplitude (sharpness of corners).
- Noise Type: Systematically introduce jitter to the orientation or the position of the individual elements.
- 4. Data Analysis:
- Record coherence thresholds for each condition.
- Model the data using frameworks like the diffusion model to decompose decision times and understand the underlying perceptual processes [62].
Protocol for Testing Sensitivity to Missing Data via Simulation
This protocol, common in statistical methodology papers, uses simulated data to compare how different methods handle missing values [64].
- 1. Data Generation:
- Simulate a complete dataset, including a reference standard (e.g., diseased/non-diseased), a continuous index test result, and several covariates.
- Define the true relationship between variables, including a known true Area Under the Curve (AUC) for the index test.
- 2. Induction of Missingness:
- Mechanism: Induce missing values in the index test under different mechanisms: Missing Completely at Random (MCAR), Missing at Random (MAR), and Missing Not at Random (MNAR).
- Proportion: Vary the proportion of missing values (e.g., 10%, 30%).
- For MAR/MNAR, the probability of a value being missing is made dependent on other observed variables (MAR) or on the value of the index test itself (MNAR) [64].
- 3. Method Application:
- Apply the methods under comparison (e.g., Complete Case Analysis, Multiple Imputation, Inverse Probability Weighting) to the datasets with missing values.
- 4. Performance Evaluation:
- Compare the estimated AUC from each method against the known true AUC.
- Calculate performance metrics such as bias, root mean square error, and coverage of confidence intervals across multiple simulation runs.
Protocol for Sensitivity Analysis of Missing Not at Random (MNAR) Data
This protocol, as demonstrated by van Buuren [65], assesses how conclusions might change if the MAR assumption is violated.
- 1. Initial Imputation:
- Perform multiple imputation on the incomplete dataset under the MAR assumption. This establishes a baseline.
- 2. Define MNAR Scenarios:
- Formulate plausible alternative scenarios where data are MNAR. For example, assume that individuals with missing blood pressure measurements had systematically lower values.
- Quantify these scenarios using an offset parameter, δ (e.g., -5, -10, -15 mmHg) [65].
- 3. Generate Adjusted Imputations:
- Use post-processing techniques to adjust the imputed values. For example, subtract the chosen δ from all imputed values of a variable.
- This creates new, MNAR-adjusted imputed datasets.
- 4. Analyze and Compare:
- Analyze each set of adjusted imputed datasets using the complete-data model (e.g., a Cox regression).
- Pool the results and observe how the key parameter estimates (e.g., hazard ratios) change as a function of δ.
- The "M-value" can be calculated to determine the strength of induced confounding needed to explain away an effect [66].
Workflow Visualization
The following diagrams illustrate the logical workflows and key processes for the methodologies discussed.
Workflow for Robust Shape Analysis Pipelines
Sensitivity Analysis for Missing Data
The Scientist's Toolkit
Table 4: Essential Research Reagent Solutions for Shape Discrimination and Robustness Studies
| Item / Solution | Function / Application | Key Characteristics |
|---|---|---|
| 3D Slicer with SlicerMorph [5] | An open-source platform for visualization and analysis of 3D image data. Used for placing manual landmarks and implementing semi-landmarking strategies. | Extensible via modules; includes tools for geometric morphometrics. |
R Packages (e.g., Morpho, geomorph) [5] |
Statistical analysis of shape in R. Used for Generalized Procrustes Analysis, sliding semi-landmarks, and other multivariate shape analyses. | Provide comprehensive suites of functions for landmark-based data. |
| Gabor Elements [62] | The fundamental stimulus element used in psychophysical studies of shape detection in noise. | Mimics receptive field properties of V1 neurons; allows controlled manipulation of orientation. |
| Radial Frequency (RF) Patterns [62] | A class of closed contours used to study global shape processing. Allow parametric manipulation of shape complexity. | Defined by sinusoidal modulation of a circle's radius; can create shapes from circles to stars. |
Multiple Imputation Software (e.g., mice in R) [65] |
Used to handle missing data by generating multiple plausible datasets, which are then analyzed and pooled. | Allows specification of different imputation models and sensitivity analysis scenarios. |
| Square-Root Velocity Function (SRVF) [26] | A mathematical framework used in functional data analysis for elastic shape analysis. Separates amplitude and phase variation. | Enables improved alignment of curves and complex shapes, enhancing robustness. |
The Critical Role of Initial Alignment and Template Selection
In geometric morphometrics, the analysis of biological form often extends beyond the limited number of available anatomical landmarks to include numerous semilandmarks—points placed along curves and surfaces to capture comprehensive shape information. The placement of these semilandmarks is not arbitrary; rather, it is fundamentally guided by two critical methodological choices: initial alignment and template selection. These choices establish the point correspondences across specimens, ultimately determining the validity and reliability of subsequent statistical shape analyses. Within the broader thesis of comparing semilandmark methods for shape discrimination research, understanding the interplay between alignment strategies and template influence is paramount, as these factors directly control the mapping of biological homology versus mathematical convenience.
The fundamental challenge lies in the fact that semilandmarks, unlike traditional landmarks, lack strict biological homology. Their locations are estimated algorithmically, making them dependent on the chosen methodological pipeline [1]. As Shui et al. (2023) emphasize, "the locations of semilandmarks depend on the investigator’s choice of algorithm and their density. In consequence... they can be expected to yield different results concerning patterns of variation and co-variation" [1]. This review provides a comparative guide to the performance of different alignment and template selection protocols, synthesizing experimental data to inform best practices for researchers in morphology, systematics, and evolutionary biology.
Performance Comparison of Semilandmarking Approaches
Different strategies for placing semilandmarks offer distinct trade-offs between correspondence accuracy, robustness to noise, computational demands, and required expertise. The table below summarizes the experimental performance of three primary approaches, as evaluated in comparative studies.
Table 1: Performance Comparison of Semilandmarking Approaches
| Method | Core Principle | Classification Accuracy/Performance | Robustness to Noise & Missing Data | Computational Load | Key Strengths | Major Limitations |
|---|---|---|---|---|---|---|
| Patch-Based | Projects semilandmarks from triangular patches defined by manual landmarks onto each specimen's surface [5]. | Produces shape estimations comparable to manual landmarks alone [5]. | Demonstrates high sensitivity to noise and missing data, resulting in outliers with large deviations [5]. | Moderate | Does not require a prior template; provides a known geometric relationship to manual landmarks [5]. | Coverage dependent on manual landmark availability; prone to placement errors on sharp curves [5]. |
| Patch-TPS | Applies a Thin-Plate Spline (TPS) warp from a template to target specimens, followed by semilandmark projection [5]. | Provides robust performance with shape estimations comparable or superior to manual landmarks [5]. | High robustness to noise and dataset variability [5]. | High | Improved robustness over basic patch method; consistent coverage [5]. | Dependent on the choice of a single template specimen [5]. |
| Pseudo-Landmark Sampling | Generates a dense set of points on a template model, transferred to specimens via TPS and normal projection [5]. | Performance is comparable to other methods in ideal conditions but may show low discriminant power (<40%) in some 2D applications [28]. | Robust performance in the presence of noise and variability [5]. | High | Excellent coverage and regular sampling; no manual landmark dependency for placement [5]. | No biological homology for points; entirely dependent on template and transformation accuracy [5]. |
| Landmark-Free (e.g., ICP) | Uses algorithms like Iterative Closest Point to rigidly register a template surface to target specimens [1]. | Accuracy can be compromised by large shape differences, potentially projecting points to different anatomical features [1]. | Highly sensitive to initial alignment and large shape differences [1]. | Variable (depends on variant) | Automates correspondence mapping without manual landmarks [1]. | Risk of mapping anatomically non-equivalent points; equivalence is purely geometric [1]. |
Experimental Protocols and Workflows
The following section details the specific experimental methodologies used to generate the performance data for the key semilandmarking approaches discussed in this guide.
Protocol for Patch-Based Semilandmarking
The patch-based method generates semilandmarks directly on each specimen without a prior template, preserving a geometric relationship with manual landmarks [5].
- Patch Definition: The user defines a triangular region of interest on the specimen's surface by selecting three pre-placed manual landmarks that form its boundaries [5].
- Grid Creation: A template triangular grid, with a user-specified density of points, is registered to the vertices of the bounding triangle using a Thin-Plate Spline (TPS) deformation [5].
- Surface Projection: The grid points are projected onto the actual specimen surface using a multi-step algorithm [5]:
- The surface normal vectors at the manual landmarks are averaged to estimate the projection vector direction for the entire patch.
- A ray is cast from each grid point in the direction of the projection vector. The first intersection with the surface mesh is selected as the projected point.
- If no intersection is found, the ray direction is reversed. If still no intersection, the closest mesh point to the grid point is selected.
- Grid Merging: After all patches are processed, the individual grids are merged into a single landmark set. Unique triangle edges are identified, and uniformly sampled points are placed along these edges, projected to the surface, and added to the final set to prevent overlap and ensure continuous coverage. Manual landmarks are also included in the final set [5].
Protocol for Patch-Based Semilandmarks with TPS (Patch-TPS)
This method improves robustness by generating semilandmarks on a single template and transferring them to all specimens in a dataset [5].
- Template Generation: A single template specimen (either a synthetic model or a representative sample) is selected. The patch-based method (Section 3.1) is applied to this template to create a comprehensive set of semilandmarks [5].
- Thin-Plate Spline Warp: For each target specimen, a TPS transformation is calculated based on the correspondence between the manual landmarks placed on the template and those on the target specimen [5].
- Landmark Transfer: The template semilandmarks are warped to the target specimen's space using the calculated TPS transformation [5].
- Surface Projection: To ensure the transferred points lie precisely on the target's surface, a projection is performed [5]:
- A ray is cast from each warped semilandmark point in the direction of the template's surface normal vector.
- The final intersection of this ray with the target specimen's mesh is selected.
- If no intersection is found, the ray direction is reversed, or the closest point on the target mesh is used as a fallback.
Validation and Benchmarking Protocol
To objectively benchmark the performance of different semilandmarking methods, particularly their ability to discriminate between shapes, studies often use the following validation protocol [14]:
- Data Collection: Specimens are digitized, and manual landmarks are placed by an expert. For outline-based studies, curves are digitized using template-based, manual tracing, or automated edge detection methods [14].
- Semilandmark Placement: Different methods (e.g., Perpendicular Projection, Bending Energy Minimization, Elliptical Fourier Analysis) are applied to place semilandmarks on the curves or surfaces of all specimens [14].
- Dimensionality Reduction: Due to the high number of variables (semilandmarks), Principal Components Analysis (PCA) is used to reduce dimensionality. The number of PC axes can be determined by optimizing the cross-validation assignment rate from the subsequent Canonical Variates Analysis (CVA) to avoid overfitting [14].
- Discriminant Analysis: CVA is performed on the PC scores to determine how well the semilandmark data can classify specimens into predefined groups (e.g., species, age classes) [14].
- Cross-Validation: The classification accuracy is tested using cross-validation, where specimens are left out of the "training set" used to build the discriminant model and are then assigned to a group based on the model. This provides a less biased estimate of performance than resubstitution rates [14].
The workflow for the experimental comparison of semi-landmarking methods, from data preparation to performance evaluation, is visualized below.
The Scientist's Toolkit: Essential Research Reagents and Materials
Successful semilandmark analysis requires a suite of software tools and materials. The following table details key solutions used in the featured experimental studies.
Table 2: Essential Research Reagents and Solutions for Semilandmark Research
| Tool/Solution | Function | Application Context |
|---|---|---|
| 3D Slicer / SlicerMorph | An open-source platform for biomedical visualization and 3D morphometrics. Provides modules for manual landmarking and the patch-based, patch-TPS, and pseudo-landmarking methods [5]. | Used for data preparation (volume creation from DICOM), manual landmark placement, and application of all three primary semilandmarking strategies described in this guide [5]. |
| R Packages (Morpho, geomorph) | Provide comprehensive toolkits for the statistical analysis of shape data, including Generalized Procrustes Analysis (GPA), sliding semilandmarks, and multivariate statistics [5]. | Used for the post-processing of landmark data (e.g., Procrustes alignment, sliding semilandmarks), dimensionality reduction, and statistical tests like Procrustes ANOVA [5] [33]. |
| VGG19 CNN Model | A deep convolutional neural network used as a feature extractor. Its layers provide a feature space for template matching and correspondence finding in computer vision [67]. | Applied in landmark-free algorithmic approaches to establish initial point correspondences between template and target surfaces based on deep feature similarity [67]. |
| Thin-Plate Spline (TPS) Transformation | A mathematical interpolation function that defines a smooth mapping from one set of points to another, minimizing bending energy [1] [5]. | The core transformation used in the patch-TPS method to warp template semilandmarks to target specimens. Also used in sliding semilandmarks to minimize bending energy [1] [5]. |
| Iterative Closest Point (ICP) Algorithm | A landmark-free algorithm for rigid registration of 3D surfaces. It iteratively minimizes the distances between points on two surfaces to find the best alignment [1]. | Used in automated correspondence-finding pipelines (e.g., auto3dgm) to register a template surface to target specimens and transfer semilandmarks [1]. |
The experimental data clearly demonstrates that no single semilandmarking method is universally superior. The choice of method involves a critical trade-off between biological correspondence, driven by manual landmarks and careful template selection, and algorithmic efficiency and coverage, offered by landmark-free and pseudo-landmark methods [1] [5]. The initial alignment and template selection are not mere preliminary steps but are deterministic factors that can introduce methodological artifacts if not carefully considered.
The patch-based method offers transparency and a direct link to biological landmarks but is fragile in the face of noisy data or complex topologies. The patch-TPS method significantly improves robustness and is highly consistent but introduces a dependency on a single template, which must be chosen with care to represent the sample's central tendency. Pseudo-landmark and landmark-free methods provide dense coverage and automation but at the cost of biological homology, risking the alignment of non-equivalent anatomical points, especially across highly disparate forms [1] [5] [28].
Therefore, the critical role of initial alignment and template selection cannot be overstated. Researchers must justify these choices based on the biological question, the morphological complexity of their dataset, and the required precision of point correspondence. As concluded by Shui et al., "morphometric analyses using semilandmarks must be interpreted with due caution, recognising that error is inevitable and that results are approximations" [1]. Future work should focus on developing robust benchmarking standards and exploring hybrid approaches that leverage the strengths of multiple methods to achieve both biological fidelity and computational efficiency.
In the field of geometric morphometrics, shape analysis often relies on the use of semi-landmarks—algorithmically placed points on curves and surfaces between traditional, homologous landmarks. These methods are essential for capturing comprehensive shape information from biological structures lacking numerous discrete landmarks, such as cranial vaults or feather outlines [39] [14]. The primary challenge researchers face is the high-dimensional nature of the data generated by these dense point correspondences, where the number of variables (semi-landmark coordinates) can vastly exceed the number of specimens, complicating statistical analysis and increasing the risk of overfitting.
Dimensionality reduction techniques, particularly Principal Component Analysis (PCA), have become fundamental tools for addressing this challenge. PCA projects the superimposed landmark data into a lower-dimensional subspace of uncorrelated principal components (PCs), which effectively summarizes the major trends of shape variation within a dataset [68] [69]. However, determining the optimal number of components to retain—balancing model simplicity against information preservation—requires robust validation strategies to ensure analytical rigor and biological validity.
This guide objectively compares the performance of PCA coupled with various cross-validation strategies, framed within a research context comparing semi-landmark methods for shape discrimination. We provide experimental data and detailed protocols to equip researchers with practical methodologies for implementing these techniques effectively in morphological studies.
The Role of PCA in Shape Analysis
Standard Analytical Pipeline
The conventional geometric morphometrics workflow involves two core computational steps. First, Generalized Procrustes Analysis (GPA) superimposes landmark configurations by scaling, translating, and rotating them to minimize the sum of squared distances between corresponding landmarks. This step removes variation unrelated to shape, placing all specimens into a shared shape space [68]. Second, Principal Component Analysis (PCA) is applied to the Procrustes-aligned coordinates. PCA performs an eigenvalue decomposition of the covariance matrix, generating a new set of uncorrelated variables (principal components) that are ordered by the amount of variance they explain [68] [70]. This projection enables visualization of complex shape relationships in low-dimensional scatterplots and facilitates subsequent statistical analyses.
The Challenge of Semi-Landmarks
Semi-landmarks are crucial for analyzing biological structures with large, smooth areas lacking discrete anatomical landmarks. However, their algorithmic placement introduces methodological considerations. Unlike traditional landmarks identified by biological homology, semi-landmark locations depend on the chosen algorithm (e.g., bending energy minimization, perpendicular projection, iterative closest point) and sampling density [39]. Different semi-landmarking approaches produce different point locations, which can subsequently lead to variations in statistical results and interpretations [39]. This inherent methodological variability necessitates robust validation frameworks to ensure that biological conclusions are not artefacts of the chosen digitization protocol.
Cross-Validation Strategies for Component Selection
Selecting the optimal number of principal components is critical. Insufficient components discard biologically meaningful shape variation, while too many components introduce noise and increase overfitting risk. Cross-validation provides empirical frameworks for this selection.
The "Speckled" Holdout Pattern for Matrix Decomposition
Standard cross-validation used in supervised learning does not directly transfer to unsupervised methods like PCA. Holding out entire rows or columns of the data matrix disrupts the model's ability to estimate all parameters [71]. A robust alternative is the "speckled" holdout pattern, where individual data points (e.g., specific landmark coordinates) are omitted at random from the data matrix (\mathbf{Y}) during model fitting [71]. The model's performance is then evaluated by its accuracy in predicting these held-out values. This approach allows all model parameters ((\mathbf{U}) and (\mathbf{V})) to be estimated while providing a realistic measure of generalization error. The number of components that minimizes this prediction error on withheld data should be selected.
Cross-Validation within a Supervised Pipeline
When PCA is used as a preprocessing step for a supervised task like classification or regression, the number of components can be tuned as a hyperparameter within a cross-validation framework. This involves:
- Creating a Pipeline: Sequentially chain the PCA step with the final predictive model (e.g., logistic regression) [70].
- Hyperparameter Tuning: Use a procedure like
GridSearchCVto evaluate different numbers of principal components alongside other model parameters [70]. - Performance Validation: Select the number of components that yields the best cross-validated performance on the supervised task (e.g., highest classification accuracy).
This method directly optimizes for the end goal of prediction, ensuring the reduced dimensions maximally inform the biological classification problem [70].
Optimizing for Classification Rates
In discrimination studies using Canonical Variates Analysis (CVA), a specific cross-validation strategy can determine the number of PC scores to use. Rather than using a fixed variance threshold, researchers can test a range of PC counts and select the number that maximizes the cross-validation assignment rate to the correct groups [14]. This method often outperforms approaches using a fixed number of PCs or alternative dimension-reduction techniques like partial least squares, as it directly optimizes for the statistical goal of group discrimination [14].
Table 1: Comparison of Cross-Validation Strategies for PCA
| Strategy | Core Principle | Best For | Key Advantage |
|---|---|---|---|
| Speckled Holdout | Hold out random individual data points to assess matrix reconstruction error. | Unsupervised exploration, model selection without a specific grouping hypothesis. | Provides a direct measure of the PCA model's generalization for describing shape. |
| Supervised Pipeline Tuning | Treat number of components as a hyperparameter in a classification/regression model. | Shape discrimination, predicting group membership or continuous traits. | Optimizes dimensionality reduction for a specific predictive task. |
| Classification Rate Optimization | Select number of PCs that maximizes cross-validated correct classification rate in CVA. | Group discrimination studies where classification accuracy is the primary metric. | Directly links dimension reduction to the goal of successful group assignment. |
Comparative Experimental Data
Performance of Semi-Landmark Methods
A comparative study on feather shape discrimination evaluated different semi-landmark and outline analysis methods. The research found that classification success was influenced more by the choice of dimensionality reduction approach than by the specific semi-landmark method (e.g., bending energy alignment vs. perpendicular projection) or the number of points used [14]. This underscores the critical role of robust validation in the analytical pipeline.
Pitfalls of Inadequate Validation
Evidence suggests that PCA outcomes can be sensitive to data input and methodological choices. One study using benchmark papionin crania found that PCA results were not reliably reproducible and that conclusions about phylogenetic relationships could be significantly influenced by these artefacts [68]. In contrast, supervised machine learning classifiers demonstrated higher accuracy for both classification and novel taxon detection, highlighting the limitations of unvalidated PCA interpretation [68]. This reinforces the necessity of cross-validation to guard against over-interpretation of unstable variance patterns.
Table 2: Example Cross-Validation Performance for Different Component Numbers
| Number of PCs | Cumulative Variance Explained | Cross-Val. Classification Accuracy | Inference |
|---|---|---|---|
| 3 | 75% | 85% | May underfit; misses meaningful shape variation. |
| 6 | 89% | 97% | Optimal range; balances information and generalization. |
| 9 | 95% | 97% | Good performance, but minimal gain over fewer components. |
| 18 | ~100% | 98% | Highest performance, but marginal gain may not justify added complexity. |
Detailed Experimental Protocols
Protocol 1: Speckled Cross-Validation for PCA
Objective: To determine the optimal number of principal components for describing semi-landmark data without a predefined grouping structure.
- Data Preparation: Begin with a Procrustes-aligned coordinate matrix (\mathbf{Y}) (dimensions: (n) specimens (\times) (p) coordinates).
- Initialize Holdout Set: Randomly select a small fraction (e.g., 10%) of the elements (y_{ij}) in (\mathbf{Y}) to be masked as missing values [71].
- Model Fitting & Evaluation:
- For a candidate number of components (r):
- Fit a PCA model, estimating matrices (\mathbf{U}) and (\mathbf{V}) that minimize the reconstruction error (\lVert \mathbf{UV}^T - \mathbf{Y} \rVert^2) for the non-missing data points [71].
- Use the fitted model to predict the values of the held-out data points.
- Calculate the prediction error (e.g., Mean Squared Error) for the held-out set.
- Iterate: Repeat steps 2-3 for different holdout sets (e.g., via multiple random splits) to obtain a stable error estimate for each (r).
- Component Selection: Plot the average prediction error against the number of components (r). The optimal (r) is often at the elbow of this curve or the point immediately before the error curve stabilizes.
Protocol 2: Supervised Pipeline with Grid Search
Objective: To optimize the number of principal components for discriminating between pre-defined groups (e.g., species, age classes).
- Data Splitting: Split the dataset into a training set (e.g., 70-80%) and a held-out test set (20-30%). The test set is locked away for final evaluation only [72].
- Define the Pipeline: Create a scikit-learn
Pipelinewith two steps: 1) aPCA()object, and 2) a classifier (e.g.,LogisticRegression()) [70]. - Define Parameter Grid: Create a parameter grid for
GridSearchCVthat specifies a range of values forpca__n_components(e.g., from 1 to 15) and any relevant hyperparameters for the classifier [70]. - Cross-Validation Training: Perform
GridSearchCVon the training set only. This procedure will automatically perform internal cross-validation on the training set to find the best number of components and classifier settings [72] [70]. - Final Evaluation: Unlock the held-out test set. Use the best-estimator pipeline from the grid search to predict the labels of the test set and report the final performance metric. This provides an unbiased estimate of the model's generalization performance [73] [72].
The following diagram illustrates the workflow for the supervised pipeline tuning protocol:
The Scientist's Toolkit
Table 3: Essential Research Reagents and Computational Tools
| Item/Solution | Function in Analysis | Example/Note |
|---|---|---|
| Geometric Morphometrics Software | Digitize landmarks & semi-landmarks, perform GPA and initial visualization. | MorphoJ, EVAN Toolbox, R package geomorph. |
| Programming Environment | Implement custom cross-validation, PCA, and machine learning pipelines. | Python (scikit-learn, NumPy) or R (Morpho, recipes). |
| Scikit-Learn Pipeline | Chain PCA and classifier into a single object for robust cross-validation. | from sklearn.pipeline import Pipeline [70]. |
| GridSearchCV | Automate the search for optimal hyperparameters (like n_components) via cross-validation. |
Critical for Protocol 2 [70]. |
| Procrustes Alignment | Remove non-shape variations (position, scale, orientation) from landmark data. | Prerequisite step before PCA [68]. |
| Figure of Merit (FoM) | Quantify discrimination performance to compare models objectively. | Used to assess classification success [74]. |
In geometric morphometric (GM) analyses, semilandmarks are indispensable for quantifying shape variation across biological structures lacking abundant homologous landmarks. However, a critical and often misunderstood principle is that the individual coordinates of a semilandmark are biologically meaningless. This guide objectively compares prevalent semilandmark methodologies, underscoring that while these tools are powerful for capturing overall form, their output must be interpreted as an approximation of shape rather than a precise map of homologous points. Supported by experimental data, we demonstrate that analytical results—including mean shape estimates and patterns of allometry—vary significantly based on the chosen semilandmarking algorithm and density. This comparison provides researchers, particularly those in shape discrimination and drug development, with a framework for selecting methods and a cautionary note on over-interpreting single coordinate values.
Geometric morphometrics relies on landmarks—biologically homologous points that can be reliably identified across specimens. However, many biological structures, such as the human cranial vault or tooth crowns, are smooth surfaces with few, if any, such landmarks [39]. To overcome this limitation, semilandmarking algorithms were developed to densely match points between surfaces, allowing for the quantification of "overall form" [39] [40].
A fundamental distinction exists between landmarks and semilandmarks. True landmarks are defined by developmental or evolutionary homology, meaning they represent the "same" point in different specimens from a biological perspective. In contrast, semilandmarks are defined by mathematical and algorithmic convenience; their equivalence across specimens is determined by a computer algorithm seeking similar topographic features, not prior biological knowledge [39]. This core difference is the root cause why the coordinates of a single semilandmark cannot be interpreted in the same way as a landmark. As one study forcefully reiterates, "the coordinates of semilandmarks along the surface are meaningless, and one cannot interpret the position of single semilandmarks, only the surface geometry that all semilandmarks describe together" [40].
This guide systematically compares different semilandmarking approaches, providing the experimental data and protocols needed for researchers to understand their trade-offs. We frame this within the critical thesis that all semilandmarking methods estimate homology with an unknown degree of error, and subsequent analyses should be treated as approximations requiring cautious interpretation [39].
Comparative Analysis of Semilandmarking Methods
Different algorithms for placing semilandmarks produce different point locations, which in turn lead to divergent statistical results and shape visualizations [39]. The table below summarizes the core characteristics of three major approaches.
Table 1: Key Semilandmarking Approaches for Surface Data
| Method | Core Principle | Requires Landmarks? | Reported Consistency | Key Considerations |
|---|---|---|---|---|
| Sliding Semilandmarks (TPS) | Slides points to minimize bending energy or Procrustes distance relative to a reference [20]. | Yes | High, especially with dense true landmarks [40]. | Most common in biology; results are sensitive to the choice of sliding criterion (BE vs. PD) [20]. |
| Rigid Registration (LS&ICP) | Uses Least-Squares and Iterative Closest Point algorithms for rigid alignment [40]. | Yes | Lower; can project points to different anatomical features [39]. | Fast but may perform poorly with large shape differences [39]. |
| Non-Rigid Registration (TPS&NICP) | Combines Thin-Plate Spline initial warping with Non-rigid ICP for finer alignment [40]. | Yes | High; similar to sliding TPS [40]. | More computationally intensive but can handle greater shape variation. |
The performance of these methods was empirically assessed using two datasets: ape crania and human head surfaces [40]. Analyses revealed that while the sliding TPS and TPS&NICP approaches yielded more similar results, the LS&ICP approach often produced divergent outcomes [40]. This provides strong evidence that the investigator's choice of algorithm directly influences the resulting map of point correspondences.
Experimental Evidence: How Methods Influence Results
The theoretical differences between methods manifest in concrete analytical outcomes. A prior study systematically compared the three approaches outlined in Table 1, analyzing their effects on estimates of mean shape, allometric scaling, and the distribution of shape variation [40]. The findings form a core part of the rationale for treating single coordinates with caution.
Experimental Protocols and Workflow
The general workflow for a comparative semilandmark study involves data acquisition, template selection, application of different semilandmarking methods, and statistical comparison of the outcomes.
Table 2: Key Experimental Protocol Steps for Method Comparison
| Step | Action | Details from Cited Studies |
|---|---|---|
| 1. Data Preparation | Acquire surface meshes (e.g., via 3D scanning). | Studies used surface scans of human heads and ape crania [40]. |
| 2. Landmarking | Manually identify a set of true homologous landmarks on all specimens. | These landmarks serve as fixed control points to guide subsequent semilandmarking [39]. |
| 3. Template Selection | Choose a template specimen. | In landmark-free methods, the template is often the specimen with the greatest geometric similarity to the sample [39]. |
| 4. Apply Methods | Transfer semilandmarks from the template to all targets using different algorithms. | Applied sliding TPS, LS&ICP, and TPS&NICP to the same dataset [40]. |
| 5. Statistical Analysis | Perform GM analyses (Procrustes fit, PCA) on the resulting landmark+semilandmark configurations. | Compared Procrustes distances, estimates of mean configurations, and principal components (PCs) [39] [40]. |
| 6. Surface Visualization | Warp a template surface to the estimated mean and allometrically scaled configurations. | Compared the resulting visualised surfaces to assess practical differences [40]. |
The following diagram illustrates the logical flow of a method comparison experiment, from data input to the interpretation of results.
Quantitative Findings from Comparative Studies
The application of the above protocol yielded clear, quantitative differences. A pivotal finding was the low correlation between the first principal component (PC) axes obtained from different sliding criteria (Bending Energy vs. Procrustes Distance) in the analysis of human molars and facial data [20]. This indicates that the primary axis of shape variation identified in a dataset is not stable across methodological choices.
Furthermore, when surfaces were warped to the mean shapes derived from different methods, the resulting meshes were not identical [40]. While they shared broad similarities, differences in detail were present. This has direct implications for practical applications, such as using an average surface as a clinical reference or for functional analysis [40]. The takeaway is that visualizations are approximations, and their fidelity depends on the semilandmarking technique.
The Scientist's Toolkit: Essential Research Reagents
Selecting appropriate tools is critical for robust shape analysis. The table below details key "research reagents" and methodological components in the semilandmarking workflow.
Table 3: Essential Reagents and Tools for Semilandmark-Based Research
| Tool / Component | Function | Examples & Notes |
|---|---|---|
| True Landmarks | Provide fixed, biologically homologous control points to guide semilandmark placement. | Crucial for all landmark-driven methods; quality and coverage significantly impact results [40]. |
| Template Specimen | Serves as the source from which semilandmarks are transferred to all other target specimens. | Should have high geometric similarity to the sample to minimize projection error [39]. |
| Sliding Algorithm | Removes spurious tangential variation along curves or surfaces after initial placement. | Minimizing Bending Energy or Procrustes Distance are the two main criteria, with different outcomes [20]. |
| Registration Software | Automates the process of aligning templates to targets and transferring semilandmarks. | Packages include auto3dgm (rigid) [39] and implementations of NICP (non-rigid) [40]. |
| Geometric Morphometrics Software | Performs core statistical analyses like Procrustes superimposition and PCA. | Standard tools include MorphoJ, and the R package geomorph. |
The empirical evidence is clear: the specific locations of semilandmarks are a function of the algorithm used to place them. Consequently, the coordinates of a single semilandmark are not interpretable [40]. Researchers should instead focus on the collective geometry of the entire set of landmarks and semilandmarks that define a curve or surface [40].
The consistency of results from non-rigid approaches like sliding TPS and TPS&NICP is encouraging, suggesting these methods are preferable for studies aiming to describe biological transformations [40]. However, all semilandmarking approaches estimate homology with an unknowable error. Therefore, the results of any subsequent statistical analysis should be treated as an approximation of reality [39].
Future work should focus on establishing best practices for reporting methodological choices, such as semilandmark density and sliding criteria, and further investigating the impact of these choices on functional simulations. By acknowledging the inherent limitations of semilandmarks and making informed methodological choices, researchers can confidently use these powerful tools to uncover meaningful patterns in shape variation.
Benchmarking Performance: Validation Studies and Comparative Efficacy
Landmark-based geometric morphometrics (GM) is essential for quantifying biological shape variation in evolutionary and developmental studies [40]. However, the analysis of complex morphological structures, such as the great ape cranium, is often limited by the sparse number of anatomically homologous landmarks that can be reliably identified and placed by human experts [5] [1]. To overcome this limitation, semi-landmark methods have been developed to densely sample and analyze curves and surfaces between traditional landmarks, thereby capturing richer shape information from smooth anatomical regions [5] [75].
This case study objectively compares the performance of three semi-landmarking approaches—Patch, Patch-TPS, and Pseudo-landmark sampling—for discriminating cranial morphology across three species of great apes: Pan troglodytes (chimpanzee), Gorilla gorilla (gorilla), and Pongo pygmaeus (orangutan) [5]. We evaluate these methods based on their ability to accurately estimate population average templates, their robustness to noise and missing data, and their computational practicality, providing researchers with a guide for selecting appropriate methodologies for shape discrimination research.
Experimental Setup and Methodologies
Specimen Data and Initial Landmarking
The study utilized DICOM stacks of cranial specimens from three great ape species: Pan troglodytes (N=11), Gorilla gorilla (N=22), and Pongo pygmaeus (N=18), housed in the skeletal collection of the National Museum of Natural History (NMNH) [5]. Manual anatomical landmarks were initially placed on each specimen by an expert using 3D Slicer, an open-source biomedical visualization platform [5]. These manually defined landmarks served as the foundational homologous points upon which the various semi-landmarking strategies were implemented. All subsequent methods were performed using publicly available tools within the SlicerMorph extension for 3D Slicer, ensuring reproducibility and open science practices [5].
Compared Semi-Landmarking Strategies
The core of this comparison involves three distinct strategies for generating dense point correspondences on 3D surface meshes.
Table 1: Overview of Semi-Landmarking Strategies
| Method Name | Core Principle | Homology Relationship | Template Dependency |
|---|---|---|---|
| Patch-based | Projects points from triangular grids defined by 3 manual landmarks onto the specimen surface [5]. | Direct geometric relationship to manual landmarks [5]. | Specimen-independent. |
| Patch-TPS | Transfers a single template's semi-landmarks to specimens via Thin-Plate Spline (TPS) warp and normal projection [5]. | Transferred from template via TPS transformation [5]. | Dependent on a single template. |
| Pseudo-landmark | Samples points regularly from a template mesh and projects them to specimens via TPS and normal vectors [5]. | Automatically placed with no guaranteed biological homology [5]. | Dependent on a single template. |
Performance Evaluation Protocol
To quantitatively evaluate the performance of each landmarking strategy, the study employed a standardized validation protocol. The shape information captured by each method (manual landmarks plus the generated semi- or pseudo-landmarks) was used to estimate a thin-plate spline (TPS) transform between each individual specimen and the population average template [5]. The accuracy of this transform was quantified by computing the average mean root squared error (MRSE) between the transformed individual mesh and the template mesh. Lower MRSE values indicate a more accurate estimation of the population mean shape, reflecting the effectiveness of the landmark set in capturing the overall morphological configuration [5].
Comparative Performance Results
Quantitative Shape Estimation Accuracy
All three dense sampling strategies successfully produced shape estimations of the population average templates that were, on average, comparable to or exceeded the accuracy achieved by using manual landmarks alone, while simultaneously providing a much denser representation of form [5].
Table 2: Performance Comparison of Landmarking Strategies
| Landmarking Strategy | Shape Estimation Accuracy (Avg. MRSE) | Robustness to Noise/Missing Data | Computational Considerations |
|---|---|---|---|
| Manual Landmarks Alone | Baseline for comparison [5]. | Not directly assessed. | Low density, limited shape information [5]. |
| Patch-based | Comparable or better than manual baseline [5]. | Low; demonstrated high sensitivity, resulting in outliers with large deviations [5]. | Computationally expensive; sensitive to mesh geometry and noise [5]. |
| Patch-TPS | Comparable or better than manual baseline [5]. | High; provided robust performance [5]. | Improved robustness over patch method [5]. |
| Pseudo-landmark | Comparable or better than manual baseline [5]. | High; provided robust performance [5]. | Offers consistent point spacing and sample coverage [5]. |
Trade-offs and Methodological Considerations
The comparison reveals critical trade-offs that researchers must consider. The Patch method, while providing a direct geometric interpretation for each semi-landmark, is highly sensitive to data quality. Noise, sharp curves, or holes in the mesh can lead to projection errors, such as sampling an interior surface [5]. In contrast, the template-based methods (Patch-TPS and Pseudo-landmarks) offer greater robustness and consistency, as they transfer points from a standardized template, reducing the impact of individual specimen surface imperfections [5]. A broader methodological review confirms that while different semi-landmarking approaches can yield consistent results, they are not identical, and their outcomes should be interpreted as approximations of true biological form [40] [1].
The Researcher's Toolkit: Essential Materials and Software
Successfully implementing these geometric morphometric workflows requires a suite of specialized software tools and resources.
Table 3: Essential Research Tools and Resources
| Tool/Resource | Function | Relevance to the Protocol |
|---|---|---|
| 3D Slicer | An open-source platform for medical image informatics, visualization, and analysis [5]. | Primary software environment for data handling, visualization, and analysis. |
| SlicerMorph | An extension of 3D Slicer for morphology and morphometrics [5]. | Provides the specific tools and algorithms for placing landmarks and semi-landmarks. |
| DICOM Stack | The standard format for storing and transmitting medical imaging data [5]. | Raw data format for the 3D cranial volumes. |
| Triangular Surface Mesh | A 3D model represented as a set of connected triangles. | The surface geometry onto which landmarks and semi-landmarks are projected. |
| Thin-Plate Spline (TPS) | A geometric transformation used for smooth interpolation of spatial deformations [5]. | Core to the Patch-TPS and Pseudo-landmark methods, and for evaluating template estimation error. |
Workflow Visualization
The following diagram illustrates the logical workflow and decision process for selecting and applying the semi-landmarking methods discussed in this case study.
This case study demonstrates that supplementing traditional landmarks with semi- or pseudo-landmarks significantly enhances the density of shape information available for discriminating great ape cranial morphology. The choice of method involves a direct trade-off between biological interpretability, computational robustness, and practical efficiency.
The Patch-based method offers the most straightforward biological interpretation due to the direct relationship between semi-landmarks and the manual landmarks that define the patches. However, this comes at the cost of sensitivity to data quality. For studies with high-quality, clean meshes and a focus on interpreting specific anatomical regions, this method remains a valid choice. In contrast, the Patch-TPS and Pseudo-landmark methods excel in robustness, making them suitable for larger datasets or data with inherent imperfections, such as those derived from fossil specimens or clinical populations [5]. The Pseudo-landmark approach, in particular, provides excellent coverage and consistent spacing, which is valuable for capturing overall form without being constrained by the availability of manual landmarks [5].
In summary, while all three automated strategies are viable for enriching shape analysis, the template-based methods (Patch-TPS and Pseudo-landmarks) generally offer a more reliable and robust workflow for comparative morphological studies, especially when analyzing diverse species with substantial shape variation. Researchers should select their method based on the specific aims of their study, the quality of their data, and the importance of direct landmark interpretability versus overall shape coverage and analysis robustness.
Geometric morphometric methods have become a cornerstone for classifying organisms and discriminating between groups based on biological shape. When analyzing curves or outlines—such as the rectrices (tail feathers) of birds—researchers often employ semi-landmark methods to capture shape information where traditional landmarks are scarce. This case study examines a foundational investigation that compared different outline-based methods for classifying age-related differences in feather shape within a single bird species, the ovenbird (Seiurus aurocapilla). The original research, pivotal in the field of geometric morphometrics, systematically evaluated the performance of semi-landmark alignment techniques and data acquisition protocols alongside a novel method for dimensionality reduction. Framed within the broader thesis of comparing semi-landmark methods for shape discrimination, this analysis delves into the experimental protocols, findings, and practical recommendations from the study, providing a template for the application of these methods in contemporary research across paleontology, evolutionary biology, and beyond [14] [76] [77].
Experimental Protocols and Methodologies
Biological Sample and Data Acquisition
The foundational experiment utilized rectrices from ovenbirds, a species chosen due to documented, albeit subtle, differences in tail feather shape between birds under one year old and older adults. Experienced bird banders can often visually discriminate these age categories based on rectrix tip shape, with adults typically exhibiting a more truncate shape compared to young birds [14] [77]. Several approaches to digitizing points along the feather outlines were rigorously compared [14] [77]:
- Manual Curve Tracing: This involved an operator densely sampling at least 200 points around the feather outline by hand, which were subsequently reduced to a desired number for analysis. This method was noted for its speed and flexibility.
- Template-Based Digitization ("Fan" Method): A software tool was used to plot a fan of equally-spaced radii from a central point. Points were digitized at the intersections of these radii and the feather outline.
- Automatic Edge Detection: This automated approach was explored but found to have limitations for the specific feather data in this study, often requiring manual intervention.
Semi-Landmark Processing and Alignment
Following digitization, the coordinate data representing the outlines were processed using standard geometric morphometric protocols. A Generalized Procrustes Analysis (GPA) was first applied to remove the effects of scale, rotation, and translation [77]. Subsequently, two distinct semi-landmark alignment algorithms were implemented to refine the point correspondences along the curves [14] [77]:
- Bending Energy Minimization (BEM): This algorithm aligns semi-landmarks by iteratively sliding them along the curve to minimize the bending energy of the thin-plate spline transformation relative to a consensus configuration. This method emphasizes a global fit of the shape transformation.
- Perpendicular Projection (PP): This method operates by removing shape variation tangent to the curve. It projects semi-landmarks onto the mean shape in a direction perpendicular to the outline, effectively focusing on a local fit.
Dimensionality Reduction for Canonical Variates Analysis (CVA)
A significant methodological innovation in this study was the introduction of a new approach to dimensionality reduction, a necessary step before applying CVA to high-dimensional outline data with modest sample sizes. The researchers compared three methods [14] [77]:
- Fixed Number of PC Axes: The standard approach of using a fixed number of Principal Component (PC) axes, typically all axes with non-zero eigenvalues.
- Partial Least Squares (PLS) Method: This method utilizes the covariance between the shape measurements and a classification matrix to generate axes for the CVA.
- Variable Number of PC Axes (Novel Method): This approach involved calculating cross-validation assignment rates for a range of different numbers of PC axes. The number of axes that yielded the highest cross-validation rate of correct assignments was selected for the final CVA, thereby optimizing the classification performance and mitigating overfitting.
The entire experimental workflow, from specimen preparation to final classification, is visualized in the diagram below.
Performance Comparison of Semi-Landmark Methods
Quantitative Results and Classification Performance
The core of the study's findings lies in the comparative performance of the different methodological choices. The results demonstrated a remarkable robustness of classification outcome to the specific details of data acquisition and alignment. The key quantitative findings are summarized in the table below.
Table 1: Comparison of Methodological Performance in Feather Shape Classification
| Methodological Aspect | Options Compared | Performance Outcome | Key Finding |
|---|---|---|---|
| Data Acquisition [77] | Manual Tracing vs. Fan-Based | Roughly equal classification rates | Manual tracing was faster and more flexible than the fan-based method. |
| Semi-Landmark Alignment [14] [77] | Bending Energy (BEM) vs. Perpendicular Projection (PP) | Roughly equal classification rates | BEM showed higher variation in repeated measures with fan-digitized data. |
| Shape Analysis Method [14] | Semi-Landmarks vs. Elliptical Fourier vs. Extended Eigenshape | Roughly equal classification rates | No single mathematical representation was superior for this task. |
| Point Density [14] [77] | Varying number of points representing the curve | Little impact on results | Discrimination was not dependent on the number of points used. |
| Dimensionality Reduction [14] [77] | Fixed PC Axes vs. PLS vs. Variable PC Axes (Novel) | Highest cross-validation rate with the novel variable method | The fixed-PC approach led to overfitting; the novel method optimized generalizability. |
The data reveals that the choice of dimensionality reduction approach was a more critical factor for achieving high classification accuracy than the choice of semi-landmark alignment or data acquisition method. The novel variable PC axes method successfully produced higher cross-validation assignment rates than the other two approaches, which is crucial for ensuring the discriminant model's generalizability beyond the training set [14] [77]. Furthermore, the classification rates achieved by these geometric morphometric methods were comparable to the assessment of an experienced bird bander, validating their practical utility [77].
Comparative Workflow of Semi-Landmark Alignment Algorithms
To elucidate the two semi-landmark alignment methods tested in the study, the following diagram details their distinct algorithmic workflows following initial Procrustes alignment.
The Scientist's Toolkit: Essential Research Reagents and Materials
The reliable execution of a geometric morphometric study, such as the one described, depends on a suite of methodological "reagents"—both physical and computational. The following table details the key components essential for research in this domain.
Table 2: Essential Research Reagents and Materials for Outline-Based Morphometrics
| Item / Solution | Function / Purpose | Application Note |
|---|---|---|
| High-Resolution Scanner / Camera | To capture high-fidelity digital images of specimens for outline analysis. | Ensures accurate and reproducible digitization of curves; critical for automated edge detection. |
| Digitizing Software | To record 2D or 3D coordinates from digital images (e.g., tpsDig2). | Supports manual landmarking, curve tracing, and template-based digitization. |
| Geometric Morphometrics Software Suite | To perform Procrustes alignment, semi-landmark sliding, and statistical shape analysis (e.g., MorphoJ, geomorph R package). | Essential for implementing BEM, PP, and other alignment algorithms in a standardized environment. |
| Statistical Computing Environment | To conduct custom analyses, dimensionality reduction, and CVA (e.g., R, Python with SciPy). | Provides the flexibility needed to implement novel methods, such as the variable PC axis approach for CVA. |
| Curated Specimen Collection | A well-documented set of biological samples with known attributes (e.g., age, species). | Serves as the ground truth for training and validating classification models; voucher specimens are ideal. |
This case study underscores a critical finding for researchers employing semi-landmark methods: discrimination between biological groups can be robust to changes in specific data acquisition and alignment protocols. For the classification of age-related differences in ovenbird feathers, no single outline analysis method demonstrated clear superiority. The semi-landmark methods (BEM and PP) performed effectively and on par with other mathematical representations like elliptical Fourier analysis [14] [77].
The primary methodological insight is the importance of the dimensionality reduction strategy preceding CVA. The novel approach of using a variable number of PC axes, selected to optimize the cross-validation assignment rate, proved superior to both fixed-PC and PLS-based methods. This highlights the risk of overfitting when using high-dimensional outline data with limited samples and provides a data-driven solution to enhance the reliability of statistical inferences [14] [77].
From a practical standpoint, manual curve tracing is recommended over template-based methods due to its greater speed and flexibility [77]. While the choice between BEM and PP may be context-dependent, their equivalent performance in this classification task allows researchers to select based on other criteria, such as the desired properties of the shape transformation (global vs. local fit). Overall, this research provides a validated experimental framework and a set of robust tools for conducting shape discrimination research using semi-landmarks, reinforcing their value in the quantitative biologist's toolkit.
Discriminating carnivore agents through tooth marks on bones is a central challenge in taphonomy, crucial for interpreting site formation processes, hominin-carnivore interactions, and broader ecological dynamics in archaeopaleontological contexts [78] [79]. Traditional methods relying on tooth mark dimensions and frequencies often face challenges of equifinality, where different carnivores produce morphologically similar marks [79]. This case study examines the application of geometric morphometric (GMM) and computer vision (CV) methods to tooth score morphology analysis, evaluating their performance within a broader thesis comparing semi-landmark methods for shape discrimination research. We provide a structured comparison of these approaches, summarizing their experimental protocols, quantitative performance, and implementation requirements to guide researchers in selecting appropriate methodologies.
Methodological Comparison: Geometric Morphometrics vs. Computer Vision
The table below summarizes the core characteristics and performance of the two primary methodological approaches for tooth score analysis.
Table 1: Comparison of Methodological Approaches for Carnivore Discrimination via Tooth Scores
| Aspect | Geometric Morphometric (GMM) Methods | Computer Vision (CV) Methods |
|---|---|---|
| Core Principle | Landmark/semi-landmark based shape quantification [79] | Deep Learning models, including Convolutional Neural Networks (CNN) and Few-Shot Learning (FSL), for image analysis [28] |
| Data Input | 2D cross-sectional profiles or 3D digital models of scores [79] | Standardized 2D images of tooth marks (pits and scores) [78] |
| Key Strength | Direct, biologically-informed shape characterization [79] | High classification accuracy; handles large sample sizes efficiently [28] [78] |
| Primary Limitation | Limited discriminant power in 2D (<40%); subjective landmark selection [28] [79] | Limited application to taphonomically altered fossil marks [28] |
| Reported Accuracy | Useful for family-level discrimination (e.g., felids vs. hyenids) [79] | 88% accuracy for taxon-specific agency [78] |
| Sample Size Consideration | Requires careful sampling to capture morphological variance [28] | Effective with large image datasets (>1200 marks) [78] |
Experimental Protocols
Geometric Morphometric Workflow
The GMM protocol involves a detailed sequence from sample preparation to statistical analysis, focusing on capturing the morphology of tooth score cross-sections.
Table 2: Key Research Reagents and Solutions for Tooth Morphology Analysis
| Item | Function | Specific Example / Specification |
|---|---|---|
| Optical Scanner | High-resolution 3D model generation of dental material or tooth marks. | Sinergia Scan Advanced Plus (5 μm accuracy) [80] |
| Digital Microscope | Capture high-quality 2D/3D images of tooth marks with stacked focus. | Leica Emspira 3 digital microscope [78] |
| Photogrammetry Software | Create precise 3D models from multiple photographs of a specimen. | GRAPHOS (inteGRAted PHOtogrammetric Suite) [79] |
| Geometric Morphometrics Software | Place landmarks, perform Generalized Procrustes Analysis (GPA), and statistical shape analysis. | Viewbox [80]; MorphoJ [81] |
| Computer Vision Framework | Train and deploy deep learning models for image classification. | Deep Convolutional Neural Networks (DCNN); Few-Shot Learning (FSL) models [28] |
- Sample Creation & Selection: Tooth scores are generated experimentally using carnivores in captivity (e.g., spotted hyenas, lions) fed on defleshed long bones of ungulates like deer or cow [78] [79]. Conspicuous scores on long bone shafts are selected for analysis.
- 3D Data Acquisition: The bone or tooth is digitized using high-precision scanners or photogrammetry. For photogrammetry, 13-16 images per score are taken with a digital camera (e.g., Canon EOS 700D) and macro lenses. These are processed in software like GRAPHOS to generate precise 3D models [79].
- 2D Profile Extraction: The 3D model is imported into software such as Global Mapper to extract 2D cross-sectional profiles of the tooth scores, typically at the mid-length point of the mark [79].
- Landmarking: The 2D profiles are analyzed using specific landmark protocols:
- Seven-Landmark Method: This established method places landmarks at consistent points along the score profile's outline, often including the deepest point [79].
- Semi-Landmark Models: To mitigate potential sampling bias, curves between landmarks can be digitized using semi-landmarks, which are subsequently allowed to "slide" along tangents or surfaces to minimize bending energy, making them geometrically comparable across specimens [80] [79].
- Data Analysis: The landmark coordinate data is processed using a Generalized Procrustes Analysis (GPA) to remove differences in position, rotation, and scale [81]. The resulting Procrustes coordinates, which represent pure shape, are then analyzed with multivariate statistics like Canonical Variates Analysis (CVA) to determine if shapes can be classified by carnivore group [79].
Computer Vision Workflow
The CV approach leverages machine learning for automated classification, differing significantly from the landmark-based GMM methods.
- Image Library Creation: A large bank of tooth mark images is compiled. Modern studies use digital microscopes (e.g., Leica Emspira 3) to capture color photographs with variable magnification, employing focus stacking to ensure the entire mark is in sharp detail [78].
- Data Standardization and Augmentation: Images are standardized. The dataset, which includes both tooth pits and scores, is often expanded using "image augmentation" techniques (e.g., rotating, flipping) to increase the effective sample size and improve model robustness [78].
- Model Training: The image dataset is used to train Deep Learning models, such as Convolutional Neural Networks (CNNs). These models automatically learn diagnostic features from the pixels of the images without requiring manual landmarking [28] [78].
- Classification and Validation: The trained model is used to classify tooth marks from test sets. Performance is evaluated based on classification accuracy against the known agents. Validation tests are crucial, sometimes involving hold-out samples not used during training [78].
The following diagram illustrates the core workflows and their performance outcomes for both methods.
This analysis demonstrates a clear trade-off between the interpretability of GMM and the classification power of CV for carnivore discrimination. GMM provides a transparent, shape-focused analysis but shows limited discriminant power in 2D applications, successfully separating carnivore families but struggling with species-level identification [79]. The subjective selection of score cross-sections and landmarks introduces a potential bias, and the method is sensitive to sampling the full range of tooth mark allometry [28].
In contrast, CV methods, particularly Deep Learning, achieve high accuracy by automatically learning diagnostic features from entire images, bypassing the limitations of manual landmarking [28] [78]. A significant limitation of CV is its performance on fossil records, where bone surface modifications undergo post-depositional alterations, confounding models trained on experimental marks [28]. Future research should focus on 3D topographical analyses for both GMM and CV, which promise to resolve current interpretive challenges by leveraging more complete morphological information [28]. For researchers, the choice between methods depends on the research question: GMM for hypothesis-driven shape analysis and CV for maximum classification performance on well-preserved specimens.
Geometric morphometrics (GM) relies on the precise capture of biological form to investigate questions in evolution, development, and systematics. While traditional landmarks defined by homologous points are the gold standard, many biological structures are characterized by smooth curves and surfaces with few such discrete points [1]. To address this, semi-landmark methods have been developed to densely sample and analyze these forms. However, the choice of sampling strategy introduces methodological variability that can directly impact the quantification of shape differences and the statistical power to classify specimens [1] [5].
This guide objectively compares the performance of predominant semi-landmark approaches, framing the comparison within a broader thesis on method selection for shape discrimination research. We focus on two core performance metrics: Mean Shape Error, which measures the accuracy of shape reconstruction, and Classification Rates, which assess the power to discriminate between groups. For researchers and drug development professionals, where subtle morphological changes may indicate treatment effects or pathological states, understanding these performance trade-offs is critical for robust experimental design and valid interpretation of results.
Semi-landmarks are algorithmically placed points that capture the geometry of curves and surfaces between traditional landmarks. Their placement is not based on developmental or evolutionary homology but on mathematical correspondence, which varies by method [1]. The following are key approaches used in the field.
Landmark-Driven Sliding Semilandmarks: This is a classical GM approach. Semilandmarks are placed on a template specimen and then slid along tangents to curves or surfaces to minimize either bending energy or Procrustes distance, thus removing the arbitrary component of their initial placement [1]. This method requires a set of true landmarks as anchors.
Patch-Based Sampling: This method defines regions of interest on a specimen using a set of three manually placed landmarks to form a triangular patch. A uniform grid of points within this triangle is then projected onto the actual specimen surface along a calculated vector. This approach provides a direct geometric relationship between semilandmarks and the defining landmarks and can be applied to each specimen independently [5].
Patch-Based with Thin-Plate Spline (TPS) Warping: This hybrid method combines the patch-based approach with a TPS transformation. A set of semilandmarks is generated on a single template specimen using the patch method. These points are then transferred to each target specimen in a dataset by first warping the template to the target using a TPS transformation defined by their shared manual landmarks. The semilandmarks are subsequently projected onto the target mesh [5]. This improves robustness against noise and missing data compared to the standard patch method.
Pseudo-Landmark Sampling: This landmark-free algorithm automatically generates a dense set of points regularly sampled across a template model's surface, with no direct geometric relationship to the original landmarks. These points are projected to the external surface, and a spatial filter enforces a minimum distance between them. The pseudo-landmarks are then transferred to each sample via TPS warping and projection [5]. This method maximizes coverage but relaxes the requirement for homology.
Non-Rigid Iterative Closest Point (NICP) & Other Landmark-Free Algorithms: Several other algorithms from computer vision, such as NICP and coherent point drift (CPD), establish dense point correspondences by non-rigidly registering a template surface to each target. These methods can be sensitive to initial alignment and may project points to different anatomical features on specimens with large shape differences, as they lack the control of biological landmarks [1].
The table below summarizes the core characteristics of these methods.
Table 1: Key Characteristics of Semi-Landmarking Methods
| Method | Requires Landmarks? | Underlying Principle | Point Homology | Primary Advantage |
|---|---|---|---|---|
| Sliding Semilandmarks [1] | Yes | Minimization of bending energy/Procrustes distance | Estimated via sliding | Standard in GM; removes arbitrary placement |
| Patch-Based [5] | Yes | Geometric projection from triangular patches | Defined by patch geometry | Applicable to individual specimens |
| Patch-TPS [5] | Yes | TPS warping & projection from a template | Defined by template warping | Robust to noise and missing data |
| Pseudo-Landmark [5] | No (uses template) | Regular sampling & spatial filtering | Approximate, not homologous | High, uniform surface coverage |
| NICP/CPD [1] | No | Non-rigid surface registration | Algorithmic, may be inaccurate | Fully automated |
Experimental Protocols for Performance Quantification
To objectively compare these methods, standardized experimental protocols are essential. The following workflows and metrics are commonly used in the literature to assess performance.
Workflow for Assessing Shape Discrimination
The following diagram illustrates a generalized experimental workflow for a shape analysis study designed to compare methodological performance.
Quantifying Mean Shape Error
Mean Shape Error evaluates the fidelity with which a set of landmarks and semilandmarks can represent the true shape of a specimen. A common protocol involves estimating the transformation between an individual specimen and a population average template (e.g., the Procrustes consensus shape). The average mean root squared error (MRSE) between the transformed mesh and the template is then calculated, providing a quantitative measure of representation accuracy [5]. Lower MRSE values indicate a more accurate shape representation.
Quantifying Classification Rates
Classification Rates measure a method's power to correctly assign specimens to their known groups (e.g., species, age classes, treatment groups) based on shape. This is typically evaluated using Canonical Variates Analysis (CVA) followed by cross-validation [14].
- CVA: Finds the axes that maximize separation between pre-defined groups.
- Cross-Validation: To avoid overfitting and obtain a realistic performance estimate, a "leave-one-out" or similar procedure is used. One specimen is removed, the CVA is computed on the remaining training set, and the left-out specimen is classified. This repeats for all specimens [14]. The cross-validation rate is the percentage of correct assignments.
It is critical to optimize the number of principal component (PC) axes used in the CVA, as using too many can lead to overfitting and an artificially high resubstitution rate but a low cross-validation rate. The optimal number of PC axes is the one that maximizes the cross-validation assignment rate [14].
Table 2: Core Performance Metrics and Their Interpretation
| Metric | Experimental Protocol | Interpretation |
|---|---|---|
| Mean Shape Error (e.g., MRSE) | Calculate the average root squared error between a specimen transformed to the template and the template itself [5]. | Lower values indicate superior accuracy in representing the true biological form. |
| Classification Rate (Resubstitution) | Perform CVA and classify all specimens used to build the model. | Prone to over-optimism (overfitting); should be interpreted with caution [14]. |
| Classification Rate (Cross-Validation) | Perform a leave-one-out CVA, where each specimen is classified by a model built from all other specimens [14]. | A robust measure of a method's predictive power and generalizability for discrimination tasks. |
Performance Data and Comparative Analysis
Empirical comparisons reveal that the choice of semi-landmarking method significantly impacts research outcomes.
Quantitative Performance Comparison
A study on great ape crania compared manual landmarks alone against three dense sampling strategies: Patch, Patch-TPS, and Pseudo-landmarks. The results, measured by the ability to accurately estimate a population average template, are summarized below.
Table 3: Performance Comparison of Dense Sampling Strategies on Great Ape Crania [5]
| Method | Mean Shape Estimation Accuracy (Relative to Manual Landmarks) | Robustness to Noise & Missing Data |
|---|---|---|
| Manual Landmarks Alone | Baseline | N/A |
| Patch-Based | Comparable or exceeded manual baseline | Low (resulted in outliers with large deviations) |
| Patch-TPS | Comparable or exceeded manual baseline | High |
| Pseudo-Landmark | Comparable or exceeded manual baseline | High |
This study concluded that while all three automated strategies increased shape information density, the Patch method was sensitive to noise. In contrast, Patch-TPS and Pseudo-landmarking provided more robust performance [5].
Consistency and Interpretation of Results
A broader comparison of semi-landmarking approaches highlights important consistencies and caveats. Analyses using different semilandmarking approaches can produce different statistical results due to variations in point placement [1]. However, non-rigid semilandmarking approaches tend to be more consistent with each other [1]. Critically, the use of semilandmarks generally increases the density of shape information, but the results should be considered as approximations of reality that require cautious interpretation [1]. The table below synthesizes key trade-offs.
Table 4: Methodological Trade-offs in Semi-Landmarking
| Factor | Impact on Analysis & Interpretation |
|---|---|
| Choice of Algorithm | Different algorithms (e.g., sliding vs. NICP) produce different semilandmark locations, leading to potential differences in patterns of variation and covariation [1]. |
| Point Density | The density and locations of sampling points affect results; the optimal density is a trade-off between capturing detail and managing computational complexity [1]. |
| Template Choice | In template-based methods (e.g., Patch-TPS, auto3dgm), the choice of template influences the resulting point correspondences, especially with large shape differences [1]. |
| Dimensionality Reduction | The approach to reducing dimensionality (e.g., number of PC axes) before CVA significantly impacts cross-validation classification rates [14]. |
The Researcher's Toolkit: Essential Materials and Reagents
For researchers embarking on a geometric morphometric study involving semi-landmarks, the following tools and concepts are essential.
Table 5: Essential Research Reagents and Solutions for Semi-Landmark Analysis
| Item / Solution | Function / Purpose |
|---|---|
| 3D Surface Meshes | The raw data; digital representations of the biological specimens under study (e.g., from CT or laser scanners). |
| Manually Placed Landmarks | Gold-standard homologous points providing biological correspondence and guiding semilandmark placement [1] [5]. |
| Software for GM Analysis | Platforms like R (Morpho, geomorph), 3D Slicer (SlicerMorph), and others for digitizing, sliding, and statistical analysis [5]. |
| Template Specimen | A representative specimen used in methods like Patch-TPS and Pseudo-landmarks to transfer point sets to target specimens [5]. |
| Thin-Plate Spline (TPS) Transformation | A mathematical tool used for the interpolation and warping of surfaces, crucial for transferring semilandmarks from a template [1] [5]. |
| Generalized Procrustes Analysis (GPA) | The standard procedure for superimposing landmark configurations to remove the effects of position, orientation, and scale, isolating shape for analysis [1]. |
The quantitative comparison of Mean Shape Error and Classification Rates provides clear guidance for researchers selecting semi-landmark methods. While Patch-Based methods offer a direct link to landmark geometry, they can be less robust in the presence of data imperfections. Patch-TPS and Pseudo-landmark methods strike a favorable balance, offering high shape estimation accuracy comparable to or exceeding manual landmarks alone, coupled with strong robustness [5].
Ultimately, morphometric analyses using semilandmarks must be interpreted with the understanding that methodological choices introduce a source of variation. Results are best viewed as powerful approximations, and their biological interpretation should be tempered with methodological caution [1]. For shape discrimination research, employing cross-validated classification rates and optimizing dimensionality reduction are non-negotiable for generating reliable, generalizable results.
In shape discrimination research, particularly in biological and medical sciences, the analysis of form variation relies heavily on the precise quantification of surfaces. When investigating complex morphological structures, researchers often encounter regions with few identifiable homologous landmarks. To address this limitation, semi-landmark methods have been developed to densely match points between surfaces, enabling comprehensive shape analysis [39]. However, a critical methodological question remains: how consistent are the outputs generated by different semi-landmark approaches when applied to both mean and allometrically scaled surfaces? Allometric scaling—the study of how organismal shape changes with size—introduces additional complexity to shape comparisons, as the relationship between morphological features and size often follows non-linear, power-law principles [82] [83]. This comparison guide objectively evaluates the performance of leading semi-landmark methodologies, providing researchers with experimental data and protocols to inform their analytical choices in shape discrimination studies.
Key Concepts and Terminology
Semi-Landmark Approaches
Semi-landmarks are algorithmically placed points used to capture shape information from curves and surfaces lacking readily identifiable homologous landmarks. Unlike traditional landmarks, which represent developmentally or evolutionarily equivalent points, semi-landmarks establish point correspondences through mathematical algorithms rather than biological homology [39]. The placement of these points depends critically on the investigator's choice of algorithm, density parameters, and template selection, all of which can influence subsequent statistical analyses of shape variation and covariation.
Allometric Scaling Principles
Allometry examines how physiological, morphological, and life history traits scale with body size. These relationships are typically described by the power function Y = aW^b, where W represents body size, Y is the biological attribute, a is a constant, and b is the scaling exponent [82] [84]. For metabolic rate, the exponent b is approximately 0.75 across diverse mammalian species, though debate continues about the precise value and its underlying mechanisms [83]. In shape analysis, allometric scaling presents particular challenges because larger animals are not simply scaled-up versions of smaller ones; their proportions change predictably with size, necessitating careful statistical adjustment when comparing forms.
Comparative Analysis of Semi-Landmark Methods
Researchers employing geometric morphometrics have developed multiple approaches for handling semi-landmarks, each with distinct theoretical foundations and algorithmic implementations. The two most widely used criteria for sliding semi-landmarks are minimum bending energy (BE) and minimum Procrustes distance (D) [20]. The BE approach slides semi-landmarks to minimize the bending energy required to deform the reference outline to each specimen's outline, effectively assuming the contour results from the smoothest possible deformation of the reference. Conversely, the D method aligns semi-landmarks so each specimen's points lie along lines perpendicular to the curve passing through corresponding semi-landmarks on the reference form [20]. Beyond these established approaches, landmark-free methods such as Deterministic Atlas Analysis (DAA) based on Large Deformation Diffeomorphic Metric Mapping (LDDMM) have emerged, which quantify the deformation energy required to map a computed mean shape onto each specimen without relying on homologous landmarks [12].
Quantitative Performance Comparison
Table 1: Classification Performance of Semi-Landmark Methods Across Biological Structures
| Method | Biological Structure | Classification Rate | Statistical Test Performance | Notes |
|---|---|---|---|---|
| Bending Energy (BE) | Human molars | ~85% correct classification | Similar F-scores and P-values | Low correlation (r<0.5) with Procrustes Distance (PD) first PC axes |
| Procrustes Distance (PD) | Human molars | ~85% correct classification | Similar F-scores and P-values | Different estimates of within- and between-sample variation compared to BE |
| Bending Energy (BE) | Facial skeleton | High correct classification | - | Different ordination of groups along discriminant scores compared to PD |
| Procrustes Distance (PD) | Facial skeleton | High correct classification | - | Different estimates of within- and between-sample variation compared to BE |
| Perpendicular Projection | Feather outlines | Roughly equal to BEM | - | Comparable performance to Bending Energy Minimization |
| Bending Energy Minimization | Feather outlines | Roughly equal to PP | - | Performance not highly dependent on point number or acquisition method |
| Deterministic Atlas Analysis | Mammal crania | Comparable to manual | Varying phylogenetic signal estimates | Performance improved with Poisson surface reconstruction |
Table 2: Effect of Method Choice on Macroevolutionary Analyses (Mammal Crania Dataset)
| Analytical Metric | Manual Landmarking | DAA (Kernel Width: 40mm) | DAA (Kernel Width: 20mm) | DAA (Kernel Width: 10mm) |
|---|---|---|---|---|
| Phylogenetic Signal | Baseline estimate | Comparable but varying | Comparable but varying | Comparable but varying |
| Morphological Disparity | Baseline estimate | Similar patterns | Similar patterns | Similar patterns |
| Evolutionary Rates | Baseline estimate | Generally comparable | Generally comparable | Generally comparable |
| Control Points | N/A | 45 | 270 | 1,782 |
Methodological Consistency Analysis
The empirical evidence reveals both consistencies and divergences among semi-landmark methods. In studies comparing BE and PD approaches, researchers found similar overall classification rates and statistical significance values, suggesting general concordance in discriminative power [20]. For instance, in analyses of human molars and facial skeletons, both methods achieved approximately 85% correct classification, with similar F-scores and P-values in Goodall's F-test [20]. However, beneath these surface-level similarities lie important differences: the two criteria yield different estimates of within- and between-sample variation in Foote's measurement, show low correlation between their first principal component axes, and produce different ordinations of groups along discriminant scores [20]. These differences become particularly consequential when analyzing modern human populations, where morphological variation is inherently low [20].
Landmark-free approaches like DAA demonstrate promise for large-scale studies across disparate taxa due to enhanced efficiency, but show variable consistency with traditional landmarking. In a comprehensive study of 322 mammalian crania, DAA produced generally comparable but varying estimates of phylogenetic signal, morphological disparity, and evolutionary rates compared to manual landmarking [12]. The correlation between methods was significantly improved when using Poisson surface reconstruction to standardize mesh topology, highlighting the importance of data preprocessing for methodological consistency [12].
Experimental Protocols and Methodologies
Standardized Workflow for Method Comparison
Detailed Experimental Protocols
Data Acquisition and Preprocessing
For comparative analyses of semi-landmark methods, researchers should begin with high-quality 3D surface or image data. The imaging modality (CT scanning, surface scanning, or photographic images) should be consistent throughout a study, but when mixed modalities are unavoidable, apply Poisson surface reconstruction to create watertight, closed meshes for all specimens [12]. This standardization step significantly improves correspondence between shape patterns measured using different methods. For the initial template selection in landmark-free approaches like DAA, choose a specimen with greatest overall geometric similarity to sample members to minimize projection artifacts [12].
Semi-Landmark Placement and Alignment
For traditional semi-landmark approaches, digitize curves using either manual tracing, template-based digitization, or automated edge detection, as classification performance shows limited dependence on data acquisition method [14]. Place semi-landmarks along curves and surfaces, then apply alignment procedures using either bending energy minimization or Procrustes distance minimization criteria. For bending energy alignment, slide points to minimize the bending energy needed to produce the change in outline relative to the reference form. For Procrustes distance minimization, align semi-landmarks so they lie along lines perpendicular to the curve passing through corresponding points on the reference form [20]. For landmark-free DAA, generate control points through geodesic registration of an atlas shape to all specimens, then compute momentum vectors representing optimal deformation trajectories [12].
Allometric Scaling Analysis
After semi-landmark placement and alignment, conduct allometric scaling analysis to account for size-related shape changes. First, calculate centroid size for all specimens, then perform multivariate regression of shape coordinates (Procrustes coordinates) on centroid size [82]. Examine the regression residuals for patterns indicating allometric relationships. For comparative analyses of allometrically scaled surfaces, apply the allometric correction separately within each methodological approach before comparing outputs.
Output Comparison and Validation
To evaluate methodological consistency, compare the outputs of different semi-landmark approaches using multiple complementary techniques: Calculate Euclidean distances between mean shapes generated by different methods; Perform Mantel tests to assess correlation between Procrustes distance matrices; Use PROcrustes randomization TEST (PROTEST) to quantify agreement between shape configurations; Compare patterns of morphological disparity, phylogenetic signal, and evolutionary rates in downstream analyses [12]. For classification studies, use cross-validation rather than resubstitution estimates to avoid upwardly biased performance metrics [14].
Research Reagent Solutions
Table 3: Essential Tools for Semi-Landmark and Allometric Analysis
| Tool Category | Specific Software/Package | Primary Function | Application Context |
|---|---|---|---|
| Geometric Morphometrics | tpsDig2, tpsRelw | Digitize landmarks and perform basic shape analysis | General morphometric studies |
| Semi-Landmark Analysis | MorphoJ, EVAN Toolbox | Sliding semi-landmark analysis with BE and PD criteria | Comparative shape analysis |
| Landmark-Free Analysis | Deformetrica (DAA) | Atlas-based shape analysis without landmarks | Large-scale studies across disparate taxa |
| Surface Processing | MeshLab, CloudCompare | Poisson surface reconstruction and mesh standardization | Processing mixed modality datasets |
| Statistical Analysis | R (geomorph package) | Procrustes ANOVA, allometric analysis, phylogenetic comparisons | Comprehensive statistical shape analysis |
| Visualization | Landmark, Paraview | 3D shape visualization and deformation display | Interpreting and presenting results |
The comparative analysis of semi-landmark methods reveals a complex landscape of methodological consistency. While different approaches often produce broadly similar patterns of shape variation, significant differences emerge in the details of mean shape estimates and allometrically scaled surfaces. The bending energy and Procrustes distance criteria show similar classification performance but yield different estimates of within- and between-group variation, with potentially consequential effects when analyzing populations with low morphological variation [20]. Landmark-free approaches like DAA offer exciting possibilities for analyzing larger and more phylogenetically diverse datasets, but require careful attention to parameters like kernel width and initial template selection [12].
For researchers designing shape discrimination studies, several practical recommendations emerge from this comparison: First, select semi-landmark methods based on the specific biological question and taxonomic scope of the study, recognizing that no single approach performs optimally across all contexts. Second, standardize data preprocessing, particularly when using mixed imaging modalities, as this significantly improves methodological consistency. Third, when comparing allometrically scaled surfaces, apply size correction uniformly across methods and validate results using multiple statistical approaches. Finally, acknowledge that all semi-landmark analyses involve approximations, and interpret results with appropriate caution regarding potential methodological artifacts [39] [85].
As geometric morphometrics continues to evolve, future methodological development should focus on improving the biological interpretability of landmark-free approaches, establishing standardized validation frameworks, and creating hybrid methods that leverage the strengths of both landmark-based and landmark-free paradigms. Such advances will enhance our ability to extract meaningful biological signals from the complex geometry of anatomical forms.
This guide provides an objective comparison of three prominent statistical shape modeling (SSM) tools—ShapeWorks, SPHARM-PDM, and Deformetrica—within the context of shape discrimination research. Based on a comprehensive benchmarking study, ShapeWorks and Deformetrica demonstrated superior consistency and better capture of clinically relevant morphological variations compared to SPHARM-PDM, primarily due to their groupwise correspondence optimization approach [44] [43]. The following sections detail the experimental protocols, quantitative results, and practical considerations to guide researchers in selecting the appropriate tool for semi-landmark methods in morphological studies.
Tool Fundamentals and Methodological Comparison
Statistical shape modeling is a morphometric approach that quantifies and analyzes anatomical shapes by establishing correspondences across a population. The choice of correspondence optimization strategy fundamentally differentiates the tools [44] [43].
- Groupwise Approaches (ShapeWorks & Deformetrica): These methods consider the entire cohort of shapes simultaneously during correspondence optimization. They learn a population-specific metric that does not penalize natural variability, thereby more effectively capturing the underlying parameters in an anatomical shape space [44].
- Pairwise Approach (SPHARM-PDM): This method treats each shape instance independently, estimating correspondences by mapping individual subjects to a predefined atlas or template. This can sometimes obscure population-specific, non-linear variations [44] [43].
The diagram below illustrates the core methodological workflows for establishing shape correspondences.
Table 1: Fundamental Characteristics of SSM Tools
| Feature | ShapeWorks | SPHARM-PDM | Deformetrica |
|---|---|---|---|
| Core Approach | Groupwise, Particle-Based Modeling (PBM) | Pairwise, Spherical Harmonic Parameterization | Groupwise, Deformable Atlas |
| Correspondence Principle | Entropy minimization balancing model simplicity & accuracy | Mapping to a template via fixed spherical harmonic bases | Diffeomorphic metric mapping to an atlas |
| Topology Requirement | Topology-independent | Requires spherical topology | — |
| Key Strength | Captures population-specific variability without parameterization | Hierarchical, multi-scale boundary description | — |
Experimental Benchmarking and Performance Data
A rigorous benchmarking study evaluated these tools using quantitative metrics and real-world clinical tasks, including anatomical measurement inference and pathology (lesion) screening [44] [43].
Experimental Protocol and Workflow
The evaluation framework involved multiple anatomies and validation scenarios to ensure comprehensive assessment. The general workflow for the benchmarking process is depicted below.
Quantitative Performance Metrics
The study employed standard intrinsic metrics to evaluate the quality of the shape models generated by each tool [44] [43]:
- Compactness: Measures the ability of the model to capture population variability with as few model parameters (principal components) as possible. A more compact model explains a higher variance with fewer modes.
- Generalization: Assesses the model's ability to represent unseen shape instances not included in the training set. It is quantified by measuring the reconstruction error of leave-one-out experiments.
- Specificity: Evaluates the plausibility of shapes generated by the model by comparing random samples from the model to the real shapes in the training population.
Table 2: Summary of Quantitative Model Performance
| Anatomy | Metric | ShapeWorks | SPHARM-PDM | Deformetrica |
|---|---|---|---|---|
| Left Atrium Appendage (LAA) | Compactness | Best | Intermediate | Intermediate |
| Scapula | Compactness | Best | Intermediate | Intermediate |
| Humerus | Compactness | Best | Intermediate | Intermediate |
| Femur | Generalization | Best | — | Intermediate |
| Overall Consistency | Across Metrics & Anatomies | High | Lower | High |
Validation in Clinical and Discrimination Tasks
Beyond intrinsic metrics, the tools were extrinsically validated on tasks that mimic real research and clinical applications [44] [43].
- Anatomical Measurement Inference: The accuracy of automated anatomical measurements derived from the models was tested. For example, in the LAA, ShapeWorks measurements were found to be more consistent with ground-truth measurements compared to the other tools [44] [86].
- Lesion Screening: A method was presented to characterize subtle abnormal shape changes (e.g., cam lesions in femoroacetabular impingement (FAI)) with respect to the statistics of a control population. ShapeWorks successfully identified the cam lesion as the region with the greatest anatomical difference (>1.5mm) and enabled a data-driven disease spectrum scoring system [86].
- Relevant Population Variability: In a proof-of-concept experiment using an ensemble of 3D boxes with a moving bump, ShapeWorks correctly discovered the single underlying mode of variation (bump location), while SPHARM-PDM's results were influenced by its parameterization and template dependence [44] [86].
Table 3: Performance in Shape Discrimination and Clinical Tasks
| Task | Description | ShapeWorks | SPHARM-PDM | Deformetrica |
|---|---|---|---|---|
| Measurement Inference | Automating clinically-relevant anatomical measurements | Most consistent with ground truth [44] [86] | Less consistent | Intermediate consistency |
| Pathology Screening | Detecting and localizing abnormal shape changes (e.g., bony lesions) | Effective (e.g., FAI cam lesion identification) [86] | — | — |
| Mode Discovery | Capturing clinically relevant population variability (e.g., LAA elongation) | Effective [44] [86] | Less effective | Effective [44] |
The Scientist's Toolkit
Implementing an SSM-based study requires specific computational tools and reagents. The following table details the essential solutions used in the featured benchmarking study [44] [43] [87].
Table 4: Key Research Reagent Solutions for SSM
| Item / Solution | Function in SSM Pipeline |
|---|---|
| ShapeWorks | Open-source tool for particle-based shape correspondence and model building. Optimizes correspondences via groupwise entropy minimization [86] [88]. |
| SPHARM-PDM | Open-source tool that computes point-based models using spherical harmonic parameterization for shape analysis [87]. |
| Deformetrica | Open-source software for deformable shape modeling using diffeomorphic registration and atlas-based methods [44]. |
| 3D Binary Segmentations | Primary input data; volumetric masks of the anatomy of interest derived from medical images (e.g., MRI, CT). |
| SlicerSALT | An extension of 3D Slicer that incorporates SPHARM-PDM and other tools for shape analysis and visualization [44]. |
For researchers conducting shape discrimination studies, the choice of an SSM tool involves trade-offs between methodological foundations, performance, and practical application.
- For superior shape discrimination and population analysis: ShapeWorks is the recommended tool when the research goal is to discover population-specific patterns of morphological variation, especially for pathology screening or quantifying subtle shape differences. Its groupwise, parameterization-free approach consistently yielded the most compact models and captured clinically relevant variations most effectively [44] [86].
- When a deformable atlas model is suitable: Deformetrica is a strong alternative groupwise method. It demonstrated high consistency and performance comparable to ShapeWorks in many tasks, making it a viable option [44].
- For specific parameterized analyses: SPHARM-PDM remains a useful tool, particularly for anatomies with spherical topology. However, researchers should be aware of its limitations in capturing some forms of natural population variability due to its pairwise, template-dependent approach [44] [43].
In summary, the benchmarking data strongly supports the adoption of groupwise methods like ShapeWorks and Deformetrica over pairwise tools like SPHARM-PDM for shape discrimination research aiming to achieve unbiased, data-driven morphological insights.
Conclusion
The comparison of semi-landmark methods reveals that no single approach is universally superior; rather, the choice involves significant trade-offs between biological correspondence, algorithmic robustness, and practical constraints. While non-rigid methods like sliding TPS and TPS&NICP often show greater consistency, all semi-landmarking techniques estimate homology with inherent, unquantifiable error. Consequently, results should be treated as approximations requiring cautious interpretation. For biomedical research, this underscores the necessity of selecting methods aligned with specific study aims—whether for clinical visualization, functional modeling, or diagnostic discrimination. Future directions should focus on developing more robust, population-aware algorithms and establishing standardized validation protocols to enhance the reliability of shape-based analyses in drug development and clinical applications.
References
- 1. A Comparison of Semilandmarking Approaches in the ... [https://www.mdpi.com/2076-2615/13/7/1179]
- 2. Homology (biology) [https://en.wikipedia.org/wiki/Homology_(biology)]
- 3. Homology, convergence and parallelism - PMC [https://pmc.ncbi.nlm.nih.gov/articles/PMC4685577/]
- 4. Homology as a relation of correspondence between parts ... [https://pubmed.ncbi.nlm.nih.gov/17046350/]
- 5. Comparing semi-landmarking approaches for analyzing ... [https://pmc.ncbi.nlm.nih.gov/articles/PMC12088985/]
- 6. An automatic landmarking algorithm for leaf morphology ... [https://www.sciencedirect.com/science/article/abs/pii/S0168169925003801]
- 7. Homology - an overview | ScienceDirect Topics [https://www.sciencedirect.com/topics/engineering/homology]
- 8. Assessing the application of landmark-free morphometrics to ... [https://pmc.ncbi.nlm.nih.gov/articles/PMC12034209/]
- 9. Landmark Typology in Applied Morphometrics Studies [https://pubmed.ncbi.nlm.nih.gov/30365240/]
- 10. Landmark Typology in Applied Morphometrics Studies [https://www.semanticscholar.org/paper/Landmark-Typology-in-Applied-Morphometrics-Studies%3A-W%C3%A4rml%C3%A4nder-Garvin/d764abca656a9009c74398c278ca64fc93c515ff]
- 11. The effect of automated landmark identification on ... [https://pmc.ncbi.nlm.nih.gov/articles/PMC6539672/]
- 12. Assessing the application of landmark-free morphometrics to ... [https://bmcecolevol.biomedcentral.com/articles/10.1186/s12862-025-02377-9]
- 13. Design Space Constraints and the Cultural Taxonomy of ... [https://link.springer.com/article/10.1007/s41982-021-00097-2]
- 14. Comparison of geometric morphometric outline methods in the ... [https://frontiersinzoology.biomedcentral.com/articles/10.1186/1742-9994-3-15]
- 15. Outline-based morphometrics, an overlooked method in ... [https://www.sciencedirect.com/science/article/abs/pii/S1567134814002871]
- 16. Geometric morphometrics approach for classifying ... [https://www.nature.com/articles/s41598-025-85718-4]
- 17. Is There Geometric Morphometric Evidence for the ... [https://www.sciencedirect.com/science/article/pii/S0003996925002900]
- 18. Defining, Reconstructing and Investigating Shape Through a ... [https://journal.caa-international.org/articles/10.5334/jcaa.161]
- 19. Comparing semi-landmarking approaches for analyzing three ... [https://pubmed.ncbi.nlm.nih.gov/33483951/]
- 20. Differences between sliding semi-landmark methods in ... [https://pmc.ncbi.nlm.nih.gov/articles/PMC2100233/]
- 21. A Practical Guide to Sliding and Surface Semilandmarks in ... [https://pmc.ncbi.nlm.nih.gov/articles/PMC7780474/]
- 22. Differences between sliding semi-landmark methods in ... [https://pubmed.ncbi.nlm.nih.gov/16761977/]
- 23. A novel investigation of the effect of iterations in sliding semi ... [https://bmcbioinformatics.biomedcentral.com/articles/10.1186/s12859-020-3497-7]
- 24. A template-dependent semilandmarks treatment and its ... [https://www.sciencedirect.com/science/article/abs/pii/S1567134819300322]
- 25. Comparison of morphometric techniques for shapes with ... [https://complete.bioone.org/journalArticle/Download?urlId=10.1666%2F08068.1]
- 26. Reframing Three-Dimensional Morphometrics Through ... [https://arxiv.org/html/2509.00650v1]
- 27. Shape Based Molecular Search | Shape TK [https://www.eyesopen.com/shape-tk]
- 28. Testing the reliability of geometric morphometric and ... [https://www.sciencedirect.com/science/article/pii/S2666033425000048]
- 29. Functional data geometric morphometrics with machine ... [https://www.nature.com/articles/s41598-024-66246-z]
- 30. The TPS Direct Transport: A New Method for Transporting... [https://link.springer.com/article/10.1007/s11263-017-1031-9]
- 31. Thin-plate spline [https://sbmorphometrics.org/soft-tps.html]
- 32. Efficacy of diffeomorphic surface matching and 3D ... [https://www.sciencedirect.com/science/article/abs/pii/S0047248418300125]
- 33. Population-level shape variation and otolith asymmetry in ... [https://www.nature.com/articles/s41598-025-87096-3]
- 34. Landmark-based geometric morphometrics: Influential ... [https://sciety-labs.elifesciences.org/articles/by?article_doi=10.1101/2025.07.14.664645]
- 35. TPSToShapes: Converts TPS file to shape file in StereoMorph: Stereo... [https://rdrr.io/cran/StereoMorph/man/TPSToShapes.html]
- 36. Point Cloud Registration: Classic Approaches [https://medium.com/data-science/point-cloud-registration-classic-approaches-d6191302b0b2]
- 37. Comparison of Point Cloud Registration Techniques on ... [https://pmc.ncbi.nlm.nih.gov/articles/PMC11014384/]
- 38. Iterative Closest Point (ICP) for 3D Explained with Code [https://learnopencv.com/iterative-closest-point-icp-explained/]
- 39. A Comparison of Semilandmarking Approaches in the ... [https://pmc.ncbi.nlm.nih.gov/articles/PMC10093231/]
- 40. A Comparison of Semilandmarking Approaches in the ... [https://www.mdpi.com/2076-2615/13/3/385]
- 41. Non-rigid point cloud registration for middle ear diagnostics ... [https://pmc.ncbi.nlm.nih.gov/articles/PMC10769937/]
- 42. NICP: Neural ICP for 3D Human Registration at Scale [https://arxiv.org/html/2312.14024v2]
- 43. Benchmarking off-the-shelf statistical shape modeling tools in ... [https://pmc.ncbi.nlm.nih.gov/articles/PMC8792348/]
- 44. Benchmarking off-the-shelf statistical shape modeling tools ... [https://www.sciencedirect.com/science/article/abs/pii/S1361841521003169]
- 45. ShapeWorks [https://sciinstitute.github.io/ShapeWorks/6.3/]
- 46. ShapeWorks: Particle-Based Shape Correspondence and ... [https://www.sciencedirect.com/science/chapter/edited-volume/abs/pii/B9780128104934000122]
- 47. Shape Model Evaluation - ShapeWorks [https://sciinstitute.github.io/ShapeWorks/latest/new/ssm-eval.html]
- 48. Shape outline extraction software (DiaOutline) for elliptic ... [https://pmc.ncbi.nlm.nih.gov/articles/PMC6303154/]
- 49. Elliptical Fourier analysis - Rein van 't Veer [https://reinvantveer.github.io/2019/07/12/elliptical_fourier_analysis.html]
- 50. Elliptic Fourier analysis of cell and nuclear shapes [https://www.sciencedirect.com/science/article/pii/0010480989900347]
- 51. 2-D particle shape averaging and comparison using ... [https://www.sciencedirect.com/science/article/abs/pii/S0032591099000467]
- 52. Comparison of geometric morphometric outline methods in the ... [https://pmc.ncbi.nlm.nih.gov/articles/PMC1592095/]
- 53. An objective method of shape descriptor state ... [https://www.cambridge.org/core/journals/plant-genetic-resources/article/an-objective-method-of-shape-descriptor-state-establishment-using-elliptic-fourier-analysis-efa/CBBF4244821F206A6B09A3DA8A671C8B]
- 54. Using Elliptical Fourier Analysis to Interpret Complex ... [https://www.sciencedirect.com/science/article/abs/pii/B9780128054291000260]
- 55. Sample size, power and effect size revisited: simplified and ... [https://pmc.ncbi.nlm.nih.gov/articles/PMC7745163/]
- 56. Sample Size and Geometric Morphometrics Methodology ... [https://pmc.ncbi.nlm.nih.gov/articles/PMC10833145/]
- 57. Toward Robust Neuroanatomical Normative Models [https://elifesciences.org/reviewed-preprints/108952]
- 58. How many landmarks are enough to characterize shape and ... [https://journals.plos.org/plosone/article?id=10.1371/journal.pone.0198341]
- 59. Elements must meet minimum color contrast ratio thresholds [https://dequeuniversity.com/rules/axe/4.8/color-contrast]
- 60. Understanding WCAG 2 Contrast and Color Requirements [https://webaim.org/articles/contrast/]
- 61. Color contrast - Accessibility - MDN Web Docs - Mozilla [https://developer.mozilla.org/en-US/docs/Web/Accessibility/Guides/Understanding_WCAG/Perceivable/Color_contrast]
- 62. Detecting shapes in noise: tuning characteristics of global ... [https://www.frontiersin.org/journals/computational-neuroscience/articles/10.3389/fncom.2013.00037/full]
- 63. A robust missing value imputation method for noisy data [https://link.springer.com/article/10.1007/s10489-010-0244-1]
- 64. Comparison of methods to handle missing values in a ... [https://pmc.ncbi.nlm.nih.gov/articles/PMC12107930/]
- 65. 9.2 Sensitivity analysis [https://stefvanbuuren.name/fimd/sec-sensitivity.html]
- 66. The M-Value: A Simple Sensitivity Analysis for Bias Due to ... [https://pmc.ncbi.nlm.nih.gov/articles/PMC10089074/]
- 67. Shape–Texture Debiased Training for Robust Template ... [https://www.mdpi.com/1424-8220/22/17/6658]
- 68. Biases of Principal Component Analysis (PCA) in Physical ... [https://elifesciences.org/reviewed-preprints/94685]
- 69. Exploring shape changes in healthy bone growth through ... [https://www.sciencedirect.com/science/article/pii/S2352187224000846]
- 70. Tips on Principal Component Analysis [https://nicolo-albanese.medium.com/tips-on-principal-component-analysis-7116265971ad]
- 71. How to cross-validate PCA, clustering, and matrix ... [https://alexhwilliams.info/itsneuronalblog/2018/02/26/crossval/]
- 72. Why perform cross-validation to select best number of ... [https://stats.stackexchange.com/questions/458866/why-perform-cross-validation-to-select-best-number-of-principal-components-when]
- 73. The importance of choosing a proper validation strategy in ... [https://www.sciencedirect.com/science/article/pii/S0003267023007535]
- 74. Improving the performance of Pulse Shape Discrimination ... [https://www.sciencedirect.com/science/article/abs/pii/S1350448725000526]
- 75. Comparing semi-landmarking approaches for analyzing ... [https://www.semanticscholar.org/paper/5a5d755e82593ce41fb221a5133ae9be9e179ba2]
- 76. Comparison of geometric morphometric outline methods in ... [https://pubmed.ncbi.nlm.nih.gov/16978414/]
- 77. Comparison of geometric morphometric outline methods in the ... [https://www.bohrium.com/paper-details/comparison-of-geometric-morphometric-outline-methods-in-the-discrimination-of-age-related-differences-in-feather-shape/812056418365472768-5069]
- 78. Computer vision enables taxon-specific identification of ... [https://www.nature.com/articles/s41598-024-57015-z]
- 79. An Evaluation of Landmark-Based Methods to Explore ... [https://www.mdpi.com/2076-3417/13/6/3864]
- 80. Dental Morphology in Restorative Dentistry: A Pilot Study on ... [https://pmc.ncbi.nlm.nih.gov/articles/PMC11941563/]
- 81. Morphometric analysis of tooth morphology among different ... [https://bmcoralhealth.biomedcentral.com/articles/10.1186/s12903-023-02882-7]
- 82. To scale or not to scale: the principles of dose extrapolation [https://pmc.ncbi.nlm.nih.gov/articles/PMC2737649/]
- 83. Allometric scaling in-vitro | Scientific Reports [https://www.nature.com/articles/srep42113]
- 84. Allometry - an overview [https://www.sciencedirect.com/topics/earth-and-planetary-sciences/allometry]
- 85. Shape analysis, a field in need of careful validation - PMC [https://pmc.ncbi.nlm.nih.gov/articles/PMC6869375/]
- 86. Particle-based Shape Modeling [https://www.sci.utah.edu/~shireen/particle_based_shape_modeling.html]
- 87. GitHub - NIRALUser/ SPHARM - PDM : Shape analysis has become of... [https://github.com/NIRALUser/SPHARM-PDM]
- 88. ShapeWorks: Particle-Based Shape Correspondence and ... [https://www.sciencedirect.com/science/article/abs/pii/B9780128104934000122]