Cell Painting Assay: A Comprehensive Guide to Morphological Profiling in Drug Discovery
This article provides a comprehensive overview of the Cell Painting assay, a high-content imaging method that uses multiplexed fluorescent dyes to capture changes in cell morphology for drug discovery and...
Cell Painting Assay: A Comprehensive Guide to Morphological Profiling in Drug Discovery
Abstract
This article provides a comprehensive overview of the Cell Painting assay, a high-content imaging method that uses multiplexed fluorescent dyes to capture changes in cell morphology for drug discovery and toxicology. It covers the foundational principles of phenotypic profiling, detailed methodological protocols and their applications in predicting compound mechanisms of action (MoA) and toxicity. The content also addresses troubleshooting, assay optimization, and the latest advancements, including live-cell adaptations and machine learning for image analysis. Finally, it validates the technique's power through large-scale consortium data and benchmarks its performance against traditional methods, offering researchers a holistic resource to implement and leverage this powerful technology.
What is Cell Painting? Unlocking Phenotypic Drug Discovery with Morphological Profiling
Phenotypic Drug Discovery (PDD) has re-emerged as a powerful strategy for identifying first-in-class medicines, shifting the paradigm from reductionist target-based approaches to more holistic, physiology-focused screening. Modern PDD combines therapeutic effects in realistic disease models with advanced technological tools, enabling the systematic identification of novel therapeutic mechanisms without a pre-specified target hypothesis. This application note details the integration of the Cell Painting assay—a high-content morphological profiling method—within PDD workflows, providing researchers with detailed protocols, analytical frameworks, and benchmark datasets to accelerate the discovery of innovative therapeutics.
The molecular biology revolution of the 1980s and early 2000s prioritized target-based drug discovery (TDD), focusing on modulating specific molecular targets identified through genomic sequencing. However, analysis of first-in-class drugs approved between 1999 and 2008 revealed a surprising finding: the majority were discovered empirically without a predefined target hypothesis [1]. This observation sparked a major resurgence in Phenotypic Drug Discovery (PDD), defined as an approach focusing on modulation of disease phenotypes or biomarkers rather than pre-specified targets to provide therapeutic benefit [1].
Modern PDD has evolved into a sophisticated discipline that combines the original concept of observing therapeutic effects on disease physiology with advanced tools and strategies. This approach has demonstrated particular success for identifying first-in-class medicines with novel mechanisms of action, expanding the "druggable target space" to include unexpected cellular processes and revealing new classes of drug targets [1]. The Cell Painting assay represents a cornerstone technology in this modern PDD landscape, enabling systematic, high-throughput morphological profiling of cellular states in response to chemical and genetic perturbations.
Key Successes from Phenotypic Approaches
Phenotypic strategies have contributed significantly to therapies addressing previously untreatable conditions through novel mechanisms of action. The following table summarizes notable examples:
Table 1: Notable Drug Successes from Phenotypic Screening
| Drug Name | Disease Area | Key Mechanism/Target | Discovery Context |
|---|---|---|---|
| Ivacaftor, Tezacaftor, Elexacaftor [1] | Cystic Fibrosis | CFTR channel gating and folding correction | Cell-based screens expressing disease-associated CFTR variants |
| Risdiplam, Branaplam [1] | Spinal Muscular Atrophy | SMN2 pre-mRNA splicing modulation | Phenotypic screens for compounds increasing full-length SMN protein |
| Lenalidomide [1] | Multiple Myeloma | Cereblon E3 ligase modulation (targeted protein degradation) | Optimization of thalidomide; mechanism elucidated years post-approval |
| Daclatasvir [1] | Hepatitis C | NS5A protein modulation (non-enzymatic target) | HCV replicon phenotypic screen |
| SEP-363856 [1] | Schizophrenia | Novel mechanism (non-D2 receptor) | Phenotypic screen in disease models |
These successes demonstrate how phenotypic strategies have expanded the "druggable target space" to include unexpected cellular processes—including pre-mRNA splicing, target protein folding, trafficking, and degradation—and revealed novel mechanisms for traditional target classes [1]. The unbiased nature of phenotypic screening allows for the identification of compounds with polypharmacology (simultaneous modulation of multiple targets), which can be advantageous for treating complex, polygenic diseases [1].
Cell Painting Assay: Protocol for Morphological Profiling
The Cell Painting assay is a high-content, image-based morphological profiling assay that multiplexes six fluorescent dyes imaged in five channels to reveal eight broadly relevant cellular components or organelles [2]. This protocol provides a standardized method for generating rich morphological data suitable for phenotypic screening.
Experimental Workflow and Timeline
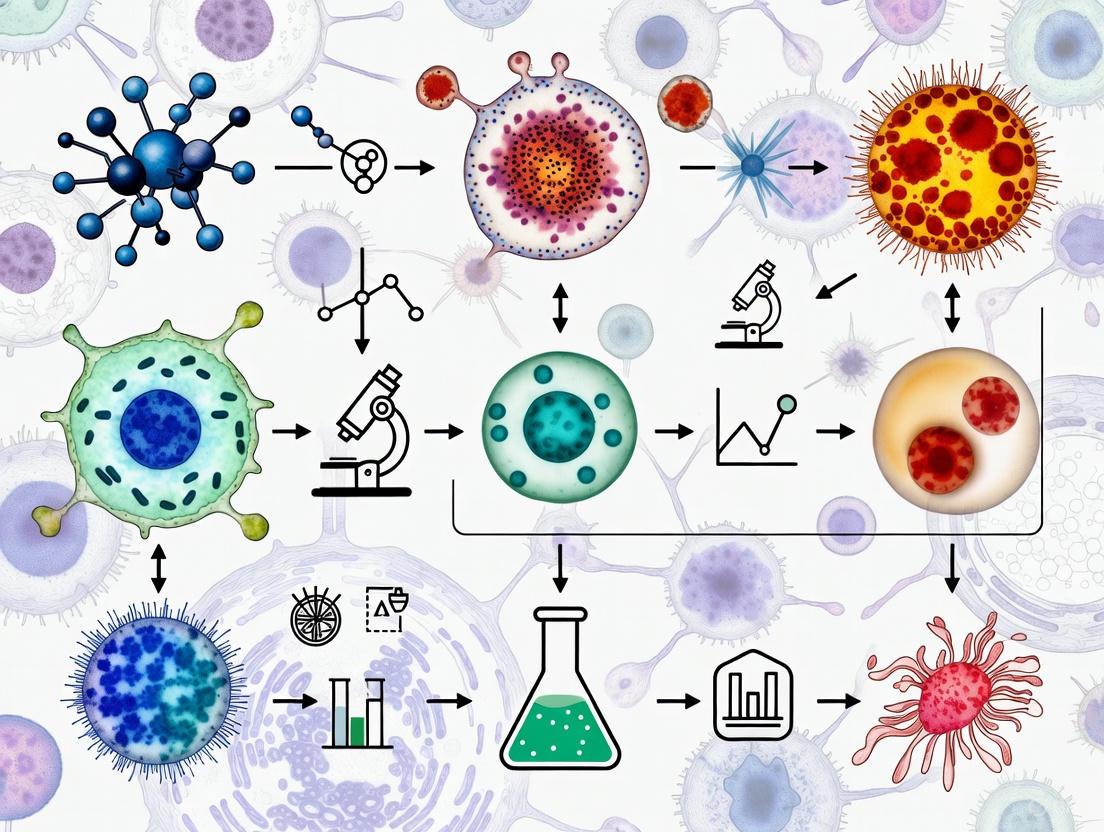
The diagram below illustrates the complete Cell Painting assay workflow from cell plating to data analysis:
Staining Protocol and Reagent Specifications
The assay uses a carefully optimized combination of dyes to capture comprehensive morphological information:
Table 2: Cell Painting Staining Reagents and Specifications
| Dye Target | Cellular Component | Channel | Function in Assay |
|---|---|---|---|
| Concanavalin A [2] | Endoplasmic Reticulum | 1 (488 nm) | Labels glycoproteins and ER structure |
| Wheat Germ Agglutinin [2] | Golgi Apparatus & Plasma Membrane | 2 (640 nm) | Highlights Golgi complex and cell boundaries |
| Phalloidin [2] | Actin Cytoskeleton | 3 (568 nm) | Visualizes F-actin and cytoskeletal organization |
| SYTO 14 [2] | Nucleoli | 4 (647 nm) | Stains nucleolar RNA and nuclear morphology |
| MitoTracker [2] | Mitochondria | 5 (562 nm) | Labels mitochondrial network and distribution |
| Hoechst 33342 [2] | Nuclear DNA | 6 (477 nm) | Marks nuclear DNA and chromatin structure |
Image Acquisition and Feature Extraction
Following staining and fixation, plates are imaged using a high-throughput microscope capable of capturing five fluorescence channels. Automated image analysis software (e.g., CellProfiler) then identifies individual cells and measures approximately 1,500 morphological features per cell, including various measures of size, shape, texture, and intensity across all cellular compartments [2]. These features create a rich morphological profile that serves as a quantitative fingerprint for each perturbation condition.
Benchmark Datasets and Analytical Frameworks
The JUMP-Cell Painting Consortium Dataset
To advance methodological development in image-based profiling, the JUMP-Cell Painting Consortium created CPJUMP1—a benchmark dataset of approximately 3 million images and morphological profiles of cells treated with matched chemical and genetic perturbations [3]. This resource includes:
- 160 genes and 303 compounds with known relationships
- Parallel testing of CRISPR-Cas9 knockout, ORF overexpression, and chemical perturbations
- Multiple cell types (U2OS and A549) and time points
- Approximately 75 million single-cell profiles [3]
This carefully designed dataset enables researchers to test computational strategies for identifying biologically meaningful relationships among perturbations.
Data Analysis Workflow: Equivalence Scores
For analyzing large-scale Cell Painting data, researchers have developed efficient computational workflows. One such approach uses Equivalence Scores (Eq. Scores)—a multivariate metric that highlights relevant deviations from negative controls based on cell image morphology [4]. This workflow:
- Uses negative controls as a baseline for efficient, scalable analysis
- Enables comparison of treatment effects through biologically relevant insights
- Demonstrates improved classification performance compared to using raw CellProfiler features or principal component analysis (PCA) [4]
Table 3: Performance Comparison of Analytical Methods on CPJUMP1 Data
| Method | Key Advantage | Perturbation Detection | Scalability | Classification Accuracy |
|---|---|---|---|---|
| Equivalence Scores [4] | Uses negative controls as baseline | High | Excellent | Best performance in k-NN classification |
| Raw CellProfiler Features | All original measurements preserved | Moderate | Good (with sufficient resources) | Lower than Eq. Scores |
| Principal Component Analysis | Dimensionality reduction | Moderate | Good | Lower than Eq. Scores |
Essential Research Reagent Solutions
Successful implementation of Cell Painting within PDD workflows requires specific reagents and tools. The following table details key materials and their functions:
Table 4: Essential Research Reagents for Cell Painting and Phenotypic Screening
| Reagent Category | Specific Examples | Function in Workflow |
|---|---|---|
| Fluorescent Dyes [2] | Concanavalin A, Wheat Germ Agglutinin, Phalloidin, SYTO 14, MitoTracker, Hoechst 33342 | Multiplexed labeling of cellular components for morphological profiling |
| Cell Lines [3] | U2OS (osteosarcoma), A549 (lung carcinoma) | Disease-relevant models for perturbation testing; U2OS particularly common |
| Perturbation Libraries | CRISPR guides, ORF overexpression constructs, Compound libraries (e.g., Drug Repurposing Hub) | Genetic and chemical tools to modulate cellular pathways and states |
| Image Analysis Software [2] | CellProfiler, Deep learning platforms | Automated segmentation and feature extraction from raw microscopy images |
| Data Analysis Tools [4] | Equivalence Score algorithms, Cosine similarity metrics | Quantitative comparison of morphological profiles and hit identification |
The transition from target-based to phenotypic discovery represents a strategic shift in drug discovery philosophy, prioritizing therapeutic outcomes in physiologically relevant systems over predefined molecular hypotheses. The Cell Painting assay provides a standardized, scalable platform for implementing this unbiased approach, generating rich morphological profiles that enable researchers to identify novel mechanisms of action, characterize polypharmacology, and expand the druggable genome. With the availability of large public datasets like CPJUMP1 and developing analytical frameworks like Equivalence Scores, the research community is well-positioned to advance phenotypic discovery for identifying first-in-class therapeutics for complex diseases.
Cell Painting is a high-content, multiplexed fluorescence microscopy assay designed to capture a comprehensive view of cellular morphology in response to genetic, chemical, or environmental perturbations. As a powerful tool in phenotypic drug discovery, it enables researchers to identify complex phenotypic changes without prior knowledge of specific molecular targets, making it particularly valuable for understanding mechanisms of action (MoA) for novel compounds [5]. The assay was innovatively designed to be both cost-effective and accessible, requiring no custom equipment beyond a standard microscope with appropriate filters and relying solely on fluorescent dyes rather than antibodies [5].
The fundamental principle behind Cell Painting involves using a carefully selected panel of six fluorescent dyes that collectively stain eight major cellular compartments or structures. When combined with automated imaging and computational analysis, this approach generates high-dimensional morphological profiles that can distinguish subtle phenotypic changes across thousands of cellular features [5]. The ability to capture such rich biological information has positioned Cell Painting as a cornerstone technology in modern drug discovery pipelines, with applications ranging from target identification and validation to toxicology prediction and functional assessment of compound libraries [6].
The Core Dye Panel: Specifications and Cellular Targets
The standard Cell Painting assay utilizes a specific combination of six fluorescent dyes that target distinct cellular components. This strategic selection enables comprehensive morphological profiling by covering the major organelles and structural elements that collectively define cellular state and function. The table below summarizes the core dye panel, their specific cellular targets, and their staining characteristics.
Table 1: The Core Cell Painting Dye Panel and Cellular Targets
| Fluorescent Dye | Cellular Target(s) | Staining Characteristics | Key Applications |
|---|---|---|---|
| Hoechst 33342 | Nuclear DNA [5] | Cell-permeant blue fluorescent stain that binds to AT-rich regions of DNA [7] | Nuclear segmentation, cell counting, cell cycle analysis |
| Concanavalin A, Alexa Fluor 488 Conjugate | Endoplasmic Reticulum [5] | Lectin that binds to glycoproteins and glucose residues in the ER [8] | ER morphology and distribution analysis |
| SYTO 14 Green Fluorescent Nucleic Acid Stain | Nucleoli and cytoplasmic RNA [5] | Cell-permeant green fluorescent nucleic acid stain [5] | Nucleolar morphology, RNA distribution |
| Phalloidin (e.g., Alexa Fluor 568 Phalloidin) | Filamentous Actin (F-actin) [5] | Cyclic peptide that specifically binds to F-actin [8] | Cytoskeletal organization, cell shape and motility |
| Wheat Germ Agglutinin (WGA), Alexa Fluor 647 Conjugate | Golgi apparatus and plasma membrane [5] | Lectin that binds to N-acetylglucosamine and sialic acid residues [8] | Plasma membrane contour, Golgi complex morphology |
| MitoTracker Deep Red | Mitochondria [5] | Cell-permeant dye that accumulates in active mitochondria [8] | Mitochondrial mass, network organization, membrane potential |
This combination of dyes enables the simultaneous visualization of eight distinct cellular compartments: nucleus, nucleoli, endoplasmic reticulum, mitochondria, cytoskeleton, Golgi apparatus, plasma membrane, and cytoplasmic RNA [5] [6]. The strategic selection of dyes with non-overlapping emission spectra allows for their simultaneous use in a multiplexed staining protocol, followed by sequential imaging through appropriate fluorescence channels.
Experimental Workflow and Protocol
The Cell Painting assay follows a standardized workflow from cell preparation to image analysis. The following diagram illustrates the key experimental steps:
Detailed Staining Protocol
The following protocol is adapted from the established Cell Painting methodology with optimizations from the JUMP-Cell Painting Consortium [5]. All steps should be performed under sterile conditions unless otherwise specified.
Cell Seeding and Culture
- Cell Line Selection: Select appropriate cell lines based on experimental goals. U2OS osteosarcoma cells are commonly used due to their flat morphology, which facilitates segmentation and analysis, though dozens of cell lines have been successfully adapted [5].
- Seeding Density: Plate cells at an optimized density (typically 1,000-5,000 cells per well in 96-well plates) to achieve 70-80% confluence at the time of staining while minimizing cell overlap.
- Culture Conditions: Culture cells for 24-48 hours in appropriate media and conditions to allow for complete attachment and stabilization before treatment.
Compound Treatment and Perturbation
- Experimental Design: Include appropriate controls (vehicle controls, positive controls with known phenotypic effects) in each plate.
- Treatment Duration: Treat cells with compounds or perturbations for a predetermined time (typically 24-48 hours) based on the biological question. For unknown compounds, multiple timepoints may be tested.
Staining Procedure
- Preparation of Staining Solution: Prepare the dye cocktail in live cell imaging buffer or culture medium. The following working concentrations have been optimized for the assay [5]:
Table 2: Dye Working Concentrations for Cell Painting
| Dye | Working Concentration | Solvent |
|---|---|---|
| Hoechst 33342 | 1-2 µg/mL | Aqueous buffer |
| Concanavalin A, Alexa Fluor 488 | 50-100 µg/mL | Aqueous buffer |
| SYTO 14 | 500 nM | DMSO |
| Phalloidin, Alexa Fluor 568 | According to manufacturer | Methanol |
| Wheat Germ Agglutinin, Alexa Fluor 647 | 1-5 µg/mL | Aqueous buffer |
| MitoTracker Deep Red | 50-200 nM | DMSO |
- Staining Process:
- Remove culture medium from wells.
- Add prepared staining solution to cover cells completely.
- Incubate for 30-90 minutes at 37°C or room temperature, protected from light.
- For live-cell imaging: Proceed directly to imaging with the staining solution present or replace with fresh imaging buffer.
- For fixed-cell imaging: Fix cells with 4% paraformaldehyde for 15 minutes, then wash with PBS.
Image Acquisition
- Microscope Setup: Use a high-content imaging system with appropriate filter sets for each fluorophore.
- Image Acquisition Settings: Acquire images with a 20x or 40x objective, ensuring minimal exposure times to prevent photobleaching while maintaining sufficient signal-to-noise ratio.
- Field Selection: Image multiple fields per well (typically 9-25 fields) to capture a representative cell population.
- Channel Sequencing: Acquire images sequentially through each fluorescence channel to prevent bleed-through, typically in the order: Hoechst, SYTO 14, Concanavalin A, Phalloidin, MitoTracker, WGA.
Image Analysis and Data Processing Workflow
Following image acquisition, the data undergoes a comprehensive computational pipeline to extract meaningful morphological profiles. The analysis workflow transforms raw images into quantitative features that capture cellular morphology.
Feature Extraction and Profiling
The image analysis pipeline extracts over a thousand morphological features from each cell, which can be categorized as follows:
Table 3: Categories of Morphological Features Extracted in Cell Painting
| Feature Category | Description | Examples |
|---|---|---|
| Intensity Features | Measurements of fluorescence intensity within cellular compartments | Mean intensity, total intensity, intensity distribution |
| Shape Features | Geometric properties of cells and organelles | Area, perimeter, eccentricity, solidity, form factor |
| Texture Features | Patterns of intensity distribution within regions | Haralick texture features, granularity, local contrast |
| Spatial Features | Relative positioning and organization of organelles | Distance between organelles, radial distribution, spatial correlation |
These features collectively form a morphological profile for each treatment condition, which can be compared against reference compounds to identify similarities and differences in phenotypic impact [5]. Advanced machine learning approaches, including deep learning with convolutional neural networks (CNNs), can achieve an average ROC-AUC of 0.744 ± 0.108 across diverse biological assays, demonstrating the predictive power of Cell Painting-derived morphological profiles [6].
Research Reagent Solutions and Essential Materials
Successful implementation of the Cell Painting assay requires careful selection of reagents and materials. The following table details essential components for establishing the protocol in a research setting.
Table 4: Essential Research Reagents and Materials for Cell Painting
| Category | Specific Reagents/Materials | Function and Application Notes |
|---|---|---|
| Core Fluorescent Dyes | Hoechst 33342, Concanavalin A (Alexa Fluor 488 conjugate), SYTO 14, Phalloidin (Alexa Fluor 568 conjugate), WGA (Alexa Fluor 647 conjugate), MitoTracker Deep Red | Multiplexed staining of cellular compartments; select dye conjugates with minimal spectral overlap [5] |
| Cell Culture Supplies | Appropriate cell lines (e.g., U2OS, A549, HepG2), cell culture media and supplements, multiwell plates (96-well or 384-well) | Ensure cell lines grow in monolayers with minimal overlap for optimal segmentation [5] |
| Staining Buffers and Solutions | Live cell imaging buffer, phosphate-buffered saline (PBS), paraformaldehyde (4% for fixation), permeabilization buffer (if required) | Maintain cell viability during live imaging or preserve morphology during fixation |
| Image Acquisition Systems | High-content screening microscope with environmental control, appropriate filter sets for each fluorophore, automated stage | Systems should support automated multi-position imaging with precise channel sequencing |
| Image Analysis Software | CellProfiler [5], ImageJ/FIJI, or commercial high-content analysis packages | Open-source solutions like CellProfiler enable accessible feature extraction without licensing costs |
Applications in Drug Discovery and Research
The comprehensive morphological profiles generated by Cell Painting have enabled diverse applications in drug discovery and basic research. In phenotypic drug discovery, Cell Painting has demonstrated particular value for identifying mechanisms of action (MoA) for uncharacterized compounds, predicting bioactivity across diverse targets, and assessing compound toxicity [5] [6]. By capturing the multidimensional phenotypic state of cells, the assay provides a powerful alternative to target-based screening approaches, with evidence suggesting that phenotypic strategies yield more first-in-class medicines [5].
Recent advances have demonstrated that Cell Painting-based bioactivity prediction can achieve impressive performance across diverse biological assays, with 62% of assays achieving ROC-AUC ≥0.7 and 30% reaching ≥0.8 in predicting compound activity [6]. This predictive capability enables more efficient screening cascades by prioritizing compounds with higher likelihood of activity, thereby reducing screening costs and enabling the use of more biologically complex assays earlier in the discovery process. Furthermore, the ability to profile compounds across multiple cell lines provides insights into cell-type specific responses, enhancing the understanding of compound selectivity and potential therapeutic windows [5].
The integration of Cell Painting with other data modalities, such as transcriptomics and proteomics, offers a systems-level view of compound effects, facilitating the identification of novel therapeutic strategies and biomarkers of response. As the field advances, continued optimization of staining protocols, image analysis methods, and data integration approaches will further expand the utility of Cell Painting in accelerating drug discovery and deepening our understanding of cellular biology.
The Cell Painting assay is a powerful high-content, image-based morphological profiling technique that enables the detailed characterization of cellular states in drug discovery research. By using multiplexed fluorescent dyes to label key cellular compartments, this assay captures a vast array of morphological features, generating rich, quantitative data on how genetic or chemical perturbations affect cell biology [2] [9]. Unlike targeted assays, Cell Painting takes an unbiased approach, casting a wide net to reveal unanticipated phenotypic changes. This makes it tremendously powerful for identifying the mechanism of action of novel compounds, grouping genes into functional pathways, and identifying disease signatures [2]. The assay stains eight broadly relevant cellular components—including the nucleus, nucleoli, RNA, actin, Golgi apparatus, plasma membrane, endoplasmic reticulum (ER), and mitochondria—allowing researchers to extract approximately 1,500 morphological features from each individual cell, providing a deep, multidimensional snapshot of cellular morphology [10] [9].
The Cellular Structures and Their Functions
The Cell Painting assay provides a comprehensive view of cellular morphology by simultaneously visualizing eight key cellular structures. Each structure offers unique insights into cellular health, organization, and response to perturbation, with their combined profiles serving as a sensitive fingerprint for any tested condition [2].
- Nucleus: The control center of the cell, containing the genetic material (DNA) packed into chromosomes [11] [12]. Changes in nuclear morphology (size, shape, texture) are critical indicators of cell state and health.
- Nucleolus: A dense region within the nucleus that is the site of ribosomal RNA (RNA) synthesis and ribosome assembly [11] [13]. Its appearance can reflect the metabolic and biosynthetic activity of the cell.
- RNA: Reveals the distribution of RNA throughout the cell, providing insights into protein synthesis machinery and cellular activity levels [2].
- Actin: A major component of the cytoskeleton, providing structural support, enabling cell movement, and playing crucial roles in cell division and shape determination [12].
- Golgi Apparatus/Golgi Complex: Groups of flattened membrane-enclosed sacs that process, sort, and deliver proteins and lipids to their proper destinations within the cell or for secretion outside [13] [12].
- Plasma Membrane (Cell Membrane): A dynamic, flexible barrier made of a phospholipid bilayer that surrounds the cell's contents. It controls the passage of materials into and out of the cell and contains receptor proteins that initiate cellular responses to signals [11] [12].
- Endoplasmic Reticulum (ER): An extensive network of membranes involved in the synthesis of proteins (rough ER) and fats (smooth ER), as well as detoxification processes [13] [12].
- Mitochondria: The powerhouse of the cell, these organelles generate energy (ATP) through cellular respiration [13] [12]. Their morphology is tightly linked to their functional state.
Cell Painting Staining Protocol and Reagent Solutions
The following table details the specific dyes and targets used in a standard Cell Painting assay to visualize the eight key cellular structures. This combination of six fluorescent dyes imaged across five channels provides comprehensive coverage of the cell [2] [9].
Table 1: Cell Painting Staining Reagents and Targets
| Fluorescent Dye | Stained Cellular Structure | Channel (Ex/Em) | Function in Profiling |
|---|---|---|---|
| Hoechst 33342 (or similar nuclear stain) | Nucleus, Nucleoli | Blue (e.g., DAPI) | Marks nuclear DNA; reveals nuclear shape, size, and nucleic texture. |
| Concanavalin A, Alexa Fluor 488 Conjugate | Endoplasmic Reticulum (ER) | Green (e.g., FITC) | Labels glycoproteins on the ER surface; visualizes ER morphology and distribution. |
| Wheat Germ Agglutinin, Alexa Fluor 555 Conjugate | Golgi Apparatus, Plasma Membrane | Red (e.g., TRITC) | Binds to Golgi and membrane glycoproteins; outlines cell shape and Golgi structure. |
| Phalloidin, Alexa Fluor 555 Conjugate (or similar) | Actin Cytoskeleton | Red (Same as above) | Highlights filamentous actin (F-actin); reveals cell shape and cytoskeletal organization. |
| SYTO 14 Green Fluorescent Nucleic Acid Stain | Nucleoli & Cytoplasmic RNA | Green (Same as above) | Labels RNA-rich regions, primarily highlighting the nucleoli. |
| MitoTracker Deep Red | Mitochondria | Far-Red (e.g., Cy5) | Stains metabolically active mitochondria; shows mitochondrial network, mass, and distribution. |
Research Reagent Solutions Toolkit
For researchers embarking on a Cell Painting project, having the right tools is essential. The following table lists key reagent solutions and their functions.
Table 2: Essential Research Reagent Solutions for Cell Painting
| Item/Category | Specific Examples | Function |
|---|---|---|
| Commercial Staining Kit | Invitrogen Image-iT Cell Painting Kit [10] | Provides a standardized set of all necessary dyes for the assay, ensuring consistency and reliability. |
| Mitochondrial Stains | MitoTracker dyes [2] | Labels the mitochondrial network. Newer near-infrared reagents help reduce spectral overlap. |
| Actin Stains | Phalloidin conjugates (e.g., Alexa Fluor 555) [9] | Specifically binds to and labels filamentous actin (F-actin) for cytoskeletal analysis. |
| Cell Membrane Stains | Wheat Germ Agglutinin (WGA) conjugates [2] | Binds to sialic acid and N-acetylglucosaminyl residues on the plasma membrane and Golgi. |
| ER Stains | Concanavalin A (ConA) conjugates [2] | Binds to glycoproteins in the endoplasmic reticulum. |
| Nucleic Acid Stains | Hoechst 33342, SYTO 14 [2] | Labels DNA (nucleus) and RNA (nucleoli, cytoplasm), respectively. |
| Fixation/Permeabilization Reagents | Formaldehyde, Paraformaldehyde, Triton X-100 | Preserves cellular architecture and allows dyes to access intracellular targets. |
Experimental Protocol: A Step-by-Step Guide
The following workflow outlines the key stages of a Cell Painting experiment, from cell preparation to data analysis. The entire process from cell culture to data analysis typically takes 3-4 weeks [2] [9].
Detailed Methodologies
Step 1: Cell Seeding and Experimental Perturbation
- Plate cells in multi-well plates (e.g., 96-well or 384-well) suitable for high-throughput microscopy.
- Treat cells with the experimental perturbations, which can include small molecules, gene knockouts (e.g., CRISPR, RNAi), or overexpression constructs [2] [10]. For example, a case study compared A549 wild-type cells to p53 knockout A549 cells to study phenotypic differences [10].
- Include appropriate controls (e.g., vehicle controls for compounds, non-targeting guides for RNAi) in each plate.
- Incubate cells for a predetermined time (typically 24-72 hours) to allow perturbations to induce phenotypic changes.
Step 2: Staining and Fixation This protocol combines both live-cell and fixed-cell staining steps [10]. All staining and washing steps should be performed carefully to maintain cell morphology.
- Live-cell Staining: Incubate cells with MitoTracker Deep Red in pre-warmed culture medium to label mitochondria.
- Fixation: Aspirate the medium and fix cells with a formaldehyde solution (e.g., 3.7-4%) for 20-30 minutes at room temperature.
- Permeabilization: Permeabilize cells using a detergent like Triton X-100 (e.g., 0.1%) for 15-30 minutes.
- Multiplexed Staining: Stain cells with the remaining five dyes in a multiplexed manner:
- Hoechst 33342 (or similar) to label DNA in the nucleus.
- Phalloidin conjugate (e.g., Alexa Fluor 555) to label F-actin.
- Wheat Germ Agglutinin (WGA) conjugate (e.g., Alexa Fluor 555) to label the Golgi and plasma membrane.
- Concanavalin A (ConA) conjugate (e.g., Alexa Fluor 488) to label the endoplasmic reticulum.
- SYTO 14 to label nucleolar and cytoplasmic RNA.
- Storage: After staining, store plates in the dark at 4°C in phosphate-buffered saline (PBS) until imaging.
Step 3: High-Throughput Image Acquisition
- Image the stained plates using a high-throughput automated microscope (e.g., the Thermo Scientific CellInsight CX7 LZR Pro Platform) [10].
- Acquire images in all five fluorescence channels corresponding to the dyes used, ensuring appropriate exposure times and minimal spectral bleed-through.
- Multiple fields of view per well are typically captured to ensure a statistically robust number of cells are analyzed.
Step 4: Automated Image Analysis and Feature Extraction
- Use automated image analysis software (e.g., CellProfiler) to identify individual cells and their subcellular structures [2] [9].
- The software extracts approximately 1,500 morphological features per cell. These features can be categorized as follows:
Table 3: Categories of Morphological Features Extracted in Cell Painting
| Feature Category | Description | Examples of Measured Parameters |
|---|---|---|
| Size and Shape | Gross geometric properties of the cell and its organelles. | Area, Perimeter, Major/Minor Axis Length, Eccentricity, Form Factor. |
| Intensity | Total and average fluorescence signal within compartments. | Mean Intensity, Integrated Intensity, Median Intensity. |
| Texture | Patterns and spatial organization of fluorescence within a compartment. | Haralick Textures (Entropy, Contrast, Correlation), Zernike Moments. |
| Correlation & Neighbors | Relationships between different channels and adjacent cells. | Correlation between stains (e.g., ER and Mitochondria), Number of Neighboring Cells. |
Step 5: Data Analysis and Morphological Profiling
- The extracted features are aggregated and normalized to create a morphological profile for each treatment condition [2].
- Profiles of different perturbations are compared using multivariate statistical methods and machine learning. Common analyses include:
- Clustering: Grouping compounds or genes with similar phenotypic profiles to suggest shared mechanisms of action or functional pathways [2] [12].
- Signature Reversion: Identifying perturbations (e.g., drugs) that can revert a disease-associated morphological profile back to a wild-type state, a key approach in drug repurposing [2].
Applications in Drug Discovery
The rich, high-dimensional data generated by the Cell Painting assay powers several critical applications in modern drug discovery and basic research.
- Mechanism of Action (MoA) Elucidation: By comparing the morphological profiles of novel compounds to a reference set of compounds with known mechanisms, researchers can hypothesize the MoA of uncharacterized hits, accelerating the drug discovery pipeline [2] [10].
- Functional Gene Analysis: Profiling cells after genetic perturbations (e.g., gene knockout or overexpression) allows for the functional annotation of genes. Genes with similar morphological profiles can be clustered into common functional pathways [2].
- Phenotypic Screening and Signature Reversion: Disease models (e.g., from patients with rare genetic diseases) can be screened with Cell Painting to identify a disease-specific morphological signature. This signature is then used to screen compound libraries for drugs that can "revert" the profile to a healthy state, a powerful strategy for drug repurposing [2].
- Library Enrichment: Profiling a large collection of small molecules allows researchers to select a phenotypically diverse subset for further screening. This maximizes the chance of finding active compounds with different mechanisms while minimizing costs and redundancy [2].
Technical Considerations and Best Practices
Successfully implementing the Cell Painting assay requires careful attention to several technical aspects.
- Spectral Overlap: A primary challenge is the spectral overlap of the fluorescent dyes, which can hinder accurate quantification [10]. This can be mitigated by:
- Careful selection of filter sets on the microscope.
- Using advanced imaging platforms with spectral unmixing capabilities.
- Incorporating near-infrared reagents to expand the available spectrum [10].
- Color and Visualization Best Practices: When creating visualizations of the data or representative images, adhere to color accessibility guidelines. This includes ensuring sufficient color contrast, being mindful of color vision deficiencies, and using perceptually uniform color spaces like CIE L*a*b* where possible [14] [15].
- Data Quality Control: Implement rigorous image quality control (QC) metrics to identify and exclude artifacts arising from focus issues, bubbles, or uneven staining. Software like CellProfiler can assist in automated QC [9].
- Future Outlook: The field is rapidly advancing with the integration of AI and machine learning to streamline the analysis of complex datasets. Furthermore, enhancements in imaging technologies, such as hyperspectral imaging, promise to reduce spectral overlap and allow for simultaneous evaluation of even more targets [10].
Morphological profiling is a powerful technique in high-content screening that involves quantifying hundreds to thousands of features from microscopy images to create a comprehensive, unbiased "fingerprint" of cellular state [2]. Unlike conventional screening assays that focus on a small number of predefined features, morphological profiling captures subtle phenotypic changes across multiple cellular components, enabling detection of biological perturbations that might otherwise remain unnoticed [2]. The Cell Painting assay represents a standardized approach to morphological profiling that uses a multiplexed fluorescent staining strategy to "paint" as much of the cell as possible, capturing a representative image of the whole cell [16] [2].
This profiling approach has proven particularly valuable in drug discovery, where it can characterize the phenotypic impact of chemical or genetic perturbations, group compounds and genes into functional pathways, and identify signatures of disease [2]. The rich morphological profiles generated enable researchers to study dynamic organization of proteins, cell viability, proliferation, toxicity, and DNA damage responses [17]. Recent advances demonstrate that Cell Painting-based bioactivity prediction can significantly boost high-throughput screening hit-rates and compound diversity, potentially reducing the size and cost of screening campaigns while enabling primary screening with more biologically complex assays [6].
The Cell Painting Assay: Principles and Staining Strategy
Core Staining Principles
The Cell Painting assay employs a carefully optimized combination of six fluorescent dyes imaged across five channels to label eight fundamental cellular components or organelles [2]. This comprehensive staining strategy aims to visualize as many biologically relevant morphological features as possible while maintaining compatibility with standard high-throughput microscopes and keeping the assay feasible for large-scale experiments in terms of cost and complexity [2]. The power of this approach lies in its ability to detect phenotypic signatures even when the stains don't specifically target pathways known to be affected by a particular perturbation, making it exceptionally valuable for discovering unexpected biological effects [2].
Research Reagent Solutions
Table 1: Essential Staining Reagents for Cell Painting Assay
| Cellular Component | Staining Reagent | Function |
|---|---|---|
| Nucleus | Hoechst 33342 | Labels DNA to visualize nuclear morphology and organization [16] |
| Nucleoli & Cytoplasmic RNA | SYTO 14 green fluorescent nucleic acid stain | Distinguishes RNA-rich regions including nucleoli and cytoplasmic RNA [16] |
| Endoplasmic Reticulum | Concanavalin A/Alexa Fluor 488 conjugate | Binds glycoproteins to visualize ER structure and distribution [16] |
| Mitochondria | MitoTracker Deep Red | Accumulates in active mitochondria based on membrane potential [16] |
| F-actin Cytoskeleton | Phalloidin/Alexa Fluor 568 conjugate | Specifically binds filamentous actin, outlining cytoskeletal structure [16] |
| Golgi Apparatus & Plasma Membrane | Wheat Germ Agglutinin/Alexa Fluor 555 conjugate | Binds glycoproteins and glycolipids for plasma membrane and Golgi visualization [16] |
Feature Extraction and Data Analysis
Quantitative Feature Extraction
The feature extraction process in Cell Painting assays typically generates approximately 1,500 morphological measurements per cell based on changes in size, shape, texture, and fluorescence intensity across the stained cellular compartments [17] [2]. Automated image analysis software identifies individual cells and their components, extracting feature measurements that include intensity, texture, shape, size, and the spatial relationships between organelles [16]. These measurements collectively form the phenotypic profile that represents the biological state of each cell [16]. The number of unique measurements extracted can range from 100 to over 1,000 per cell, providing a rich dataset for downstream analysis [16].
Data Analysis Approaches
The analysis of morphological profiles involves comparing profiles of cell populations treated with different experimental perturbations to identify biologically relevant similarities and differences [2]. Clustering algorithms are commonly employed to group compounds or genes with similar phenotypic effects, enabling mechanism of action identification and functional pathway mapping [2]. Deep learning approaches have recently demonstrated remarkable success in predicting bioactivity directly from Cell Painting images, with one study across 140 diverse assays achieving an average ROC-AUC of 0.744 ± 0.108, with 62% of assays achieving ≥0.7 ROC-AUC [6]. This performance indicates that Cell Painting data contains valuable information related to bioactivity for a wide range of target and assay types that can be learned by deep learning models using relatively small sets of single-concentration activity readouts [6].
Experimental Protocol: Cell Painting Workflow
Staining and Imaging Protocol
Step-by-Step Methodology
Cell Plating: Plate cells into 96- or 384-well imaging plates at the desired confluency, typically ranging from 2,000-10,000 cells per well depending on cell type and experimental requirements [17]. Ensure uniform distribution across wells to minimize well-to-well variability.
Perturbation Introduction: Treat cells with chemical compounds (small molecules), genetic perturbations (RNAi, CRISPR/Cas9), or other modalities at appropriate concentrations [16] [17]. Include appropriate controls such as DMSO vehicle controls and known bioactive compounds for quality assessment.
Incubation: Incubate treated cells for a suitable period, typically 24-48 hours, to allow perturbations to induce morphological changes [2]. Maintain consistent environmental conditions (temperature, CO₂, humidity) throughout incubation.
Fixation and Staining: Fix cells with appropriate fixatives (commonly paraformaldehyde), permeabilize (using Triton X-100 or similar), and stain with the Cell Painting dye cocktail according to established protocols [17] [2]. Follow precise staining sequences and incubation times to ensure consistent labeling across batches.
Image Acquisition: Acquire high-content images using automated imaging systems such as confocal high-content imagers [16]. Image multiple sites per well to ensure adequate cell sampling and statistical power. The microscope used for many datasets creates an
Imagesfolder nested below the<full-plate-name>folder as part of the standardized Cell Painting Gallery structure [18].Quality Control: Perform illumination correction using functions stored in the
illumfolder of the project directory structure (e.g.,BR00117035_IllumDNA.npyfor the DNA channel) [18]. Verify image quality and staining consistency before proceeding to analysis.
Data Management and Folder Structure
Standardized Directory Organization
The Cell Painting Gallery establishes a consistent folder structure to ensure reproducibility and facilitate data sharing across research groups [18]. The parent structure follows this organization:
Image and Data Organization
For typical arrayed Cell Painting experiments, the images directory contains batch-specific subfolders organized by acquisition date (YYYY_MM_DD_<batch-name>) [18]. Each batch folder contains:
illum/directory: Contains<plate-name>subfolders with illumination correction functions (.npyfiles) for each channel [18]images/directory: Contains<full-plate-name>folders with raw images as they come off the microscope [18]
The workspace directory contains all analytical results derived from CellProfiler-based feature extraction, while workspace_dl contains results from deep learning-based feature extraction approaches [18]. This standardized structure enables consistent data processing and analysis across different experiments and research groups.
Applications in Drug Discovery
Bioactivity Prediction
Cell Painting-based morphological profiling has emerged as a powerful approach for predicting compound bioactivity across diverse targets and assays. Recent research demonstrates that models trained on Cell Painting data combined with single-concentration activity readouts can reliably predict compound activity, achieving an average ROC-AUC of 0.744 ± 0.108 across 140 diverse assays [6]. This approach enables significant enrichment of active compounds while maintaining high scaffold diversity, potentially reducing screening campaign sizes by focusing on compounds most likely to show activity [6]. The method is particularly effective for cell-based assays and kinase targets, with 62% of assays achieving ROC-AUC ≥0.7 and 30% reaching ≥0.8 [6].
Mechanism of Action Analysis
Table 2: Applications of Morphological Profiling in Drug Discovery
| Application | Methodology | Outcome |
|---|---|---|
| Mechanism of Action Identification | Clustering compounds by phenotypic similarity | Groups unannotated compounds with known MOA compounds based on profile similarity [2] |
| Target Identification | Comparing profiles induced by genetic perturbations and compound treatments | Reveals potential compound targets based on similarity to genetic perturbation profiles [2] |
| Lead Hopping | Identifying structurally diverse compounds with similar phenotypic effects | Finds compounds with same phenotypic effects but improved structural properties [2] |
| Disease Signature Reversion | Screening compounds to revert disease phenotypes to wild-type | Identifies potential drug repurposing candidates by phenotypic reversion [2] |
| Library Enrichment | Selecting diverse compounds based on morphological profiles | Maximizes phenotypic diversity while eliminating inactive compounds [2] |
The applications extend beyond traditional drug discovery, with researchers using morphological profiling to model rare genetic diseases and screen for compounds that revert disease-specific phenotypes back to wild-type states [2]. This approach has successfully identified potential new uses for existing drugs, such as in the treatment of cerebral cavernous malformation, a hereditary stroke syndrome [2]. The ability to capture subtle phenotypic changes makes Cell Painting particularly valuable for characterizing cellular heterogeneity and identifying subpopulations of cells responding differently to perturbations [2].
Morphological profiling through the Cell Painting assay provides a robust, standardized framework for extracting quantitative biological information from cellular images. The comprehensive staining strategy, coupled with high-content image analysis and standardized data management, enables researchers to capture subtle phenotypic changes induced by genetic or chemical perturbations. The resulting morphological profiles serve as rich datasets for predicting bioactivity, identifying mechanisms of action, and accelerating drug discovery efforts. As the field advances, the integration of deep learning approaches with morphological profiling continues to expand the applications and predictive power of this powerful technology, offering new opportunities to streamline early drug discovery and enable more biologically relevant primary screening approaches.
Cellular morphology is intricately linked to cell physiology, health, and function. Changes in a cell's state, whether due to disease, genetic perturbations, or exposure to chemical compounds, invariably manifest as alterations in its physical structure and organization. Cell Painting is a powerful high-content imaging assay designed to capture these morphological changes in a systematic, unbiased, and high-throughput manner. By staining and visualizing multiple key organelles and cellular components, it generates a rich, high-dimensional morphological profile that serves as a sensitive readout of the cell's physiological state and its response to perturbations [5]. This application note details the principles, protocols, and applications of Cell Painting, framing it within the broader context of accelerating drug discovery research.
The Core Principle: Morphology as a Window into Cellular State
The fundamental premise of image-based profiling is that biological perturbations with similar mechanisms of action (MoAs) produce similar morphological changes in cells. Instead of measuring a few predefined features, Cell Painting leverages a hypothesis-free approach to capture a vast array of morphological features, creating a "fingerprint" or "barcode" for the cellular state [5]. This allows researchers to:
- Identify Mechanisms of Action: Cluster compounds with similar phenotypic profiles to predict their MoA, even for uncharacterized molecules [19] [5].
- Assess Compound Safety and Toxicity: Detect undesirable morphological changes indicative of cellular toxicity [19].
- Repurpose Drugs: Identify new therapeutic uses for existing drugs by comparing their morphological signatures to those induced by various disease states [19].
The power of Cell Painting lies in its multiplexing capacity, simultaneously capturing information from multiple organelles to provide a holistic view of the cell. The table below outlines the standard stains used and the cellular components they visualize.
Table 1: Standard Stains and Cellular Components in the Cell Painting Assay
| Cellular Component / Organelle | Fluorescent Stain / Dye | Function of Component |
|---|---|---|
| Nucleus (DNA) | Hoechst 33342 | Contains genetic material and regulates cellular activities |
| Actin Cytoskeleton | Phalloidin | Maintains cell shape and enables motility |
| Endoplasmic Reticulum (ER) | Concanavalin A | Synthesizes proteins and lipids |
| Mitochondria | MitoTracker Deep Red | Generates cellular energy (ATP) |
| Golgi Apparatus & Plasma Membrane | Wheat Germ Agglutinin (WGA) | Modifies & packages proteins; defines cell boundary |
| Nucleoli & Cytoplasmic RNA | SYTO 14 | Sites of ribosome assembly; protein synthesis machinery |
Experimental Protocol: A Detailed Workflow
The following section provides a detailed methodology for executing a Cell Painting assay, from cell preparation to image acquisition.
Protocol Steps
- Plate Cells: Seed cells into 96-well or 384-well imaging plates at an appropriate confluency to ensure single, non-overlapping cells for optimal imaging. Flat cell lines like U2OS (osteosarcoma) are commonly used for their favorable imaging properties [17] [5].
- Treatment/Perturbation: Introduce the desired perturbation. This can be achieved through chemical means (e.g., small molecule compounds at various concentrations) or genetic means (e.g., CRISPR-Cas9, siRNA). Include appropriate controls, such as DMSO-only vehicle controls and reference compounds with known MoAs [17].
- Fixation and Staining:
- After a suitable treatment period (e.g., 24-48 hours), fix the cells with a formaldehyde solution (e.g., 3.7-4%) to preserve cellular structures.
- Permeabilize the cells with a detergent (e.g., 0.1% Triton X-100) to allow dyes to enter.
- Stain the cells with the cocktail of fluorescent dyes listed in Table 1. Pre-measured commercial kits, such as the Image-iT Cell Painting Kit, can simplify this process [17].
- Image Acquisition: Seal the plate and load it into a high-content screening (HCS) imaging system. Acquire images from every well using the appropriate laser lines and filters for each dye. The total imaging time depends on the number of images per well, sample brightness, and the extent of z-dimensional sampling [17]. A typical setup captures images in five channels to visualize the six stains, as some signals are merged.
- Image and Data Analysis:
- Use automated image analysis software (e.g., CellProfiler, DeepProfiler) to extract morphological features from every cell in each channel. These features can number over 1,500 per cell and include measurements of size, shape, texture, and intensity [17] [5].
- The resulting high-dimensional data is then processed using bioinformatics and machine learning techniques, such as cluster analysis, to generate phenotypic profiles and compare perturbations [17].
Workflow Visualization
The following diagram illustrates the complete end-to-end Cell Painting workflow.
Data Analysis: From Images to Biological Insights
The raw images generated by the Cell Painting assay are processed through a sophisticated analysis pipeline to extract biologically meaningful information.
- Feature Extraction: Automated software, such as CellProfiler, identifies individual cells and measures thousands of morphological features. These can be aggregated to the well level to create a profile for each perturbation [5].
- Quality Control and Normalization: Data is cleaned to remove artifacts, and normalization is applied to correct for technical variations like batch effects [19].
- Dimensionality Reduction and Profiling: The high-dimensional data is often analyzed using unsupervised machine learning methods. Profiles are compared to identify similarities, often visualized using clustering algorithms or dimensionality reduction techniques like t-Distributed Stochastic Neighbor Embedding (t-SNE) [20].
The following diagram outlines the key computational steps in the data analysis pipeline.
Quantitative Morphological Features
The features extracted can be broadly categorized, providing a comprehensive quantitative description of cell state. The table below summarizes the types and examples of these features.
Table 2: Categories of Quantitative Morphological Features Extracted in Cell Painting
| Feature Category | Description | Example Measurements |
|---|---|---|
| Size & Shape | Describes the geometric properties of cells and organelles. | Area, Perimeter, Major/Minor Axis Length, Eccentricity, Form Factor, Solidity |
| Intensity | Measures the brightness and distribution of fluorescence, reflecting stain uptake and density. | Mean/Median Intensity, Integrated Intensity, Intensity Standard Deviation |
| Texture | Quantifies patterns and internal organization within an organelle, capturing granularity and homogeneity. | Haralick Features (Contrast, Correlation, Entropy), Gabor Features, Granularity |
| Spatial Relations | Describes the relative positions and organization between different organelles. | Distance between organelles, Radial Distribution of Intensity, Colocalization Coefficients |
Advanced Innovations and Integrative Approaches
The Cell Painting field is rapidly evolving, with innovations expanding its capabilities and integration with other data types deepening biological insights.
Expanding Multiplexing Capacity
Innovations like the Cell Painting PLUS (CPP) assay have been developed to overcome the multiplexing limitations of the original protocol. CPP uses iterative staining-elution cycles, allowing for the labeling of at least nine different subcellular compartments (including lysosomes) with each dye imaged in a separate channel. This significantly improves organelle-specificity and the diversity of phenotypic profiles [21].
Integration with Other Omics Technologies
A powerful trend is the integration of morphological profiling with other -omics data, such as transcriptomics (gene expression). This multi-modal approach provides a more comprehensive view of a compound's effect on a cell [19].
- Transcriptomics and Morphology: Gene expression data can describe biological systems before and after compound treatment, useful for matching compounds to disease states (drug repurposing) and characterizing efficacy and safety [19].
- Computational Prediction of Morphology: Advanced AI models, such as MorphDiff, a transcriptome-guided latent diffusion model, can now simulate high-fidelity cell morphological responses to perturbations based on gene expression data alone. This in-silico approach can predict morphology for unseen perturbations, dramatically accelerating the exploration of the vast chemical and genetic perturbation space [22].
The Scientist's Toolkit: Essential Research Reagents
Successful implementation of the Cell Painting assay relies on a core set of materials and reagents. The following table details these essential components.
Table 3: Key Research Reagent Solutions for Cell Painting
| Reagent / Material | Function / Role in the Assay | Examples / Notes |
|---|---|---|
| Cell Lines | Biological system for testing perturbations. | U2OS, A549; selected for flat morphology and relevance to disease [5] |
| Fluorescent Dyes | Visualize specific organelles and structures. | Image-iT Cell Painting Kit; individual dyes (Hoechst, Phalloidin, etc.) [17] |
| Cell Culture Plates | Vessel for cell growth and assay execution. | 96-well or 384-well imaging microplates with clear bottoms |
| Fixation & Permeabilization Reagents | Preserve cell structure and enable dye entry. | Formaldehyde (fixative), Triton X-100 (permeabilization agent) |
| High-Content Imager | Automated microscope for high-throughput image acquisition. | Systems from Thermo Fisher, PerkinElmer, etc., with appropriate filters [17] |
| Image Analysis Software | Extract quantitative features from images. | CellProfiler (open-source), DeepProfiler, or commercial solutions [5] |
Cell Painting has established itself as a cornerstone technology in phenotypic drug discovery by providing a direct, quantifiable, and high-throughput link between cellular morphology and physiological state. Its ability to unbiasedly profile the effects of genetic and chemical perturbations enables critical tasks such as MoA prediction, toxicity assessment, and drug repurposing. Continued innovation in assay multiplexing, exemplified by Cell Painting PLUS, and the powerful integration with transcriptomics data through AI models like MorphDiff, are pushing the boundaries of what is possible. As these tools become more accessible and standardized, Cell Painting is poised to play an increasingly vital role in improving the efficiency and success of therapeutic development.
Implementing Cell Painting: Protocols and Applications in MoA Identification and Repurposing
Within modern drug discovery, the Cell Painting assay has emerged as a powerful high-throughput phenotypic profiling (HTPP) method for capturing complex morphological changes in cells treated with chemical or genetic perturbations [5]. This untargeted, image-based profiling approach leverages multiplexed fluorescent microscopy to visualize multiple organelles simultaneously, generating rich, high-dimensional datasets that can reveal a compound's mechanism of action (MoA) and toxicity profile [23] [5]. As a complementary New Approach Methodology (NAM), Cell Painting provides a cost-effective and efficient alternative to traditional toxicological approaches, with regulatory agencies already applying HTPP in chemical hazard screening [23]. This application note details a standardized, accessible protocol for implementing Cell Painting in medium-throughput laboratories using 96-well plates, enabling broader adoption across the research community.
The Cell Painting Assay: Principle and Applications
Cell Painting is a microscopy-based cell labeling strategy that uses a panel of fluorescent dyes to "paint" major cellular components and organelles, thereby capturing the phenotypic state of cells and their responses to perturbations [5]. The standard assay stains eight cellular components: nuclear DNA, nucleoli, cytoplasmic RNA, endoplasmic reticulum, actin cytoskeleton, Golgi apparatus, plasma membrane, and mitochondria [5] [17]. When coupled with high-content imaging systems and automated image analysis software, Cell Painting can extract approximately 1,500 morphological measurements from each cell based on changes in size, shape, texture, and fluorescence intensity [17].
The ability to profile cellular morphology in an untargeted manner makes Cell Painting particularly valuable for phenotypic drug discovery (PDD), which identifies compounds that alter disease phenotypes without pre-selecting molecular targets [5]. Mounting evidence suggests that PDD yields more first-in-class medicines than target-based drug discovery, making phenotypic strategies increasingly favored for polygenic diseases and those with undruggable targets [5]. Beyond drug discovery, Cell Painting has been applied to hazard assessment of industrial chemicals, functional genomics, and elucidating disease mechanisms [21] [5].
Standardized Workflow for Cell Painting
The following section outlines a standardized end-to-end protocol for Cell Painting, from initial cell seeding through to high-content imaging and data analysis. This protocol has been adapted from established 384-well plate methods to enhance accessibility for laboratories with lower throughput capabilities [23].
Workflow Visualization
The diagram below illustrates the complete standardized workflow for the Cell Painting assay:
Figure 1: Complete Standardized Workflow for Cell Painting Assay
Detailed Experimental Protocols
Cell Culture and Seeding
Cell Line Selection:
- U-2 OS human osteosarcoma cells are widely used due to their flat morphology that minimizes overlap, facilitating robust spatial imaging [23] [5]. Other common cell lines include A549, MCF-7, and HepG2, with selection often dependent on research goals [5].
- Cells should be maintained within recommended passage numbers (e.g., used within three passages after thawing for U-2 OS cells) to ensure phenotypic consistency [23].
Seeding Protocol for 96-Well Plates:
- Plate cells at a density of 5,000 cells/well in 100 μL of complete growth medium using a manual multi-channel pipette [23]. The table below summarizes the effects of seeding density on assay outcomes.
- Allow cells to adhere for 24 hours under standard culture conditions (37°C, 5% CO₂) before treatment [23].
- Maintain cell density below 80-90% confluence prior to passaging and seeding [23].
Table 1: Effects of Cell Seeding Density on Cell Painting Assay Outcomes
| Seeding Density | Impact on Morphological Profiles | Recommended Applications |
|---|---|---|
| Low (2,000-5,000 cells/well) | Increased Mahalanobis distances, enhanced sensitivity to subtle phenotypes [23] | Primary screening for active compounds |
| Medium (5,000-7,500 cells/well) | Balanced signal-to-noise ratio, optimal for benchmark concentration (BMC) calculations [23] | Standard hazard assessment and potency ranking |
| High (>7,500 cells/well) | Reduced morphological discrimination, potential clustering artifacts [5] | Not recommended for standard Cell Painting |
Chemical Treatment and Perturbation
Preparation of Treatment Solutions:
- Dissolve reference compounds or test substances in cell culture-grade dimethyl sulfoxide (DMSO) to prepare stock solutions [23].
- Prepare treatment solutions in sterile 96-well plates at 200× the final treatment concentration in DMSO [23].
- Use half-log unit serial dilutions to create an 8-point concentration series for dose-response modeling [23].
Exposure Protocol:
- Prepare exposure media in deep-well plates by adding treatment solutions to culture media at 0.5% v/v (final DMSO concentration) [23].
- Include vehicle controls with DMSO at 0.5% v/v in media and appropriate phenotypic controls (e.g., sorbitol as negative control, staurosporine as cytotoxic control) [23].
- Remove growth media from seeded plates and replace with exposure media using a 12-channel pipette [23].
- Expose cells for 24 hours under standard culture conditions [23].
Fixation and Staining
Fixation and Permeabilization:
- After treatment, aspirate exposure media and fix cells with appropriate fixative (e.g., 4% paraformaldehyde) for 20 minutes at room temperature [17].
- Permeabilize cells with 0.1% Triton X-100 in PBS for 15 minutes [17].
- Wash cells with PBS before proceeding to staining.
Multiplexed Fluorescent Staining: The standard Cell Painting panel uses six fluorescent stains captured in five imaging channels:
Table 2: Cell Painting Staining Panel and Imaging Channels
| Cellular Target | Fluorescent Dye | Excitation/Emission | Imaging Channel |
|---|---|---|---|
| Nuclear DNA | Hoechst 33342 | 350/461 nm | Channel 1 (Blue) |
| Endoplasmic Reticulum | Concanavalin A, Alexa Fluor 488 conjugate | 495/519 nm | Channel 2 (Green) |
| Nucleoli & Cytoplasmic RNA | SYTO 14 | 517/545 nm | Channel 2 (Green) |
| Actin Cytoskeleton | Phalloidin, Alexa Fluor 555 conjugate | 553/568 nm | Channel 3 (Red) |
| Golgi Apparatus & Plasma Membrane | Wheat Germ Agglutinin, Alexa Fluor 647 conjugate | 650/668 nm | Channel 4 (Far Red) |
| Mitochondria | MitoTracker Deep Red | 644/665 nm | Channel 5 (Near Infrared) |
Staining Protocol:
- Prepare staining solution in PBS according to manufacturer's recommendations or established protocols [17].
- Add staining solution to fixed and permeabilized cells and incubate for 30-60 minutes at room temperature protected from light [17].
- Rinse wells with PBS to remove unbound dye.
- For extended storage, add PBS with antifungal agent and store plates at 4°C in the dark [23]. Image within 24 hours for optimal signal stability [21].
High-Content Imaging
Imaging Systems:
- Use high-content screening (HCS) systems such as the Opera Phenix (PerkinElmer) or CellInsight CX7 LZR Pro (Thermo Fisher) designed for automated imaging of multi-well plates [23] [17].
- Systems should be equipped with appropriate laser lines and filters to capture the five fluorescence channels [17].
Image Acquisition Parameters:
- Acquire multiple images per well to ensure adequate cell sampling (typically 9-25 fields per well depending on cell density) [23].
- Use 20× or 40× objectives for sufficient resolution to capture subcellular morphology [17].
- Set exposure times for each channel to optimize dynamic range without saturation [21].
- For the CPPJUMP1 dataset, approximately 3 million images were acquired, profiling 75 million single cells [3].
Image Analysis and Feature Extraction
Automated Image Analysis:
- Use automated image analysis software such as CellProfiler, Columbus, or commercial alternatives to extract morphological features [23] [5].
- The analysis pipeline typically includes cell segmentation, feature extraction, and data normalization [5].
Feature Extraction:
- Extract approximately 1,300-1,500 morphological features per cell, including size, shape, intensity, and texture measurements for each cellular compartment [23] [17].
- Common features include Zernike moments, Haralick texture features, and morphological descriptors (e.g., eccentricity, solidity) [5].
Data Processing and Normalization:
- Normalize feature values to vehicle control cells to account for plate-to-plate variability [23].
- Apply batch effect correction methods to minimize technical variations [5].
- Aggregate single-cell data to well-level profiles for downstream analysis [3].
Morphological Profiling and Data Analysis
Dimensionality Reduction and Profiling:
- Apply principal component analysis (PCA) to reduce the high-dimensional feature space [23].
- Calculate Mahalanobis distance for each treatment concentration to quantify morphological changes from control [23].
- Use cosine similarity to compare profiles and identify compounds with similar mechanisms of action [3].
Benchmark Concentration (BMC) Calculation:
- Model concentration-response relationships using Mahalanobis distances [23].
- Calculate benchmark concentrations (BMCs) for chemical-induced phenotypic changes [23].
- Most BMCs show intra-laboratory consistency with differences of less than one order of magnitude across experiments [23].
Advanced Adaptations and Future Directions
Cell Painting PLUS (CPP)
The recently developed Cell Painting PLUS (CPP) assay expands the multiplexing capacity of traditional Cell Painting through iterative staining-elution cycles [21]. This approach enables:
- Multiplexing of at least seven fluorescent dyes labeling nine different subcellular compartments
- Fully sequential imaging of each dye in separate channels for improved signal specificity
- Customization of dye panels for specific research questions [21]
CPP uses an optimized elution buffer (0.5 M L-Glycine, 1% SDS, pH 2.5) to efficiently remove staining signals between cycles while preserving subcellular morphologies [21].
Artificial Intelligence in Image Analysis
Machine learning and deep learning approaches are increasingly being applied to Cell Painting data:
- Deep learning models can automatically learn features directly from image pixels, potentially capturing morphological patterns missed by hand-engineered features [3].
- The JUMP Cell Painting Consortium has created benchmark datasets (CPJUMP1) to facilitate development of computational methods [3].
- AI-powered platforms like Uni-AIMS are being developed to address challenges in microscopy image analysis, including instance segmentation in high-density images [24].
The Scientist's Toolkit: Essential Materials and Reagents
Table 3: Essential Research Reagent Solutions for Cell Painting Assays
| Item | Function/Purpose | Example Products/Specifications |
|---|---|---|
| Cell Lines | Provides cellular context for morphological profiling | U-2 OS (osteosarcoma), A549 (lung carcinoma), MCF-7 (breast cancer) [23] [5] |
| Fluorescent Dyes | Labels specific cellular compartments for visualization | Image-iT Cell Painting Kit; Individual dyes: Hoechst 33342, Concanavalin A Alexa Fluor 488, SYTO 14, Phalloidin Alexa Fluor 555, WGA Alexa Fluor 647, MitoTracker Deep Red [17] |
| Cell Culture Plates | Platform for cell growth and treatment | 96-well or 384-well imaging-optimized microplates (e.g., PhenoPlate, Revvity) [23] |
| High-Content Imager | Automated image acquisition | Opera Phenix (PerkinElmer), CellInsight CX7 LZR Pro (Thermo Fisher) [23] [17] |
| Image Analysis Software | Feature extraction and data processing | CellProfiler (open source), Columbus (PerkinElmer), IN Carta (Sartorius) [23] [5] |
| Chemical Perturbagens | Induces morphological changes for profiling | Reference compounds with known mechanisms of action; compound libraries for screening [23] [3] |
This application note presents a standardized workflow for implementing Cell Painting assays in 96-well plate formats, making high-throughput phenotypic profiling accessible to medium-throughput laboratories. The detailed protocols for cell seeding, staining, imaging, and analysis provide researchers with a robust framework for generating high-quality morphological profiles. The adaptability of Cell Painting across formats and laboratories supports its development and validation as a complementary new approach methodology to existing toxicity tests and drug discovery platforms [23]. As the field advances, integration with artificial intelligence and expanded multiplexing approaches like Cell Painting PLUS will further enhance the utility of morphological profiling in biological discovery and drug development.
Image-based profiling is a maturing strategy in modern drug discovery that transforms rich biological images into multidimensional data profiles [25]. This approach captures the morphological state of cells induced by chemical or genetic perturbations, allowing researchers to quantitatively compare these changes across vast experimental conditions [3]. The Cell Painting assay has emerged as a particularly powerful unbiased method for this purpose, using up to six fluorescent dyes to label key cellular components, thereby "painting" a comprehensive picture of cellular morphology [16]. The resulting high-content images undergo a sophisticated computational pipeline involving segmentation, feature extraction, and profile aggregation to generate quantitative morphological profiles that can reveal drug mechanisms of action, toxicity predictors, and novel disease biology [25] [3]. This protocol details the complete data analysis workflow within the context of a broader thesis applying morphological profiling to advance pharmaceutical research.
The Cell Painting Assay: Foundation for Profiling
Assay Principle and Staining Strategy
Cell Painting is a high-content, multiplexed image-based assay designed for comprehensive cytological profiling [16]. The core principle involves using a combination of fluorescent dyes to label as many cellular compartments as possible to capture a representative image of the whole cell's state. The standard staining panel includes:
- Nuclei: Stained with Hoechst 33342
- Mitochondria: Stained with MitoTracker Deep Red
- Endoplasmic Reticulum: Stained with Concanavalin A/Alexa Fluor 488 conjugate
- Nucleoli and Cytoplasmic RNA: Stained with SYTO 14 green fluorescent nucleic acid stain
- F-actin Cytoskeleton, Golgi Apparatus, and Plasma Membrane: Stained with Phalloidin/Alexa Fluor 568 conjugate and wheat-germ agglutinin/Alexa Fluor 555 conjugate [16]
This multiplexed approach generates five-channel images that collectively capture thousands of morphological features affected by genetic or chemical perturbations, enabling detection of subtle phenotypic changes that might escape manual observation.
Experimental Workflow and Platform
The general workflow for a Cell Painting experiment follows a standardized sequence optimized for high-content screening:
- Plate cells into appropriate labware (typically 384-well plates for high-throughput applications)
- Treat cells with chemical or genetic perturbations (e.g., small molecules, RNAi, CRISPR/Cas9)
- Stain cells with the standardized Cell Painting dye cocktail after a suitable incubation period
- Acquire images using a high-content imaging system (e.g., ImageXpress Confocal HT.ai)
- Analyze images to extract features using automated image analysis software
- Derive morphological profiles from measurements for biological interpretation [16]
This workflow has been successfully implemented in large-scale consortium efforts, such as the JUMP Cell Painting Consortium, which recently generated a resource dataset (CPJUMP1) containing approximately 3 million images and morphological profiles of 75 million single cells treated with matched chemical and genetic perturbations [3].
Computational Pipeline: From Images to Profiles
Image Segmentation and Object Identification
The computational pipeline begins with image segmentation, where distinct cellular objects are identified within each channel of the acquired images. This process typically involves:
- Nuclei Identification: Using the Hoechst channel to identify individual nuclei through threshold-based or machine-learning segmentation algorithms
- Cell Boundary Delineation: Using the actin or plasma membrane channels to define cytoplasmic boundaries
- Organelle Identification: Segmenting subcellular compartments such as mitochondria, nucleoli, and endoplasmic reticulum within the defined cellular boundaries
CellProfiler is widely used for this segmentation process, with published pipelines available for various experimental setups [26]. The quality of segmentation critically impacts downstream analysis, making this step fundamental to the entire pipeline.
Feature Extraction and Quantification
Following segmentation, hundreds to thousands of morphological features are extracted for each cell using classical image processing algorithms. These features comprehensively capture different aspects of cellular morphology:
- Intensity Features: Mean, median, and standard deviation of pixel intensities within each compartment
- Texture Features: Haralick features, Gabor filters, and granularity measurements that capture patterns within each channel
- Shape Features: Area, perimeter, eccentricity, form factor, and other geometric descriptors
- Spatial Features: Relationships between organelles, distances between compartments, and spatial distribution patterns
The resulting feature vectors typically comprise 1,000-2,000 measurements per cell, creating a high-dimensional representation of each cell's morphological state [16] [3]. This extensive feature set enables detection of subtle phenotypic changes across multiple cellular compartments.
Profile Aggregation and Normalization
With features extracted at the single-cell level, the pipeline then aggregates these measurements to create well-level profiles suitable for comparison across perturbations:
- Cell-level to Well-level Aggregation: Median or mean values are calculated across all cells within each well
- Batch Effect Correction: Technical variations across plates and experimental batches are mitigated using normalization methods
- Quality Control: Identification and handling of outliers, contaminated wells, or failed experiments
The aggregated profiles create a morphological "fingerprint" for each perturbation, which can then be compared using similarity metrics like cosine similarity to identify relationships between different genetic and chemical treatments [3].
Table 1: Key Studies Utilizing CellProfiler for Image-Based Profiling
| Publication Year | Research Focus | CellProfiler Version | Key Application |
|---|---|---|---|
| 2025 [26] | Synaptic pruning in human microglia | 4.2.5 | Identification of brain-penetrant small molecules |
| 2025 [26] | Homologous recombination in BRCA2 deficient cells | 4.2.6 | DNA repair mechanism analysis |
| 2023 [26] | Organelle morphology and content quantification | 4.2.1 | Automated segmentation and analysis |
| 2023 [26] | Neuron morphology regulation | 4.2.1 | Medium-throughput compound screening |
| 2022 [26] | Endosomal lipid signaling | 4.1.3 | ER reshaping and mitochondrial function |
Experimental Protocols and Methodologies
Protocol: High-Content Screening with Cell Painting
Objective: To generate morphological profiles for chemical compounds to identify mechanisms of action or predict bioactivity.
Materials:
- U2OS or A549 cells (or other relevant cell lines)
- 384-well tissue culture plates
- Cell Painting dye cocktail [16]
- High-content imaging system (e.g., ImageXpress Confocal HT.ai)
- CellProfiler software [26]
Procedure:
- Cell Plating: Plate cells at optimal density in 384-well plates and incubate for 24 hours
- Compound Treatment: Treat cells with chemical compounds at appropriate concentrations (typically 1-10 μM) in duplicate or triplicate
- Incubation: Incubate for desired time period (typically 24-48 hours)
- Staining: Fix and stain cells with Cell Painting dye cocktail according to established protocols [16]
- Image Acquisition: Image plates using 20x or 40x objective, capturing 5-9 sites per well
- Image Analysis: Process images through CellProfiler pipeline for segmentation and feature extraction
- Profile Generation: Aggregate single-cell data to well-level profiles and normalize using appropriate controls
Quality Control:
- Include DMSO controls in every plate
- Monitor cell density and health across plates
- Validate staining consistency across experimental batches
- Implement Z'-factor calculations to ensure assay robustness
Protocol: Genetic Perturbation Screening
Objective: To generate morphological profiles for genetic perturbations (CRISPR knockout or ORF overexpression) for functional genomics.
Materials:
- CRISPR guides or ORF constructs targeting genes of interest
- Lentiviral packaging system for delivery
- Appropriate selection antibiotics
Procedure:
- Viral Production: Produce lentivirus containing CRISPR guides or ORF constructs
- Cell Infection: Infect target cells at appropriate MOI
- Selection: Apply antibiotic selection to generate stable pools
- Validation: Verify perturbation efficiency via qPCR or Western blot
- Profiling: Proceed with Cell Painting assay as described in Section 4.1
The JUMP Cell Painting Consortium established that CRISPR knockout generally produces stronger morphological phenotypes than ORF overexpression, though both approaches generate valuable profiling data [3].
Data Analysis and Interpretation
Perturbation Detection and Quality Assessment
The first analytical step involves determining which perturbations produce detectable morphological signals compared to negative controls. The JUMP Consortium protocol recommends:
- Replicate Retrieval: Measuring the ability to retrieve replicate perturbations against a background of negative controls
- Similarity Metric: Using cosine similarity between well-level profiles
- Statistical Testing: Applying permutation testing to obtain p-values, followed by false discovery rate correction (q-values)
In typical experiments, compounds produce the strongest phenotypic signals, followed by CRISPR knockouts, with ORF overexpression generating the weakest but still detectable signals [3].
Perturbation Matching and Mechanism of Action
A primary application of morphological profiling is identifying perturbations with similar mechanisms by comparing their profiles:
- Similarity Assessment: Calculating cosine similarity (or absolute cosine similarity) between all perturbation pairs
- Ground Truth Validation: Using known gene-compound target relationships as positive controls
- Benchmarking: Evaluating representation learning methods by their ability to correctly group targeted perturbations
This approach enables mechanism of action prediction for uncharacterized compounds and functional annotation for genetic perturbations [3].
Table 2: Performance Metrics in Morphological Profiling Studies
| Perturbation Type | Typical Detection Rate | Key Applications | Reference Dataset |
|---|---|---|---|
| Chemical Compounds | Highest | Mechanism of action, toxicity prediction | CPJUMP1: 303 compounds [3] |
| CRISPR Knockout | Intermediate | Gene function annotation, pathway analysis | CPJUMP1: 160 genes [3] |
| ORF Overexpression | Lower | Gene function, dominant-negative effects | CPJUMP1: 160 genes [3] |
| Clinical Drugs | Variable | Drug repurposing, side effect prediction | Drug Repurposing Hub [3] |
Research Reagent Solutions
Table 3: Essential Materials for Cell Painting and Morphological Profiling
| Reagent/Resource | Function | Example Specifications |
|---|---|---|
| Cell Painting Dye Cocktail [16] | Multiplexed staining of cellular compartments | Hoechst 33342 (nuclei), MitoTracker Deep Red (mitochondria), Concanavalin A/Alexa Fluor 488 (ER), SYTO 14 (RNA), Phalloidin/Alexa Fluor 568 (F-actin), WGA/Alexa Fluor 555 (Golgi) |
| Cell Lines | Model systems for perturbation | U2OS (osteosarcoma), A549 (lung carcinoma) commonly used [3] |
| 384-well Plates | High-throughput screening format | Tissue culture treated, optical quality bottom |
| High-content Imager | Image acquisition | ImageXpress Confocal HT.ai or similar system [16] |
| CellProfiler Software [26] | Image analysis and feature extraction | Open-source, with published pipelines for various applications |
| Chemical Libraries | Perturbation sources | Drug Repurposing Hub, commercially available compound collections [3] |
| CRISPR Libraries | Genetic perturbation | Targeted gene sets or genome-wide libraries |
Workflow Visualization
Morphological Profiling Computational Workflow
Profile Analysis and Application Pathways
Phenotypic drug discovery (PDD) identifies compounds that alter a disease phenotype in a living system without requiring prior knowledge of a specific molecular target [5]. This approach has proven particularly valuable for identifying first-in-class medicines, as it operates in a biologically relevant context and can reveal novel mechanisms of action [27]. A crucial step following phenotypic screening is mechanism of action (MoA) deconvolution—the process of identifying the molecular targets and biological pathways through which active compounds exert their effects [28] [29].
Clustering compounds by phenotypic similarity has emerged as a powerful strategy for MoA deconvolution. This approach operates on the "guilt-by-association" principle: compounds that induce similar phenotypic profiles likely share molecular targets or act on connected pathways [30] [31]. Modern image-based profiling technologies, particularly the Cell Painting assay, have revolutionized this paradigm by enabling high-dimensional quantification of morphological changes across multiple cellular components [5].
The Cell Painting Assay for Morphological Profiling
Assay Principles and Implementation
Cell Painting is a high-content imaging assay that uses multiplexed fluorescent dyes to visualize and quantify morphological features across eight major cellular components [5]. The standard staining protocol utilizes six reagents imaged across five fluorescent channels, generating rich morphological profiles for each cell [10].
Table: Standard Cell Painting Staining Reagents and Cellular Targets
| Fluorescent Dye | Cellular Target | Staining Type |
|---|---|---|
| Hoechst 33342 | DNA (Nucleus) | Live-cell permeable |
| Concanavalin A | Endoplasmic Reticulum | Fixed-cell staining |
| SYTO 14 | Nucleoli & Cytoplasmic RNA | Live-cell permeable |
| Phalloidin | F-actin (Cytoskeleton) | Fixed-cell staining |
| Wheat Germ Agglutinin (WGA) | Golgi & Plasma Membrane | Fixed-cell staining |
| MitoTracker Deep Red | Mitochondria | Live-cell permeable |
The power of Cell Painting lies in its ability to capture multiparametric morphological data. Automated image analysis pipelines extract hundreds of quantitative features from each cell, including measurements of size, shape, texture, and intensity across all stained compartments [5]. When combined, these features create a high-dimensional morphological profile that serves as a comprehensive fingerprint of cellular state [31].
Experimental Workflow for Phenotypic Profiling
The following diagram illustrates the complete experimental workflow for MoA deconvolution using Cell Painting and phenotypic clustering:
Quantitative Profiling and Clustering Methodologies
Data Processing and Analysis Pipeline
Following image acquisition, Cell Painting data undergoes extensive computational processing to enable phenotypic clustering. The workflow involves feature extraction, data normalization, and dimensionality reduction before clustering analysis [5]. Feature extraction typically yields over 1,500 morphological measurements per cell, capturing diverse aspects of cellular organization [10]. These features are then aggregated per treatment condition and normalized to account for technical variability and batch effects [5].
Dimensionality reduction techniques such as t-distributed Stochastic Neighbor Embedding (t-SNE) are commonly employed to visualize high-dimensional phenotypic profiles in two or three dimensions [31]. This step facilitates the identification of inherent groupings in the data before formal clustering analysis. In a recent study profiling 196 small molecules in HCT116 colorectal cancer cells, t-SNE followed by density-based clustering revealed 18 distinct phenotypic clusters based on morphological similarity [31].
Clustering Compounds by Phenotypic Similarity
The core principle of MoA deconvolution through phenotypic clustering is that compounds sharing similar mechanisms will induce comparable morphological changes [30]. Cluster analysis groups compounds based on the similarity of their high-dimensional phenotypic profiles, with the expectation that each cluster will be enriched for compounds acting through related biological pathways [31].
Table: Representative Phenotypic Clusters and Enriched MoA Classes from HCT116 Screening
| Cluster ID | Enriched Mechanism of Action Classes | Phenotype Strength | Target Diversity |
|---|---|---|---|
| Cluster 1 | mTOR/PI3K inhibitors | Strong | Low |
| Cluster 2 | Spindle poisons, Tubulin inhibitors | Strong | Low |
| Cluster 3 | Transcriptional CDK inhibitors | Strong | Low |
| Cluster 4 | DNA synthesis inhibitors | Moderate | High |
| Cluster 5 | Kinase inhibitors (diverse) | Moderate | High |
| Micro-cluster A | Unknown/Novel mechanisms | Subtle | N/A |
Interestingly, phenotypic clustering sometimes reveals convergence where compounds from different target classes elicit similar morphological outcomes, suggesting shared downstream effects or cellular stress responses [31]. This observation highlights the complexity of cellular responses to perturbation and the value of unbiased phenotypic approaches for discovering unexpected biological connections.
Integrative Approaches and Complementary Technologies
Multi-Modal Data Integration
While Cell Painting provides rich morphological data, integrating it with other data types significantly enhances MoA prediction accuracy. A large-scale study comparing chemical structures (CS), morphological profiles (MO) from Cell Painting, and gene expression profiles (GE) from the L1000 assay demonstrated that each modality captures complementary biological information [32].
Table: Predictive Performance of Different Profiling Modalities for Bioactivity Assessment
| Profiling Modality | Number of Accurately Predicted Assays (AUROC >0.9) | Unique Strengths | Implementation Scale |
|---|---|---|---|
| Chemical Structure (CS) | 16 | Always available, virtual screening | High (computational) |
| Morphological Profile (MO) | 28 | Captures systems-level phenotypes | Medium (experimental) |
| Gene Expression (GE) | 19 | Pathway-level information | Medium (experimental) |
| Combined CS + MO | 31 | Complementary information | Hybrid |
| All Modalities Combined | 44 (21% of assays) | Maximum coverage | Hybrid |
The study found that combining morphological profiles with chemical structures enabled accurate prediction of 31 assays compared to just 16 for chemical structures alone—nearly a two-fold improvement [32]. This synergy demonstrates the value of incorporating phenotypic data into compound annotation and MoA prediction workflows.
Experimental Target Deconvolution Methods
While phenotypic clustering generates hypotheses about MoA, experimental validation typically requires complementary target deconvolution approaches. Several chemoproteomic methods have been developed specifically for this purpose:
Affinity Chromatography: Small molecules are immobilized on solid supports and used to isolate bound protein targets from complex proteomes [28] [29]. This approach requires careful optimization to ensure that modification does not disrupt compound activity, often achieved through "click chemistry" with minimal tags [28].
Activity-Based Protein Profiling (ABPP): ABPP uses specialized probes containing reactive electrophiles that covalently modify active site nucleophiles of enzyme families [28]. When combined with phenotypic screening, ABPP can directly link compound activity to specific enzyme classes [28].
Photoaffinity Labeling (PAL): PAL incorporates photoreactive groups that form covalent bonds with target proteins upon light exposure, particularly useful for capturing transient interactions or studying membrane proteins [29].
The following diagram illustrates how these experimental methods complement phenotypic clustering in the MoA deconvolution workflow:
Research Reagent Solutions for Cell Painting
Implementing a robust phenotypic screening pipeline requires carefully selected reagents and tools. The following table outlines essential components for establishing Cell Painting assays:
Table: Essential Research Reagents for Cell Painting Implementation
| Reagent Category | Specific Examples | Function in Assay | Implementation Notes |
|---|---|---|---|
| Fluorescent Dyes | Hoechst 33342, MitoTracker Deep Red, Phalloidin conjugates | Visualize specific cellular compartments | Optimize concentration to minimize spectral overlap [10] |
| Cell Lines | U2OS, A549, HCT116, HepG2 | Provide cellular context for screening | Select based on phenotypic responsiveness and application relevance [5] [31] |
| Staining Kits | Invitrogen Image-iT Cell Painting Kit | Standardized reagent collection | Includes 6 reagents for comprehensive staining [10] |
| Imaging Platforms | Thermo Scientific CellInsight CX7 LZR Pro | Automated high-content imaging | Advanced optics reduce spectral crosstalk [10] |
| Image Analysis Software | CellProfiler, HDB | Feature extraction and quantification | Open-source and commercial options available [5] |
Protocol: Implementing Phenotypic Clustering for MoA Studies
Cell Painting Assay Protocol
The following protocol is adapted from established methodologies with specific optimizations for phenotypic clustering applications [5] [31]:
Cell Seeding: Plate HCT116 cells at 1,000 cells per well in 384-well plates. Incubate for 24 hours at 37°C with 5% CO₂ to ensure proper attachment and uniform distribution.
Compound Treatment: Add test compounds at 1μM final concentration using a randomized plate layout to minimize positional effects. Include DMSO controls (0.1-0.5% final concentration) and reference compounds with known MoAs as positive controls.
Incubation: Treat cells for 24-48 hours to capture both acute and adaptive morphological responses. The optimal treatment duration may vary by cell line and application.
Staining and Fixation:
- Remove medium and wash with PBS
- Add MitoTracker Deep Red in serum-free medium (100nM), incubate 30 minutes
- Fix with 4% formaldehyde for 20 minutes
- Permeabilize with 0.1% Triton X-100 for 15 minutes
- Stain with Hoechst 33342 (DNA), Phalloidin (F-actin), WGA (Golgi/plasma membrane), Concanavalin A (ER), and SYTO 14 (RNA) according to manufacturer recommendations
Image Acquisition: Acquire images across 5 fluorescent channels using a high-content imaging system with a 20x objective. Capture at least 9 fields per well to ensure adequate cell sampling.
Image Analysis and Phenotypic Profiling
Image Processing: Use CellProfiler to identify individual cells and segment cellular compartments based on fluorescent markers [5].
Feature Extraction: Calculate ~1,500 morphological features for each cell, including:
- Size measurements: Area, perimeter of cellular structures
- Shape descriptors: Eccentricity, form factor, solidity
- Intensity features: Mean, median, standard deviation of pixel intensities
- Texture metrics: Haralick features, granularity patterns
- Spatial relationships: Relative positions of organelles
Data Normalization: Apply robust z-score normalization or plate-based normalization to correct for technical variability and batch effects [5].
Clustering Analysis and MoA Interpretation
Profile Aggregation: Compute median feature values for each treatment condition to generate compound-level profiles.
Dimensionality Reduction: Apply t-SNE or UMAP to project high-dimensional profiles into 2D space for visualization and initial cluster assessment [31].
Clustering: Perform density-based clustering (e.g., DBSCAN) or hierarchical clustering to group compounds with similar phenotypic profiles.
MoA Annotation:
- Identify clusters enriched for compounds with known mechanisms
- Use gene set enrichment analysis to identify biological pathways associated with each phenotypic cluster
- Generate hypotheses about novel mechanisms for unannotated compounds in each cluster
Experimental Validation: Prioritize clusters of interest for further investigation using chemical proteomics, genetic approaches, or secondary functional assays to confirm predicted mechanisms.
Clustering compounds by phenotypic similarity using Cell Painting profiling represents a powerful framework for MoA deconvolution in phenotypic drug discovery. This approach leverages high-dimensional morphological data to group compounds based on shared biological activities, enabling researchers to prioritize hits, predict mechanisms, and identify novel therapeutic opportunities. When combined with complementary target identification methods and multi-omics data integration, phenotypic clustering significantly accelerates the translation of phenotypic screening hits into mechanistically understood lead compounds. As image analysis algorithms and profiling technologies continue to advance, these approaches will play an increasingly central role in modern drug discovery pipelines.
The COVID-19 pandemic, caused by the novel SARS-CoV-2 virus, triggered an unprecedented global effort to develop effective antiviral therapies. While traditional direct-acting antivirals (DAAs) target viral components, an alternative approach has gained significant attention: host-targeted antivirals (HTAs) that exploit host cellular pathways to inhibit viral replication [33] [34]. This strategy offers potential advantages, including a higher genetic barrier to resistance and broader activity against viral variants. However, the development of novel therapeutics is time-consuming and costly, making drug repurposing an attractive alternative for rapidly identifying treatments during a global health emergency [35] [36].
This Application Note illustrates how modern drug discovery technologies, particularly the Cell Painting assay for morphological profiling, can be integrated into a streamlined workflow for identifying repurposed host-targeted antivirals. We present a case study framework focused on SARS-CoV-2, detailing experimental protocols, data analysis methods, and reagent solutions to accelerate antiviral discovery efforts.
Technological Foundation: Cell Painting for Morphological Profiling
Core Principles of Cell Painting
Cell Painting is a high-content, microscopy-based assay that uses multiplexed fluorescent dyes to capture comprehensive information about cellular morphology. Originally described in 2013 and subsequently optimized, this assay "paints" various cellular components to generate rich morphological profiles that can reveal a cell's state following experimental perturbations [5] [2]. The standard protocol uses six fluorescent stains imaged across five channels to visualize eight cellular components:
- Hoechst 33342: Stains DNA in the nucleus
- Concanavalin A: Labels the endoplasmic reticulum
- SYTO 14: Marks nucleoli and cytoplasmic RNA
- Phalloidin: Stains filamentous actin (F-actin)
- Wheat Germ Agglutinin (WGA): Labels Golgi apparatus and plasma membrane
- MitoTracker Deep Red: Marks mitochondria [5] [2]
Applications in Phenotypic Drug Discovery
Cell Painting enables phenotypic drug discovery (PDD), which identifies compounds that alter disease-relevant cellular phenotypes without requiring pre-selected molecular targets. This approach has demonstrated particular value for identifying first-in-class medicines and is especially appealing for complex diseases involving polygenic factors or "undruggable" targets [5]. In the context of antiviral discovery, Cell Painting can:
- Identify compounds that reverse virus-induced morphological changes
- Group compounds with similar mechanisms of action based on phenotypic similarity
- Predict potential mechanisms of action for uncharacterized compounds
- Assess compound toxicity through morphological changes [5] [2]
Integrated Workflow for Antiviral Repurposing
The following diagram illustrates the comprehensive experimental workflow for identifying host-targeted antivirals against SARS-CoV-2 through drug repurposing, integrating computational predictions with phenotypic screening and validation.
Case Study: Identifying SARS-CoV-2 Host-Targeted Antivirals
Computational Pre-screening of Drug Libraries
Initial computational screening provides a rational approach for selecting candidate compounds from FDA-approved drug libraries. Molecular docking studies can predict binding interactions between drugs and key host or viral targets, prioritizing candidates for experimental validation [36].
Key Targets for SARS-CoV-2:
- 3C-like protease (3CLpro): Essential for viral polyprotein processing
- RNA-dependent RNA polymerase (RdRp): Core component for viral RNA replication
- Papain-like protease (PLpro): Cleaves viral polyproteins and modulates host immune response
- Spike glycoprotein: Mediates viral entry through ACE2 receptor binding [36]
Experimental Validation of Candidate HTAs
Following computational predictions and Cell Painting screening, promising candidates require validation in biologically relevant systems. The following table summarizes experimental results for selected repurposed drugs demonstrating anti-SARS-CoV-2 activity in viral replication assays.
Table 1: Experimentally Validated Drug Candidates for SARS-CoV-2 Treatment
| Drug Candidate | Original Indication | Experimental Model | Key Findings | Proposed Application |
|---|---|---|---|---|
| Lumacaftor [37] | Cystic fibrosis | SARS-CoV-2 replicon systems in Caco-2 and Calu-3 cells | IC~50~ = 964 nM (Caco-2) and 458 nM (Calu-3) | Effective inhibitor of viral replication |
| Candesartan [37] | Hypertension | SARS-CoV-2 replicon systems in Caco-2 and Calu-3 cells | IC~50~ = 714 nM (Caco-2) and 1.05 µM (Calu-3) | Potent antiviral activity in nanomolar range |
| Nelfinavir [37] | HIV infection | SARS-CoV-2 replicon systems | Inhibited replication at low micromolar concentrations | Effective antiviral treatment candidate |
| Amcinonide [37] | Dermatological conditions | SARS-CoV-2 replicon systems + combination studies | Potent inhibitor in nanomolar range when combined with candesartan | Enhanced efficacy in combination therapy |
| Metformin [35] | Type 2 diabetes | Clinical studies | More suitable for prophylactic administration or mild cases | Preventive or early-stage treatment |
Cell Painting Protocol for Antiviral Screening
Cell Culture and Treatment
- Cell Line Selection: Culture appropriate cell lines (e.g., Caco-2, Calu-3, or Vero E6) in complete DMEM medium supplemented with 10% FBS and 1% penicillin/streptomycin at 37°C with 5% CO~2~ [37].
- Infection and Treatment: Infect cells with SARS-CoV-2 at appropriate MOI (BSL-3 required) or use biosafe replicon systems (BSL-2 compatible) [37].
- Compound Application: Add candidate drugs at non-toxic concentrations determined via cell viability assays (e.g., xCelligence RTCA system) [37].
Staining and Fixation
- Fixation: Aspirate medium and fix cells with 4% formaldehyde for 20 minutes at room temperature.
- Staining Solution Preparation: Prepare staining mixture containing:
- Hoechst 33342 (DNA stain)
- Concanavalin A, Alexa Fluor 488 conjugate (ER stain)
- SYTO 14 (nucleoli and RNA)
- Phalloidin, Alexa Fluor 568 conjugate (F-actin)
- Wheat Germ Agglutinin, Alexa Fluor 647 conjugate (Golgi and plasma membrane)
- Staining Protocol: Incubate fixed cells with staining solution for 30-60 minutes followed by washing [2].
Image Acquisition and Analysis
- Automated Imaging: Acquire images using high-throughput microscope (e.g., ImageXpress Micro Confocal or similar) with appropriate filters for each fluorescent channel.
- Image Analysis: Process images using CellProfiler or similar software to identify individual cells and extract morphological features.
- Feature Extraction: Measure ~1,500 morphological features per cell, including size, shape, texture, intensity, and correlation between channels [2].
- Morphological Profiling: Compare profiles of treated versus untreated infected cells to identify compounds that reverse virus-induced morphological changes.
Research Reagent Solutions
The following table details essential materials and reagents required for implementing the integrated drug repurposing workflow described in this application note.
Table 2: Essential Research Reagents for Antiviral Repurposing Pipeline
| Category | Specific Reagents | Application/Function | Experimental Notes |
|---|---|---|---|
| Cell Lines [37] | Caco-2 (colorectal adenocarcinoma), Calu-3 (lung adenocarcinoma) | Model human tissues relevant to SARS-CoV-2 infection | Calu-3: respiratory tract model; Caco-2: intestinal model |
| Cell Painting Dyes [5] [2] | Hoechst 33342, Concanavalin A, SYTO 14, Phalloidin, WGA, MitoTracker Deep Red | Multiplexed staining of cellular components | Standardized in Cell Painting v3 protocol for reproducibility |
| SARS-CoV-2 Models [37] | Infectious virus (BSL-3), Subgenomic replicons with reporter genes (BSL-2) | Viral replication assays | Replicons enable safe screening in BSL-2 facilities |
| 3CLpro Assay Kit [37] | Commercial 3CL Protease Activity Assay Kit | Target-based validation of protease inhibitors | Uses fluorescence-based readout of protease activity |
| Cell Viability Assays [37] | xCelligence RTCA system, MTT, CellTiter-Glo | Determination of non-toxic compound concentrations | xCelligence enables real-time monitoring |
| FDA-Approved Drug Libraries [36] [37] | Prestwick Chemical Library, Selleckchem Repurposing Library | Source of compounds for repurposing screening | ~3,000 compounds typically screened |
Analysis and Data Interpretation
Morphological Profile Analysis
Following image acquisition and feature extraction, several analytical approaches can identify promising host-targeted antiviral candidates:
- Profile Similarity Analysis: Compare morphological profiles of compound-treated, infected cells to untreated infected cells and healthy controls. Compounds that shift virus-induced profiles toward healthy profiles represent potential HTAs.
- Mechanism of Action Analysis: Cluster compounds based on morphological profile similarity to identify those with similar mechanisms of action, potentially revealing common host pathways being targeted.
- Multiparametric Hit Selection: Combine multiple morphological features into a virus-induced phenotype score and identify compounds that significantly reduce this score.
Integration with Computational Predictions
Correlate Cell Painting results with initial computational predictions to validate target engagement and improve future virtual screening efforts. Compounds showing both strong binding predictions and phenotypic efficacy represent high-priority candidates for further development.
The integrated approach combining computational pre-screening with Cell Painting-based phenotypic profiling and targeted validation assays provides a powerful framework for identifying host-targeted antivirals against SARS-CoV-2. This strategy leverages the strengths of both target-agnostic phenotypic discovery and rational target-based approaches, potentially accelerating the identification of repurposed drugs with clinical utility.
While numerous HTAs have shown promise in preclinical studies, the translation to clinical practice remains challenging [33] [34]. The workflow described here provides a systematic approach for prioritizing the most promising candidates for clinical evaluation, potentially expanding the therapeutic options for COVID-19 and enhancing preparedness for future viral pandemics.
Predictive toxicology is undergoing a transformative shift from traditional animal-based testing toward high-throughput, New Approach Methodologies (NAMs) that efficiently evaluate chemical hazards. Within this framework, the Cell Painting assay has emerged as a powerful tool for generating rich bioactivity profiles based on cellular morphology [5] [38]. This application note details how the Cell Painting assay can be deployed to create morphological profiles for industrial chemicals, enabling untargeted exploration of toxicity mechanisms and combination effects in a rapid, cost-effective manner [39] [38].
Cell Painting is a high-content imaging assay that uses up to six fluorescent dyes to stain eight major cellular components, providing a comprehensive, multiparameter readout of the cell's state [5] [10]. By quantitatively measuring changes in cellular morphology induced by chemical exposures, it generates a bioactivity profile—a unique "fingerprint" that can be used to predict toxicological hazards, prioritize chemicals for further testing, and elucidate novel mechanisms of action [5] [40] [38].
Key Advantages of Cell Painting for Predictive Toxicology
The application of Cell Painting in predictive toxicology offers several distinct advantages over conventional methods:
- Untargeted Exploration: Unlike target-specific assays, Cell Painting captures a broad spectrum of cellular responses simultaneously, making it ideal for identifying unexpected off-target effects or novel toxicity pathways [5] [38].
- High Information Content: The assay extracts data on over 1,500 morphological features from each cell, creating a high-dimensional profile that sensitively detects subtle phenotypic changes [10] [40].
- Efficiency and Scalability: As a high-throughput method, it allows for the screening of thousands of chemicals, including complex mixtures, at a fraction of the cost and time of traditional toxicology studies [39] [38].
- Mechanistic Insight: Bioactivity profiles can be linked to known toxicological pathways through the "guilt-by-association" principle, where chemicals with similar profiles are predicted to share mechanisms of action [5] [40].
Table 1: Validation of Morphological Profiling for Toxicity Prediction
| Study Focus | Key Finding | Reference |
|---|---|---|
| Predicting Organ Toxicity | A combination of bioactivity and chemical structure descriptors accurately predicted 35 target organ toxicity outcomes. | [41] |
| Profiling Environmental Chemical Mixtures | Cell Painting discerned dose- and combination-dependent effects of chemicals, with BPA exacerbating effects when combined with other chemicals. | [38] |
| Self-Supervised Learning (SSL) for Profiling | SSL models like DINO matched or exceeded the performance of traditional feature extraction in tasks like drug target identification. | [40] |
Protocol: Cell Painting Assay for Industrial Chemicals
Reagent and Equipment Requirements
The following "Scientist's Toolkit" lists the essential materials for performing the Cell Painting assay.
Table 2: Research Reagent Solutions and Essential Materials
| Item | Function / Description | Example / Note |
|---|---|---|
| Fluorescent Dyes | Stains specific cellular compartments for visualization. | Kit includes dyes for DNA, ER, RNA, F-actin, Golgi, and mitochondria [5] [10]. |
| Cell Lines | Biological model system. | Use biologically diverse lines (e.g., U2OS, A549, HepG2); selection impacts sensitivity to mechanisms of action [5]. |
| High-Content Imager | Automated microscope for capturing cell images. | Requires capabilities for multi-channel fluorescence imaging (e.g., CellInsight CX7 LZR Pro Platform) [10]. |
| Image Analysis Software | Extracts morphological features from images. | CellProfiler (classical) or self-supervised learning (SSL) models like DINO for segmentation-free analysis [5] [40]. |
Staining and Image Acquisition Workflow
The following diagram outlines the core experimental workflow for the Cell Painting assay.
Cell Painting Experimental Workflow
Step-by-Step Methodology
- Cell Culture and Plating: Plate appropriate cell lines (e.g., U2OS or A549) in 384-well microplates and culture until they reach optimal confluence. It is critical to use multiple biologically distinct cell lines to capture a comprehensive spectrum of toxicological responses [5] [38].
- Chemical Treatment: Expose cells to the industrial chemicals of interest across a range of concentrations, including a vehicle control (e.g., DMSO). Include reference compounds with known mechanisms of action as positive controls for quality assurance.
- Multiplexed Staining: Following treatment, perform the staining procedure as follows [5] [10]:
- Fixation: Use formaldehyde to preserve cellular structures.
- Permeabilization: Use Triton X-100 to allow dye entry.
- Staining: Incubate cells with the multiplexed dye cocktail:
- Hoechst 33342: Labels nuclear DNA.
- Concanavalin A: Labels the endoplasmic reticulum.
- SYTO 14: Labels nucleoli and cytoplasmic RNA.
- Phalloidin: Labels F-actin cytoskeleton.
- Wheat Germ Agglutinin (WGA): Labels Golgi apparatus and plasma membrane.
- MitoTracker Deep Red: Labels mitochondria.
- Image Acquisition: Image the plates using an automated high-content microscope. Acquire images in five channels corresponding to the excitation/emission spectra of the dyes. Capture multiple fields of view per well to ensure robust statistical sampling [10].
- Image Analysis and Feature Extraction: This step can be performed via two primary methods:
- Classical Method: Use software like CellProfiler to segment individual cells and extract hand-crafted morphological features (size, shape, texture, intensity) for each cellular compartment [5] [3].
- Advanced AI Method: Employ self-supervised learning (SSL) models (e.g., DINO) trained directly on the images to extract powerful representations without the need for cell segmentation, significantly reducing computational time and parameter adjustment [40].
Protocol: Data Analysis for Hazard Assessment
From Images to Bioactivity Profiles
The analysis pipeline converts raw images into quantitative bioactivity profiles used for hazard assessment.
Bioactivity Profile Data Analysis
Downstream Analysis Workflow
- Data Quality Control and Normalization: Perform batch effect correction and normalize morphological features to negative controls (vehicle-treated cells) to remove technical artifacts [5] [40].
- Profile Aggregation: Average normalized features across technical replicates to create a consensus morphological profile for each chemical treatment.
- Hazard Assessment Analysis:
- Similarity-based Clustering: Use cosine similarity or other metrics to compute distances between morphological profiles. Chemicals that cluster together are likely to share a common Mechanism of Action (MoA), enabling "guilt-by-association" prediction for uncharacterized chemicals [5] [40].
- Supervised Machine Learning: Train classifiers (e.g., Random Forest, Support Vector Machines) using morphological profiles to predict specific toxicity endpoints (e.g., hepatotoxicity, developmental toxicity) [41] [42]. Models can be trained on a combination of bioactivity data from ToxCast and chemical descriptors for enhanced predictivity [41].
- Detection of Combination Effects: Apply multivariate data analysis to profiles from cells exposed to chemical mixtures. This can identify synergistic or antagonistic interactions, as demonstrated with combinations of BPA, CTAB, and DBTDL [38].
Case Study: Profiling Environmental Chemical Mixtures
A 2022 study exemplifies the application of Cell Painting for the safety assessment of environmental chemicals [38]. Researchers exposed four different human cell lines to Cetyltrimethylammonium bromide (CTAB), Bisphenol A (BPA), and Dibutyltin dilaurate (DBTDL), both individually and in combination.
- Findings: The assay successfully captured concentration-dependent morphological changes for CTAB and DBTDL. Furthermore, it revealed that BPA exacerbated morphological effects when combined with CTAB and DBTDL.
- Cell Line Variability: The study highlighted that different cell lines showed distinct responses, underscoring the importance of using multiple cell types for a comprehensive assessment [38].
- Conclusion: Cell Painting was demonstrated to be an efficient and information-rich methodology for the untargeted exploration of combination effects, providing a powerful strategy for evaluating the complex mixtures commonly encountered in the environment [38].
The Cell Painting assay provides a robust, scalable, and information-rich platform for generating bioactivity profiles essential for the hazard assessment of industrial chemicals. Its integration with advanced machine learning models, including self-supervised learning, is setting a new standard in predictive toxicology [40]. By adopting this protocol, researchers and drug development professionals can efficiently prioritize chemicals, de-risk the development of new compounds, and gain profound mechanistic insights, ultimately supporting a shift toward more human-relevant, high-throughput toxicological models.
Optimizing Your Assay: From Cell Line Selection to Advanced Protocols and AI
Within modern drug discovery, phenotypic screening using morphological profiling has emerged as a powerful approach for identifying novel therapeutic compounds and characterizing their mechanisms of action (MOA). The Cell Painting assay has become a particularly valuable tool in this context, enabling the quantification of subtle phenotypic changes through multiplexed fluorescent staining and high-content imaging [9] [2]. This assay multiplexes six fluorescent dyes imaged in five channels to reveal eight broadly relevant cellular components or organelles, producing rich morphological profiles containing approximately 1,500 measurements per cell [9] [17].
A critical yet often overlooked factor in the success of these campaigns is the systematic selection of appropriate cellular models. The concepts of "phenoactivity" (a cell line's ability to detect compound-induced phenotypes distinct from controls) and "phenosimilarity" (its capacity to group compounds with similar MOAs by phenotypic profile) are central to this selection process [43]. This application note provides a structured framework for selecting cell lines that optimally balance these complementary properties within the context of Cell Painting assays for drug discovery.
Background
The Cell Painting Assay
The Cell Painting assay is a high-content morphological profiling method that employs a standardized panel of fluorescent dyes to label diverse cellular components:
- Nucleus (DNA)
- Nucleolus (RNA)
- Endoplasmic Reticulum
- Golgi apparatus
- Mitochondria
- Actin cytoskeleton
- Plasma membrane [2] [17]
After treatment with compounds or genetic perturbations, cells are fixed, stained, and imaged using high-throughput microscopy. Automated image analysis software then identifies individual cells and measures morphological features related to size, shape, texture, intensity, and spatial relationships [9]. The resulting profiles serve as multidimensional fingerprints capable of detecting subtle phenotypic changes, enabling researchers to group compounds with similar mechanisms of action, identify novel biological activities, and characterize disease-specific signatures [2].
Key Concepts: Phenoactivity and Phenosimilarity
In systematic cell line evaluation, two key performance metrics emerge:
- Phenoactivity: The ability of a cell line to manifest detectable morphological changes in response to compound treatment, measured as the degree to which compound profiles differ from negative control (DMSO) profiles [43].
- Phenosimilarity: The capacity of a cell line to cluster compounds with shared mechanisms of action through similar phenotypic responses, enabling correct MOA inference for unannotated compounds [43].
Different cell lines exhibit distinct sensitivities across these metrics, influenced by factors including cellular origin, genetic background, morphological characteristics, and pathway activation states. Systematic evaluation reveals that the optimal cell line choice depends significantly on the primary screening objective—whether prioritizing broad sensitivity to detect bioactive compounds (phenoactivity) or accurate mechanistic grouping (phenosimilarity) [43].
Systematic Framework for Cell Line Selection
Experimental Design for Cell Line Evaluation
A robust assessment of cell line performance requires testing a diverse set of compounds with annotated mechanisms of action across multiple candidate cell lines. A recommended experimental framework includes:
- Cell Line Panel: Select 5-6 cell lines spanning different tissue origins, morphological characteristics, and disease relevance. Cancer cell lines from the NCI60 panel (e.g., A549, OVCAR4, DU145, 786-O, HEPG2) provide diversity, while including non-cancerous lines (e.g., patient-derived fibroblasts) offers additional context [43].
- Reference Compound Library: Employ 3,000+ compounds with well-annotated mechanisms of action, covering diverse target classes and biological pathways. Include FDA-approved drugs, clinical trial candidates, and well-characterized tool compounds [43].
- Screening Conditions: Standardize treatment conditions (e.g., 48 hours, single dose of 5-10 μM) to enable direct comparisons across cell lines [43].
- Image Acquisition and Analysis: Implement the Cell Painting staining protocol, acquire 9 fields of view per well at 20× magnification, and extract 77 quantitative morphological features summarizing population-level shifts from DMSO controls using signed Kolmogorov-Smirnov statistics [43].
Quantitative Assessment Metrics
Table 1: Performance Metrics for Cell Line Evaluation
| Metric | Calculation | Interpretation |
|---|---|---|
| Phenoactivity Score | Comparison of distance distributions between MOA and DMSO point clouds to DMSO centroid | Higher scores indicate greater sensitivity to detect compound-induced phenotypes |
| Phenosimilarity Score | Measurement of tightness of MOA point cloud relative to nearest neighbor point clouds | Higher scores indicate better ability to group compounds with similar MOA |
| MOA Coverage | Number of MOA classes with significant phenoactivity or phenosimilarity scores | Broader coverage indicates more general utility for diverse compound libraries |
Comparative Performance Across Cell Lines
Evaluation of six cell lines against 148 MOA classes revealed significant variation in performance characteristics:
Table 2: Cell Line Performance Ranking for Phenoactivity and Phenosimilarity
| Cell Line | Tissue Origin | Phenoactivity Ranking | Phenosimilarity Ranking | Notable Characteristics |
|---|---|---|---|---|
| OVCAR4 | Ovarian cancer | 1 | 1 | Highest overall performance for both metrics |
| A549 | Lung cancer | 2 | 3 | Strong phenoactivity detection |
| DU145 | Prostate cancer | 3 | 2 | Good phenosimilarity grouping |
| 786-O | Renal cancer | 4 | 4 | Moderate performance |
| FB | Patient-derived fibroblast | 5 | 5 | Lower but detectable performance |
| HEPG2 | Hepatocellular carcinoma | 6 | 6 | Compact growth limits feature detection |
Notably, OVCAR4 demonstrated superior performance for both detecting phenoactivity and grouping compounds by mechanism of action, while HEPG2 performed poorly due to its highly compact colonial growth pattern that limited detection of morphological changes [43].
Cell Line Combinations for Enhanced Coverage
Combining multiple cell lines can significantly expand MOA coverage. Systematic analysis reveals that:
- The single best-performing cell line (OVCAR4) detected phenoactivity for 64% of MOA classes [43].
- Adding a second complementary cell line (A549) increased coverage to 79% of MOA classes [43].
- Optimal cell line combinations are task-dependent, with different pairings maximizing phenoactivity detection versus phenosimilarity grouping [43].
Decision Framework for Cell Line Selection
Integrated Protocol for Cell Painting with Optimized Cell Line Selection
Stage 1: Cell Line Prescreening and Selection
Materials:
- Candidate cell lines (e.g., OVCAR4, A549, DU145, 786-O, HEPG2, FB)
- Reference compound library with annotated MOAs
- Cell culture reagents and equipment
- 384-well imaging plates
Procedure:
- Culture Candidate Cell Lines: Maintain each cell line according to established protocols, ensuring consistent passage numbers and culture conditions.
- Plate Cells for Screening: Seed cells in 384-well imaging plates at optimal density for 48-hour growth without overcrowding.
- Compound Treatment: Treat with reference compounds across multiple MOA classes (5-10 μM, 48 hours), including DMSO controls.
- Cell Painting Staining:
- Fix cells with formaldehyde
- Permeabilize with Triton X-100
- Stain with Cell Painting dye cocktail [9] [2]:
- Hoechst 33342 for nucleus
- Concanavalin A conjugated to Alexa Fluor 488 for endoplasmic reticulum
- Wheat Germ Agglutinin conjugated to Alexa Fluor 555 for Golgi and plasma membrane
- Phalloidin conjugated to Alexa Fluor 568 for actin cytoskeleton
- SYTO 14 for nucleoli
- MitoTracker Deep Red for mitochondria [17]
- Image Acquisition: Acquire images across 5 fluorescence channels using high-content imaging system (e.g., CellInsight CX7 LZR), collecting 9 fields per well at 20× magnification [43].
- Feature Extraction: Segment individual cells and extract 77 morphological features capturing size, shape, intensity, and texture measurements for each cellular compartment.
- Performance Calculation: Compute phenoactivity and phenosimilarity scores for each cell line and select optimal model(s) based on primary screening objective.
Stage 2: Primary Compound Screening with Selected Cell Line(s)
Materials:
- Selected optimal cell line(s) from Stage 1
- Experimental compound library
- Cell Painting reagents
- High-content imaging system
Procedure:
- Cell Plating: Plate selected cell line(s) in 384-well plates using optimized conditions from Stage 1.
- Compound Treatment: Treat with experimental compounds at appropriate concentrations and duration.
- Cell Painting and Imaging: Perform Cell Painting assay as described in Stage 1.
- Profile Generation: Create morphological profiles for each treatment using z-score normalized feature values relative to DMSO controls.
- Hit Identification: Calculate Mahalanobis distance from DMSO cloud to identify phenoactive compounds.
- MOA Annotation: Cluster phenoactive compounds using hierarchical clustering and annotate by proximity to reference compounds with known mechanisms.
The Scientist's Toolkit: Essential Research Reagent Solutions
Table 3: Key Reagents and Materials for Cell Painting Assays
| Item | Function | Example Products |
|---|---|---|
| Multiplexed Dyes | Labels 8 cellular components | Image-iT Cell Painting Kit [17] |
| High-Content Imager | Automated multi-well imaging | CellInsight CX7 LZR Pro [17] |
| Cell Lines | Biological context for screening | ATCC authenticated lines [44] |
| Analysis Software | Feature extraction and profiling | CellProfiler [9], PhenoModel [45] |
| Multi-well Plates | High-throughput format | 384-well imaging plates |
Data Analysis and Interpretation
Analytical Workflow
The analytical pipeline for Cell Painting data involves multiple stages of processing to transform raw images into biological insights:
Cell Painting Data Analysis Pipeline
Integration with Complementary Profiling Methods
Cell Painting morphological profiles can be productively combined with other data modalities to enhance predictive power:
- Chemical structures alone accurately predicted 16/270 assay outcomes in one study [32].
- Cell Painting profiles alone predicted 28/270 assays [32].
- Combined chemical structures and Cell Painting predicted 31/270 assays—demonstrating the complementary value of phenotypic and structural information [32].
- Gene expression profiles (L1000) provide additional orthogonal data, with triple combination (chemical structure + morphology + gene expression) enabling prediction of 21% of assays with high accuracy [32].
Systematic cell line selection is fundamental to successful phenotypic screening campaigns using Cell Painting assays. The framework presented here enables researchers to:
- Quantitatively evaluate cell line performance using phenoactivity and phenosimilarity metrics
- Select optimal cellular models based on specific screening objectives
- Implement robust protocols for comprehensive morphological profiling
- Integrate multimodal data to maximize predictive accuracy
By adopting this structured approach to cell line selection, researchers can significantly enhance the efficiency and effectiveness of their drug discovery pipelines, leading to more reliable identification of bioactive compounds and accurate mechanism of action determination.
Cell Painting, the most popular assay for image-based morphological profiling, has become an indispensable tool in phenotypic drug discovery. The recent release of Cell Painting version 3 (v3) represents a significant evolution from previous protocols, culminating from systematic quantitative optimization by the Joint Undertaking for Morphological Profiling (JUMP) Cell Painting Consortium. This application note details the key updates in v3 that enhance experimental robustness, improve phenotypic detection, and substantially reduce reagent costs. We present a comprehensive comparison of protocol versions, detailed methodologies for implementation, and visual workflows to guide researchers in adopting these optimized conditions for more efficient and reproducible drug discovery research.
Cell Painting is a high-content, image-based profiling assay that uses multiplexed fluorescent dyes to capture morphological information about cellular state. First introduced in 2013 and refined in 2016, the assay "paints" eight key cellular components using six fluorescent dyes imaged across five channels, enabling the quantification of hundreds of morphological features at single-cell resolution [5] [2]. This approach allows researchers to identify subtle phenotypic changes in response to genetic or chemical perturbations, facilitating mechanism-of-action studies, toxicity profiling, and functional gene annotation in a target-agnostic manner [5].
The evolution to Cell Painting v3 marks a transition from qualitative, visual optimization to quantitative, metric-driven assessment. Where previous versions relied on visual stain quality for optimization, v3 was systematically optimized using a controlled plate of 90 compounds covering 47 diverse mechanisms of action to quantitatively evaluate the assay's ability to detect morphological phenotypes and accurately group biologically similar perturbations [46]. This rigorous approach, developed through the work of the JUMP-CP Consortium, has yielded a protocol that maintains robust performance while reducing costs and simplifying workflow steps [46] [47].
Key Updates in Cell Painting Version 3
The updates in Cell Painting v3 focus on improving reproducibility, reducing reagent costs, and simplifying the workflow for more robust implementation across different laboratories and cell types. These optimizations were evaluated based on two key metrics: "percent replicating" (the ability to detect consistent profiles across technical replicates) and "percent matching" (the ability to group perturbations with similar biological impacts) [46].
Staining Protocol Optimizations
The most significant changes in v3 involve modifications to staining concentrations and procedures, resulting in substantial cost savings without compromising data quality.
Table 1: Key Changes in Cell Painting Version 3 Staining Protocol
| Component | Version 2 (2016) | Version 3 (2023) | Change | Impact |
|---|---|---|---|---|
| Phalloidin | 5 μL/mL (33 nM) | 1.25 μL/mL (8.25 nM) | 4-fold reduction | Significant cost savings |
| Hoechst | 5 μg/mL | 1 μg/mL | 5-fold reduction | Cost savings |
| SYTO 14 | 3 μM | 6 μM | 2-fold increase | Improved signal quality |
| Concanavalin A | 100 μg/mL | 5 μg/mL | 20-fold reduction | Major cost savings |
| MitoTracker | Unintentionally 375 nM | 500 nM | Standardized concentration | Improved consistency |
| Staining Volume | 30 μL/well | 20 μL/well | 33% reduction | Reagent savings |
Additional procedural simplifications include the elimination of media removal before MitoTracker addition to minimize cell loss, and the combination of permeabilization and staining steps to increase automation-friendliness [46]. These changes collectively reduce reagent costs by approximately 60% while maintaining or improving phenotypic profiling performance.
Workflow Simplifications
The v3 protocol introduces several workflow improvements that enhance robustness and reduce technical variability:
Elimination of Media Removal: Before MitoTracker staining, the previous protocol required media removal, which risked cell loss and introduced variability. v3 adds MitoTracker directly to existing media, simplifying the process and improving cell retention [46].
Combined Permeabilization and Staining: By combining permeabilization with wheat germ agglutinin (WGA) and phalloidin staining steps, the protocol becomes more streamlined and automation-friendly [46].
Standardized Positive Controls: The implementation of a standardized JUMP-MOA (mechanism of action) plate with 90 reference compounds enables consistent quality control and cross-laboratory benchmarking [46].
Figure 1: Evolution of Cell Painting protocol showing key optimization drivers and outcomes in version 3
Experimental Protocol for Cell Painting v3
Cell Culture and Staining Procedure
The following protocol details the optimized staining procedure for Cell Painting v3:
Day 1: Cell Plating
- Plate cells in 96-well or 384-well plates at appropriate density for 24-hour attachment and growth.
- Incubate at 37°C with 5% CO₂.
Day 2: Perturbation and Staining
- Apply chemical or genetic perturbations according to experimental design.
- Incubate for desired period (typically 24-48 hours, though shorter times may be sufficient for some applications [48]).
Day 3: Staining Procedure
- MitoTracker Staining: Add MitoTracker Deep Red FX to culture media to final concentration of 500 nM. Incubate 30-45 minutes at 37°C.
- Fixation: Remove media and MitoTracker solution. Add 4% formaldehyde in PBS. Incubate 20-30 minutes at room temperature.
- Permeabilization and Staining: Remove formaldehyde. Add solution containing 0.1% Triton X-100, 100 μg/mL WGA, and 1.25 μL/mL phalloidin in PBS. Incubate 30 minutes at room temperature.
- RNA Staining: Remove previous solution. Add 6 μM SYTO 14 in PBS. Incubate 30 minutes at room temperature.
- Additional Staining: Remove SYTO 14. Add solution containing 5 μg/mL concanavalin A and 1 μg/mL Hoechst 33342 in PBS. Incubate 30 minutes at room temperature.
- Storage: Replace with PBS and store at 4°C until imaging (within 4 weeks recommended).
Image Acquisition and Analysis
- Image Acquisition: Acquire images using a high-content microscope with appropriate filters for five channels: Hoechst (DNA), SYTO 14 (RNA), WGA and phalloidin (combined), concanavalin A (ER), and MitoTracker (mitochondria).
- Image Analysis: Process images using CellProfiler or similar software to segment cells and extract morphological features.
- Data Processing: Apply quality control, normalization, and batch effect correction to generate morphological profiles for downstream analysis.
Figure 2: Cell Painting v3 experimental workflow showing optimized staining procedure
The Scientist's Toolkit: Essential Reagents and Materials
Successful implementation of Cell Painting v3 requires careful selection of reagents and equipment. The following table details the core components of the optimized assay.
Table 2: Essential Research Reagents for Cell Painting v3
| Reagent Category | Specific Components | Function in Assay | Optimized Concentration in v3 |
|---|---|---|---|
| Fluorescent Dyes | Hoechst 33342 | Nuclear DNA staining | 1 μg/mL (5-fold reduction) |
| SYTO 14 Green Fluorescent Nucleic Acid Stain | Cytoplasmic RNA and nucleoli staining | 6 μM (2-fold increase) | |
| Phalloidin (e.g., Alexa Fluor 568, 594, or 647) | F-actin cytoskeleton staining | 1.25 μL/mL (4-fold reduction) | |
| Wheat Germ Agglutinin (e.g., Alexa Fluor 488 or 647) | Golgi apparatus and plasma membrane staining | Protocol-dependent | |
| Concanavalin A (e.g., Alexa Fluor 488 or 568) | Endoplasmic reticulum staining | 5 μg/mL (20-fold reduction) | |
| MitoTracker Deep Red FM | Mitochondrial staining | 500 nM (standardized) | |
| Cell Culture | Appropriate cell lines (U2OS, A549, etc.) | Biological system for perturbation studies | Cell type-dependent |
| Cell culture media and supplements | Cell maintenance and growth | Cell type-dependent | |
| Fixation & Permeabilization | Formaldehyde (4%) | Cellular structure preservation | Protocol-dependent |
| Triton X-100 (0.1%) | Membrane permeabilization for dye access | Protocol-dependent | |
| Imaging Equipment | High-content screening microscope | Automated image acquisition | System-dependent |
| Appropriate filter sets | Specific fluorescence channel detection | System-dependent | |
| Image Analysis | CellProfiler, ImageJ, or commercial software | Feature extraction and analysis | Software-dependent |
Applications in Drug Discovery and Beyond
The optimized Cell Painting v3 protocol enhances performance across diverse applications in pharmaceutical research and development:
Mechanism of Action Elucidation: By clustering compounds with similar morphological profiles, researchers can infer mechanisms of action for uncharacterized compounds or identify polypharmacology [5] [2].
Toxicology and Safety Assessment: Cell Painting can identify compound-induced toxicity phenotypes, serving as an early warning system for adverse effects [5] [49].
Functional Genomics: When applied to genetic perturbations (CRISPR, RNAi, ORF overexpression), the assay can help annotate gene function and identify genetic interactions [5] [46].
Lead Optimization: The rich phenotypic data enables identification of compound analogs with desired phenotypic effects but potentially reduced off-target activities [5].
Disease Modeling: Cell Painting can identify disease-relevant phenotypes in patient-derived cells and screen for compounds that reverse these phenotypes [2].
The robustness of Cell Painting v3 across diverse cell types has been demonstrated in multiple studies. One investigation across six biologically diverse human-derived cell lines (U-2 OS, MCF7, HepG2, A549, HTB-9, and ARPE-19) found that the same cytochemistry protocol worked effectively across all cell types with only adjustments to image acquisition and cell segmentation parameters [49]. This consistency enables broader application of the assay without extensive re-optimization.
Future Directions and Emerging Innovations
While Cell Painting v3 represents the current state-of-the-art in standardized morphological profiling, several emerging technologies promise to further expand its capabilities:
Cell Painting PLUS (CPP): This recently developed approach uses iterative staining-elution cycles to expand multiplexing capacity to at least seven fluorescent dyes labeling nine subcellular compartments, while improving organelle-specificity through separate imaging of each dye [21].
Temporal Resolution: Evidence suggests that shorter incubation times (as brief as 6 hours) may better capture primary compound effects while minimizing secondary phenotypic alterations, potentially improving MoA classification [48].
Artificial Intelligence Integration: Advanced machine learning and deep learning approaches are being increasingly applied to Cell Painting data to enhance pattern recognition and predictive modeling [5] [10].
Multi-omics Integration: Combining Cell Painting with transcriptomic, proteomic, and other functional genomics data provides complementary views of cellular state [5] [2].
These innovations, building upon the robust foundation of Cell Painting v3, will continue to expand the utility of morphological profiling in drug discovery and basic biological research.
Cell Painting version 3 represents a significant advancement in high-content morphological profiling, offering improved robustness, substantial cost reductions, and simplified workflows compared to previous versions. Through systematic quantitative optimization by the JUMP Consortium, key updates including reduced reagent concentrations, procedural simplifications, and standardized quality metrics have enhanced the assay's performance and accessibility. As phenotypic screening continues to gain prominence in drug discovery, particularly for complex diseases and previously undruggable targets, Cell Painting v3 provides a robust, standardized platform for capturing comprehensive information about cellular responses to perturbations. The protocol updates detailed in this application note will enable researchers to implement this powerful technology more efficiently and reproducibly, accelerating both basic research and therapeutic development.
{article content start}
Expanding Multiplexing Capacity: Introducing Cell Painting PLUS (CPP) with Iterative Staining-Elution Cycles
Cell Painting PLUS (CPP) represents a significant methodological advancement in image-based phenotypic profiling for drug discovery. By introducing an efficient iterative staining-elution cycle, CPP expands the multiplexing capacity to at least seven fluorescent dyes labeling nine distinct subcellular compartments, including the addition of lysosomes. This approach overcomes the spectral overlap limitations of the original Cell Painting assay, enabling separate imaging and analysis of each dye in individual channels. The result is a highly customizable, information-rich profiling method that provides enhanced organelle-specificity and greater insight into cellular mechanisms of action for compounds and genetic perturbations [21] [50].
Imaging-based high-throughput phenotypic profiling (HTPP) plays a crucial role in basic research, translational science, and drug discovery by capturing morphological changes that indicate functional perturbations in cells [21]. The Cell Painting (CP) assay, first introduced in 2013 and optimized over the past decade, has become the most popular HTPP method, using six stains imaged in five channels to label eight cellular components [5] [46]. However, standard CP faces a fundamental trade-off: to maximize throughput and information density, signals from multiple dyes are often merged in the same imaging channel (e.g., RNA/ER and Actin/Golgi), which compromises organelle-specificity and the precision of resulting phenotypic profiles [21]. The newly developed Cell Painting PLUS (CPP) assay addresses this limitation through an innovative iterative staining-elution approach that significantly expands multiplexing capacity while improving signal specificity [21].
Key Innovations of Cell Painting PLUS
The CPP assay introduces several critical innovations that enhance its capabilities for morphological profiling:
- Iterative Staining-Elution Cycles: CPP employs an optimized dye elution buffer (0.5 M L-Glycine, 1% SDS, pH 2.5) that efficiently removes fluorescent signals after imaging while preserving subcellular morphologies. This allows for sequential rounds of staining, imaging, and elution on the same fixed cells [21].
- Expanded Organelle Coverage: The standard CPP configuration multiplexes at least seven fluorescent dyes to label nine subcellular compartments: plasma membrane, actin cytoskeleton, cytoplasmic RNA, nucleoli, lysosomes, nuclear DNA, endoplasmic reticulum, mitochondria, and Golgi apparatus [21] [50]. The addition of lysosomes provides insights into processes like autophagy and cellular metabolism.
- Spectral Deconvolution: Unlike CP, which often merges signals in shared channels, CPP images each dye in a separate channel, eliminating spectral crosstalk and enabling more precise, organelle-specific feature extraction [21].
- Enhanced Customizability: The modular nature of CPP allows researchers to tailor dye combinations, incorporate antibodies, or focus on specific organelle systems relevant to their particular research questions, making it adaptable beyond standardized profiling [21].
Quantitative Comparison: CPP vs. Standard Cell Painting
The following table summarizes the key differences between the standard Cell Painting assay and the enhanced Cell Painting PLUS method.
Table 1: Comparative Analysis of Cell Painting and Cell Painting PLUS Assays
| Feature | Cell Painting (CP) | Cell Painting PLUS (CPP) |
|---|---|---|
| Max Dyes / Channels | 6 dyes in 5 channels [5] [46] | ≥7 dyes in individual channels [21] |
| Subcellular Comparts | 8 [5] [46] | 9 (adds lysosomes) [21] [50] |
| Channel Usage | Merged signals (e.g., RNA/ER, Actin/Golgi) [21] | Separate imaging for each dye [21] |
| Multiplexing Method | Single staining round | Iterative staining-elution cycles [21] |
| Organelle Specificity | Compromised due to channel sharing [21] | High due to spectral separation [21] |
| Customizability | Standardized dye set | Highly customizable dye/antibody panels [21] |
| Key Innovation | Standardization for HTS | Flexibility and expanded profiling depth [21] |
The Scientist's Toolkit: Essential Reagents and Materials
Successful implementation of the CPP assay requires careful selection and preparation of reagents. The table below details the core components of the "staining-elution" cycle.
Table 2: Research Reagent Solutions for Cell Painting PLUS
| Reagent Category | Specific Examples / Components | Function in the Assay |
|---|---|---|
| Fluorescent Dyes | Hoechst 33342, Concanavalin A, SYTO 14, Phalloidin, Wheat Germ Agglutinin (WGA), MitoTracker Deep Red, LysoTracker [21] [5] | Label specific subcellular structures (e.g., DNA, ER, RNA, Actin, Golgi/PM, Mitochondria, Lysosomes). |
| Elution Buffer | 0.5 M L-Glycine, 1% SDS, pH 2.5 [21] | Efficiently removes dye signals after imaging while preserving cellular morphology for subsequent staining rounds. |
| Fixative | Paraformaldehyde (PFA) [21] | Cross-links proteins and cellular components to preserve morphology during staining and elution cycles. |
| Cell Lines | MCF-7/vBOS, U2OS, A549, etc. [21] [5] | Biologically relevant models for profiling; optimized for flat, non-overlapping growth ideal for imaging. |
| Imaging Platform | High-content imaging systems (e.g., Thermo Scientific CellInsight CX7 LZR) [10] | Automated, high-resolution image acquisition across multiple fluorescent channels. |
Experimental Protocol: Implementing CPP
The core workflow of the CPP assay involves a cyclical process of staining, imaging, and elution. The following diagram and detailed protocol outline the key steps.
Detailed Step-by-Step Methodology
- Cell Culture and Perturbation: Plate cells in standard multi-well plates (e.g., 96 or 384-well). Treat with compounds, genetic perturbations, or other conditions of interest. Include appropriate controls (e.g., DMSO vehicle controls) [5].
- Cell Fixation: Fix cells with 4% paraformaldehyde (PFA) for 20-30 minutes at room temperature to preserve cellular architecture. Note: The LysoTracker dye used in CPP is typically applied to live cells due to its dependence on acidic pH for lysosomal localization, which may require a specific live-cell staining step prior to fixation [21].
- First Staining Cycle: Apply the first panel of fluorescent dyes. The specific combination and order can be customized, but a typical first cycle might include stains for DNA, RNA, ER, Actin, Golgi, and plasma membrane.
- First Imaging Round: Image the stained cells using a high-content imaging system. Each dye is imaged in its own dedicated channel to prevent spectral crosstalk.
- First Elution Cycle: Apply the elution buffer (0.5 M L-Glycine, 1% SDS, pH 2.5) to remove the fluorescent signals from the first staining round. The mitochondrial dye signal is often preserved in this step to serve as a reference for image registration in subsequent cycles [21].
- Second Staining Cycle: Apply the second panel of dyes, which includes the mitochondrial stain (if not preserved) and the lysosomal stain.
- Second Imaging Round: Image the newly stained dyes in their separate channels.
- Image Analysis and Profile Generation: Use image analysis software (e.g., CellProfiler [5] [46]) to segment cells and extract thousands of morphological features (size, shape, texture, intensity). Aggregate single-cell data to generate phenotypic profiles for each perturbation [21] [5].
Critical Optimization Parameters
- Dye Concentration and Exposure Time: Balance must be found between signal intensity, cost, and total imaging time. Concentrations are similar to standard CP, with the main additional cost coming from the Lyso dye [21].
- Elution Buffer Composition: The provided elution buffer is a general solution; optimal buffer components (pH, reducing agents, ionic strength) may require optimization for specific dye combinations [21].
- Temporal Stability: Imaging must be completed within 24 hours of each staining cycle to ensure robustness, as some dye signals (e.g., Lyso, ER) show significant intensity changes after day 2 [21].
- Signal Registration: Using a stable signal (e.g., Mito dye) as a reference channel across cycles facilitates accurate combination of image stacks into a single dataset for analysis [21].
Application in Drug Discovery and Toxicology
CPP's enhanced capacity makes it particularly valuable for addressing complex research questions in drug discovery and regulatory toxicology. Its ability to generate more specific phenotypic profiles improves the clustering of compounds with similar mechanisms of action (MoA) and helps decipher subtle, organelle-specific effects [21]. Large-scale phenotypic profiling projects, such as those by the JUMP-Cell Painting and OASIS Consortia, which profile hundreds of thousands of chemical and genetic perturbations, stand to benefit from the increased resolution and customizability offered by CPP [21] [5]. This is especially relevant for hazard assessment of industrial chemicals and for understanding cell type-specific responses in biologically diverse culture models [21].
Cell Painting PLUS represents a significant evolution in high-content phenotypic profiling. By overcoming the multiplexing limitations of the original assay through iterative staining-elution cycles, CPP provides researchers with a powerful, flexible, and highly specific tool for morphological profiling. Its capacity to separately analyze nine subcellular compartments in a customizable fashion offers unprecedented depth for probing cellular responses to perturbations, accelerating drug discovery, and enhancing toxicological risk assessment.
{article content end}
Image-based phenotypic profiling has become a cornerstone of modern drug discovery, enabling researchers to extract rich morphological information from cells in response to genetic or chemical perturbations. The Cell Painting assay, the most prominent method in this field, traditionally uses a multiplexed staining approach with six fluorescent dyes to label eight major cellular compartments in fixed cells, including DNA, cytoplasmic RNA, nucleoli, actin, Golgi apparatus, plasma membrane, endoplasmic reticulum, and mitochondria [46]. While this approach has proven powerful for high-content analysis (HCA), it fundamentally captures only a single timepoint and involves chemical fixation that can introduce artifacts and eliminate dynamic information [51].
Live Cell Painting (LCP) represents a significant methodological evolution that addresses these limitations by enabling real-time observation of cellular processes in their physiological state. This approach leverages live-cell compatible dyes, such as acridine orange (AO), to highlight cellular organization by staining nucleic acids and acidic compartments while preserving cell viability [51]. By maintaining cells in a living state throughout imaging, LCP provides researchers with the capability to capture kinetic data, track subcellular dynamics, analyze reversible events, and detect subtle, sublethal phenotypic changes that might be missed in fixed-cell endpoints [51].
The integration of live-cell imaging expands the analytical capabilities of morphological profiling beyond what traditional fixed-cell methods can offer. This application note details the key considerations, protocols, and applications for implementing Live Cell Painting in drug discovery research, with particular emphasis on capturing dynamic physiological data.
Comparative Analysis of Cell Painting Modalities
Technical Specifications Across Cell Painting Platforms
Table 1: Comparison of Cell Painting methodologies for morphological profiling
| Parameter | Traditional Cell Painting | Live Cell Painting (LCP) | Cell Painting PLUS (CPP) |
|---|---|---|---|
| Cell State | Fixed | Live | Fixed |
| Primary Dyes | 6 stains (5 channels) [46] | Acridine Orange (2 channels) [51] | 7+ dyes (individual channels) [21] |
| Key Cellular Components Labeled | DNA, RNA, nucleoli, actin, Golgi, plasma membrane, ER, mitochondria [46] | Nucleic acids, acidic compartments (lysosomes, endosomes) [51] | Plasma membrane, actin, RNA, nucleoli, lysosomes, DNA, ER, mitochondria, Golgi [21] |
| Temporal Resolution | Single endpoint | Continuous, real-time kinetics [51] | Single endpoint |
| Multiplexing Capacity | Moderate (5 channels) | Limited (2 channels) | High (7+ channels via iterative cycles) [21] |
| Physiological Relevance | Limited by fixation artifacts | High - maintains native physiology [51] | Limited by fixation artifacts |
| Primary Applications | Phenotypic screening, MoA studies, toxicity assessment [46] | Dynamic process tracking, sublethal phenotype detection, kinetic assays [51] | Enhanced organelle-specific profiling, customized screening [21] |
Performance Metrics in Phenotypic Profiling
Table 2: Performance characteristics of image-based profiling methods
| Performance Metric | Traditional Cell Painting | Live Cell Painting | Bioactivity Prediction Applications |
|---|---|---|---|
| Phenotypic Detection Robustness | High (percent replicating: quantitative metrics) [46] | Preserves viability for dynamic measurements [51] | ROC-AUC: 0.744 ± 0.108 across 140 assays [6] |
| Protocol Duration | 1-2 weeks (culture + imaging) [46] | 24h incubation + real-time imaging [51] | Varies by screening design |
| Cost Considerations | Moderate (6 dyes) | Low (single dye) [51] | Higher (multiple dyes + computational analysis) |
| Information Density | High (8 organelles) | Moderate (focused compartments) | Very high (morphological + bioactivity data) [6] |
| Kinetic Data Capture | None | Continuous real-time data [51] | Not applicable |
Live Cell Painting Protocol for Kinetic Data Acquisition
Experimental Workflow for Live Cell Painting
Detailed Experimental Procedure
Cell Culture and Plate Preparation
Cell Culture: Culture appropriate cell lines (e.g., MCF-7, Huh-7, PNT1A, PC3) in complete medium (RPMI 1640 with 10% FBS and 1% penicillin-streptomycin) at 37°C with 5% CO₂ until approximately 80% confluency is reached [51].
Cell Detachment and Counting: Detach cells using 0.1% trypsin at 37°C until fully detached. Stain with 0.4% trypan blue and count viable cells using a hemocytometer or automated counter [51].
Plate Seeding: Seed 8 × 10² viable cells per well in a 96-well black μClear plate. To prevent edge effects from medium evaporation, do not plate cells in peripheral wells; instead fill these with sterile water or PBS. To minimize batch effects, vary plate layout across experimental replicates using randomized, non-sequential dispensing patterns rather than consistent row- or column-based arrangements [51].
Cell Settlement: Allow the plate to rest in a laminar flow hood for 20 minutes to enable cells to settle and adhere evenly across the well surface, reducing the likelihood of peripheral well-edge adherence artifacts [51].
Incubation: Incubate the plate for 24 hours in a humidified incubator at 37°C, 5% CO₂, and 95% humidity to ensure proper cell attachment and recovery [51].
Staining with Acridine Orange
Stock Solution Preparation: Prepare a 1 mM stock solution of acridine orange (AO) in distilled water. Store at -20°C, where it remains stable for several weeks [51].
Working Solution Preparation: Dilute the AO stock in non-supplemented RPMI 1640 medium to obtain a 10 μM working solution. This concentration has been optimized for MCF-7 cells but requires titration for other cell lines depending on their dye uptake and sensitivity characteristics [51].
Cell Staining: Carefully aspirate the culture medium from each well and add 100 μL of the 10 μM AO working solution. The optimal staining duration should be determined empirically for each cell type but typically ranges from 15-30 minutes [51].
Image Acquisition and Live-Cell Imaging
Microscope Requirements: Utilize a fluorescence microscope equipped for live-cell imaging, such as the Cytation 5 Hybrid Multi-Detection Reader, integrated with a temperature- and CO₂-controlled incubation chamber. The system should be configured with appropriate objectives (e.g., 20× plan fluorite with NA 0.45) and filter sets for AO detection [51].
Filter Configuration: Optimal filter sets for AO imaging include:
- GFP channel (EX 469/35 nm, EM 525/39 nm, dichroic mirror 497 nm) for nucleic acid staining
- PI channel (EX 531/40 nm, EM 647/57 nm, dichroic mirror 605 nm) for acidic compartments [51]
Time-Lapse Acquisition: Establish imaging intervals appropriate for the biological process under investigation, ranging from seconds to hours between timepoints. Maintain environmental control throughout imaging (37°C, 5% CO₂, high humidity) to preserve cell viability and physiological conditions [51].
Viability Controls: Include control wells to monitor potential phototoxicity effects throughout extended time-lapse experiments. Limit light exposure through neutral density filters or reduced exposure times to minimize photodamage.
Essential Research Reagents and Equipment
The Scientist's Toolkit for Live Cell Painting
Table 3: Essential research reagents and equipment for implementing Live Cell Painting
| Category | Specific Items | Specifications & Functions |
|---|---|---|
| Biological Materials | Cell lines (MCF-7, Huh-7, PNT1A, PC3) | Validated models for protocol establishment [51] |
| Key Reagents | Acridine Orange (Sigma A1301) | Metachromatic fluorescent dye staining nucleic acids & acidic compartments [51] |
| Cell culture medium (RPMI-1640) | With 10% FBS and 1% penicillin-streptomycin [51] | |
| Trypsin-EDTA (0.1%) | For cell detachment [51] | |
| FluoroBrite DMEM | Low-fluorescence medium for imaging [51] | |
| Specialized Equipment | 96-well black μClear plates | Imaging-optimized plates with clear bottoms [51] |
| Live-cell imaging microscope | With environmental control (CO₂, temperature, humidity) [51] | |
| Automated pipetting systems | For consistent reagent dispensing [51] | |
| Software & Computation | CellProfiler (v4.2.5+) | Image analysis and feature extraction [51] |
| CellProfiler Analyst (v3.0.4+) | Data exploration and classification [51] | |
| Python with scikit-learn, pandas | Data analysis and machine learning [51] |
Data Analysis Pipeline for Live Cell Painting
Computational Workflow for Kinetic Morphological Profiling
Implementation of Image Analysis and Feature Extraction
Image Pre-processing: Apply flat-field correction to account for illumination irregularities and background subtraction to remove nonspecific signal. For time-series data, implement frame alignment to correct for potential stage drift during extended acquisitions.
Cell Segmentation: Utilize CellProfiler (version 4.2.5+) for conventional segmentation or CellPose (version 2.2.3+) for deep learning-based segmentation to identify individual cells and subcellular compartments. The selection of segmentation approach depends on cell density, contrast quality, and computational resources [51].
Feature Extraction: Extract thousands of morphological features from each cell at every timepoint, including:
- Morphological descriptors (size, shape, eccentricity)
- Intensity-based features (mean, standard deviation, distribution)
- Textural measurements (granularity, contrast, correlation)
- Spatial relationships between cellular compartments [51]
Temporal Data Integration: Align single-cell data across timepoints to generate kinetic trajectories for each morphological feature. This requires robust cell tracking methodologies to maintain cellular identity throughout the time-series.
Multiparametric Analysis: Apply dimensionality reduction techniques (PCA, t-SNE) to identify patterns in the high-dimensional data space. For large-scale profiling, implement machine learning approaches to classify morphological responses and cluster compounds with similar mechanisms of action [51] [6].
Applications in Drug Discovery and Development
Live Cell Painting enables several advanced applications in pharmaceutical research that extend beyond traditional fixed-cell approaches:
Dynamic Mechanism of Action Studies: Capture temporal sequences of phenotypic changes in response to compound treatment, providing insights into the progression of cellular effects rather than just endpoint readouts [51].
Toxicology and Safety Assessment: Identify sublethal phenotypic changes that may precede cell death, allowing earlier detection of compound toxicity and potentially reducing late-stage attrition in drug development [51].
Phenotype Recovery Assays: Monitor cellular recovery after compound washout to assess reversibility of effects, providing important information for therapeutic index calculations [51].
Bioactivity Prediction: Leverage morphological profiles to predict compound activity across diverse targets, with recent studies demonstrating ROC-AUC values of 0.744 ± 0.108 across 140 different assays [6].
High-Content Kinetics: Quantify rates of cellular processes such as vesicle trafficking, organelle dynamics, and structural reorganizations in response to perturbations [51].
Technical Considerations and Limitations
While Live Cell Painting provides significant advantages for capturing physiological data, researchers should consider several technical aspects:
Phototoxicity Management: Extended live-cell imaging can potentially affect cell health and behavior. Implement strategies to minimize light exposure through optimized exposure times, neutral density filters, and appropriate imaging intervals [51].
Dye Concentration Optimization: Acridine orange concentration must be carefully titrated for each cell line to avoid cytotoxicity or nonspecific staining. Initial testing should range from 1-20 μM to establish optimal signal-to-noise ratios while maintaining viability [51].
Multiplexing Limitations: The two-channel nature of standard LCP provides more limited organelle coverage compared to fixed Cell Painting. For comprehensive organelle-specific profiling, fixed-cell approaches or the Cell Painting PLUS method with iterative staining-elution cycles may be preferable [21].
Computational Resources: Time-series morphological profiling generates substantial data volumes. Ensure adequate computational infrastructure for storage and analysis, with recommended workstations featuring high-performance processors (Intel Core i7/i9), dedicated GPUs (NVIDIA GeForce RTX series), and sufficient RAM (32GB+) [51].
Assay Robustness: Despite its dynamic nature, LCP demonstrates excellent reproducibility when environmental conditions are properly controlled. Include appropriate quality control measures and reference compounds to monitor assay performance across experiments.
Cell Painting is a high-content imaging assay that uses multiplexed fluorescent dyes to label and visualize multiple cellular components simultaneously, generating a rich, multidimensional dataset that captures subtle changes in cell morphology induced by genetic or chemical perturbations [10]. Traditional analysis of these images relies heavily on tools like CellProfiler for cell segmentation and the extraction of hand-crafted morphological features (e.g., size, shape, texture). However, this process is computationally intensive, requires frequent parameter adjustments for new datasets, and can be a bottleneck in high-throughput drug discovery pipelines [40].
Self-supervised learning (SSL) presents a paradigm shift by enabling models to learn powerful feature representations directly from unlabeled images. The DINO (DIstillation with NO labels) framework, and its successors, have emerged as particularly effective methods for this purpose [52] [53]. These models can perform segmentation-free feature extraction, operating directly on image patches without the need for precise cell segmentation. This approach significantly reduces computational time and costs while maintaining, and often exceeding, the biological relevance of the extracted features compared to classical methods [40]. Within the context of drug discovery, this allows for rapid morphological profiling of compound libraries, facilitating mechanism of action (MoA) identification, off-target effect detection, and toxicity prediction [40] [10].
Performance Comparison of Feature Extraction Methods
The transition from traditional feature extraction to SSL methods like DINO is supported by quantitative performance improvements across key biological tasks in morphological profiling.
Table 1: Performance Benchmark of DINO vs. CellProfiler on Cell Painting Data [40]
| Evaluation Metric | Feature Extraction Method | Performance Score | Computational Note |
|---|---|---|---|
| Drug Target Classification | DINO (SSL) | Superior | Significant reduction in processing time |
| CellProfiler (Traditional) | Lower | Computationally intensive | |
| Gene Family Classification | DINO (SSL) | Superior | Eliminates segmentation step |
| CellProfiler (Traditional) | Lower | Requires parameter adjustment | |
| Performance on Unseen Dataset | DINO (SSL) | Superior Generalizability | Robust without fine-tuning |
| CellProfiler (Traditional) | Lower | May require pipeline re-optimization |
Table 2: DINO vs. Supervised Learning for Disease Classification [54]
| Model Type | Training Data | Disease Classification (ROC-AUC) | Performance with Limited Labels |
|---|---|---|---|
| DINO-pretrained (Transferred) | Unlabeled Glomerular Images | 0.93 | 0.88 |
| ImageNet-pretrained (Fine-tuned) | Labeled Natural Images (ImageNet) | 0.89 | 0.76 |
The tables highlight key advantages of DINO.它不仅在核心生物学习任务上超越了传统方法,还在计算效率上表现出色 [40]。此外,如Table 2所示,在医学图像分析中,基于自监督学习的特征迁移模型在数据标签有限的情况下表现出了更强的鲁棒性,这对于标注成本高昂的专业领域尤为重要 [54]。
Experimental Protocol: Implementing DINO for Cell Painting Feature Extraction
This protocol details the application of a DINO-based model for extracting morphological features from whole-image Cell Painting crops, adapted from benchmark studies [40].
Materials and Equipment
- Cell Painting Images: High-content microscopy images from the JUMP-CP dataset or a similar source, typically comprising 5 channels (e.g., DNA, RNA, ER, AGP, Mito) [40] [55].
- Computing Hardware: A computer with a high-performance GPU (e.g., NVIDIA A100 or equivalent) and sufficient RAM (≥32 GB recommended).
- Software Environment: Python 3.8+, PyTorch 1.12+, and the DINO library or a compatible SSL codebase.
Step-by-Step Procedure
Image Preprocessing:
- Input: Raw 5-channel Cell Painting images.
- Channel Selection: If using a model pre-trained on natural images (3 channels), select a 3-channel subset that best captures key cellular structures (e.g., DNA, Mito, AGP). Models specifically trained for microscopy, like uniDINO, can natively handle single or multiple channels [55].
- Cropping: Extract random or centered crops of size 224x224 pixels from the image. Filter out crops that do not contain cellular material [40].
- Normalization: Apply image-wise z-score normalization to each channel [56].
Feature Extraction:
- Model Loading: Instantiate a pre-trained DINO model (e.g., ViT-S/16 or ViT-B/16).
- Inference: Pass the preprocessed image crops through the model.
- Feature Collection: Extract the output feature maps or [CLS] token from the vision transformer backbone. These features serve as the image embedding [53].
Profile Aggregation:
- For each perturbation (e.g., a specific compound or genetic change), average the feature embeddings extracted from all corresponding image crops and replicates to create a single, robust morphological profile [40].
Downstream Task Analysis:
- Use the aggregated profiles for tasks such as:
Troubleshooting
- Low Feature Quality: Ensure crops contain cells. Increase the diversity of augmentations during training if fine-tuning.
- Poor Generalization to New Data: Consider using a model like uniDINO, which is explicitly trained on diverse microscopy datasets, for better cross-assay performance [55].
- Batch Effects: Implement weak supervision by sampling images across experimental batches during training to learn batch-invariant representations [56].
Workflow Visualization: From Raw Images to Morphological Profiles
The following diagram illustrates the end-to-end workflow for segmentation-free feature extraction using DINO on Cell Painting images.
The DINO Framework: How It Works
Understanding the core mechanism of DINO is key to its effective application. The model employs a self-distillation approach with a teacher-student architecture.
Essential Research Reagent Solutions
The following table lists key reagents and materials commonly used in a Cell Painting assay, which generates the primary data for this analysis [10].
Table 3: Key Reagents for Cell Painting Assays [10]
| Item | Function in Assay |
|---|---|
| Invitrogen Image-iT Cell Painting Kit | Provides a core set of fluorescent dyes to stain key cellular components. |
| CellInsight CX7 LZR Pro Platform | High-content screening microscope for automated, high-resolution image acquisition. |
| MitoTracker Deep Red | Stains mitochondria. |
| Wheat Germ Agglutinin (WGA), Conjugates | Stains the plasma membrane and Golgi apparatus. |
| Concanavalin A, Conjugates | Stains the endoplasmic reticulum. |
| SYTO 14 Green Fluorescent Nucleic Acid Stain | Stains nucleoli. |
| Hoechst 33342 | Stains DNA in the nucleus. |
| Phalloidin, Conjugates | Stains filamentous actin (F-actin). |
Self-supervised learning models, particularly those based on the DINO framework, offer a transformative approach to morphological profiling in drug discovery. By enabling segmentation-free, computationally efficient, and biologically relevant feature extraction from Cell Painting images, these methods overcome significant bottlenecks associated with traditional analysis pipelines. The robust performance of DINO features in tasks like target identification and MoA prediction, even with limited labeled data, positions SSL as a powerful tool for accelerating and enhancing the drug discovery process. Future advancements, including assay-specific models like uniDINO [55] and continued algorithmic improvements in frameworks like DINOv3 [57], promise to further unlock the potential of unlabeled image data in biomedical research.
Validating the Platform: Consortium Data, Benchmarking, and Comparative Analysis
In the fields of drug discovery and biomedical research, two powerful consortium-driven initiatives are establishing new paradigms for data generation and management. The JUMP-Cell Painting (JUMP-CP) Consortium is pioneering a data-driven approach to drug discovery by building the world's largest public repository of cellular morphological data [58]. In parallel, the OASIS Data Provenance Standards (DPS) Initiative is developing critical frameworks to ensure the transparency, trustworthiness, and proper governance of this and other complex datasets [59]. Together, these efforts are creating an ecosystem where rich biological data can be both computationally explored and reliably trusted, accelerating the path from basic research to therapeutic applications.
The JUMP-Cell Painting Consortium: Revolutionizing Morphological Profiling
The JUMP-Cell Painting Consortium, spearheaded by the Broad Institute of MIT and Harvard, represents a collaborative effort involving leading pharmaceutical companies, academic institutions, and non-profit research organizations [60]. Its primary mission is to validate and scale up image-based drug discovery strategies by creating an unprecedented public cell imaging dataset [58]. This initiative aims to relieve a major bottleneck in the pharmaceutical pipeline: determining a potential therapeutic's mechanism of action prior to clinical studies [61]. The consortium's ultimate goal is to "make cell images as computable as genomes and transcriptomes" [58] [61].
The Cell Painting Assay: Technical Foundation
The Cell Painting assay serves as the technological cornerstone of the JUMP-CP initiative. It is a high-content, image-based morphological profiling assay that uses six fluorescent dyes to label eight cellular components, creating a comprehensive picture of cellular state [2] [46].
Table 1: Cell Painting Staining Panel and Cellular Targets
| Dye Name | Cellular Target | Stained Components |
|---|---|---|
| Hoechst 33342 | DNA | Nucleus |
| Phalloidin | F-actin | Actin cytoskeleton |
| Concanavalin A | Mannose residues | Endoplasmic Reticulum, Golgi apparatus |
| SYTO 14 | RNA | Nucleoli, Cytoplasmic RNA |
| Wheat Germ Agglutinin (WGA) | N-acetylglucosamine & sialic acid | Plasma Membrane, Golgi apparatus |
| MitoTracker | Thiol groups | Mitochondria |
The protocol involves plating cells in multi-well plates, perturbing them with treatments of interest, followed by staining, fixation, and high-throughput microscopy [2]. Automated image analysis software then identifies individual cells and measures approximately 1,500 morphological features including size, shape, texture, and intensity to generate rich phenotypic profiles [2]. The entire process from cell culture to data analysis typically takes 2-4 weeks [2] [46].
JUMP-CP Dataset Scale and Composition
The JUMP-CP consortium has generated a massive, publicly available dataset that offers unprecedented resources for the research community.
Table 2: JUMP-CP Dataset Composition and Access
| Aspect | Details |
|---|---|
| Total Samples | >140,000 [60] [61] |
| Chemical Perturbations | ~117,000 small molecules [60] |
| Genetic Perturbations | ~13,000 overexpressed genes, ~8,000 CRISPR-Cas9 gene knockouts [60] |
| Cell Line | U2OS (osteosarcoma) [62] |
| Data Access | Registry of Open Data on AWS (Cell Painting Gallery) [62] [61] |
| Exploration Tools | JUMP-CP Data Explorer (Ardigen phenAID platform) [60] |
Applications in Drug Discovery and Biomedical Research
The rich morphological profiles generated through JUMP-CP enable multiple powerful applications:
- Mechanism of Action Elucidation: Clustering small molecules by phenotypic similarity helps identify mechanisms of action for uncharacterized compounds [2].
- Functional Gene Annotation: Matching unannotated genes to known genes based on similar phenotypic profiles reveals their biological functions [2].
- Drug Repurposing: Identifying compounds that revert disease-associated phenotypic signatures back to "wild-type" morphology reveals potential new therapeutic applications [2].
- Library Enrichment: Selecting diverse compound subsets that maximize phenotypic diversity while minimizing redundancy in screening collections [2] [46].
The OASIS Data Provenance Initiative: Ensuring Data Trustworthiness
As datasets like JUMP-CP grow in scale and importance, ensuring data reliability and proper governance becomes increasingly critical. The OASIS Data Provenance Standards (DPS) Technical Committee (TC) represents a cross-industry effort to establish standardized metadata frameworks for tracking data origins, transformations, and compliance [59] [63]. Founding members include technology leaders such as Cisco, IBM, Intel, Microsoft, and Red Hat [59].
The initiative recognizes that for AI to create value for business and society, "the data that trains and feeds models must be trustworthy" [59]. This is particularly relevant for complex biological datasets like JUMP-CP, where understanding data lineage directly impacts the reliability of research conclusions.
Technical Scope and Objectives
The DPS TC focuses on implementing consistent tagging and metadata frameworks across data ecosystems—down to database, table, and column levels—to provide comprehensive data lineage and collection details tracking [63]. The committee's work encompasses:
- Standardized Metadata Framework: Developing a common language for data provenance that supports transparency, accountability, and trust [59].
- Lifecycle Management: Creating guidelines for managing data throughout its lifecycle, from origin through transformations and applications [63].
- Compliance and Risk Mitigation: Supporting organizations in managing compliance with data privacy, security, and intellectual property regulations [59] [63].
- Automation Integration: Providing guidance for developing tools that automate metadata tagging, validation, and transformation to ensure accuracy and compliance at scale [63].
Expected Benefits and Applications
The Data Provenance Standards are designed to benefit multiple stakeholders across the data ecosystem:
- Data Producers/Scientists: Ability to deliver clear and consistent data lineage information, making datasets more valuable and trustworthy [59] [63].
- Research Organizations/Data Acquirers: Greater transparency to assess dataset reliability and intended usage, enabling more informed decisions about data utilization [59] [63].
- Regulatory Bodies & End Users: Insight into how data is managed and protected, fostering trust in data-driven solutions and research outcomes [59].
Integrated Experimental Protocols and Applications
JUMP-CP Optimized Cell Painting Protocol (Version 3)
The JUMP-CP consortium has refined the original Cell Painting assay through quantitative optimization. Key improvements in Version 3 include [46]:
- Simplified Staining: Elimination of media removal before MitoTracker addition to minimize cell loss.
- Cost Reductions: Phalloidin concentration reduced fourfold (33 nM to 8.25 nM), Hoechst reduced fivefold (5 to 1 μg/mL), and concanavalin A reduced 20-fold (100 to 5 μg/mL).
- Enhanced Signals: SYTO 14 concentration increased twofold (3 to 6 μM) to improve signal quality.
- Automation Compatibility: Combined permeabilization and staining steps to facilitate high-throughput implementation.
- Reagent Conservation: Overall reduction of post-fixation staining volumes from 30 to 20 μL/well.
This optimized protocol maintains robust performance while significantly reducing reagent costs, a critical consideration for large-scale screening efforts [46].
Data Provenance Implementation Framework
Implementing data provenance standards for morphological profiling data involves:
- Metadata Tagging: Applying standardized metadata at multiple levels (dataset, experiment, well, image) to capture experimental conditions, processing steps, and analytical transformations [59] [63].
- Lineage Tracking: Documenting the origin of datasets, including cell sources, reagent lots, instrumentation details, and processing parameters [63].
- Compliance Documentation: Recording data privacy, security, and intellectual property considerations relevant to data usage [59].
- Provenance Validation: Implementing automated checks to ensure provenance information remains accurate and complete throughout the data lifecycle [63].
Integrated Workflow for Trusted Morphological Profiling
The synergy between JUMP-CP and OASIS initiatives enables an end-to-end workflow for generating and utilizing trustworthy morphological data.
Essential Research Reagents and Computational Tools
Successful implementation of integrated morphological profiling and data provenance requires specific research reagents and computational resources.
Table 3: Essential Research Reagents and Computational Tools
| Category | Specific Items | Function/Application |
|---|---|---|
| Cell Painting Dyes | Hoechst 33342, Phalloidin (conjugates), Concanavalin A (Alexa Fluor conjugate), SYTO 14 Green RNA Stain, Wheat Germ Agglutinin (conjugates), MitoTracker Deep Red | Multiplexed staining of cellular components for morphological profiling [2] [46] |
| Cell Culture Materials | U2OS cell line, multi-well plates (96/384-well), cell culture media and supplements | Cell model system and experimental vessel for high-throughput screening [62] |
| Imaging Equipment | High-content screening microscopes with water immersion objectives, large sCMOS detectors, confocal capability | High-resolution image acquisition with sufficient throughput for large-scale screening [64] |
| Image Analysis Software | CellProfiler, Deep learning models (ResNet, SimCLR, DINO) | Feature extraction and morphological profile generation from raw images [2] [62] |
| Data Provenance Tools | OASIS DPS-compliant metadata taggers, Lineage tracking systems, Validation frameworks | Standardized provenance metadata management and compliance documentation [59] [63] |
The synergistic relationship between the JUMP-CP and OASIS initiatives represents a powerful framework for advancing drug discovery and biomedical research. JUMP-CP provides the rich, multidimensional morphological data necessary to understand complex biological systems and compound effects, while the OASIS Data Provenance standards ensure this data remains trustworthy, interpretable, and reusable. As these consortium-driven efforts continue to evolve and mature, they establish a new paradigm for collaborative science—one that leverages scale and standardization to accelerate the translation of basic research into therapeutic applications. The integration of robust experimental methods with comprehensive data governance creates a foundation for more reliable, reproducible, and impactful drug discovery pipelines.
In the field of high-content screening for drug discovery, quantitatively assessing the performance and robustness of phenotypic assays is paramount. For the Cell Painting assay—a powerful method for morphological profiling that uses multiplexed fluorescent dyes to label eight cellular components—two primary metrics, percent replicating and percent matching, have emerged as critical tools for benchmarking assay quality [46]. This application note details the experimental and computational protocols for implementing these metrics, which measure an assay's ability to detect true biological signals and group biologically related perturbations together. We provide a structured framework, validated by the Joint Undertaking for Morphological Profiling (JUMP) Cell Painting Consortium, to standardize the optimization and validation of image-based profiling assays, ensuring reliable data for downstream drug discovery applications [46] [65].
Morphological profiling with the Cell Painting assay extracts thousands of quantitative features from microscopy images to create a rich representation of cellular state following genetic or chemical perturbation [2]. The assay's utility hinges on its ability to produce consistent, biologically meaningful profiles. The percent replicating and percent matching metrics were developed to move beyond qualitative, visual assessment of stain quality to a quantitative, systematic evaluation of profiling performance [46].
These metrics evaluate the similarity of morphological profiles based on a null distribution of correlations. Specifically, they measure how often the pairwise correlation of two wells that should be similar exceeds the 95th percentile (or falls below the 5th percentile) of a null distribution generated from 10,000 pairs of random, non-matching wells [46]. In an untreated control plate, one would expect a baseline value of approximately 5% for a one-tailed test.
Experimental Design for Benchmarking
The JUMP-MOA Compound Plate
A cornerstone of this benchmarking approach is the use of a standardized control plate, known as the JUMP-MOA (Mechanism of Action) plate.
- Purpose: This plate serves as a positive control to determine whether treated wells show greater morphological similarity than would be expected by chance [46].
- Design: It contains four replicates each of over 40 pairs of mechanism-of-action-matched compounds [65]. This design includes 90 distinct compounds selected to cover a broad spectrum of biological activities, enabling the calculation of both percent replicating (using replicates) and percent matching (using different compounds with the same MOA) [46].
- Utility: The plate layout, with replicates in different well positions, helps to ensure that metrics are less influenced by plate position effects (e.g., edge effects) which could artificially inflate performance scores if not properly controlled [46].
Core Metric Definitions and Calculations
The following table summarizes the two key metrics used for quantitative profiling.
Table 1: Key Metrics for Quantifying Cell Painting Assay Performance
| Metric | Definition | Calculation Basis | Interpretation |
|---|---|---|---|
| Percent Replicating | The proportion of instances where technical replicates of the same treatment show high morphological similarity [46]. | Pairwise correlation of profiles from wells with identical treatments [46]. | Measures assay precision and detectability. A high value indicates the assay can reliably detect a phenotype above technical noise. |
| Percent Matching | The proportion of instances where different treatments with the same biological mechanism (e.g., targeting the same protein) show similar morphological profiles [46]. | Pairwise correlation of profiles from wells with different, but biologically related, treatments [46]. | Measures biological relevance and grouping power. A high value indicates the assay can correctly group perturbations by biological action. |
The following diagram illustrates the logical workflow for calculating and interpreting these key benchmarking metrics.
Detailed Protocols for Metric Implementation
Cell Painting Assay Protocol (Version 3)
The following protocol is based on the optimized version established by the JUMP Consortium, which includes modifications to reduce cost and simplify the process without sacrificing data quality [46].
Table 2: Research Reagent Solutions for Cell Painting (Version 3)
| Reagent | Target(s) | Optimal Concentration (v3) | Function & Notes |
|---|---|---|---|
| Hoechst 33342 | DNA | 1 µg/mL (5x reduction) [46] | Labels nucleus. Cost-saving reduction from original protocol. |
| SYTO 14 | Cytoplasmic RNA | 6 µM (2x increase) [46] | Labels nucleoli and cytoplasmic RNA. Concentration increased to improve signal. |
| Phalloidin | Actin | 1.25 µL/mL (4x reduction) [46] | Labels filamentous actin. Cost-saving reduction. |
| WGA | Golgi, Plasma Membrane | Unchanged | Labeled with Alexa Fluor 594 conjugate. |
| Concanavalin A | Endoplasmic Reticulum | 5 µg/mL (20x reduction) [46] | Labeled with Alexa Fluor 488 conjugate. Significant cost-saving reduction. |
| MitoTracker | Mitochondria | 500 nM (corrected concentration) [46] | Labels mitochondria. Protocol simplified; no media removal before addition. |
Key Protocol Steps and Optimizations:
- Cell Culture and Perturbation: Plate cells in multi-well plates (e.g., 384-well) and treat with chemical or genetic perturbations. The JUMP-MOA plate is run alongside experimental plates for benchmarking.
- Staining and Fixation (Updated Steps):
- MitoTracker Stain: Add MitoTracker directly to the culture media without media removal to minimize cell loss [46].
- Fixation and Permeabilization: Fix cells with formaldehyde, then permeabilize with Triton X-100.
- Combined Staining: The protocol has been updated to combine permeabilization and the addition of other stains (Phalloidin, WGA, Concanavalin A) to make the process more automation-friendly [46].
- Post-fixation Staining: Apply the remaining stains (Hoechst, SYTO 14). The total post-fixation staining volume has been reduced from 30 µL/well to 20 µL/well to save on reagent costs [46].
- Image Acquisition: Acquire images on a high-throughput microscope using five fluorescence channels. The JUMP Consortium found the assay to be robust across multiple microscope systems from different vendors [65]. Recommendations for optimal settings are provided in Section 4.
- Timeline: Cell culture and image acquisition typically take 1-2 weeks for batches of ≤20 plates; subsequent feature extraction and data analysis take an additional 1-2 weeks [46] [2].
Computational Analysis Protocol
- Image Analysis and Feature Extraction:
- Data Aggregation and Normalization:
- Aggregate single-cell data to the well level by taking the median value of each feature across all cells in the well.
- Normalize the data to correct for plate-wide technical artifacts (e.g., using robust z-score normalization).
- Similarity Calculation and Metric Computation:
- Calculate the pairwise similarity (e.g., Pearson correlation) between all wells on the plate.
- For Percent Replicating: For each compound with replicates, calculate the proportion of replicate pairs whose correlation is above the 95th percentile of the null distribution of random pairs [46]. Report the average proportion across all compounds.
- For Percent Matching: For each pair of compounds annotated with the same mechanism of action, calculate the proportion of pairs whose correlation is above the 95th percentile (for similar phenotypes) or below the 5th percentile (for opposite phenotypes) of the null distribution [46]. Report the average proportion across all MOA classes.
Benchmarking Microscope Performance
The JUMP Consortium systematically evaluated how different microscope settings impact the Cell Painting assay's performance using the percent replicating and percent matching metrics [65]. The following diagram outlines the experimental optimization process.
Their findings provide a benchmark for laboratories to optimize their own systems. The tables below summarize top-performing settings for two example microscopes.
Table 3: Example Leaderboard of Microscope Settings (System A) [65]
| Rank | Modality | Magnification | NA | Z Planes | Sites/Well | Percent Score |
|---|---|---|---|---|---|---|
| 1 | Widefield | 20X | 0.75 | 1 | 9 | 100.0 |
| 2 | Confocal | 10X | 0.45 | 3 | 4 | 98.8 |
| 3 | Widefield | 10X | 0.45 | 1 | 4 | 91.5 |
Table 4: Example Leaderboard of Microscope Settings (System B) [65]
| Rank | Modality | Magnification | NA | Z Planes | Sites/Well | Percent Score |
|---|---|---|---|---|---|---|
| 1 | Confocal | 20X | 1.0 | 12 | 9 | 100.0 |
| 2 | Confocal | 20X | 1.0 | 12 | 9 | 93.8 |
| 3 | Confocal | 20X | 1.0 | 1 | 9 | 91.3 |
Key Findings from Microscope Optimization:
- Magnification: Data from 20X objectives typically yielded better profile strength compared to 10X or 40X objectives [65].
- Sites per Well: Imaging three or more sites per well consistently increased profile strength, as it captures a larger number of cells, improving statistical power [65].
- Robustness: The Cell Painting assay was found to be highly robust, producing quality data across a wide range of microscope modalities (widefield, confocal) and settings from different vendors [46] [65].
Applications in Drug Discovery Benchmarking
The percent replicating and percent matching framework is instrumental in advancing drug discovery research.
- Perturbation Detection: These metrics can filter a library of perturbations to identify those that induce a detectable morphological phenotype, a crucial first step before further analysis. One benchmark study found that compounds generally produced stronger detectable signals than genetic perturbations (CRISPR knockout or ORF overexpression) in the Cell Painting assay [3].
- Mechanism of Action (MOA) Elucidation: By matching the morphological profile of a compound with unknown MOA to a database of profiles from annotated compounds, researchers can hypothesize its mechanism of action [2]. The percent matching metric directly quantifies an assay's power to perform this task.
- Virtual Screening: Profiles can be used to query large public datasets, such as the CPJUMP1 resource which contains over 3 million images, to find perturbations that induce similar or opposite phenotypes, accelerating drug repurposing and toxicology studies [3].
- Assay Quality Control: Implementing these metrics routinely using the JUMP-MOA plate provides a standardized measure of assay performance over time and across different laboratory sites, ensuring data quality and reproducibility for large-scale projects [46] [65].
In phenotypic drug discovery, the ability to systematically perturb biological systems and accurately read out the resulting cellular states is fundamental. The Cell Painting assay has emerged as a powerful, unbiased morphological profiling technique that captures a rich, high-dimensional representation of cell state by using multiplexed fluorescent dyes to mark eight major cellular components [5] [2]. This application note provides a structured comparison of three primary perturbation modalities—small molecule compounds, CRISPR knockout (CRISPRko), and ORF overexpression—when used in conjunction with Cell Painting. We summarize quantitative performance data, detail essential experimental protocols, and outline key reagent solutions to guide researchers in designing robust morphological profiling screens.
Quantitative Comparison of Perturbation Modalities
The phenotypic strength and performance of different perturbation types can be quantified using metrics from genetic screens and morphological profiling. The table below summarizes key characteristics and performance metrics for each modality.
Table 1: Performance Characteristics of Different Perturbation Modalities in Genetic and Phenotypic Screens
| Perturbation Modality | Primary Effect on Gene/Gene Product | Typical Screening Library Size (sgRNAs/ORFs/Compounds) | Key Performance Metrics (from cited studies) | Phenotypic Profiling Utility with Cell Painting |
|---|---|---|---|---|
| CRISPR Knockout (CRISPRko) | Complete, permanent gene disruption [66] | ~77,000 sgRNAs (e.g., Brunello library; 4 sgRNAs/gene) [66] | • dAUC: 0.80 (Essential genes), 0.42 (Non-essential genes) [66]• Outperforms earlier libraries (GeCKO, Avana) in distinguishing essential/non-essential genes [66] | Identifies loss-of-function phenotypes; essential genes show strong morphological deviations in viability-related features. |
| ORF Overexpression | Ectopic overexpression of cDNA [67] | Varies (e.g., entire ORFeome collections) | • Functional insight from variant alleles [2]• Can reveal dominant-negative or gain-of-function phenotypes [2] | Identifies gain-of-function phenotypes; can model diseases or activation of specific pathways. |
| Small Molecule Compounds | Modulation of protein function (inhibition or activation) [5] | Thousands to millions of compounds | • Phenoactivity: Strength of morphological change varies by cell line and compound [5]• Phenosimilarity: Ability to predict Mechanism of Action (MoA) based on profile similarity [5] | Groups compounds by MoA; detects polypharmacology and off-target effects. |
Different cell lines can exhibit varying sensitivities to these perturbations. The table below illustrates how cell line selection impacts the detection of phenotypic activity and mechanism of action (MoA) for small molecule treatments in Cell Painting assays.
Table 2: Impact of Cell Line Selection on Compound Phenotyping in Cell Painting (based on [5])
| Cell Line | Strength in Detecting Phenotypic Activity | Strength in Predicting Mechanism of Action (MoA) | Notes on Morphological Context |
|---|---|---|---|
| A549 | Information missing from search results | Information missing from search results | The specific rankings for A549 in activity and MoA prediction are not provided in the search results. |
| HEPG2 | Poorer performance reported [5] | Information missing from search results | Grows in highly compact colonies, blurring phenotypic distinctions [5]. |
| OVCAR4 | Information missing from search results | Information missing from search results | The specific rankings for OVCAR4 in activity and MoA prediction are not provided in the search results. |
| General Finding | Cell lines best for detecting strong phenotypic activity are often different from those best for predicting MoA [5] | Cell lines best for predicting MoA are often different from those best for detecting strong activity [5] | Genetic background influences target expression and pathway utilization, leading to distinct morphological changes. |
Experimental Protocols for Integrated Perturbation and Cell Painting Screens
Protocol: Pooled CRISPRko Screening with Cell Painting Readout
This protocol outlines the steps for conducting a genome-wide CRISPR knockout screen followed by morphological profiling.
Key Reagents:
- CRISPRko Library: e.g., Brunello library (77,441 sgRNAs, 4 sgRNAs/gene, 1000 non-targeting controls) in lentiGuide vector [66].
- Cell Line: Cas9-expressing cells (e.g., A375, U2OS) [66] [5].
- Cell Painting Stains: Hoechst 33342 (DNA), Concanavalin A (Endoplasmic Reticulum), SYTO 14 (Nucleoli, RNA), Phalloidin (F-actin), Wheat Germ Agglutinin-WGA (Golgi, Plasma Membrane), MitoTracker Deep Red (Mitochondria) [5] [2].
Procedure:
- Library Transduction:
- Transduce the Brunello library into Cas9-expressing cells at a low Multiplicity of Infection (MOI ~0.3-0.5) to ensure most cells receive a single sgRNA [66].
- Maintain a minimum coverage of 500x per sgRNA (e.g., 500 cells per sgRNA in the library) throughout the experiment to prevent stochastic loss of guides [66].
Selection and Culture:
Cell Painting and Imaging:
- Plate cells in multi-well plates for the Cell Painting assay.
- Follow the standard Cell Painting protocol: stain with the six dyes, fix, and acquire images on a high-throughput microscope [2].
Image and Data Analysis:
- Use automated image analysis software (e.g., CellProfiler) to segment individual cells and extract ~1,500 morphological features (size, shape, texture, intensity) [2].
- For essential gene identification, sequence the sgRNA cassette from genomic DNA to determine guide abundance depletion [66].
- Correlate sgRNA depletion or specific genetic perturbations with morphological profiles to link gene function to phenotype.
Protocol: ORF Overexpression Screening with Cell Painting
This protocol describes the process for screening ORF overexpression libraries using Cell Painting as a readout.
Key Reagents:
- ORF Library: A genome-wide collection of open reading frames in an appropriate expression vector.
- Cell Line: Suitable for transfection/transduction (e.g., U2OS) [5].
Procedure:
- Perturbation Introduction:
- Transduce or transfect the ORF library into cells, ensuring adequate coverage for each ORF.
Cell Painting and Imaging:
- After a suitable expression period (e.g., 24-72 hours), perform the Cell Painting assay as described in section 2.1, steps 3-4 [2].
Data Analysis:
- Extract morphological profiles and cluster them. Genes whose overexpression induces similar morphological profiles are likely to be functionally related or part of the same pathway [2].
- Compare profiles induced by wild-type versus variant alleles to decipher the functional impact of genetic variants [2].
Protocol: Small Molecule Compound Screening with Cell Painting
This protocol covers the use of Cell Painting for profiling compound libraries.
Key Reagents:
- Compound Library: A collection of annotated small molecules (e.g., ~3,214 compounds covering diverse MoAs) [5].
- Cell Line: Selected based on screening goals (e.g., A549, OVCAR4, DU145, 786-O, HEPG2, U2OS) [5].
Procedure:
- Compound Treatment:
- Plate cells in multi-well plates and treat with compounds at one or multiple concentrations, including DMSO controls.
- Incubate for a predetermined time (e.g., 24-48 hours) to allow phenotypic manifestation.
Cell Painting and Imaging:
- Perform the Cell Painting assay as described in section 2.1, steps 3-4 [2].
Data Analysis:
The Scientist's Toolkit: Essential Research Reagent Solutions
The following table lists key reagents and their critical functions in perturbation and Cell Painting experiments.
Table 3: Essential Research Reagents for Perturbation and Cell Painting Assays
| Reagent / Resource | Function and Role in the Experiment | Example or Specification |
|---|---|---|
| Optimized CRISPRko Library | Targets all genes in the genome with high-efficacy sgRNAs for maximal on-target and minimal off-target effects. | Brunello library (77,441 sgRNAs) [66] |
| ORF Overexpression Library | Allows for systematic ectopic expression of genes to study gain-of-function phenotypes. | Genome-wide cDNA collections. |
| Cell Painting Dye Set | Multiplexed staining of eight cellular components for comprehensive morphological profiling. | Hoechst 33342, Concanavalin A, SYTO 14, Phalloidin, WGA, MitoTracker Deep Red [2] |
| dCas9 Effector Systems | Enables CRISPR interference (CRISPRi) or activation (CRISPRa) for reversible gene modulation. | Dolcetto (CRISPRi) and Calabrese (CRISPRa) libraries [66] |
| Validated Cell Lines | Provide a consistent biological context; Cas9-expressing lines are required for CRISPRko. | U2OS, A375, MCF-7 [66] [5] [68] |
| Image Analysis Software | Segments cells and extracts ~1,500 quantitative morphological features from images. | CellProfiler [5] [2] |
Workflow and Data Integration Diagrams
Integrated Workflow for Multi-Modal Perturbation Screening with Cell Painting
Data Integration and Analysis Pathways from Multi-Modal Profiling
Within the context of drug discovery, the Cell Painting assay has emerged as a powerful high-content screening tool for morphological profiling. It uses multiplexed fluorescent dyes to stain eight cellular components, generating rich image data that captures the phenotypic state of cells under various chemical or genetic perturbations [69]. A critical step in leveraging this data is feature extraction—converting raw images into quantitative descriptors that can be used for predicting drug mechanisms of action, such as target identification [70] [40].
For years, the standard approach has relied on classical bioimage informatics tools like CellProfiler, which executes cell segmentation and measures hand-crafted morphological features (e.g., size, shape, texture, intensity) [69] [62]. Recently, Self-Supervised Learning (SSL) methods have emerged as a powerful, segmentation-free alternative, learning feature representations directly from images without extensive manual curation [40] [71]. This application note provides a comparative benchmark analysis of these two paradigms for the critical task of target prediction.
Performance Benchmarking & Quantitative Comparison
To objectively evaluate the performance of SSL against CellProfiler for target prediction, we summarize key quantitative findings from recent large-scale studies using the JUMP-CP dataset, a massive public repository of Cell Painting images [40] [62].
Table 1: Benchmarking Performance on Target and Gene Family Classification
| Feature Extraction Method | Backbone Architecture | Target Prediction Accuracy (Top-1) | Gene Family Classification (Avg. ROC AUC) | Computational Cost (GPU Hours) |
|---|---|---|---|---|
| CellProfiler (Classical) | Hand-crafted features | 64.5% [40] | 0.622 [62] | CPU-based, high [40] |
| DINO (SSL) | ViT-S | 78.2% [40] | 0.626 [62] | ~10-20 [40] |
| SimCLR (SSL) | ViT-S | 71.8% [40] | 0.626 [62] | ~15-25 [40] |
| MAE (SSL) | ViT-B | 73.5% [40] | Information Missing | ~15-25 [40] |
| CWA-MSN (SSL) | Custom CNN | Information Missing | +29% over OpenPhenom (SSL) [71] | Highly Efficient [71] |
Table 2: Performance on Bioactivity and Generalizability Tasks
| Evaluation Task | Best Performing Method | Key Performance Metric | Remarks |
|---|---|---|---|
| Drug Target Identification | DINO (SSL) | 78.2% Accuracy [40] | Surpassed CellProfiler by >13% [40] |
| Bioactivity Prediction | DINO (SSL) | Comparable to supervised models [40] | Small gap between SSL and supervised learning [40] |
| Generalizability (Genetic Perturbations) | DINO (SSL) | Outperformed CellProfiler on unseen data [40] | Showed remarkable transferability without fine-tuning [40] |
| Robustness to Batch Effects | SimCLR (multi-source) | Achieved robust performance (ROC AUC 0.626) [62] | Multi-source training improves robustness over single-source [62] |
Detailed Experimental Protocols
Protocol 1: Self-Supervised Learning (DINO) Feature Extraction
This protocol outlines the procedure for training a DINO model and extracting features from Cell Painting images for downstream target prediction tasks [40].
Research Reagent Solutions & Materials
Table 3: Essential Materials for SSL-based Morphological Profiling
| Item | Function/Description |
|---|---|
| JUMP-CP Dataset | A massive public dataset of ~117,000 chemical and 20,000 genetic perturbations, imaged via Cell Painting [40]. |
| 5-channel Cell Painting Images | Raw image data stained with fluorescent dyes to visualize 8 cellular components [40] [69]. |
| Vision Transformer (ViT) | Deep learning architecture (e.g., ViT-S/ViT-B) used as the backbone for feature extraction [40]. |
| GPU Computing Cluster | Essential for training large-scale self-supervised models in a reasonable time frame [40]. |
Step-by-Step Procedure
Data Preparation
- Source a subset of the JUMP-CP dataset (e.g., 10,000 compounds across multiple experimental sources) for training [40].
- Exclude images without cells during both training and inference to maintain data quality [40].
- Split data into training, validation, and test sets. Ensure the test set contains perturbations (both compound and genetic) from sources not seen during training to properly assess generalizability [40].
Model Training (DINO)
- Adapt the DINO framework for 5-channel Cell Painting images, as it was originally designed for 3-channel RGB images [40].
- Apply augmentations during training. The study found 'Flip' and 'Color' augmentations to be most effective for Cell Painting data [40].
- Train the model using the distillation-based SSL approach where a student network learns to match the output of a teacher network when presented with different augmented views of the same input image [40].
Feature Extraction & Profiling
- Divide inference images into smaller patches and feed them through the pre-trained DINO model [40].
- Average the embeddings from all patches to obtain a single feature vector per image [40].
- Aggregate profiles: Average normalized feature vectors across replicate images of the same perturbation (e.g., same compound) to create a consensus morphological profile for that perturbation. This can be done at the batch, source, or full dataset level [40].
Protocol 2: Classical Feature Extraction with CellProfiler
This protocol describes the established workflow for generating morphological profiles using CellProfiler's hand-crafted features [69].
Research Reagent Solutions & Materials
| Item | Function/Description |
|---|---|
| CellProfiler Software | Open-source software for automated image analysis, including segmentation and feature measurement [72] [26]. |
| CellProfiler Pipeline | A predefined sequence of image analysis modules tailored for Cell Painting data (e.g., illumination correction, object identification, measurement) [69] [26]. |
| High-Performance CPU Cluster | Necessary for processing the high volume of images and computationally intensive segmentation steps [40]. |
Step-by-Step Procedure
Pipeline Setup
Image Preprocessing & Segmentation
- Run illumination correction to account for uneven lighting within and across images [69].
- Execute sequential segmentation to identify "parent" objects (e.g., nuclei, cells) and "child" objects (e.g., organelles within nuclei) using modules like
IdentifyPrimaryObjects[72]. - Use the
RelateObjectsmodule to associate child objects with their parent objects, allowing measurements of organelles to be linked to specific cells [72].
Feature Measurement & Aggregation
- Extract measurements: For each segmented cell, CellProfiler automatically calculates hundreds of hand-crafted features encompassing size, shape, texture, intensity, and correlation between channels [69].
- Export data: The result is a large table of morphological features for every single cell analyzed.
- Aggregate per perturbation: Apply feature selection and normalization techniques. Then, average the single-cell data across all cells and replicate wells corresponding to the same perturbation to create a consensus profile [40] [62].
Workflow & Conceptual Diagrams
The following diagrams illustrate the core differences between the classical and AI-driven workflows for morphological profiling.
Diagram 1: A comparison of the classical and self-supervised learning (SSL) workflows for morphological profiling. The classical pathway (A) is a multi-step process reliant on segmentation and hand-crafted features. The SSL pathway (B) is a segmentation-free, end-to-end approach that learns features directly from images.
In phenotypic drug discovery, changes in cellular morphology serve as a powerful indicator of underlying functional states and therapeutic responses. The Cell Painting assay has emerged as a preeminent high-throughput phenotypic profiling (HTPP) method for capturing these morphological changes in response to genetic or compound perturbations [73]. This application note details methodologies and analytical frameworks for establishing the predictive validity of morphological profiles derived from Cell Painting by correlating them with known compound properties and toxicity endpoints. By validating that computationally inferred morphological features accurately reflect known bioactivity and toxicity, researchers can confidently employ these profiles for mechanism of action (MOA) identification and compound prioritization, thereby accelerating early drug discovery pipelines.
Key Research Reagent Solutions for Cell Painting Assays
The following table catalogues essential reagents and their functions for implementing a standard Cell Painting assay, which forms the foundation for generating high-quality morphological profiles.
Table 1: Essential Reagents for Cell Painting Assays
| Reagent Category | Specific Example | Function in the Assay |
|---|---|---|
| Nuclear Stain | Hoechst 33342, DAPI | Labels nuclear DNA to enable analysis of nuclear morphology and count [73]. |
| Cytoplasmic RNA Stain | SYTO 14 green fluorescent RNA dye | Labels cytoplasmic and nucleolar RNA [73]. |
| Endoplasmic Reticulum (ER) Stain | Concanavalin A, Alexa Fluor 488 Conjugate | Labels the endoplasmic reticulum and Golgi apparatus [73]. |
| Mitochondrial Stain | MitoTracker dyes (e.g., MitoTracker Deep Red) | Labels mitochondria for analysis of mitochondrial morphology and distribution [73]. |
| Actin Cytoskeleton Stain | Phalloidin (e.g., Alexa Fluor 568-conjugated) | Labels filamentous actin (F-actin) to visualize the cytoskeleton [73]. |
| Lysosomal Stain | LysoTracker dyes | Labels lysosomes; included in expanded protocols like Cell Painting PLUS (CPP) for increased organelle specificity [73]. |
| Plasma Membrane Stain | Wheat Germ Agglutinin (WGA), Alexa Fluor 647 Conjugate | Labels the plasma membrane and Golgi apparatus [73]. |
Experimental Protocol for Morphological Profiling and Validation
This section provides a detailed methodology for generating morphological profiles and correlating them with known compound data to establish predictive validity.
Cell Painting Assay Workflow
Cell Culture and Plating:
Compound Treatment:
- Treat cells with the investigational compounds at a single relevant concentration (e.g., 1-10 µM) for a defined period (typically 24-48 hours). Include negative control wells (vehicle-only) and positive control wells (known bioactives) on each plate [74].
Staining and Fixation:
- Fix cells with paraformaldehyde (PFA) to preserve cellular architecture.
- Permeabilize cells using a mild detergent like Triton X-100.
- Stain cells using the cocktail of fluorescent dyes detailed in Table 1. For enhanced multiplexing, consider the Cell Painting PLUS (CPP) protocol, which uses iterative staining-elution cycles to label nine subcellular compartments in separate imaging channels, thereby improving organelle-specificity [73].
High-Content Imaging:
- Image stained plates using a high-content microscope (e.g., PerkinElmer Opera Phenix or similar systems).
- Acquire images at 20x or higher magnification across all fluorescent channels for each well.
Feature Extraction and Profile Generation
Image Analysis:
- Process acquired images using open-source software such as CellProfiler [22] or DeepProfiler [22]. These tools segment individual cells and identify cellular compartments.
- Extract thousands of quantitative morphological features for each cell, including measurements of size, shape, intensity, texture, and spatial relationships between organelles.
Profile Aggregation:
- Aggregate single-cell data to generate a median morphological profile for each compound treatment, typically represented as a feature vector. This profile serves as a unique "barcode" for the compound's phenotypic activity [74].
Establishing Predictive Validity via Correlation Analysis
Data Curation:
- Compile a ground-truth dataset of known properties for the tested compounds. This should include:
- Bioactivity Data: Single-concentration activity readouts or half-maximal inhibitory concentration (IC50) values from target-specific assays [74].
- Toxicity Endpoints: Data from in vitro toxicity assays (e.g., hepatotoxicity, cytotoxicity) or in vivo toxicological studies.
- Mechanism of Action (MOA) Annotations: Established MOA classifications for reference compounds.
- Compile a ground-truth dataset of known properties for the tested compounds. This should include:
Computational Correlation:
- Employ machine learning models to learn the relationship between the morphological profiles and the ground-truth data.
- Model Training: Train a supervised model (e.g., a multi-task ResNet-50) using the morphological profiles (input) to predict the bioactivity or toxicity labels (output) for a training set of compounds [74].
- Performance Validation: Evaluate the trained model on a held-out test set of compounds. Use metrics like the Area Under the Receiver Operating Characteristic Curve (ROC-AUC) to quantify predictive performance. An AUC of 0.7-0.8 is considered good, 0.8-0.9 is very good, and >0.9 is excellent [74].
- MOA Retrieval Benchmarking: Use the generated profiles to retrieve compounds with similar MOAs. Compare the retrieval accuracy of computationally generated profiles against the accuracy achieved using ground-truth morphological profiles from empirical screens [22].
Data Presentation and Validation Outcomes
The following tables summarize exemplary quantitative outcomes from studies that validate the predictive power of Cell Painting-based morphological profiles.
Table 2: Predictive Performance for Bioactivity Across Diverse Assays
| Assay Category | Number of Assays Evaluated | Average ROC-AUC | Performance Benchmark (Percentage of Assays ≥ 0.7 ROC-AUC) |
|---|---|---|---|
| Diverse Target-Based Assays | 140 | 0.744 ± 0.108 [74] | 62% achieved ≥ 0.7; 30% achieved ≥ 0.8; 7% achieved ≥ 0.9 [74] |
| Cell-Based Assays | N/A (subset of 140) | Particularly well-suited for prediction [74] | Performance often higher than biochemical assays [74] |
| Kinase Targets | N/A (subset of 140) | Particularly well-suited for prediction [74] | Performance often higher than other target classes [74] |
Table 3: Performance of the MorphDiff Model in MOA Identification
| Validation Task | Comparison | Reported Outcome |
|---|---|---|
| MOA Retrieval Accuracy | MorphDiff-generated morphology vs. Baseline methods | Outperformed baseline methods by 16.9% and 8.0%, respectively [22] |
| MOA Retrieval Accuracy | MorphDiff-generated morphology vs. Ground-truth morphology | Achieved comparable accuracy to ground-truth morphology [22] |
Visualizing Workflows and Logical Frameworks
Predictive Validity Establishment Workflow
The following diagram illustrates the end-to-end process for establishing the predictive validity of morphological profiles, from experimental setup to model validation.
MorphDiff Model Architecture
The diagram below outlines the architecture of MorphDiff, a state-of-the-art transcriptome-guided latent diffusion model that can simulate high-fidelity cell morphological responses to perturbations, demonstrating a key application of predictive models [22].
This application note provides a comprehensive framework for establishing the predictive validity of morphological profiles generated via the Cell Painting assay. By systematically correlating rich morphological data with known compound properties and toxicity, researchers can build robust, validated models. These models empower in-silico prediction of compound bioactivity and MOA for novel perturbations, as exemplified by advanced generative models like MorphDiff [22]. The protocols and validation benchmarks outlined herein enable the confident application of morphological profiling to de-risk compounds, prioritize hits, and streamline the drug discovery process, ultimately contributing to the development of safer and more effective therapeutics.
Conclusion
The Cell Painting assay has firmly established itself as a powerful, versatile, and robust platform for phenotypic profiling, fundamentally enhancing the drug discovery pipeline. By providing an unbiased, information-rich readout of cellular state, it successfully enables MoA elucidation, drug repurposing, and toxicity prediction, often uncovering insights missed by target-based approaches. Future directions will be shaped by the integration of advanced AI for segmentation-free analysis, the expansion of public benchmark datasets, and the development of more complex, physiologically relevant assay variants. As these computational and experimental techniques converge, Cell Painting is poised to become an even more indispensable tool, accelerating the development of safer and more effective therapeutics and strengthening the foundation of predictive toxicology.
References
- 1. Phenotypic Drug Discovery: Recent successes, lessons ... [https://pmc.ncbi.nlm.nih.gov/articles/PMC9708951/]
- 2. Cell Painting, a high-content image-based assay for ... [https://pmc.ncbi.nlm.nih.gov/articles/PMC5223290/]
- 3. Three million images and morphological profiles of cells ... [https://www.nature.com/articles/s41592-024-02241-6]
- 4. A scalable, data analytics workflow for image-based ... [https://www.sciencedirect.com/science/article/pii/S0169743924001722]
- 5. Cell Painting: A Decade of Discovery and Innovation in ... [https://pmc.ncbi.nlm.nih.gov/articles/PMC11810604/]
- 6. Cell Painting-based bioactivity prediction boosts high- ... [https://www.nature.com/articles/s41467-024-47171-1]
- 7. Fluorescent Cell Stains for Organelles & Cellular Structures [https://biotium.com/technology/cellular-stains/]
- 8. Journal Club—An In-Depth Look at Fluorescent Dyes for ... [https://www.thermofisher.com/us/en/home/references/newsletters-and-journals/bioprobes-journal-of-cell-biology-applications/bioprobes-70/fluorescent-dyes-organelle-labeling.html]
- 9. Cell Painting, a high-content image-based assay for ... [https://www.nature.com/articles/nprot.2016.105]
- 10. Accelerating Drug Discovery with Expanded Cell Painting [https://www.thermofisher.com/blog/life-in-the-lab/accelerating-drug-discovery-with-expanded-cell-painting/]
- 11. Cell Structure - SEER Training Modules [https://training.seer.cancer.gov/anatomy/cells_tissues_membranes/cells/structure.html]
- 12. A primer on the components of human cells [https://stanmed.stanford.edu/cell-components-building-blocks-life/]
- 13. Cell Structure (parts Of A Cell): Image Details [https://visualsonline.cancer.gov/details.cfm?imageid=9750]
- 14. Ten simple rules to colorize biological data visualization - PMC [https://pmc.ncbi.nlm.nih.gov/articles/PMC7561171/]
- 15. Spaco: A comprehensive tool for coloring spatial data at ... [https://www.sciencedirect.com/science/article/pii/S2666389923003240]
- 16. Cell painting, Phenotypic and Morphological Profiling [https://www.moleculardevices.com/applications/cell-imaging/cell-painting]
- 17. Cell Painting High-Content Image Assay [https://www.thermofisher.com/us/en/home/life-science/cell-analysis/cell-structure/cell-painting-assay.html]
- 18. Cell Painting Gallery folder structure - Broad Institute [https://broadinstitute.github.io/cellpainting-gallery/data_structure.html]
- 19. Using Transcriptomics and Cell Morphology Data in Drug ... [https://pmc.ncbi.nlm.nih.gov/articles/PMC10107910/]
- 20. Flow Cytometry: An Overview - PMC [https://pmc.ncbi.nlm.nih.gov/articles/PMC5939936/]
- 21. Cell Painting PLUS: expanding the multiplexing capacity of ... [https://www.nature.com/articles/s41467-025-58765-8]
- 22. Prediction of cellular morphology changes under ... [https://www.nature.com/articles/s41467-025-63478-z]
- 23. replicating high-throughput phenotypic profiling in a ... [https://pmc.ncbi.nlm.nih.gov/articles/PMC12477089/]
- 24. Uni-AIMS: AI-Powered Microscopy Image Analysis [https://arxiv.org/html/2505.06918v2]
- 25. Image-based profiling for drug discovery: due for a machine ... [https://pmc.ncbi.nlm.nih.gov/articles/PMC7754181/]
- 26. Published pipelines [https://cellprofiler.org/published-pipelines]
- 27. Opportunities and challenges in phenotypic drug discovery [https://www.nature.com/articles/nrd.2017.111]
- 28. Target deconvolution techniques in modern phenotypic ... [https://pmc.ncbi.nlm.nih.gov/articles/PMC3594516/]
- 29. The Deconvolution Revolution: Strategies for Target ... [https://momentum.bio/content/the-deconvolution-revolution-strategies-for-target-identification/]
- 30. Improving drug discovery with high-content phenotypic ... [https://pmc.ncbi.nlm.nih.gov/articles/PMC4844861/]
- 31. Phenotypic profiling of small molecules using cell painting ... [https://journals.plos.org/plosone/article?id=10.1371/journal.pone.0334025]
- 32. Predicting compound activity from phenotypic profiles and ... [https://www.nature.com/articles/s41467-023-37570-1]
- 33. Host-targeted antivirals against SARS-CoV-2 in clinical ... [https://pubmed.ncbi.nlm.nih.gov/39923941/]
- 34. Host-targeted antivirals against SARS-CoV-2 in clinical ... [https://www.sciencedirect.com/science/article/pii/S0166354225000270]
- 35. Repurposing existing drugs for the treatment ofCOVID-19 ... [https://www.sciencedirect.com/science/article/pii/S2405844024120191]
- 36. Drug repurposing against SARS-CoV-2 using computational ... [https://pmc.ncbi.nlm.nih.gov/articles/PMC8830191/]
- 37. Identification of potential SARS-CoV-2 inhibitors among ... [https://www.nature.com/articles/s41598-025-88388-4]
- 38. Morphological profiling of environmental chemicals ... [https://www.sciencedirect.com/science/article/pii/S0048969722021519]
- 39. High-Throughput Toxicology [https://www.epa.gov/chemical-research/high-throughput-toxicology]
- 40. Self-supervision advances morphological profiling by ... [https://www.nature.com/articles/s41598-025-88825-4]
- 41. Predicting organ toxicity using in vitro bioactivity data and ... [https://pmc.ncbi.nlm.nih.gov/articles/PMC6172960/]
- 42. Computational approaches to predict the toxicity of ... [https://pmc.ncbi.nlm.nih.gov/articles/PMC11811359/]
- 43. Selection of Optimal Cell Lines for High-Content ... [https://pmc.ncbi.nlm.nih.gov/articles/PMC10127200/]
- 44. Cell line characterization and selection made easy [https://digitalinsights.qiagen.com/news/blog/discovery/cell-line-characterization-and-selection-made-easy/]
- 45. PhenoModel: A multimodal phenotypic drug design ... [https://www.sciencedirect.com/science/article/pii/S2211383525006446]
- 46. Optimizing the Cell Painting assay for image-based profiling [https://pmc.ncbi.nlm.nih.gov/articles/PMC10536784/]
- 47. JUMP Cell Painting protocol (v3) in press [https://jump-cellpainting.broadinstitute.org/news/jump-cell-painting-protocol-v3-press]
- 48. Time resolved cell painting enables rapid assessment of ... [https://www.sciencedirect.com/science/article/pii/S2472555225000425]
- 49. Phenotypic Profiling of Reference Chemicals across ... [https://www.sciencedirect.com/science/article/pii/S247255522206614X]
- 50. Cell Painting PLUS: expanding the multiplexing capacity of ... [https://read.qxmd.com/read/40274798/cell-painting-plus-expanding-the-multiplexing-capacity-of-cell-painting-based-phenotypic-profiling-using-iterative-staining-elution-cycles]
- 51. Image-Based Profiling in Live Cells Using Live Cell Painting [https://pmc.ncbi.nlm.nih.gov/articles/PMC12514141/]
- 52. Unlocking the DINO Model for Self-Supervised Learning [https://www.labellerr.com/blog/unlocking-the-power-of-self-supervised-learning-in-computer-vision-with-dino/]
- 53. DINO: Unlocking Emergent Visual Intelligence in Self- ... [https://medium.com/@kdk199604/dino-unlocking-emergent-visual-intelligence-in-self-supervised-vision-transformers-fbb2be1d7344]
- 54. Self-Supervised Learning for Feature Extraction from ... [https://pubmed.ncbi.nlm.nih.gov/40029749/]
- 55. uniDINO: Assay-independent feature extraction for ... [https://pmc.ncbi.nlm.nih.gov/articles/PMC11930362/]
- 56. Weakly Supervised Set-Consistency Learning Improves ... [https://arxiv.org/html/2406.05308v1]
- 57. DINOv3: Self-supervised learning for vision at ... [https://ai.meta.com/blog/dinov3-self-supervised-vision-model/]
- 58. JUMP-Cell Painting Consortium [https://jump-cellpainting.broadinstitute.org/]
- 59. OASIS to Advance Global Adoption of Data & Trust ... [https://www.oasis-open.org/2025/03/06/oasis-to-advance-data-provenance-standards/]
- 60. JUMP-CP Consortium Data Explorer & Cell Painting Data [https://ardigen.com/phenotypic-profiling-ardigen-phenaid/jump-cp-consortium/]
- 61. Tackling JUMP-CP: Best-Practices to Navigate High ... [https://corelifeanalytics.com/content/tackling-jump-cp-best-practices-to-navigate-high-content-multiparametric-data/]
- 62. A comparative analysis of image representations - PMC [https://pmc.ncbi.nlm.nih.gov/articles/PMC10951426/]
- 63. Data Provenance Standards Technical Committee (DPS TC) [https://www.oasis-open.org/2025/03/26/call-for-participation-dps-tc/]
- 64. Best Practices for Cell Painting [https://pages.yokogawa.com/cellpainting-whitepaper?utm_source=linkedin&utm_medium=social&utm_campaign&utm_content=ap_hb5nhajy60]
- 65. Assessing the performance of the Cell Painting assay across ... [https://pmc.ncbi.nlm.nih.gov/articles/PMC10841730/]
- 66. Optimized libraries for CRISPR-Cas9 genetic screens with ... [https://www.nature.com/articles/s41467-018-07901-8]
- 67. CRISPR/Cas9‐mediated knockout and overexpression ... [https://pmc.ncbi.nlm.nih.gov/articles/PMC7680541/]
- 68. Predicting cell morphological responses to perturbations ... [https://www.nature.com/articles/s41467-024-55707-8]
- 69. Cell Painting, a high-content image-based assay for ... [https://github.com/carpenterlab/2016_Bray_NatureProtocols]
- 70. Artificial intelligence (AI) in drug design and discovery [https://www.sciencedirect.com/science/article/pii/S3050787125000484]
- 71. Efficient Cell Painting Image Representation Learning via ... [https://arxiv.org/html/2509.19896v1]
- 72. Introduction to tutorials | Tutorials - CellProfiler [https://tutorials.cellprofiler.org/]
- 73. Cell Painting PLUS: expanding the multiplexing capacity of ... [https://pmc.ncbi.nlm.nih.gov/articles/PMC12022024/]
- 74. Cell Painting-based bioactivity prediction boosts high ... [https://pmc.ncbi.nlm.nih.gov/articles/PMC11043326/]