Automated Fecal Egg Counting: Integrating USB Microscopy and AI for Advanced Parasitology Research
This article explores the development, application, and validation of automated fecal egg counting (FEC) systems that leverage USB digital microscopy.
Automated Fecal Egg Counting: Integrating USB Microscopy and AI for Advanced Parasitology Research
Abstract
This article explores the development, application, and validation of automated fecal egg counting (FEC) systems that leverage USB digital microscopy. Tailored for researchers and drug development professionals, it covers the foundational principles of digital microscopy and its necessity in parasitology. The content details methodological workflows for system setup, sample preparation, and integration with artificial intelligence (AI) for image analysis. It provides a comprehensive guide for troubleshooting common technical issues and optimizing system performance. Finally, the article critically reviews validation frameworks and comparative studies that benchmark these automated systems against traditional methods like McMaster and FLOTAC, highlighting their impact on diagnostic accuracy, efficiency, and anthelmintic development.
The Digital Revolution in Parasitology: Core Principles and Necessity of Automated FEC
The Critical Need for Advanced FEC in Biomedical and Clinical Research
Intestinal parasites represent a significant and persistent burden in both livestock and human medicine, with substantial economic and health implications. In livestock alone, gastrointestinal parasites cost the North Carolina cattle production industry an estimated $141 million in 2023 from an inventory worth approximately $673 million – representing a staggering 20% financial impact on total inventory value [1]. These infections reduce liveweight, feed efficiency, and milk yield, while serving as a leading cause of mortality in young animals [1]. Traditional diagnostic methods have relied on manual microscopy techniques where trained technicians examine fecal samples and manually count and identify parasite eggs by type. This process is not only tedious and time-consuming but also prone to human error and inefficiency, requiring 2-5 days for results while diverting skilled professionals from higher-level tasks [1]. The limitations of these conventional approaches have created a critical need for automated, accurate, and rapid fecal egg counting (FEC) systems that can transform parasitological diagnosis in both veterinary and biomedical contexts.
Comparative Analysis of Fecal Egg Counting Methodologies
Technical Performance of FEC Methods
The diagnostic landscape for gastrointestinal parasites encompasses multiple techniques with varying levels of sensitivity, accuracy, and practical utility. Table 1 provides a comprehensive comparison of the primary FEC methods used in research and clinical practice, highlighting their key characteristics and limitations.
Table 1: Comparison of Fecal Egg Counting Techniques
| Method | Detection Limit | Time per Sample | Key Advantages | Key Limitations |
|---|---|---|---|---|
| Modified McMaster (MMM) [2] | 50 eggs/g | 15-30 minutes | Widely available, established protocol | Lower sensitivity for <500 eggs/g [2] |
| Triple Chamber McMaster (TCM) [2] | 8 eggs/g | 15-30 minutes | Improved sensitivity over MMM | Methodological variability affects counts [2] |
| Mini-FLOTAC [3] | Varies by solution | 20-35 minutes | High sensitivity, accuracy, and precision [4] | Requires specific equipment |
| Wisconsin Sugar Flotation [5] | Varies | 30-45 minutes | Standardized for FECRT | Requires centrifugation [5] |
| Kubic FLOTAC Microscope (KFM) [4] | Not specified | Automated | AI-powered detection, portable for field use | Requires specialized equipment [4] |
| AI-Powered Microscopy [1] | Not specified | 10 minutes | High consistency, minimal training required | Still in validation phase [1] |
Quantitative Methodological Comparisons
Different FEC methodologies can yield significantly divergent results even when analyzing the same sample, creating challenges for data integration and comparison across studies. Research has demonstrated that the Triple Chamber McMaster method shows significantly different means and variances compared to the Modified McMaster method (P < 0.0001) [2]. When comparing various techniques, studies have reported increases in observed egg counts by 116.5% when comparing Mini-FLOTAC to McMaster, and by 223.3% when comparing Mini-FLOTAC to Wisconsin methods [2]. These discrepancies highlight the critical importance of methodological consistency and the potential for advanced automated systems to standardize FEC analyses across research and clinical settings.
Advanced Automated FEC Systems: Experimental Protocols and Workflows
AI-Powered Microscopy System Protocol
The automated microscopy system developed at Appalachian State University represents a transformative approach to FEC, leveraging artificial intelligence to overcome the limitations of traditional methods [1].
Materials and Equipment:
- Custom automated microscope platform
- AI-powered image processing software
- Standard fecal sample collection containers
- Sample preparation reagents
Experimental Procedure:
Sample Collection and Preparation:
- Collect fresh fecal samples (3-5 grams) directly from animal subjects
- Process samples within 48 hours of collection to ensure egg viability
- Standardize sample preparation protocol to ensure consistency
Automated Microscopy and Image Acquisition:
- Load prepared samples into the automated microscope system
- System performs rapid scanning of sample areas thousands of times larger than conventional microscopy
- Acquire high-contrast images without relying on dyes or expensive equipment
AI-Powered Egg Detection and Classification:
- Process acquired images through dedicated AI algorithms trained on diverse parasite egg datasets
- Automatically identify, count, and classify parasite eggs by species
- Generate quantitative fecal egg count results in eggs per gram (EPG)
Result Validation and Reporting:
Kubic FLOTAC Microscope (KFM) Workflow
The Kubic FLOTAC Microscope (KFM) represents another advanced automated system optimized for specific parasite detection challenges, particularly for discriminating between Fasciola hepatica and Calicophoron daubneyi eggs [4].
Materials and Equipment:
- KFM portable digital microscope
- FLOTAC/Mini-FLOTAC chambers and components
- Dedicated AI server for image analysis
- Web interface for microscope control
Experimental Procedure:
Sample Preparation:
- Utilize FLOTAC/Mini-FLOTAC techniques for sample processing
- Optimize flotation solutions for specific target parasites
- Ensure standardized sample weight and dilution factors
System Optimization:
- Implement additional processing steps to discriminate between similar-appearing parasite eggs
- Apply dedicated image processing steps to prevent false positives and incorrect egg counts
- Utilize robust detection models trained on both egg-spiked samples and naturally infected samples
Automated Detection and Analysis:
- Employ automated parasite egg detection powered by integrated battery system
- Use web interface for microscope control and monitoring
- Leverage dedicated AI server for image analysis and interpretation
Validation and Performance Assessment:
- Evaluate detection performance using samples with known egg counts
- Assess clinical utility through field samples with egg counts verified by optical microscopy
- Demonstrate satisfactory detection performance across different sample conditions
Experimental Workflow Visualization
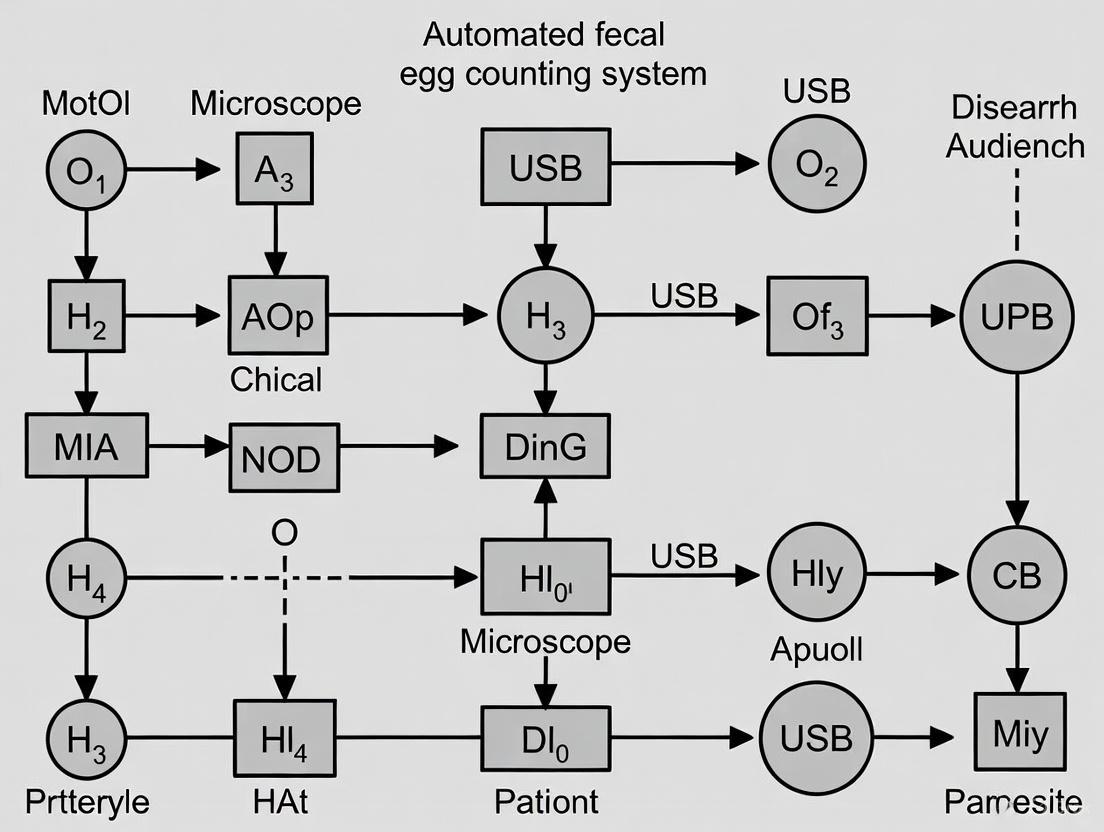
The following diagram illustrates the comprehensive workflow for automated fecal egg counting systems, integrating both the AI-powered microscopy and KFM approaches:
Diagram 1: Automated FEC System Workflow. This illustrates the integrated process from sample collection to data reporting in advanced fecal egg counting systems.
Research Reagent Solutions and Essential Materials
Successful implementation of advanced FEC methodologies requires specific reagents and materials optimized for automated detection systems. Table 2 details the essential research reagents and their functions within the experimental workflow.
Table 2: Essential Research Reagents for Advanced FEC Protocols
| Reagent/Material | Function | Application Notes |
|---|---|---|
| Sheather's Sugar Solution [5] | Flotation medium for parasite eggs | Specific gravity ≥1.2; optimal for most parasitic eggs [3] [5] |
| FLOTAC Chambers [4] | Standardized sample holding and examination | Compatible with Mini-FLOTAC techniques and KFM system [4] |
| Fecal Sample Containers | Sample collection and transport | Maintain sample integrity; 5g minimum recommended [5] |
| Digital Microscope System [1] [4] | Automated image acquisition | USB or portable design with AI integration capabilities |
| AI Detection Software [1] [4] | Automated egg identification and counting | Requires training on validated datasets for different parasite species |
Implementation Considerations and Technical Validation
System Performance and Validation Metrics
The transition from traditional to automated FEC systems requires rigorous validation against established benchmarks. The AI-powered microscopy system demonstrates a remarkable reduction in analysis time from 2-5 days to approximately 10 minutes while providing more consistent results than expert manual counting [1]. For the KFM system, validation studies have shown a mean absolute error of only 8 eggs per sample when compared to optical microscopy standards [4]. These systems must also address specific diagnostic challenges, such as discriminating between morphologically similar parasites like Fasciola hepatica and Calicophoron daubneyi, whose eggshells are difficult to distinguish with the human eye [4].
Integration with Existing Research Frameworks
Advanced FEC systems must interoperate with established research protocols, particularly the Fecal Egg Count Reduction Test (FECRT), which is crucial for evaluating anthelmintic efficacy [5]. The FECRT calculation formula remains essential:
EPG (Pre-Treatment) – EPG (10-14 days Post-Treatment) / EPG (Pre-Treatment) × 100 = % Egg Reduction [5]
A FECRT result of 90-95% indicates efficacious treatment, while results below 90% suggest emerging resistance [5]. Automated systems enhance this framework by providing more precise and reproducible EPG measurements at both time points, enabling more reliable assessment of anthelmintic resistance patterns.
Advanced fecal egg counting systems represent a paradigm shift in parasitological diagnosis, addressing critical limitations of conventional methods through automation, artificial intelligence, and standardized workflows. These technologies offer researchers and clinicians unprecedented capabilities for rapid, accurate, and reproducible parasite detection and quantification. The implementation of automated FEC systems promises to accelerate research in drug development, anthelmintic resistance monitoring, and host-parasite interactions, while simultaneously supporting clinical management of parasitic infections in both veterinary and human medicine. As these technologies continue to evolve and validate against gold-standard methodologies, they are poised to become indispensable tools in the biomedical research arsenal, ultimately contributing to improved health outcomes and reduced economic burdens associated with parasitic infections worldwide.
The transition from traditional optical microscopy to digital USB microscopy represents a paradigm shift in parasitology research, particularly for fecal egg count (FEC) procedures. Automated FEC systems leverage USB microscope technology to transform a traditionally manual, labor-intensive process into an efficient, high-throughput quantitative analysis. These systems utilize compact USB microscopes that connect directly to computers, capturing highly detailed images of parasite ova for automated enumeration through sophisticated image analysis software [6]. This technological evolution addresses critical needs in veterinary parasitology by enabling standardized, objective egg counting essential for anthelmintic resistance monitoring and targeted treatment strategies in livestock [7].
Comparative Analysis of FEC Methodologies
Quantitative Performance of FEC Methods
Table 1: Performance Characteristics of Fecal Egg Counting Methods
| Method Type | Specific Method | Multiplication Factor | Relative Egg Counting Efficiency | Automation Level |
|---|---|---|---|---|
| Manual | McMaster | 25x | Baseline (1x) | None |
| Manual | mini-FLOTAC | 5x | ~5x McMaster | None |
| Manual | Wisconsin | 1x | ~15x McMaster | None |
| Automated | Imagyst | N/A (unique preparation) | Similar to McMaster | Sample preparation only |
| Automated | Parasight AIO | 1x | ~15x McMaster | Full automation |
Data compiled from comparative studies of equine strongylid and ascarid egg counting [7]
The multiplication factor, defined as the reciprocal of the grams of feces examined, has traditionally been used to estimate method sensitivity. However, empirical evidence demonstrates that egg extraction efficiency varies significantly between methods beyond what multiplication factors alone would predict [7]. For instance, while the Wisconsin and Parasight AIO methods both have a 1x multiplication factor, they count approximately three times more eggs than mini-FLOTAC (5x multiplication factor), indicating their performance is more akin to a 1.6x multiplication factor relative to mini-FLOTAC [7]. This highlights the critical importance of sample preparation methodology in determining actual analytical sensitivity.
Technology Transition: Optical to Digital Microscopy
The evolution from conventional optical microscopy to digital USB microscopy has fundamentally transformed FEC procedures through three key technological advancements:
- Digital Imaging Capabilities: USB microscopes capture high-resolution images and videos of samples, enabling permanent digital records and re-analysis [6]
- Computer Integration: Direct connection to computers facilitates real-time viewing, image processing, and data management [8]
- Automated Analysis: Advanced software algorithms enable automated egg identification, counting, and classification [7]
Figure 1: Evolution from traditional optical to digital USB microscopy for FEC applications
Experimental Protocols for Automated FEC Using USB Microscopy
Sample Preparation Protocol
Principle: Optimal sample preparation is critical for accurate automated egg counting. The protocol must ensure sufficient egg recovery while minimizing debris that could interfere with image analysis.
Materials:
- Fresh fecal samples (collected within 24 hours, stored at 4°C)
- Sodium nitrate flotation medium (specific gravity 1.25-1.30 g/L)
- USB microscope with minimum 1080p resolution (e.g., Dino-Lite, Celestron, AmScope)
- Computer with image analysis software
- Sample preparation tools (centrifuge tubes, filters, mixing devices)
Procedure:
- Sample Homogenization: Thoroughly mix fecal sample to ensure even egg distribution
- Subsampling: Precisely weigh 4-6g of feces for analysis
- Flotation Medium Addition: Add feces to flotation medium at recommended ratio (typically 1:10 to 1:15 feces to medium)
- Suspension: Mix vigorously to ensure complete homogenization
- Filtration: Filter suspension through 150-200μm mesh to remove large debris
- Centrifugation: Centrifuge at 2000g for 1-2 minutes to concentrate eggs
- Flotation: Allow tubes to stand for 10-15 minutes to enhance egg flotation
- Sample Loading: Transfer prepared sample to microscope slide or specialized chamber
Quality Control: Include known positive and negative samples in each batch to validate preparation efficacy [7].
Automated Imaging and Analysis Protocol
Principle: USB microscopy enables standardized image acquisition and computer vision-based egg enumeration, eliminating human counting variability.
Materials:
- USB microscope with adjustable LED lighting
- Computer with compatible imaging software (e.g., Digital Viewer, GTK+ UVC Viewer)
- Specialized FEC analysis software (e.g., Parasight AIO system, Imagyst)
- Standardized sample chambers
Procedure:
- Microscope Setup: Connect USB microscope to computer and launch imaging software
- Lighting Optimization: Adjust built-in LED lights to ensure even illumination without glare
- Magnification Calibration: Set appropriate magnification (typically 100x) and calibrate using stage micrometer
- Image Capture: Systematically capture images from multiple fields to ensure representative sampling
- Automated Analysis: Process images through specialized algorithm for egg identification and counting
- Data Validation: Manually review a subset of images to verify algorithm accuracy
- EPG Calculation: Automatically calculate eggs per gram using formula: EPG = (Egg count × Multiplication factor) / Feces weight
Algorithm Validation: Studies demonstrate extremely high agreement between algorithm-generated counts and manual counts of the same images (Lin's concordance correlation R² = 0.996 for strongyles, R² = 0.999 for ascarids) [7].
Figure 2: Automated FEC workflow using USB microscopy
Research Reagent Solutions and Essential Materials
Table 2: Essential Research Materials for Automated FEC Systems
| Category | Specific Product/Type | Function/Application | Technical Specifications |
|---|---|---|---|
| Imaging Hardware | USB Digital Microscope | Digital image capture for analysis | 1080p resolution minimum, adjustable LED lighting, 100-400x magnification [6] |
| Flotation Media | Sodium Nitrate Solution | Egg flotation and separation | Specific gravity 1.25-1.30 g/L, optimized for parasite ova recovery [7] |
| Sample Preparation | Parasight AIO Preparation Tool | Standardized sample processing | Integrated filtration and dispensing system for consistent results [7] |
| Analysis Software | Digital Viewer Software | Image capture and basic measurements | Compatible with Windows, macOS, Linux; measurement tools included [8] |
| Automated Counting | Parasight AIO Algorithm | AI-based egg identification and counting | Deep-learning computer vision, validated against manual counts [7] |
| Sample Chambers | Mini-FLOTAC Chambers | Quantitative sample examination | Dual 1mL chambers enabling replicate counts from single preparation [7] |
Discussion and Future Perspectives
USB microscopy technology has fundamentally transformed fecal egg counting from a subjective manual procedure to an objective, automated process. The integration of digital imaging with advanced computer vision algorithms enables highly reproducible, quantitative results essential for anthelmintic resistance monitoring and treatment efficacy studies [7]. The recent WAAVP recommendations emphasizing the importance of counting sufficient eggs for statistical validity in FECRT further highlight the value of automated systems that can analyze larger sample volumes efficiently [7].
Future developments in USB microscopy for parasitology applications will likely focus on enhanced AI algorithms for multi-species egg differentiation, portable field-deployable systems for on-site analysis, and integration with laboratory information management systems for seamless data workflow. The continuous improvement in sensor technology and decreasing costs of USB microscopes will further democratize access to automated FEC technology, particularly in resource-limited settings [6] [9]. As these technologies mature, automated FEC systems using USB microscopy will become the gold standard for parasitology research and clinical diagnostics.
Automated fecal egg counting systems represent a transformative advancement in veterinary parasitology and public health. These systems integrate three core technological components: USB/digital microscopes for image acquisition, flotation techniques for sample preparation, and AI software for egg detection and classification. This integration addresses critical limitations of traditional manual microscopy, including low throughput, operator fatigue, and variable sensitivity, particularly for low-intensity infections [10]. By leveraging this technology stack, researchers and clinicians can achieve higher diagnostic accuracy and efficiency in monitoring parasitic infections such as soil-transmitted helminths (STHs) and trematodes in both human and animal populations [4] [10].
Core System Components and Performance
Digital Microscopy Platforms
Digital microscopes form the hardware foundation of automated fecal egg counting systems. Unlike conventional microscopes, these devices integrate optics with digital cameras and are often designed for portability and field use.
- Kubic FLOTAC Microscope (KFM): This portable digital microscope is specifically engineered for both laboratory and field applications. It combines the FLOTAC/Mini-FLOTAC sample preparation method with an AI-powered detection system. The device features an integrated battery, web interface for control, and a dedicated server for image analysis [4].
- Whole-Slide Scanners: For standard Kato-Katz thick smears, portable whole-slide scanners enable digitization of entire microscope slides. This facilitates remote diagnosis, quality assurance, and creates the digital image repository required for AI-based analysis [10].
Advanced Flotation Techniques
Flotation techniques are crucial for optimizing sample preparation by concentrating parasite eggs and reducing obscuring debris. The density of the flotation solution causes parasite eggs to float while heavier fecal particles sediment.
- FLOTAC/Mini-FLOTAC: These techniques provide high sensitivity, accuracy, and precision when combined with digital microscopy. The KFM system builds upon this validated sample preparation approach [4].
- Dissolved Air Flotation (DAF): This laboratory-validated technique uses microbubbles to enhance parasite recovery from fecal samples. Key parameters include:
- Surfactant Application: 7% hexadecyltrimethylammonium bromide (CTAB) achieved 73% slide positivity [11].
- Tube Volume: No significant difference in parasite recovery between 10ml and 50ml tubes [11].
- Processing: Integration with the Automated Diagnosis of Intestinal Parasites (DAPI) system demonstrated 94% sensitivity and substantial agreement (kappa = 0.80) with reference standards [11].
- Lab-on-a-Disk (LoD) Technologies: Systems like the Single Imaging Parasite Quantification (SIMPAQ) device implement two-dimensional flotation by combining centrifugation and flotation forces. This approach concentrates eggs in a monolayer within a specific imaging zone, enabling single-image quantification [12].
AI Software for Egg Detection and Classification
Artificial intelligence, particularly deep learning algorithms, automates the identification and quantification of parasite eggs from digital images.
- Detection Performance: AI systems demonstrate high sensitivity for major STH species. Expert-verified AI achieved 100% sensitivity for Ascaris lumbricoides, 93.8% for Trichuris trichiura, and 92.2% for hookworms in Kato-Katz thick smears [10].
- Discrimination Capability: Specialized AI models can distinguish between morphologically similar species, such as Fasciola hepatica and Calicophoron daubneyi, which are challenging to differentiate visually [4].
- Architecture Enhancements: The incorporation of additional deep learning algorithms specifically designed to detect disintegrated hookworm eggs significantly improves sensitivity for this fragile species [10].
Table 1: Comparative Performance of Diagnostic Methods for Soil-Transmitted Helminths
| Diagnostic Method | A. lumbricoides Sensitivity | T. trichiura Sensitivity | Hookworm Sensitivity | Overall Specificity |
|---|---|---|---|---|
| Manual Microscopy | 50.0% | 31.2% | 77.8% | >97% |
| Autonomous AI | 50.0% | 84.4% | 87.4% | >97% |
| Expert-Verified AI | 100% | 93.8% | 92.2% | >97% |
Table 2: Technical Specifications of Automated Fecal Egg Counting Systems
| System Component | Specific Technology | Key Parameters | Performance Metrics |
|---|---|---|---|
| Flotation Technique | DAF with CTAB surfactant | 5 bar pressure, 15 min saturation | 94% sensitivity, 73% slide positivity |
| Digital Microscope | Kubic FLOTAC Microscope | Portable, web interface, battery-powered | 8 egg mean absolute error in counts |
| AI Detection | Deep Learning Algorithms | Expert verification capability | 91-95% sensitivity vs. reference methods |
| Sample Processing | SIMPAQ Lab-on-a-Disk | Centrifugal flotation, monolayer imaging | 91-95% sensitivity, detects 30-100 EPG |
Integrated System Workflow
The synergy between hardware and software components creates a seamless pipeline from sample collection to diagnostic results. The workflow below illustrates how these components integrate in a typical automated fecal egg counting system:
Detailed Experimental Protocols
Protocol 1: Dissolved Air Flotation (DAF) with Automated AI Detection
This protocol, adapted from laboratory validation studies, optimizes parasite recovery for subsequent AI analysis [11].
Materials:
- DAF device (saturation chamber, air compressor, tube rack)
- 10ml or 50ml flotation tubes
- Surfactant: 7% CTAB (hexadecyltrimethylammonium bromide)
- TF-Test kit for sample collection
- Ethyl alcohol (100%)
- 15% Lugol's dye solution
- Microscope slides
Procedure:
- Sample Collection: Collect 300mg fecal samples in each of three TF-Test collection tubes on alternate days (total ~900mg).
- Filtration: Couple collection tubes to filters (400μm and 200μm mesh) and vortex for 10 seconds.
- Saturation Chamber Preparation: Fill with 500ml treated water and 2.5ml 7% CTAB surfactant. Pressurize to 5 bar for 15 minutes.
- Tube Transfer: Transfer 9ml filtered sample to flotation tube.
- Microbubble Injection: Insert depressurization cannula and inject 1ml (for 10ml tube) or 5ml (for 50ml tube) saturated solution.
- Flotation Wait: Allow 3 minutes for microbubble action.
- Supernatant Collection: Retrieve 0.5ml floated supernatant using Pasteur pipette.
- Slide Preparation:
- Mix supernatant with 0.5ml ethyl alcohol
- Transfer 20μl to microscope slide
- Add 40μl 15% Lugol's dye and 40μl saline solution
- AI Analysis: Process prepared slides through automated diagnosis system (e.g., DAPI).
Protocol 2: Kubic FLOTAC Microscope (KFM) Workflow
This protocol leverages the integrated KFM system for automated detection of trematode eggs [4].
Materials:
- Kubic FLOTAC Microscope device
- FLOTAC or Mini-FLOTAC kit
- Power source (battery or electrical)
- Computer/tablet with web interface
Procedure:
- Sample Preparation: Process fecal samples using standard FLOTAC or Mini-FLOTAC technique.
- Device Setup: Ensure KFM is charged and connected to AI server via web interface.
- Chamber Loading: Insert prepared FLOTAC chamber into KFM.
- Automated Imaging: Initiate automated scanning protocol through web interface.
- AI Detection: System automatically acquires images and processes through deep learning model.
- Results Review: Consult clinical report generated by system, which provides species identification and egg counts.
Protocol 3: AI-Assisted Kato-Katz Thick Smear Analysis
This protocol adapts conventional Kato-Katz methodology for digital AI analysis [10].
Materials:
- Portable whole-slide scanner
- Standard Kato-Katz materials (template, sieve, cellophane soaked in glycerol-malachite green)
- Computer with AI analysis software
Procedure:
- Smear Preparation: Prepare Kato-Katz thick smears according to WHO standards.
- Digitization: Scan slides using portable whole-slide scanner within 30-60 minutes of preparation (critical for hookworm integrity).
- AI Processing:
- Option A: Autonomous AI analysis without human intervention
- Option B: Expert-verified AI analysis with human confirmation of detected eggs
- Infensity Classification: Calculate eggs per gram (EPG) using standard conversion factors and classify as light, moderate, or heavy intensity.
The Scientist's Toolkit: Essential Research Reagents and Materials
Table 3: Key Research Reagent Solutions for Automated Fecal Egg Counting
| Reagent/Material | Function | Application Notes |
|---|---|---|
| CTAB (7%) | Surfactant for DAF protocol | Maximizes parasite recovery (73% slide positivity) [11] |
| Saturated NaCl solution | Flotation medium | Standard for FLOTAC and SIMPAQ systems [4] [12] |
| Ethyl alcohol | Sample preservation | Used in DAF protocol after supernatant collection [11] |
| 15% Lugol's solution | Staining | Enhances contrast for digital imaging [11] |
| Glycerol-malachite green | Kato-Katz clearing/staining | Standard for Kato-Katz thick smears [10] |
| PolyDADMAC polymer | Charge modification in DAF | Alternative to surfactants for parasite recovery [11] |
| TF-Test kit | Standardized sample collection | Provides 900mg total sample from alternate day collections [11] |
System Integration and Data Flow
The complete integration of these components creates an efficient diagnostic pipeline, with data flowing systematically from physical samples to actionable results, as shown in the data flow diagram below:
The integration of USB microscopes, advanced flotation techniques, and AI software represents a paradigm shift in parasitological diagnosis. These automated systems demonstrate superior sensitivity, particularly for light-intensity infections that constitute the majority of cases in contemporary settings [10]. The standardized protocols and reagent systems outlined herein provide researchers with robust methodologies for implementing these technologies in both laboratory and field environments. As these systems continue to evolve, they offer the potential to significantly enhance the monitoring and control of parasitic infections in human and animal populations worldwide.
Advantages of Portability and Field Deployment for On-Site Analysis
The shift towards portable diagnostic systems represents a significant advancement in the field of parasitology. Automated Fecal Egg Count (FEC) systems designed for field deployment directly address critical limitations of traditional, laboratory-bound methods, primarily by moving the diagnostic capability closer to where animals and their caretakers are located [13] [14]. This transition is driven by the growing need to combat anthelmintic resistance through more frequent and targeted testing, a practice historically hampered by the time, cost, and logistical challenges of sending samples to centralized labs [14] [7]. Portability enables pen-side decision making, allowing for the administration of correct, evidence-based treatments almost immediately after sample collection, thereby improving animal health outcomes and supporting more sustainable parasite control strategies [14].
Quantitative Advantages of Portable Systems
The benefits of portable automated FEC systems are demonstrated by quantifiable improvements in operational efficiency, diagnostic performance, and economic factors. The table below summarizes key comparative data from recent studies and market analyses.
Table 1: Performance and Economic Comparison of FEC Methods
| Metric | Traditional Laboratory FEC | Portable Automated Systems | Source / Context |
|---|---|---|---|
| Result Turnaround Time | Several days [14] | < 30 minutes [14] | Ovine strongyle FEC |
| Analysis Time per Sample | High (labor-intensive) [15] | ~5.5 minutes [14] | App-based ML system |
| Operational Autonomy | Requires mains electricity [15] | >150 tests on a single battery charge [14] | App-based system |
| Device Cost | High (benchtop systems) [13] | Compact, low-cost (~600 euros for KFM) [15] | Kubic FLOTAC Microscope |
| Detection Level (Sensitivity) | Manual microscopy: 2.81% [16] | KU-F40 analyzer: 8.74% [16] | Clinical human stool study (n>50,000 per group) |
| Agreement with Reference | N/A (Reference) | Substantial (CCC = 0.999 with OM) [15] | KFM vs. Optical Microscope (OM) for cattle GINs |
| Market Growth (Projected CAGR) | 9.2% (2025-2033) [17] | Global Automated FEC Analyzers Market | |
| Key Advantage | Established standardized protocols [18] | On-farm testing, rapid targeted treatment [14] |
Experimental Protocols for Field Deployment
To ensure reliable and consistent results when using portable FEC systems in the field, adherence to standardized protocols is paramount. The following section details specific methodologies for two distinct portable platforms.
Protocol 1: Analysis with the Kubic FLOTAC Microscope (KFM)
The KFM is a compact, portable digital microscope that integrates with the Mini-FLOTAC/FLOTAC sample preparation technique to provide a complete field-deployable solution [15] [4].
Sample Preparation (Mini-FLOTAC):
- Homogenization: Thoroughly mix the fecal sample to ensure a uniform distribution of parasitic elements.
- Suspension: Weigh a 2-gram subsample of feces and place it into the Mini-FLOTAC fill-er cup. Add 38 mL of an appropriate flotation solution (e.g., sodium nitrate with a specific gravity of 1.25-1.30 g/L) to create a 1:20 dilution [15]. Stir vigorously for at least 30 seconds to achieve a homogenous suspension.
- Filtration: Pour the suspension through a metal mesh filter into a second fill-er cup to remove large debris.
- Chamber Filling: Draw the filtered suspension into a syringe and carefully fill the two chambers of the Mini-FLOTAC apparatus, avoiding overflow and bubble formation.
- Flotation: Allow the apparatus to stand undisturbed for 10-15 minutes to enable parasite eggs to float to the top of the chambers [15].
On-Site Analysis with KFM:
- Device Setup: Power on the KFM. The device is equipped with a lithium battery offering up to 20 hours of autonomy, requiring no external power source [15].
- Sample Loading: Insert the prepared Mini-FLOTAC device into the dedicated slide-out tray of the KFM, similar to loading a DVD [15].
- Automated Scanning: Initiate the scanning sequence via the KFM's web interface. The internal motorized stage will automatically perform a three-dimensional (3D) scan of the two flotation chambers. The optical system, with an 8 MPixel camera and adjustable magnification (100x, 200x, 300x), captures digital images of the entire chamber volume [15].
- AI-Powered Detection: The captured images are transferred to an integrated artificial intelligence (AI) server. Deep learning algorithms, such as Convolutional Neural Networks (CNNs), analyze the images in real-time to automatically detect, identify, and count parasite eggs [13] [4].
- Result Reporting: The system generates a clinical report, including the fecal egg count (EPG), which can be reviewed on the device's interface or saved for records. The entire process from loading to result is completed in a few minutes [15] [13].
Protocol 2: Rapid On-Site System Using Smartphone and Machine Learning
This protocol outlines the use of a smartphone-based diagnostic system that leverages the device's built-in camera and cloud-based machine learning for rapid, on-farm analysis [14].
Sample Preparation and Recording:
- Homogenization and Splitting: Homogenize the fresh fecal sample and split it into a sub-sample.
- Suspension and Centrifugation: For the Parasight All-in-One (AIO) system, suspend 6 g of feces in 54 mL of flotation medium (density 1.18 g/L) using a specialized silicone bottle and plunger. After filtration, centrifuge the sample at 2000 g for 1 minute [7].
- Egg Separation: Insert a single-use egg separator tool into the centrifuge tube. This device filters out large debris while allowing floated eggs to pass through.
- Chamber Preparation: Pour the prepared sample into a dedicated egg chamber placed on the device. A vacuum suction pulls the sample through the mesh.
- Automated Staining and Imaging: The device automatically bleaches, stains, and washes the sample, then captures video footage using integrated imaging technology [7]. Alternatively, other systems may utilize the smartphone's camera directly to capture video of a prepared chamber [14].
Analysis and Reporting:
- Video Upload: The captured video footage is compressed and automatically uploaded to a cloud server via a smartphone app [14].
- Cloud-Based ML Analysis: Machine learning algorithms hosted on the cloud analyze the video frames to detect and count parasite eggs. Studies have shown extremely high agreement (Lin's concordance correlation R² = 0.996 for strongyles) between ML counts and manual counts of the same images [7].
- Result Delivery: A diagnostic report, including the egg count (EPG), is generated and sent back to the smartphone app, typically within minutes of sample recording. This enables immediate, evidence-based treatment decisions at the point of care [14].
Workflow Visualization of a Portable FEC System
The following diagram illustrates the integrated workflow of a portable automated FEC system, from sample collection to final reporting, highlighting the roles of both hardware and software.
Diagram: Integrated workflow for portable automated fecal egg counting, showing the transition from physical sample preparation to digital analysis and reporting.
The Scientist's Toolkit: Essential Research Reagents & Materials
Successful field deployment of automated FEC systems relies on a set of core components and reagents. The table below details these essential items and their functions within the experimental workflow.
Table 2: Key Research Reagent Solutions and Materials for Portable FEC
| Item | Function / Principle | Application Example |
|---|---|---|
| Flotation Solution (e.g., Sodium Nitrate, Zinc Sulfate) | Creates a medium with specific density (e.g., 1.18-1.30 g/L) higher than parasite eggs but lower than debris, causing eggs to float for collection [7]. | Standard for Mini-FLOTAC, FLOTAC, McMaster, and automated systems like Parasight AIO [15] [7]. |
| Fluorescent Chitin-Binding Protein | Binds to chitin in parasite eggshells. Used with a fluorescence-capable system to label eggs for easier automated detection, reducing background interference [19]. | Smartphone-based automated counting system [19]. |
| Mini-FLOTAC/FLOTAC Apparatus | Standardized chamber device that holds a specific volume of fecal suspension, allowing for controlled flotation and quantitative analysis [15]. | Sample preparation for the Kubic FLOTAC Microscope (KFM) [15] [4]. |
| Portable Digital Microscope (e.g., KFM) | Compact, battery-powered imaging device with motorized stage for automated scanning of sample chambers in field settings [15]. | Core component of the KFM system for autonomous image acquisition [15]. |
| Smartphone with Dedicated App | Acts as an image capture device, user interface, and data relay unit. Harnesses built-in computational power or cloud connectivity for analysis [14] [19]. | On-site system for video capture and result delivery [14]. |
| Portable Centrifuge | Battery-operated centrifuge for field-based sample preparation protocols that require centrifugation to enhance egg recovery [14] [7]. | Used in the Parasight AIO and lab-on-disk sample prep protocols [18] [7]. |
The integration of portability and automation in fecal egg counting systems delivers transformative advantages for parasitological research and veterinary practice. By enabling rapid, sensitive, and quantitative diagnostics directly in the field, these systems significantly shorten the timeline from sample collection to treatment decision, a critical factor in effective parasite management and the global effort to slow anthelmintic resistance [14] [7]. The continued advancement and validation of these technologies, particularly through the application of sophisticated AI, promise to further enhance their accessibility, accuracy, and overall impact on animal health and productivity worldwide [13] [17].
Building Your Workflow: A Step-by-Step Guide to Automated FEC System Setup and Operation
Selecting and Configuring Your USB Digital Microscope
For researchers developing automated fecal egg counting (FEC) systems, the selection and configuration of a USB digital microscope are critical foundational decisions. These microscopes serve as the primary data acquisition hardware in automated parasite diagnostics, directly influencing image quality, analysis accuracy, and system portability. The integration of sensitive, accurate, and standardized FEC techniques like Mini-FLOTAC with reliable automated imaging systems enables real-time observation and quantification of parasitic structures [15]. This technical note provides detailed application protocols for selecting, configuring, and validating USB digital microscopes specifically for automated FEC systems, with methodologies framed within contemporary veterinary parasitology research.
Technical Specifications for FEC Applications
Core Microscope Specifications
Selecting appropriate hardware requires matching technical specifications to the specific demands of parasite egg imaging. The following parameters are most critical for automated FEC systems:
Resolution and Sensor: A high-resolution sensor is essential for capturing detailed, sharp images of parasitic structures. Look for sensors with sufficient pixel count (e.g., 8 MPixel maximum resolution as in the Kubic FLOTAC microscope) to ensure clarity and precision in observations [15] [20]. Image quality and resolution are critical factors that directly impact the ability to distinguish between similar-looking parasite eggs, such as Fasciola hepatica and Calicophoron daubneyi [4].
Magnification Range: Determine the magnification range that suits your application requirements. Digital microscopes can provide a wider magnification range with zoom options compared to optical microscopes. For parasite egg identification, magnification capabilities of 100x, 200x, and 300x are typically sufficient, as demonstrated in the Kubic FLOTAC microscope which offers these adjustable magnifications [15].
Connectivity Options: Consider connectivity options available, such as USB or wireless capabilities, and compatibility with different operating systems. USB connectivity offers reliable, direct connection to computing systems for image analysis [21]. Some portable models may connect to smartphones or tablets via apps, though this may introduce slight lag compared to wired setups [21].
Portability and Power Supply: For field applications, portability and power autonomy are crucial. The Kubic FLOTAC microscope exemplifies an ideal field-capable solution with its compact dimensions (20 × 20 × 20 cm), integrated lithium battery, and autonomy of up to 20 hours, enabling use without external power sources [15].
Comparative Analysis of Digital Microscopy Systems
Table 1: Comparison of Digital Microscopy Systems for Parasitological Applications
| System | Key Features | Hosts Validated | Approx. Cost | Limitations |
|---|---|---|---|---|
| Kubic FLOTAC Microscope (KFM) | Portable, AI-enhanced, 100-300× magnification, 8MP sensor, 20h battery | Cattle, ruminants [15] [4] | ~600 euros [15] | Limited commercial availability |
| Parasight System | Fluorescent egg staining, smartphone image capture | Horses [15] [7] | Not specified | Validated only on horses [15] |
| VETSCAN IMAGYST | Digital slide scanner with machine learning software | Dogs, cats [15] [7] | High cost [15] | Not portable; high cost [15] |
| Telenostic System | Digital microscope with 10× lens, machine learning | Cattle [15] | Not specified | Long image acquisition/analysis time (~42 min) [15] |
| General USB Digital Microscopes | Varying resolutions, USB connectivity, manufacturer software | Requires validation | Varies widely | Requires method adaptation and validation |
Configuration and Setup Protocols
Hardware Setup and Connection
Proper hardware setup is fundamental to obtaining consistent, high-quality images for analysis:
Connection Method: Connect your microscope via USB to a computer or laptop. Many digital microscopes are plug-and-play, but some may require specific drivers or software. If the device isn't recognized, check the manufacturer's website for drivers or try different USB ports [21].
Stability Setup: Use a solid stand to prevent image shake. Choose microscopes with sturdy metal stands instead of lightweight plastic, and ensure the microscope is placed on a stable desk or table. For tasks requiring hands-free operation, ensure the stand provides adequate stability while maintaining appropriate working distance [21].
Working Distance Optimization: Adjust the working distance (the space between the lens and the specimen) according to your sample type. For larger objects, raise the stand to create more room; for tiny specimens, bring the lens closer. If your microscope has a very short working distance, use lower magnification to provide more space between the lens and sample [21].
Optical Configuration for Parasite Egg Imaging
Optimal optical configuration significantly enhances egg detection and identification:
Lighting Management: Adjust built-in LED lights to enhance contrast of parasite eggs. Increase brightness for darker samples and dim lights when viewing transparent specimens. Angle lights or use diffusers to reduce glare on reflective surfaces [21]. Proper lighting is particularly important for distinguishing eggs with similar morphology, such as Fasciola hepatica and Calicophoron daubneyi [4].
Focus Adjustment: Begin at low magnification to locate your subject, then gradually increase magnification once centered. Adjust both the focus knob and working distance for optimal results. A sharp image at moderate magnification is more valuable than a blurry image at high magnification [21].
Image Capture Settings: Configure software settings for consistent image capture. Set appropriate resolution (prioritizing clarity over extreme magnification), enable auto-exposure where appropriate, and establish consistent file naming conventions for efficient data management [21].
Calibration Protocol
For quantitative applications, proper calibration is essential:
Measurement Calibration: Use a calibration slide (typically included with professional microscopes) to calibrate measurement tools. Adjust the software's measurement tools to align with the slide markings and save the calibration profile for future sessions [21].
Performance Validation: Validate system performance using pre-characterized samples with known egg counts. Compare your automated counts with manual counts from experienced technicians to establish accuracy benchmarks [7].
Regular Recalibration: Establish a schedule for regular recalibration, particularly if the microscope is transported between locations or used extensively in field conditions.
Integration with FEC Methods and AI Analysis
Sample Preparation Methods
The selection of appropriate fecal egg counting methods significantly impacts detection efficiency:
Table 2: Comparison of Fecal Egg Count Methods for Automated Systems
| Method | Multiplication Factor | Relative Egg Recovery | Advantages | Compatibility with Digital Microscopy |
|---|---|---|---|---|
| Mini-FLOTAC | 5x [7] | Baseline | High accuracy, sensitivity, standardized [15] | Specifically designed for KFM, optimal compatibility [15] |
| McMaster | 25x [7] | ~5× less than mini-FLOTAC [7] | Widely available, familiar to technicians | Compatible but lower egg recovery [7] |
| Wisconsin | 1x [7] | ~3× more than mini-FLOTAC [7] | High egg recovery | Requires adaptation for automated systems |
| Parasight AIO | 1x (effective 1.6x relative to mini-FLOTAC) [7] | Similar to Wisconsin | Automated sample processing | Integrated system, limited external compatibility [7] |
Workflow for Automated FEC System
The following diagram illustrates the complete workflow for an automated fecal egg counting system integrating USB digital microscopy:
Automated FEC System Workflow
AI Integration and Data Management
The integration of artificial intelligence with digital microscopy represents a significant advancement in automated parasite diagnosis:
Deep Learning Implementation: Implement convolutional neural networks (CNNs) such as YOLO, ResNet, or Faster R-CNN for egg detection [13]. These models can learn optimal data representations for parasite egg identification, significantly reducing analysis time and operator dependency.
Dataset Requirements: Ensure sufficient training data variety by including images with varying egg concentrations, debris levels, and imaging conditions. The AI-KFM challenge dataset provides an example of real-world samples with diverse contamination levels [13].
Validation Protocols: Establish rigorous validation procedures comparing AI detection performance with manual counts by experienced technicians. Performance metrics should include mean absolute error relative to verified counts [4].
Data Management: Create dedicated folder structures for microscope images and associated metadata. Implement consistent naming conventions that link images to sample information, and establish regular backup procedures for research data [21].
Essential Research Reagents and Materials
Table 3: Essential Research Reagents for Automated FEC Systems
| Item | Function | Application Notes |
|---|---|---|
| Mini-FLOTAC/FLOTAC Apparatus | Standardized sample preparation | Provides sensitive, accurate, precise fecal egg count technique [15] |
| Flotation Solutions (e.g., Sodium Nitrate) | Parasite egg floatation | Specific gravity typically 1.25 g/L; separates parasitic elements from fecal debris [7] |
| Calibration Slides | Microscope measurement calibration | Essential for quantitative work; verify measurement accuracy regularly [21] |
| Reference Samples | System validation and quality control | Pre-characterized samples with known egg counts; verify system performance [7] |
| Data Management Software | Image storage, organization, and analysis | Enables efficient documentation, analysis, and sharing of research data [20] |
Performance Validation and Troubleshooting
System Validation Protocol
Establish a comprehensive validation protocol to ensure system reliability:
Accuracy Assessment: Compare automated counts with manual counts from experienced technicians across a range of egg concentrations (low, medium, high). Calculate concordance correlation coefficients; well-validated systems should approach 0.999 [15].
Precision Evaluation: Perform replicate measurements on identical samples to determine coefficient of variation. Assess both within-day and between-day precision.
Sensitivity Determination: Establish the limit of detection (LOD) and limit of quantification (LOQ) using serial dilutions of positive samples.
Species Specificity: Validate performance across target parasite species, particularly when distinguishing morphologically similar eggs such as Fasciola hepatica and Calicophoron daubneyi [4].
Troubleshooting Common Issues
Address common technical challenges in automated FEC systems:
Blurry Images: Ensure proper working distance, use stable stands, and verify focus mechanisms. Most blurriness issues stem from incorrect working distance, unstable stands, or poor lighting [21].
Inconsistent Egg Recovery: Standardize sample preparation protocols, particularly mixing and flotation times. Different methodologies use varied extraction techniques that significantly affect egg recovery beyond multiplication factors [7].
Algorithm Performance Issues: Expand training datasets with more diverse examples, including variations in egg concentration, debris levels, and imaging conditions. Implement additional image processing steps to reduce false positives [4].
Connectivity Problems: For USB connection issues, check cables and ports, install appropriate drivers, or update operating systems. Try different USB ports or cables if the device isn't recognized [21].
Proper selection, configuration, and validation of USB digital microscopes are fundamental to developing robust automated fecal egg counting systems. By integrating optimized hardware like the Kubic FLOTAC microscope with standardized FEC methods such as Mini-FLOTAC and advanced AI analysis, researchers can create powerful tools for parasite diagnosis that support both laboratory and field applications. The protocols outlined in this document provide a framework for implementing these technologies effectively, with emphasis on validation rigor and practical troubleshooting approaches. As AI technologies continue to advance, the integration of deep learning with digital microscopy will further enhance the accuracy, efficiency, and accessibility of automated parasite diagnostics in veterinary and public health contexts.
The accurate diagnosis of gastrointestinal parasite infections through fecal egg count (FEC) is a cornerstone of veterinary parasitology and human public health. The reliability of any diagnostic system, including emerging automated microscopy platforms, is fundamentally dependent on the initial steps of sample preparation. This application note details the standardized protocols for the FLOTAC and Mini-FLOTAC techniques, with a specific focus on the critical role of flotation solutions (FS). Framed within research on automated fecal egg counting systems, these protocols are designed to ensure that sample preparation provides a consistent, high-quality substrate for subsequent digital imaging and artificial intelligence (AI) analysis, thereby guaranteeing the accuracy and reproducibility of the final results.
Comparative Performance of Fecal Egg Count Methods
The selection of a coprological technique directly influences diagnostic sensitivity, precision, and the resulting egg per gram (EPG) counts, which in turn affects treatment decisions and the assessment of anthelmintic efficacy. The table below summarizes key performance metrics from recent comparative studies.
Table 1: Comparative analytical performance of FLOTAC, Mini-FLOTAC, and McMaster techniques across different host species.
| Host Species | Metric | Mini-FLOTAC | FLOTAC | McMaster | Citation |
|---|---|---|---|---|---|
| Camels | Sensitivity (Strongyles) | 68.6% | - | 48.8% | [22] |
| Mean Strongyle EPG | 537.4 | - | 330.1 | [22] | |
| Horses | Diagnostic Sensitivity | 93% | 89% | 85% | [23] |
| Precision | - | 72% | - | [23] | |
| Bison | Prevalence (Strongyles) | 81.4% (Correlation increased with McMaster replicates) | [24] | ||
| Schoolchildren | Helminth Sensitivity | 90% | - | 60% (FECM) | [25] |
| Sheep | Correlation with McMaster (r) | - | - | 0.93 (AI-based system) | [26] |
Detailed Experimental Protocols
The following sections provide step-by-step methodologies for the FLOTAC and Mini-FLOTAC techniques as validated in recent scientific literature.
The FLOTAC Protocol
The FLOTAC technique is a highly sensitive, quantitative method that involves a centrifugation step to facilitate egg flotation [27] [13]. The following protocol is adapted from studies on horses and cattle [23] [13].
- Homogenization and Dilution: Weigh 5 grams of freshly homogenized feces and place it into the Fill-FLOTAC device. Add 45 mL of tap water (dilution 1:10) and mix thoroughly until a uniform suspension is achieved [23].
- Filtration: Filter the fecal suspension through a 250 μm mesh sieve into a beaker to remove large debris [27].
- Centrifugation: Transfer the filtered suspension into test tubes and centrifuge at 1500 rpm (approx. 170 RCF) for 3 minutes [27] [23].
- Supernatant Removal: After centrifugation, carefully decant the supernatant, leaving the sediment pellet in the tube.
- Flotation: Re-suspend the pellet in 6 mL of an appropriate flotation solution (e.g., saturated sucrose solution with a specific gravity of 1.20) [23].
- Chamber Filling: Draw up the suspension with a pipette and transfer it into the two flotation chambers of the FLOTAC apparatus.
- Final Centrifugation: Place the apparatus in the centrifuge and spin at 1000 rpm (approx. 120 RCF) for 5 minutes. This step forces debris to sink and parasite elements to float to the top [27] [23].
- Reading: Rotate the reading disk of the FLOTAC apparatus to align the chambers with the microscope objective. Examine the entire grid under a light microscope at 100x and 400x magnification. The EPG is calculated by multiplying the total count by the dilution factor (e.g., factor of 1 for the described protocol) [23].
The Mini-FLOTAC Protocol
The Mini-FLOTAC method was developed to offer a simpler, centrifugation-free alternative to FLOTAC while maintaining high sensitivity, making it particularly suitable for field settings and integration with portable USB microscopes [25].
- Homogenization and Dilution: Weigh 2 grams of freshly homogenized feces and place it into the Fill-FLOTAC device. Directly add 38 mL of a chosen flotation solution (e.g., saturated sodium chloride, specific gravity 1.20), resulting in a total dilution of 1:20 [22] [28]. For a 1:10 dilution, mix 5 g of feces with 45 mL of FS [23].
- Filtration and Homogenization: Seal the Fill-FLOTAC device and shake it vigorously to homogenize the mixture. Filter the suspension through the device's built-in mesh [28].
- Chamber Filling: Without centrifugation, immediately draw the homogenized suspension into the two 1 mL chambers of the Mini-FLOTAC apparatus [23] [25].
- Flotation Time: Allow the apparatus to stand on a lab bench for 10 minutes to let the eggs float to the surface [23].
- Reading: Rotate the reading disk and examine the grids under a microscope. The EPG is calculated as: (Total egg count) x (Dilution Factor). The dilution factor is 5 for a 1:10 protocol [23] and 10 for a 1:20 protocol [28].
Workflow Diagram of Sample Preparation
The following diagram illustrates the logical workflow and key decision points for the standardized sample preparation protocols for FLOTAC and Mini-FLOTAC techniques.
The Scientist's Toolkit: Key Research Reagent Solutions
The choice of flotation solution (FS) is a critical parameter, as its specific gravity (SG) determines which parasite eggs will float. Different solutions are optimal for different parasite types.
Table 2: Common flotation solutions (FS) and their applications in FLOTAC and Mini-FLOTAC techniques.
| Flotation Solution | Chemical Composition | Specific Gravity (SG) | Recommended Application & Notes | Citation |
|---|---|---|---|---|
| FS1 | Sucrose + Formaldehyde | 1.20 | Recommended for nematodes (e.g., Trypanoxyuris spp. in howler monkeys). Very viscous. | [27] |
| FS2 | Saturated Sodium Chloride (NaCl) | 1.20 | General purpose, low-cost. Good for strongyle-type eggs and Hymenolepis nana. Widely used in field studies. | [22] [28] [25] |
| FS4 | Saturated Sodium Nitrate (NaNO₃) | 1.20 | Common in wild primate parasitology. | [27] |
| FS7 | Zinc Sulphate (ZnSO₄) | 1.35 | Superior for trematode eggs (e.g., Controrchis spp.) and protozoan cysts. Recommended for Ascaris lumbricoides. | [27] [28] [25] |
| FS6 | Magnesium Sulphate (MgSO₄) | 1.28 | An intermediate SG option. | [27] |
Application in Automated Fecal Egg Counting Systems
Standardized preparation via FLOTAC or Mini-FLOTAC is a critical pre-analytical step for modern automated fecal egg counting systems. These methods directly address several challenges in AI-based diagnostics:
- Standardized Input: They produce a clean, debris-reduced, and consistent sample presentation, which is crucial for training robust AI models and obtaining reliable counts from digital microscopes [13].
- Compatibility with Digital Microscopy: The Kubic FLOTAC Microscope (KFM) is a portable digital microscope explicitly designed to work with FLOTAC and Mini-FLOTAC chambers, demonstrating the direct integration of these preparation methods with automated imaging platforms [13].
- Validation of AI Systems: Comparative studies use FLOTAC and Mini-FLOTAC as reference standards to validate the performance of new AI-based counters. For instance, the OvaCyte AI system showed a strong correlation (r=0.93) with McMaster counts, while other research uses Mini-FLOTAC's superior sensitivity as a benchmark for developing new algorithms [13] [26].
- Workflow Efficiency: Automating the microscopy and counting phases with a USB microscope and AI can reduce analysis time from days to minutes. However, this efficiency is contingent on a sample preparation stage that ensures parasite eggs are adequately concentrated and free from obscuring debris, a requirement fulfilled by these standardized flotation techniques [1] [13].
Automated image acquisition represents a paradigm shift in parasitological diagnostics, transitioning from labor-intensive manual microscopy to high-throughput, objective, and data-rich digital analysis. Within the context of fecal egg counting (FEC) systems, automated imaging involves the systematic digital capture of microscope samples to facilitate rapid enumeration and classification of parasite eggs via computer vision and deep learning algorithms. This technology addresses critical limitations of traditional methods, such as operator fatigue, subjective bias, and low throughput, which have long constrained large-scale parasitological surveillance [29] [4]. Modern implementations, such as the Kubic FLOTAC Microscope (KFM), leverage integrated digital microscopy and specialized sample preparation to achieve high sensitivity and accuracy in both laboratory and field settings [4]. Similarly, the FECPAK platform utilizes a portable digital microscope that captures images of fecal samples and transmits them to a cloud platform for instant analysis by artificial intelligence (AI), delivering results within minutes [30]. The core principle uniting these systems is the replacement of the human eye with an automated digital acquisition workflow, enabling consistent, reproducible, and quantitative assessment of parasite burden for more effective livestock management and anthelmintic treatment strategies.
Experimental Protocols
Protocol 1: System Calibration and Quality Control
Purpose: To establish standardized imaging conditions and verify system performance prior to diagnostic sample acquisition. Consistent calibration ensures quantitative accuracy and reproducibility across imaging sessions and different operators.
Sample Preparation Verification:
- Prepare a standardized validation slide using a suspension containing a known quantity of synthetic or authentic parasite eggs in a flotation solution with a specific gravity of 1.20–1.25 [31].
- Load the sample into the designated chamber slide (e.g., McMaster slide, Mini-FLOTAC chamber, or system-specific sample carrier) [4] [31].
- Ensure the chamber is filled completely and without bubbles, as incomplete filling creates imaging artifacts and reduces the effective scanning area.
Initialization of Imaging Hardware:
- Power on the automated microscope (e.g., KFM, FECPAK Unit) and allow the light source (typically an LED for live-cell imaging due to low phototoxicity) to stabilize for the manufacturer-recommended duration [32] [30].
- Execute the system's built-in calibration routines. Advanced systems like the ZEISS Celldiscoverer 7 perform automatic calibration for optimal conditions, including finding and maintaining focus, and correcting for spherical aberrations [32]. While this reflects high-end laboratory practice, the principle of initial calibration is universal.
- If applicable, configure the environmental control system to maintain a stable operating temperature to prevent sample drift during acquisition.
Define Acquisition Parameters:
- Magnification: Set the objective lens to the standard magnification for the target parasite eggs (e.g., 100x total magnification is common for nematode eggs) [31].
- Spatial Resolution: Adjust the resolution to ensure sufficient detail for the AI model to distinguish between different egg species based on morphology [4].
- Illumination Intensity: Set the brightness and contrast levels to maximize feature detection without causing pixel saturation. Systems with real-time stabilization, like those using LED technology, ensure comparability between images [32].
- Focus Settings: Engage the automated focus system. Technologies like "Find Focus" automatically focus on the sample, while "Definite Focus" maintains the focal position over long periods, which is crucial for consistent image quality [32].
Quality Control and Validation:
- Acquire images from multiple predefined positions on the validation slide.
- Process the images through the integrated AI analysis software and verify that the egg count result matches the known quantity within an acceptable margin of error (e.g., mean absolute error of 8 eggs per sample, as demonstrated in KFM system evaluations) [4].
- Document all calibration parameters and results in a system log. Re-calibration is recommended periodically or whenever performance drifts outside established tolerances.
Protocol 2: Automated Image Acquisition for Fecal Egg Counting
Purpose: To execute a high-throughput, automated image acquisition workflow for quantitative fecal egg counting, from sample loading to the generation of a data set for AI analysis.
Sample Preparation and Loading:
- Fecal Suspension: Preprocess fecal samples according to a standardized method such as Mini-FLOTAC or McMaster's technique. A common protocol involves mixing 4 grams of feces with 56 mL of flotation solution (e.g., specific gravity 1.20 sodium nitrate) and straining to remove large debris [4] [31].
- Chamber Filling: Using a syringe or dropper, carefully transfer the strained fecal suspension into the imaging chamber. Avoid introducing air bubbles, as they obstruct the field of view and can be mistaken for particles by analysis algorithms [31].
- Sample Introduction: Place the filled chamber into the microscope's sample holder. Advanced automated systems may feature robotic loaders that handle multiple sample carriers (e.g., SBS multi-well plates) to maximize throughput without manual intervention [32].
Configuration of Scanning Parameters:
- Region of Interest (ROI) Definition: Use the software's live preview function to identify and define the scanning area. Systems like the ImageXpress Pico simplify this with tools that let users pan and adjust focus interactively [33]. The scanning area should be maximized to cover the entire chamber for comprehensive analysis.
- Focus Map Generation: For chambers with uneven topography, execute a procedure to create a focus map across multiple XY positions. This ensures all captured images remain in sharp focus. The ZEISS Celldiscoverer 7, for instance, can automatically create such maps for long-term experiments [32].
- Tile and Z-stack Settings: For high-resolution imaging of large areas, configure a tiling pattern to capture adjacent fields of view that will be stitched together into a montage. If acquiring 3D data, set the number of Z-slices and the step size between them. The ImageXpress Pico system includes z-stack acquisition to capture more detail than a single slice [33].
Execution of Automated Acquisition:
- Initiate the automated scanning sequence through the control software (e.g., FECPAK cloud platform, KFM web interface) [30] [4].
- The system will automatically move the stage to each predefined XY position, adjust focus as needed, and capture images. The robotic automation of this process removes tedium and human bias, as highlighted in the development of Appalachian State's AI microscope [29].
- Acquired images are automatically saved in a specified directory, often with metadata (e.g., timestamp, sample ID, position coordinates) embedded in the file for traceability.
Image Transfer and Analysis:
- Upon completion, the image set is automatically passed to the local or cloud-based AI analysis server. The FECPAK platform, for example, immediately submits images to its cloud for AI processing, with results returned via email within minutes [30].
- The AI software, trained on extensive datasets (e.g., over 120,000 FEC tests for FECPAK), performs egg detection and classification with high accuracy (>96%) [30]. For specific challenges like distinguishing between Fasciola hepatica and Calicophoron daubneyi, dedicated image processing steps and robust deep learning models are used to prevent false positives [4].
Data Presentation
Table 1: Performance Metrics of Automated Fecal Egg Counting Systems
| System / Feature | Detection Accuracy | Throughput | Key Technology | Validation Sample Size |
|---|---|---|---|---|
| FECPAK AI [30] | >96% | Results in minutes; 24/7 operation | Proprietary AI model, cloud analysis | 22,000 validation samples |
| Kubic FLOTAC (KFM) [4] | Mean Absolute Error: 8 eggs/sample | Automated for lab and field | Dedicated deep learning workflow, FLOTAC preparation | Egg-spiked and naturally infected samples |
| Appalachian State AI Microscope [29] | Aims to increase accuracy vs. manual | Automates tedious counting process | AI-driven robotic microscopy | In development (TRL 3-5) |
Table 2: Comparative Analysis of Imaging Modalities for Automated Acquisition
| Imaging Parameter | Widefield Fluorescence [32] | Digital Confocal [33] | Brightfield / Colorimetric [33] |
|---|---|---|---|
| Best Application | Live cell imaging, multi-fluorescence assays | Generating sharper images, 3D data | Standard fecal egg counting, low-cost operation |
| Speed | Up to 9x faster widefield [32] | Slower due to optical sectioning | Fastest for 2D snapshot imaging |
| Resolution | High with aberration correction [32] | Superior with on-the-fly deconvolution [33] | Standard, sufficient for egg morphology |
| Cost & Complexity | High | Highest | Low (desktop systems available [33]) |
Workflow Visualization
Automated Fecal Egg Counting Workflow
Tile Scanning for Large Area Analysis
The Scientist's Toolkit
Table 3: Essential Research Reagent Solutions and Materials
| Item | Function / Purpose | Example / Specification |
|---|---|---|
| Flotation Solution | Suspends parasite eggs by specific gravity, separating them from debris. | Saturated Sodium Nitrate (SPG 1.20), Sheather’s Sugar Solution (SPG 1.25) [31]. |
| Imaging Chamber | Holds a standardized volume of fecal suspension for quantitative analysis. | McMaster Slide, Mini-FLOTAC Chamber, or system-specific carrier [4] [31]. |
| Straining Apparatus | Removes large particulate matter from the fecal suspension to prevent imaging artifacts. | Tea strainer or gauze [31]. |
| Digital Microscope | The core hardware for automated image acquisition. | Kubic FLOTAC Microscope (KFM), FECPAK Unit with Micro-I series, or automated cell imagers [30] [33] [4]. |
| AI Analysis Software | Provides the computational engine for automated egg detection, classification, and counting. | Proprietary AI models (e.g., FECPAK AI, KFM's deep learning model) [30] [4]. |
Integrating AI and Machine Learning for Egg Detection and Classification
The integration of artificial intelligence (AI) and machine learning (ML) with digital microscopy represents a transformative advancement for parasitological diagnosis. Automated fecal egg counting (FEC) systems address critical limitations of traditional manual methods, which are time-consuming, require highly trained personnel, and are prone to human error [13]. This document outlines application notes and protocols for a robust, AI-driven FEC system, contextualized within research for an automated platform using a USB microscope. The core of this system is the Kubic FLOTAC Microscope (KFM), a compact, portable digital microscope designed to analyze fecal specimens prepared with FLOTAC or Mini-FLOTAC techniques in both field and laboratory settings [15] [4]. By combining a standardized, sensitive sample preparation method with a deep learning-based detection workflow, this system enables accurate, high-throughput, and automated parasite egg detection and classification.
The automated FEC system is built upon several integrated hardware and software components.
The Kubic FLOTAC Microscope (KFM)
The KFM is a cornerstone technology, functioning as a portable, automated digital microscope. Its key specifications are summarized in the table below.
Table 1: Specifications of the Kubic FLOTAC Microscope (KFM) [15] [4]
| Parameter | Specification |
|---|---|
| Dimensions | 20 × 20 × 20 cm (compact, cubic shape) |
| Cost | ~600 euros (low-cost) |
| Portability | Portable, with a lithium battery offering up to 20 hours of autonomy |
| Optical System | Digital camera with adjustable magnification (100x, 200x, 300x) |
| Maximum Resolution | 8 MPixel (3264 × 2448 pixel) |
| Scanning System | Electromechanical XYZ motorized stage for 3D scanning of flotation chambers |
| Software Control | Web interface for remote control and an integrated AI server for image analysis |
The Scientist's Toolkit: Essential Research Reagents and Materials
A successful experiment requires specific materials and reagents for sample preparation, imaging, and analysis.
Table 2: Essential Research Reagents and Solutions for Automated FEC
| Item | Function/Description |
|---|---|
| Kubic FLOTAC Microscope (KFM) | The core imaging device for automated, high-throughput slide scanning [15]. |
| FLOTAC / Mini-FLOTAC Apparatus | A sensitive, accurate, and precise FEC technique used for standardizing sample preparation and egg flotation [15] [13]. |
| Flotation Solutions | Specific salt or sugar solutions (e.g., sodium nitrate, zinc sulfate) to facilitate the flotation of parasite eggs for detection [15]. |
| Fecal Sample Collection Kits | For standardized collection and transport of fecal samples from the field to the lab. |
| AI Detection Model | A pre-trained deep learning model (e.g., YOLO, Faster R-CNN) for the localization and classification of parasite eggs in digital images [4] [13]. |
| Annotated Image Dataset | A curated dataset of digital images from the KFM, with bounding boxes labeling different parasite egg species, used for training and validating AI models [13]. |
Experimental Protocols
This section provides a detailed, step-by-step methodology for implementing the automated FEC system.
Protocol 1: Sample Preparation and Imaging with the KFM
Objective: To prepare fecal samples for analysis and acquire digital images using the Kubic FLOTAC Microscope.
- Sample Collection: Collect fresh fecal samples from the target host (e.g., cattle, sheep). If not processed immediately, store samples at 4°C for a maximum of 48 hours.
- Homogenization: Thoroughly homogenize the fecal sample to ensure a representative sub-sample is taken.
- FLOTAC/Mini-FLOTAC Preparation: a. Weigh a specific amount of feces (e.g., 2g for Mini-FLOTAC). b. Place the feces into the device's chamber and add the appropriate flotation solution to a defined volume. c. Stir vigorously to create a homogeneous suspension. d. Allow the mixture to stand for a short period to let the eggs float to the surface. e. Attach the reading disc(s) to the device, which will contain the purified sample for imaging [15].
- Loading the KFM: Insert the prepared Mini-FLOTAC/FLOTAC device into the specific slide-out tray of the KFM, similar to inserting a DVD into a player [15].
- Automated Scanning: Initiate the scanning process via the KFM's web interface. The device will automatically: a. Locate 3D landmarks corresponding to the corners of the flotation chambers. b. Use its motorized stage to perform a systematic, stepwise scan of the entire chamber. c. Capture digital images at various focal planes and positions across the chamber [15].
- Image Export: The captured images are saved and made available for the subsequent AI analysis step.
Protocol 2: AI Model Workflow for Egg Detection and Classification
Objective: To deploy a deep learning model for the automatic detection and classification of parasite eggs from KFM-acquired images.
- Image Pre-processing: Apply standard pre-processing techniques to the raw images from the KFM. This may include normalization, contrast enhancement, and noise reduction to improve model performance.
- Egg Detection: Pass the pre-processed images through a pre-trained object detection model. Convolutional Neural Networks (CNNs) such as YOLO (You Only Look Once) or Faster R-CNN have been successfully used for this task [13]. The model will output bounding box coordinates for each detected egg-like object.
- Classification (Optional): For systems designed to differentiate between parasite species, a classification step is added. The model can be trained to classify each detected egg into specific categories (e.g., Fasciola hepatica vs. Calicophoron daubneyi) based on learned visual features [4].
- Post-processing: Apply rule-based filters to reduce false positives. For instance, the system can use known morphological constraints (e.g., egg size) to discard implausible detections [4].
- Quantification and Reporting: The final output is a clinical report that includes the fecal egg count (FEC), often expressed as eggs per gram (EPG) of feces, and, if applicable, the species composition of the detected eggs.
The complete workflow, from sample to result, is visualized in the following diagram.
Performance Metrics and Validation
Rigorous validation is essential to ensure the reliability of the automated system. The following table summarizes key quantitative performance data from relevant studies.
Table 3: Performance Metrics of AI-Based FEC Systems
| System / Study | Target Parasites | Key Performance Metric | Result / Value |
|---|---|---|---|
| KFM with AI [4] | F. hepatica and C. daubneyi | Mean Absolute Error (MAE) of FEC | ~8 eggs per sample |
| KFM with AI [13] | Gastrointestinal Nematodes (GINs) in cattle | Detection Accuracy (vs. traditional OM) | High level of agreement (Substantial concordance) |
| AI-KFM Challenge [13] | Gastrointestinal Nematodes (GINs) in cattle | Standardized Benchmark | Dataset and scores provided for community benchmarking |
| Traditional OM with DNA [34] | Gastrointestinal Nematodes | False Negative Diagnosis (Genus vs. Species-level ID) | 25% reduction with species-level identification |
The relationship between sample size and the reliability of species-specific efficacy estimates, as enabled by advanced diagnostics, is another critical metric.
Application in Anthelmintic Resistance Detection
A primary application of a precise, automated FEC system is the Faecal Egg Count Reduction Test (FECRT), the standard method for detecting anthelmintic resistance. Accurate species-level identification is crucial, as genus-level identification can lead to a 25% false negative rate in diagnosing resistance [34]. The integration of AI-based FEC with molecular techniques like nemabiome metabarcoding or deep amplicon sequencing for the β-tubulin gene provides the most accurate and comprehensive picture of resistance profiles in a parasite population [34] [35]. The synergistic relationship between these technologies is outlined below.
Quantitative Comparison of Fecal Egg Count Methodologies
The selection of an appropriate fecal egg count (FEC) method is critical for research and diagnostic accuracy. The table below summarizes the key performance characteristics of contemporary manual and automated techniques.
Table 1: Performance Characteristics of Fecal Egg Count (FEC) Methods
| Method | Type | Multiplication Factor | Relative Egg Count (Strongyles) | Key Features & Applications |
|---|---|---|---|---|
| Wisconsin [7] | Manual | 1x | Benchmark (Highest) | Considered the gold standard for sensitivity; used as a benchmark in comparative studies. |
| Parasight AIO [7] | Automated | ~1.6x (Effective) | ~3x higher than Mini-FLOTAC | Second-generation system with integrated staining, imaging, and AI-based analysis. |
| Mini-FLOTAC [7] | Manual | 5x | 5x higher than McMaster | Highly accurate and precise; suitable for both field and lab settings [15]. |
| Imagyst [7] | Automated | N/A (Unique prep) | Similar to McMaster | Unique sample preparation; can be coupled with deep learning for automated counting. |
| McMaster [7] | Manual | 25x | Baseline | Widely used; provides a good balance of speed and accuracy [36]. |
| Kubic FLOTAC (KFM) [15] | Automated | 5x (Inherited from method) | Substantial agreement with OM | Portable, digital microscope with AI-based automated egg detection [15] [4]. |
Detailed Experimental Protocols
Protocol: Kubic FLOTAC Microscope (KFM) with Deep Learning Analysis
The KFM system integrates standardized sample preparation with automated digital imaging and analysis [15] [4].
Sample Preparation and Loading
- Weigh and Homogenize: Weigh the required mass of feces and homogenize it with the appropriate flotation solution (e.g., sodium nitrate with specific gravity of 1.25 g/L) as per the Mini-FLOTAC protocol [15].
- Fill Chambers: Transfer the suspension into the two chambers of the Mini-FLOTAC device.
- Flotation Period: Allow the device to stand for a recommended flotation time (e.g., 10 minutes) to allow parasitic elements to rise to the surface.
- Load into KFM: Insert the prepared Mini-FLOTAC device into the slide-out tray of the KFM, similar to inserting a DVD into a player [15].
Automated Imaging and Analysis
- Automated Scanning: Initiate the scan via the KFM's web interface. The internal motorized stage automatically performs a three-dimensional (3D) scan of the entire volume of the two flotation chambers [15].
- Image Acquisition: The built-in digital camera captures images at a predefined magnification (e.g., 100x, 200x, 300x) and resolution (up to 8 MPixel) [15].
- AI-Based Detection: The captured images are processed by a dedicated deep learning server. The AI model, trained on a dataset of confirmed parasite eggs, automatically identifies and counts the target parasitic structures (e.g., Fasciola hepatica and Calicophoron daubneyi eggs) [4].
- Data Output: The system generates a clinical report that includes the raw egg count. This count is used for the final EPG calculation [4].
Protocol: Manual Count Verification (McMaster Method)
Manual methods remain important for validation and in laboratories without automated systems [7].
- Prepare Sample: Mix a measured mass of feces (e.g., 2 grams) with a specific volume of flotation solution (e.g., 28 mL) to create a suspension [36].
- Load Chamber: Transfer the suspension to a McMaster counting chamber and allow to stand for a few minutes.
- Microscopic Examination: Place the chamber under a traditional optical microscope.
- Manual Counting: Count the number of eggs within the engraved grid lines of both chambers, ignoring eggs outside the squares [36].
- Calculate EPG: Add the counts from both chambers and multiply by the multiplication factor (typically 50 for a 2g/30mL preparation). The formula is: EPG = (Count Chamber 1 + Count Chamber 2) × 50 [36].
System Workflow and Data Processing
The following diagram illustrates the complete workflow of an automated fecal egg counting system, from sample preparation to final EPG result.
The Scientist's Toolkit: Essential Research Reagents & Materials
Successful implementation of automated fecal egg counting requires specific materials and reagents. The following table details the key components of the research toolkit.
Table 2: Essential Research Reagents and Materials for Automated FEC
| Item | Function/Description | Example Application |
|---|---|---|
| Kubic FLOTAC Microscope (KFM) | A portable, digital microscope for automated scanning of Mini-FLOTAC chambers. Enables remote control and AI-driven analysis [15]. | The core hardware for automated image acquisition in both field and laboratory settings [15]. |
| Mini-FLOTAC / FLOTAC Device | A sample preparation device with calibrated chambers that allows for precise, standardized fecal examination and quantitative counts [15]. | Used in conjunction with the KFM for sensitive and accurate sample preparation prior to scanning [4]. |
| Flotation Solution (e.g., Sodium Nitrate) | A solution with high specific gravity (e.g., 1.25 g/L) that facilitates the flotation of parasite eggs to the surface for easier visualization and counting [7]. | Essential for separating parasite eggs from the fecal debris during the sample preparation step for most FEC methods [7]. |
| Deep Learning Model (AI) | A trained neural network for automatic detection and classification of parasite eggs in digital images. Reduces human error and time for analysis [15] [4]. | Used by the KFM and systems like Imagyst to automatically identify and count eggs from acquired images [4] [7]. |
| Image Analysis Software (e.g., ImageJ) | A software platform for digital image processing, measurement, and analysis. Can be used for developing or validating custom counting algorithms [37]. | Useful for researcher-led analysis, such as estimating egg occupancy rates or validating the output of automated systems [37]. |
Maximizing Performance: Troubleshooting Common Issues and Optimizing Your Automated FEC System
Table of Contents
- Introduction
- Technical Specifications of Digital Microscopes for FEC
- Protocol: System Calibration for Optimal Image Acquisition
- Protocol: Validation of Automated Counting Against Manual Methods
- Workflow: Automated Fecal Egg Counting System
- Research Reagent Solutions
Automated fecal egg counting (FEC) systems using USB microscopes represent a significant advancement in veterinary parasitology, offering the potential to standardize diagnostics and reduce human error. However, the accuracy of these systems is fundamentally dependent on the quality of the input images. Blurriness, poor resolution, and uneven illumination can severely compromise the performance of automated image analysis and deep learning algorithms. These application notes provide detailed protocols to address these critical image quality issues within the context of a research framework for developing a robust, automated FEC system.
Technical Specifications of Digital Microscopes for FEC
Selecting appropriate hardware is the first step in mitigating image quality issues. The table below summarizes key specifications of relevant digital microscopes, from consumer-grade USB models to specialized research equipment like the Kubic FLOTAC Microscope (KFM).
| Microscope Model | Type | Magnification | Resolution | Illumination | Key Features for FEC |
|---|---|---|---|---|---|
| Kubic FLOTAC (KFM) [15] | Dedicated Digital | 100x, 200x, 300x | 8 MP | LED with condenser | Portable, battery-powered, automated XYZ scanning, designed for Mini-FLOTAC chambers. |
| Celestron MicroCapture Pro [38] | USB Compound | 20x – 200x | 5 MP | LED | Includes measurement software, suitable for initial protocol development. |
| Kooltek MM-840 [38] | USB Handheld | 75x / 300x | 1.6 MP (Image) | LED | Low-cost option for feasibility studies; requires stable mounting. |
| Dino-Lite AM-4013MT [38] | USB Compound | 4x – 200x | 5 MP | LED | Full-color LCD screen, standalone capability. |
Protocol: System Calibration for Optimal Image Acquisition
This protocol ensures consistent, high-quality image capture by addressing focus, resolution, and illumination.
1.0 Equipment
- USB Digital Microscope (e.g., models listed above)
- Computer with image acquisition software
- Standardized calibration slide (e.g., a stage micrometer with etched lines)
- A blank, clean Mini-FLOTAC chamber or glass slide [15]
- Lens cleaning supplies
2.0 Procedure 2.1 Mitigating Blurriness and Poor Resolution 1. Secure the Setup: Place the microscope on a vibration-damping table. If using a handheld USB model, secure it using the provided flex neck stand or a dedicated mount [38]. 2. Clean Optics: Use a blower and lens tissue to clean the microscope's objective lens and the chamber's viewing surface. 3. Achieve Critical Focus: * Place the calibration slide on the stage. * Open the image feed on the computer. Adjust the microscope's focus until the etched lines are sharp and clear. * For automated systems, note the optimal focal distance and ensure the motorized stage (if present) is calibrated to this position [15].
2.2 Correcting Uneven Illumination
1. Acquire a Background Image: Place a blank, empty Mini-FLOTAC chamber filled only with flotation medium on the stage. Capture an image using the same settings intended for sample analysis [39].
2. Analyze and Model Illumination: Use image analysis software (e.g., BaSiC tool in ImageJ) to model the background illumination pattern. This "flat-field" image characterizes the light source's inconsistencies [39].
3. Apply Flat-Field Correction: For all subsequent sample images, apply the following correction during pre-processing:
* Corrected_Image = (Raw_Sample_Image / Flat_Field_Image) * mean(Flat_Field_Image)
* This step divides out the uneven illumination, resulting in a sample image with a uniform background [39].
3.0 Quality Control
- The calibrated system should resolve the lines on the stage micrometer without chromatic aberrations.
- After flat-field correction, an image of a blank chamber should show a uniform gray value across the entire field of view with a standard deviation of less than 5% of the mean pixel intensity.
Protocol: Validation of Automated Counting Against Manual Methods
This protocol validates the performance of the automated system, ensuring that image quality is sufficient for accurate egg detection and counting.
1.0 Equipment and Reagents
- Calibrated USB microscope system
- Fecal samples (experimentally infected or naturally sourced)
- Mini-FLOTAC or FLOTAC apparatus [15] [7]
- Flotation medium (e.g., sodium nitrate, specific gravity 1.25-1.30) [7]
- Traditional optical microscope for manual counting [7]
2.0 Sample Preparation and Imaging 1. Prepare fecal samples using the Mini-FLOTAC technique according to established protocols [15] [7]. 2. Insert the prepared chamber into the calibrated USB microscope system. 3. Acquire images using the standardized and corrected imaging protocol established above.
3.0 Data Analysis and Comparison 1. Automated Count: Process the acquired images through the deep learning-based egg detection algorithm (e.g., a convolutional neural network) [4]. 2. Manual Reference Count: An experienced analyst counts the eggs in the same chamber using a traditional optical microscope, following a "count at leisure" approach to maximize accuracy [40]. 3. Statistical Validation: Compare the results. A robust system should show a near-perfect agreement with manual counts. For example, in a validation study for the KFM, the concordance correlation coefficient was 0.999 when compared to traditional microscopy [15]. The mean absolute error for a system detecting Fasciola hepatica and Calicophoron daubneyi eggs should be low (e.g., ~8 eggs per sample) [4].
Workflow: Automated Fecal Egg Counting System
The following diagram illustrates the complete workflow, integrating sample preparation, image acquisition, quality control, and analysis.
Research Reagent Solutions
Essential materials and their functions for establishing an automated FEC system.
| Item | Function | Application Note |
|---|---|---|
| Mini-FLOTAC Apparatus [15] [7] | Standardized sample preparation and quantitative parasite egg flotation. | Provides a consistent chamber depth and volume for imaging, critical for automating the process. |
| Flotation Medium (e.g., Sodium Nitrate) [7] | Suspends parasite eggs based on specific gravity, separating them from fecal debris. | A specific gravity of 1.25-1.30 is commonly used for gastrointestinal nematode eggs. Quality affects image clarity [7]. |
| Kubic FLOTAC Microscope (KFM) [15] [4] | Integrated digital microscope with motorized stage for automated scanning of Mini-FLOTAC chambers. | Key for high-throughput studies; combines validated preparation with automated, AI-powered image analysis. |
| Flat-Field Correction Software [39] | Algorithmic correction for uneven illumination in whole-slide images. | A critical pre-processing step for deep learning models to ensure consistent feature extraction and improve generalization. |
| Deep Learning Model (e.g., CNN) [4] | Automated detection and classification of parasite eggs from digital images. | Model performance is directly dependent on the quality, quantity, and diversity of the training image dataset. |
Addressing Connectivity and Software Integration Challenges
The integration of USB digital microscopes into automated fecal egg counting (FEC) systems represents a significant advancement in parasitological diagnostics for veterinary medicine and public health. These systems offer the potential for portable, cost-effective, and quantitative assessment of parasite burden [15]. However, the practical implementation of such systems is contingent upon overcoming significant challenges in hardware connectivity and software integration. This document details the specific challenges encountered and provides validated protocols for establishing a robust, automated FEC system using USB microscope technology, framed within the broader context of developing a reliable diagnostic tool for researchers and drug development professionals.
Core Challenges in System Integration
The transition from a traditional optical microscope to a digital USB-based system introduces several technical hurdles that must be addressed to ensure data integrity and operational reliability.
Hardware Connectivity and Data Transfer
2.1.1. USB Protocol Incompatibility: A primary challenge lies in the type of USB connection. Systems relying on USB 2.0 transmit a compressed video signal, which results in a significant loss of image detail and resolution, directly impacting the accuracy of egg identification and counting [41]. This compression is a critical bottleneck for a diagnostic system reliant on image clarity.
2.1.2. Frame Rate Limitations: A low frame rate (e.g., 30 frames per second) creates a choppy, delayed live image display [41]. This not only hampers the user experience but also complicates the initial positioning and focusing on samples, increasing the time required for analysis.
2.1.3. Power and Portability Trade-offs: While the compact nature of USB microscopes is a key benefit, their dependency on a computer for power and operation can limit deployment flexibility in field settings [15] [41]. Although battery packs can mitigate this, they add another layer of complexity to the system.
Software and Analytical Integration
2.2.1. Image Processing and AI Analysis: The core of an automated system is its software. The development of robust artificial intelligence (AI) software for the recognition of helminth eggs is ongoing and is critical for full automation [15]. These algorithms must be trained on large, well-annotated datasets to achieve high sensitivity and specificity across different parasite species and sample qualities.
2.2.2. Interoperability and Data Management: Modern microscopy software must integrate seamlessly with other systems. The use of standards like OME-TIFF for data sharing and Application Programming Interfaces (APIs) for connecting with Laboratory Information Management Systems (LIMS) is essential for creating a streamlined workflow [42]. Challenges such as software instability, hardware incompatibility, and ensuring data security, especially when using cloud solutions, are significant concerns that can disrupt research and diagnostics [42].
Quantitative Analysis of USB Microscope Performance
The following tables summarize key performance characteristics and comparison data relevant to integrating USB microscopes into an automated FEC system.
Table 1: Technical Specifications and Performance Impact of USB Microscopes
| Technical Characteristic | Specification/Range | Impact on FEC System Performance |
|---|---|---|
| Resolution | 1.3 MP to 8 MP [15] [43] | Higher resolution (e.g., 8 MP) is crucial for distinguishing subtle morphological features of different parasite eggs. |
| Frame Rate | 30 fps (Low) to 60 fps (High) [41] | A higher frame rate (≥60 fps) provides a smooth, real-time image for efficient sample navigation and focusing. |
| USB Standard | USB 2.0 vs. USB 3.0 [41] | USB 3.0 is critical as it provides a non-compressed data stream, preserving original image quality for accurate analysis. |
| Cost | <$1,000 (General) [43]; ~€600 (Kubic FLOTAC) [15] | Low cost enables wider deployment but may come with trade-offs in image quality and build quality compared to high-end systems. |
| Portability | Highly portable, some with 20-hour battery [15] | Enables use in field settings and resource-limited environments, a key advantage over traditional lab microscopes. |
Table 2: Comparison of Digital Parasite Egg Counting Systems
| System Name | Core Principle | Key Advantages | Key Limitations / Challenges |
|---|---|---|---|
| Kubic FLOTAC (KFM) | Digital microscope for FLOTAC chambers [15] | Portable, low-cost, standardized; AI software under development. | Relies on successful software development and integration for full automation. |
| FECPAKG2 | Technological system for on-field processing [15] | Automated detection and count; online data management. | Reported low sensitivity and accuracy in some studies [15]. |
| Smartphone Fluorescence | Fluorescent staining & smartphone imaging [44] | Low-cost, automated, differentiates egg types, low coefficient of variation. | Requires sample bleaching and staining; not yet a commercialized system. |
| VETSCAN IMAGYST | Digital scanner & machine learning [15] | Identification and count within 15 mins for dogs and cats. | High cost; not portable; limited host validation. |
| Telenostic System | Digital microscope with machine learning [15] | High agreement with manual FEC methods (McMaster, Mini-FLOTAC). | Long image acquisition and analysis time (~42 mins); validated only on cattle. |
Experimental Protocols for System Validation
Protocol 1: Validating USB Microscope Image Quality for FEC
This protocol ensures the digital microscope provides image quality sufficient for reliable identification of parasitic structures.
I. Purpose: To verify that the resolution, clarity, and color fidelity of the USB microscope are comparable to a traditional optical microscope for fecal egg counting.
II. Research Reagent Solutions:
Table 3: Essential Materials for Image Quality Validation
| Item | Function/Description |
|---|---|
| USB Microscope | Device under validation (e.g., Kubic FLOTAC, Dino-Lite models). Must have USB 3.0 connectivity [41]. |
| Traditional Optical Microscope | Reference standard for image quality comparison. |
| Calibrated Microscope Ruler | A slide with a precise scale for validating magnification and spatial measurement accuracy. |
| Stained Fecal Sample Slides | Prepared samples containing known parasitic structures (e.g., strongyle, ascarid eggs). Provides biological reference material. |
| Computer with USB 3.0 Ports | Host system for the microscope. Must have adequate processing power and correct ports to prevent bandwidth bottlenecks [41]. |
| Image Capture Software | Software provided by the microscope manufacturer or third-party applications (e.g., Micro-Manager). |
III. Methodology:
- System Setup: Connect the USB microscope to a computer via a USB 3.0 port. Ensure the latest device drivers are installed.
- Magnification Calibration: Place the calibrated ruler under both the USB and traditional microscopes. Capture images at equivalent magnifications (e.g., 100x, 200x). Use software to verify that the measured distances match the known scale.
- Sample Imaging: Image a set of at least 30 pre-defined fields from stained fecal samples using both microscopes [15]. Ensure the focus and lighting are optimized for each system.
- Image Analysis: Present the captured images from both systems in a randomized, blinded manner to a trained parasitologist. The specialist will score images based on criteria such as egg edge clarity, internal detail resolution, and color accuracy. Statistical analysis (e.g., concordance correlation coefficient) should be used to compare counts from both methods [15].
Protocol 2: Integration and Testing of AI-Based Egg Counting Software
This protocol outlines the steps for integrating and validating machine learning software for automated egg counting.
I. Purpose: To deploy and assess the performance of an AI image analysis algorithm for the automated identification and enumeration of parasite eggs in images captured by the USB microscope.
II. Research Reagent Solutions:
- AI Software: Pre-trained model for recognizing helminth eggs (e.g., strongyles, ascarids) [15] [45].
- Annotated Image Dataset: A curated set of several hundred USB microscope images with manually confirmed egg counts and identities, used for testing the algorithm.
- Computer with GPU: A system with a dedicated graphics processing unit to accelerate the AI analysis.
- API Scripts: Custom scripts to facilitate data transfer between the image capture software and the AI analysis module [42].
III. Methodology:
- Workflow Integration: Establish a automated workflow where images captured by the USB microscope are automatically saved to a designated folder. Use an API or script to trigger the AI software to process new images as they are acquired [42].
- Performance Benchmarking: Process the annotated image dataset through the AI software. Compare the algorithm's egg counts and identifications against the manual annotations (the "gold standard").
- Data Analysis: Calculate key performance metrics including:
- Sensitivity (True Positive Rate): Proportion of actual eggs correctly identified.
- Precision (Positive Predictive Value): Proportion of identified eggs that are true eggs.
- Coefficient of Variation: Measure of the count repeatability on the same sample, comparing favorably to manual methods [44].
- Output Integration: Configure the system to generate a standardized report containing the egg count, images of detected objects, and a confidence score for each identification, suitable for export to a LIMS.
System Workflow and Architectural Visualization
The following diagram illustrates the integrated workflow of an automated fecal egg counting system, from sample preparation to final reporting, highlighting the critical steps where connectivity and software integration are paramount.
Automated FEC System Data Flow
The integration of USB microscopes into automated fecal egg counting systems is a viable path toward standardizing and democratizing parasitological diagnostics. The primary challenges are not insurmountable but require careful attention to technical details. The selection of hardware with USB 3.0 connectivity and an adequate frame rate is a foundational decision that dictates image quality and usability [41]. Furthermore, the development and integration of sophisticated, well-validated AI software remain the most critical factor for achieving accurate and truly automated counts [15] [45].
Successful implementation, as demonstrated by systems like the Kubic FLOTAC, shows a high level of agreement with traditional methods, proving the concept's validity [15]. The future of these systems will be driven by advancements in AI, particularly deep learning, which will enhance the accuracy of egg detection and differentiation between species. The trend towards cloud-based solutions and wireless connectivity will further increase flexibility and enable remote collaboration and data management [42]. By systematically addressing the connectivity and software integration challenges outlined in this document, researchers can leverage USB microscope technology to create robust, efficient, and accessible tools for monitoring parasite infections and supporting drug development efforts.
Optimizing AI Model Performance and Addressing Misidentification
Performance Benchmarking and Quantitative Analysis
The development of automated fecal egg counting systems relies on rigorous benchmarking to guide optimization efforts. The table below summarizes key performance metrics from relevant AI models in parasitology.
Table 1: Performance Metrics of AI Models for Parasite Egg Detection
| Model / System | Primary Task | Reported Accuracy/Performance | Key Optimization Technique(s) | Impact/Outcome |
|---|---|---|---|---|
| Kubic FLOTAC Microscope (KFM) [4] | Fasciola hepatica & Calicophoron daubneyi detection | Mean Absolute Error of 8 eggs per sample | Dedicated image processing steps; robust deep learning detection model | Prevents false positives and wrong egg counts; high sensitivity and accuracy. |
| Google's Optimized BERT [46] | Search Query Processing | 80% reduction in search latency | Pruning, Quantization, Knowledge Distillation | Drastically improved user experience and reduced computational cost. |
| Telecom Firm Model [46] | Network Diagnostics | 60% reduction in inference time | Quantization | Enabled faster, real-time analysis on limited hardware. |
| AI-KFM Challenge Models [13] | Gastrointestinal Nematode (GIN) detection | Varies by submission (Baseline: FLOTAC/Mini-FLOTAC systems) | Standardized dataset; use of CNNs (e.g., YOLO, ResNet), GANs | Outperformed traditional methods (McMaster, Wisconsin) in accuracy and sensitivity. |
Experimental Protocols for AI Optimization and Validation
Protocol: Hyperparameter Tuning for Egg Detection Models
Objective: To systematically identify the optimal learning parameters for a convolutional neural network (CNN) tasked with classifying parasite eggs.
Materials:
- Trained CNN model (e.g., YOLO, Faster R-CNN).
- Validation dataset of annotated fecal egg images [13].
- Computing infrastructure (GPU recommended).
- Tuning library (e.g., Optuna, Ray Tune).
Methodology:
- Define Search Space: Establish ranges for critical hyperparameters:
- Learning Rate:
1e-5to1e-2(logarithmic scale) - Batch Size: 8, 16, 32, 64
- Optimizer: Adam, SGD, RMSprop
- Number of Epochs: with Early Stopping (patience=10) [47]
- Learning Rate:
- Select Search Strategy: Employ Bayesian Optimization to efficiently navigate the search space by using past evaluation results to inform future parameter selections [47].
- Execute Tuning Run: Launch the tuning process, where the objective function is to maximize the mean Average Precision (mAP) on the validation set.
- Validate Best Configuration: Retrain the model from scratch using the best-found hyperparameters on the full training set and perform a final evaluation on a held-out test set.
Protocol: Model Pruning and Quantization for Deployment
Objective: To reduce the size and computational demands of a trained egg-detection model for potential deployment on portable, low-power devices.
Materials:
- Fully trained and validated AI model.
- Calibration dataset (a subset of the training data).
- Framework-specific tools (e.g., TensorFlow Model Optimization Toolkit, PyTorch Quantization).
Methodology:
- Pruning:
- Apply Magnitude-Based Pruning: Iteratively remove connections (weights) with the smallest magnitudes in the model, as they contribute least to the output [47].
- Fine-Tune: After each pruning step, fine-tune the model on the training data to recover any minor accuracy loss [47].
- Iterate: Repeat the prune-and-fine-tune cycle until the target sparsity (e.g., 50% of weights removed) is achieved or a significant accuracy drop is observed.
- Quantization:
- Apply Post-Training Quantization (PTQ): Convert the 32-bit floating-point numbers in the pruned model to 8-bit integers. This reduces the model size by about 75% and speeds up inference [47].
- Calibrate: Use a calibration dataset to determine the optimal dynamic range for mapping floating points to integers.
- Evaluation: Compare the final optimized model's accuracy, size, and inference speed against the original model.
Protocol: Mitigating AI Bias and Misidentification in Egg Detection
Objective: To identify and correct for biases in the AI model that could lead to misidentification of parasite species or inaccurate counts, especially with morphologically similar eggs (e.g., F. hepatica and C. daubneyi) [4].
Materials:
- Dataset with comprehensive metadata (host species, farm location, parasite species).
- A validated "ground truth" test set.
- Bias auditing tools and fairness metrics.
Methodology:
- Data Audit and Rebalancing:
- Analyze Dataset Composition: Scrutinize the training data for representation bias. Ensure all target parasite species and egg conditions (e.g., different developmental stages, orientations) are adequately represented [48].
- Rebalance: If imbalances are found (e.g., too few C. daubneyi eggs), employ techniques like oversampling the minority class or synthesizing additional examples using data augmentation (rotation, scaling, brightness adjustment) [47].
- Algorithmic and Human Bias Review:
- Stratified Evaluation: Test model performance separately on subgroups of data (e.g., per parasite species, per sample contamination level) to identify specific weaknesses [48].
- Contextual Analysis: Ensure that any performance disparities reflect real biological variation and not an algorithmic flaw. For instance, if two egg types are genuinely difficult to distinguish, this should be documented as a known limitation rather than a pure bias issue [48].
- Continuous Monitoring: Implement a feedback loop where field technicians can flag potential misidentifications. Use this data to continuously improve and retrain the model [48].
Workflow Visualization for AI-Powered Fecal Egg Counting
The following diagram illustrates the integrated workflow of an automated fecal egg counting system, from sample preparation to AI-driven analysis and validation.
AI Fecal Egg Counting Workflow
The Scientist's Toolkit: Essential Research Reagents and Materials
Table 2: Essential Materials for Automated Fecal Egg Counting Research
| Item | Function/Application | Key Characteristics & Notes |
|---|---|---|
| Kubic FLOTAC Microscope (KFM) [4] [13] | A portable digital microscope for automated scanning of fecal samples. | Integrates FLOTAC preparation; AI-powered for field/lab use; enables 10-minute turnaround [1]. |
| FLOTAC / Mini-FLOTAC Apparatus [4] [13] | Sample preparation technique for fecal egg counting. | Provides high sensitivity and accuracy; method of choice for creating standardized datasets [13]. |
| Standardized Datasets (e.g., AI-KFM) [13] | For training, validating, and benchmarking AI models. | Must include diverse parasites, contamination levels, and egg concentrations from real-world samples. |
| Computational Framework (e.g., TensorFlow, PyTorch) | Platform for developing and training deep learning models. | Essential for implementing CNNs (e.g., YOLO, ResNet) and optimization techniques like quantization. |
| Hyperparameter Tuning Tools (e.g., Optuna) [47] | Automates the search for optimal model training parameters. | Crucial for maximizing detection accuracy (mAP) and model efficiency. |
| Model Optimization Toolkit [47] | Implements pruning and quantization for model deployment. | Reduces model size and inference time, enabling use on lower-power hardware. |
| Bias Auditing Software [48] | Evaluates model performance across data subgroups. | Key for identifying and mitigating misidentification of specific parasite species or in poor-quality samples. |
Ensuring Consistent Measurements Through Proper Calibration
Within veterinary parasitology research, the migration from traditional, manual fecal egg counting methods toward automated systems represents a significant advancement. These automated systems, particularly those utilizing USB microscopes and artificial intelligence, offer the potential for enhanced throughput and reduced analytical variability. However, the reliability of the data these systems produce is fundamentally contingent on rigorous and consistent calibration protocols. This document outlines essential application notes and detailed experimental protocols for the calibration of automated fecal egg counting systems, ensuring measurement consistency critical for robust scientific research and drug development.
The Critical Role of Calibration in Automated FEC
Calibration is the process of standardizing an instrument to ensure its output is accurate, precise, and traceable to a known standard. In the context of automated fecal egg counting (FEC), proper calibration bridges the gap between raw image data and biologically meaningful quantitative results.
A failure in calibration can introduce systematic errors, compromising data integrity and leading to incorrect conclusions in anthelmintic efficacy trials or genetic selection programs. The core objectives of calibration in an automated FEC system are:
- Accuracy Assurance: Aligning the system's egg counts with the true egg count in a sample. This is typically validated against a known gold standard, such as manual McMaster counts performed by an expert [26].
- Precision Optimization: Minimizing variation in repeated measurements of the same sample. High precision is a noted advantage of AI-based systems, with one study reporting coefficients of variation (CV) between 5.6% and 40% for an AI system compared to wider variations in the McMaster method [26].
- Instrument Standardization: Correcting for variations in microscope optics (e.g., magnification, focus) and camera settings (e.g., exposure, white balance) to ensure consistent performance across different instruments and over time.
- Algorithm Validation: Training and verifying the AI's ability to correctly identify and differentiate parasite eggs from debris, which is a continuous process reliant on a calibrated image dataset.
Calibration Protocols and Experimental Methodologies
Protocol 1: Microscope and Imaging System Calibration
Objective: To standardize the image acquisition hardware for consistent image quality, which is a prerequisite for reliable AI analysis.
Materials:
- Automated FEC system with USB microscope
- Stage micrometer (a precise ruler etched onto a microscope slide)
- Prepared calibration slide with standardized particles or stained eggs
- Software for the automated system
Methodology:
- Spatial Calibration (Pixel-to-Micron Conversion):
- Place the stage micrometer on the microscope stage.
- Using the system's software, capture an image of the micrometer scale.
- Manually select two points on the image a known distance apart (e.g., 100 µm).
- Input the known distance into the software, which will then calculate the conversion ratio from pixels to microns.
- This calibration must be repeated for each objective lens magnification.
- Illumination and Focus Calibration:
- Use the prepared calibration slide.
- Adjust the microscope's light source to achieve even, glare-free illumination across the entire field of view.
- Set the auto-focus function on a clearly defined object or egg. Manually verify focus clarity at different depths if the system has a z-stack function.
- Save these illumination and focus settings as a preset for routine use.
Protocol 2: Analytical Performance Calibration vs. McMaster Method
Objective: To validate the accuracy and precision of the automated system by comparing its output to the well-established McMaster method using identical sample preparations [26].
Materials:
- Automated FEC system
- All materials for the Modified McMaster's FEC [31] [49]:
- Digital scale (0.1 g increment)
- Saturated salt or sugar flotation solution (Specific Gravity 1.20-1.30)
- McMaster counting slides
- Microscope (100x magnification)
- Timer, strainers, mixing cups
- Fecal samples from experimentally or naturally infected animals
Methodology:
- Sample Preparation: For each fecal sample, weigh 4 grams of feces and mix it thoroughly with 56 mL of flotation solution [31] [49]. Strain the mixture to remove large debris.
- Parallel Processing: Split the homogenized suspension into two aliquots.
- Aliquot 1 (McMaster): Fill both chambers of a McMaster slide and let it sit for 5 minutes. Count all eggs within the grid lines under a microscope. Calculate the Eggs Per Gram (EPG) by multiplying the total count by 50 [31].
- Aliquot 2 (Automated System): Use the same strained suspension to prepare a sample for the automated system according to the manufacturer's instructions.
- Data Collection & Analysis: Perform counts for both methods across a range of samples (n≥30 recommended for statistical power). Analyze the results for correlation and agreement.
Table 1: Quantitative Comparison of FEC Methods from a Validation Study
| Performance Metric | AI-Based System (OvaCyte) | Traditional McMaster | Experimental Context |
|---|---|---|---|
| Accuracy | 72% | 45% | Compared to known spike-in concentration [26] |
| Precision (CV Range) | 5.6% - 40% | Not explicitly reported | Measured across replicates [26] |
| Correlation (r-value) | 0.93 | (Reference) | Analysis of field samples [26] |
| Sensitivity (Detection Limit) | Higher proportion of positive samples | Lower proportion of positive samples | Analysis of field samples [26] |
| Sensitivity (EPG) | Configurable | 50 EPG (with 4g feces in 56mL) | Standard method definition [31] [49] |
Protocol 3: AI Model and Classification Threshold Calibration
Objective: To fine-tune the AI's classification algorithm, minimizing both false positives (misidentifying debris as eggs) and false negatives (failing to identify true eggs).
Materials:
- Automated FEC system with training mode access
- A curated library of at least 500-1000 validated images of strongyle eggs and common debris
Methodology:
- Ground Truth Establishment: A panel of expert parasitologists should label images, definitively identifying eggs and debris to create a "ground truth" dataset.
- Model Training: Use this dataset to train the AI model, typically performed by the system developer.
- Threshold Adjustment: Adjust the classification confidence threshold (often a value between 0 and 1). A higher threshold reduces false positives but may increase false negatives, and vice versa.
- Cross-Validation: Test the calibrated model on a new set of images not used in training and calculate performance metrics like sensitivity, specificity, and F1 score.
The Scientist's Toolkit: Essential Research Reagents and Materials
Successful calibration and operation of an automated FEC system require specific reagents and materials. The following table details key items and their functions in the experimental workflow.
Table 2: Key Research Reagent Solutions for Fecal Egg Counting
| Item | Function / Purpose | Technical Notes |
|---|---|---|
| Flotation Solution | Creates a medium with high specific gravity (SPG) to float parasite eggs to the surface for detection [31] [49]. | Common formulations: Saturated Sodium Chloride (SPG 1.20), Sheather's Sugar (SPG 1.20-1.25). SPG affects which eggs float effectively. |
| McMaster Slide | A specialized chambered slide that allows for the quantitative enumeration of eggs per gram of feces [31] [49]. | Chambers have a defined volume and grid lines. Green grid lines are often preferred for better visibility [49]. |
| Digital Scale | Precisely weighs fecal samples to maintain a consistent feces-to-flotation solution ratio [31] [49]. | Critical for accuracy; requires capability to weigh in 0.1-gram increments. |
| Stage Micrometer | A microscope slide with a precision-etched scale for calibrating the digital imaging system's spatial measurements. | Essential for converting pixels to microns, ensuring accurate size-based egg classification. |
| Reference Samples | Fecal samples with known egg concentrations (e.g., via spiking) or pre-counted expert consensus. | Serves as the primary standard for validating system accuracy and tracking performance over time. |
| Quality Control (QC) Slide | A slide with stable, embedded targets or particles for daily verification of image focus and illumination. | Used for routine performance checks, distinct from the full calibration process. |
Workflow Visualization
The following diagram illustrates the logical workflow for establishing and maintaining a properly calibrated automated FEC system, integrating the protocols described above.
Figure 1: Integrated Calibration Workflow for Automated FEC Systems
The adoption of automated fecal egg counting systems offers transformative potential for parasitology research. However, this potential can only be realized through a disciplined and scientific approach to calibration. The protocols and guidelines provided here—encompassing hardware standardization, analytical validation against the McMaster method, and meticulous AI model tuning—form a foundational framework for ensuring data consistency and reliability. By integrating these practices into their standard operating procedures, researchers and drug development professionals can confidently leverage automation to generate high-quality, reproducible data essential for advancing animal health and combating anthelmintic resistance.
Preventative Maintenance and Care for Digital Microscopy Equipment
In veterinary parasitology research, the precision of automated fecal egg counting (FEC) systems is critical for diagnosing infections and monitoring anthelmintic resistance. Digital microscopy equipment, including USB microscopes integrated into systems like the Kubic FLOTAC Microscope (KFM), forms the core of this technology [4]. The diagnostic accuracy of these systems relies on the consistent quality of the digital images captured for computational analysis. Preventative maintenance is not merely operational but a fundamental scientific practice that ensures the diagnostic accuracy and reproducibility of research data by safeguarding optimal equipment performance [50] [51]. A well-maintained system minimizes artifacts, preserves image contrast, and ensures that automated egg detection algorithms, which are vital for systems described in recent studies, function with high reliability [4] [16].
Essential Maintenance Protocols
A structured, multi-tiered maintenance schedule is the most effective strategy for protecting your investment and ensuring data integrity.
Daily Maintenance Procedures
These quick checks should be performed at the beginning and end of each use.
- Visual Inspection: Check the microscope body, stage, and lenses for obvious dust, debris, or contamination [51].
- Control Surfaces: Wipe knobs, stage, and other frequently touched surfaces with a lint-free cloth slightly dampened with a mild detergent or 70% isopropyl alcohol to remove oils and dust [52] [53].
- Optics Check: Use an air blower to remove loose dust from optical surfaces [52].
- Post-Use Care: After using immersion oil, immediately wipe the objective clean with a soft lens tissue and an appropriate solvent like isopropanol to prevent hardened residues [52]. Cover the microscope with a dust cover [52] [51].
Weekly Maintenance Procedures
- Detailed Optics Cleaning: Carefully clean eyepieces and objectives. Use an air blower first, then gently wipe lenses with a lint-free optical wipe dampened with lens cleaning solution, moving in a circular motion from the center outward [52] [53].
- Stage and Condenser Cleaning: Clean the stage and condenser lens with a lint-free cloth and appropriate cleaning solutions to remove any fecal or chemical residues [52] [53].
- Ventilation Check: Ensure ventilation ports are free of dust to prevent overheating [51].
Monthly Maintenance Procedures
- Comprehensive Performance Testing: Conduct a test scan using a calibration slide to verify image quality and system calibration [51].
- Mechanical Component Inspection: Check for signs of wear on all moving parts, including the stage and focus mechanisms [51].
- Software Updates: Install any available software updates for the microscope and associated analysis algorithms [51].
- Backup Configuration Settings: Save instrument configuration and calibration settings [51].
Quarterly & Annual Maintenance
- Professional Service: Schedule a professional service visit at least annually. Certified technicians can perform internal cleaning, comprehensive calibration, and inspect components not accessible to users [52] [51]. High-usage environments may require more frequent service.
- Full System Overhaul: This may include major calibrations and replacement of components showing wear [50].
Table 1: Summary of Preventative Maintenance Schedule
| Frequency | Key Tasks | Purpose |
|---|---|---|
| Daily | Visual inspection, control surface cleaning, dust removal with air blower, post-use oil cleaning [52] [53] | Prevents buildup of contaminants and maintains basic operational integrity. |
| Weekly | Detailed cleaning of optics, stage, and condenser; check ventilation [52] [51] | Ensures consistent image quality and prevents long-term damage to lenses. |
| Monthly | Performance test with calibration slide, mechanical inspection, software updates [51] | Verifies system accuracy and addresses potential issues before they affect data. |
| Annually | Professional service and calibration [52] [51] | Ensures deep system integrity and compliance with technical specifications. |
Maintenance Workflow and Contamination Detection
Implementing a logical workflow ensures maintenance is thorough and efficient. A critical prerequisite to cleaning is accurately locating contamination, as cleaning the wrong component wastes time and risks damage.
Detecting Contamination on Optical Surfaces
Before cleaning, identify the contaminated component [52]:
- Observe the Image: Blurred zones, low contrast, or ghosting often indicate dirty optics [52].
- Use a Clean Slide: Observe a clean, blank slide. Any spots that remain stationary when you rotate the eyepiece or objective are on the optics. Spots that move with the slide are on the slide itself [52].
- Systematic Checking: Rotate objectives and eyepieces slightly. Adjust the condenser up and down. The dirt will move with the affected component [52].
Quality Assurance for Automated Fecal Egg Counting Systems
For automated FEC systems, maintenance is directly linked to the validity of experimental results. Quality assurance (QA) protocols must be implemented to ensure the entire system—from sample preparation to digital analysis—functions correctly.
- Regular Calibration Verification: Use standardized calibration slides or samples with a known concentration of parasite eggs (e.g., prepared slides or synthetic egg analogs) to routinely verify the system's counting accuracy and the performance of the AI detection model [51] [16].
- Cross-Method Validation: Periodically validate results against a established manual method, such as mini-FLOTAC or McMaster, to check for drift in the automated system's performance [7].
- Control Samples: Incorporate positive and negative control samples in each batch run to monitor the sample preparation and detection process [7].
- Image Quality Metrics: Monitor AI performance metrics such as recall rate (sensitivity) and precision. A drop in these metrics can indicate issues with image quality due to optical contamination or misalignment [16].
Table 2: Troubleshooting Common Issues in Digital FEC Systems
| Problem | Potential Cause | Corrective Action |
|---|---|---|
| Blurred images | Dirty objectives/slides, misalignment, focus drift [51] | Clean optics, use clean slides, check mechanical stability, contact service [52] [51]. |
| Low egg detection sensitivity | Poor image contrast, outdated AI model, suboptimal lighting [4] [16] | Clean condenser and light source, verify software is up-to-date, run calibration [51]. |
| Inconsistent counts | Variations in sample preparation, air bubbles in chamber, uneven illumination [7] | Standardize sample prep protocol (e.g., FLOTAC), check chamber filling, verify light source stability [4] [7]. |
| Software/connection errors | Outdated drivers, faulty cables, OS conflicts | Update software/drivers, check USB connections, restart system [51]. |
The Scientist's Toolkit: Essential Research Reagent Solutions
Proper maintenance extends to the consumables and reagents used in sample preparation for fecal egg counting. The quality and consistency of these materials directly impact egg recovery efficiency and, consequently, the accuracy of automated counts [7].
Table 3: Essential Reagents and Materials for Fecal Egg Counting Research
| Item | Function/Application | Technical Notes |
|---|---|---|
| Flotation Solution (e.g., Sodium Nitrate) | Suspension medium to separate parasite eggs from fecal debris based on density [7]. | Specific gravity (e.g., 1.25-1.30 g/L) is critical for optimal flotation of different egg types [7]. |
| Lens Cleaning Solution | Safely removes oil and grime from delicate optical surfaces without damaging coatings [52]. | Use solutions specifically for optics (e.g., isopropanol, ZEISS Cleaning Mixture). Avoid acetone [52]. |
| Lint-Free Wipes | Cleaning optics, stages, and other components without leaving fibers [52] [53]. | Use specialist lens tissue or lint-free optical wipes. Avoid cosmetic tissues or cotton swabs that can scratch [52]. |
| Compressed Air Duster | Removing loose dust and particulate matter from optics and hard-to-reach areas [53]. | Hold the can upright to avoid spraying propellant onto lenses. |
| 70% Isopropyl Alcohol | General surface sterilization and cleaning of non-optical parts (stage, body) [53]. | Effective disinfectant that evaporates quickly without residue. |
| Immersion Oil | Used with oil-immersion objectives to increase resolution by matching the refractive index of glass [52]. | Must be cleaned immediately after use to prevent hardening on the objective lens [52]. |
| Calibration Slides | Verifying the resolution, sharpness, and scale calibration of the digital microscope [51]. | Essential for periodic QA checks to ensure measurement accuracy over time. |
For research relying on automated fecal egg counting, a rigorous and documented preventative maintenance program for digital microscopy equipment is non-negotiable. It is the foundation upon which reliable, reproducible, and scientifically valid data is built. By adhering to structured daily, weekly, and monthly protocols, researchers can prevent the majority of equipment failures and image quality issues [50]. Combining these routine practices with annual professional service and robust quality assurance measures, such as regular calibration and validation, will protect the research investment, minimize operational downtime, and ultimately uphold the highest standards of diagnostic and research accuracy in the critical fight against parasitic infections and anthelmintic resistance.
Proving Efficacy: Validation Frameworks and Comparative Analysis of Automated FEC Systems
Establishing Validation Protocols for Digital Microscopy in Diagnostics
The transition from traditional optical microscopy to digital microscopy represents a paradigm shift for diagnostic laboratories, particularly for specialized applications such as automated fecal egg counting (FEC). This shift enables advanced computational analysis, including artificial intelligence (AI)-driven detection, which can enhance diagnostic accuracy, reproducibility, and throughput [54]. However, the integration of these technologies into clinical or research workflows requires rigorous and standardized validation to ensure results are reliable, accurate, and consistent with intended purposes [55] [54]. For researchers developing automated FEC systems using USB microscopes, establishing a robust validation framework is not merely a procedural formality but a critical component of research integrity and eventual clinical translation. This document outlines comprehensive validation protocols, drawing from established pathological guidelines [55] and practical implementation experiences from institutions with fully digital diagnostic workflows [54].
Core Principles of Validation
Validation of a digital microscopy system ensures that the entire process, from sample preparation to the final analytical result, consistently meets its intended purpose and predetermined specifications [54]. It is crucial to distinguish this from the initial qualification of equipment (verifying correct installation and function) and the external accreditation of the entire laboratory process by a regulatory body [54]. The validation process for an automated FEC system should demonstrate diagnostic equivalence or superiority to the reference method, typically manual microscopy.
A key recommendation from the College of American Pathologists (CAP) is that validation should include at least 60 cases,
as studies have shown that going beyond this number does not significantly improve mean concordance rates [55]. The target concordance between the digital system and manual microscopy should be high, reflecting the established reality of inter- and intra-observer variability in pathology; a weighted mean percent concordance of 95.2% across studies forms the basis for this benchmark [55].
Phases of Validation
The validation journey for a digital diagnostic tool can be structured into three sequential phases, involving multiple stakeholders.
Pre-Validation: Planning and Tool Qualification
Before validation begins, defining the scope and assembling the necessary resources is essential.
- Defining Roles and Responsibilities: A successful validation requires a multidisciplinary team. Key roles include [54]:
- Algorithm Researcher (AR): Develops the detection model.
- Deployment Engineer (DE): Hardens the algorithm for real-world use and integrates it with the hardware.
- Experimental Pathologist (EP): A domain expert who defines clinical requirements and acts as a beta-tester.
- Routine Pathologist (RP): The end-user who uses the validated tool in daily practice.
- Laboratory Manager (LM): Oversees operations and ensures compliance.
- System Qualification: This involves verifying that the USB microscope and associated software are installed correctly and function according to specifications. It includes Design Qualification (DQ), Installation Qualification (IQ), Operational Qualification (OQ), and Performance Qualification (PQ) [54].
The following diagram illustrates the structured workflow from development to the validated deployment of a digital diagnostic tool.
Performance Validation
This phase assesses the diagnostic accuracy of the automated FEC system against the reference standard.
- Sample Selection and Preparation: The validation set should include a range of samples, from negative to high-intensity infections, to thoroughly challenge the system. Protocols like FLOTAC/Mini-FLOTAC [4] [56] or Kato-Katz [10] provide standardized sample preparation methods crucial for reproducibility.
- Imaging and Analysis: The entire slide or sample should be digitized using the USB microscope system. The subsequent AI-based analysis should be performed autonomously and, in a separate step, with expert verification of the AI's findings [10].
- Data Comparison: Diagnostic concordance is measured by comparing results from the autonomous AI, expert-verified AI, and manual microscopy against a composite reference standard (e.g., combining expert verification in both physical and digital smears) [10].
Table 1: Performance Comparison of Digital vs. Manual Microscopy for Parasite Egg Detection
| Study and System | Parasite | Manual Microscopy Sensitivity (%) | Autonomous AI Sensitivity (%) | Expert-Verified AI Sensitivity (%) | Specificity (%) |
|---|---|---|---|---|---|
| AI-Supported Kato-Katz [10] | Ascaris lumbricoides | 50.0 | 50.0 | 100.0 | >97 |
| Trichuris trichiura | 31.2 | 84.4 | 93.8 | >97 | |
| Hookworms | 77.8 | 87.4 | 92.2 | >97 | |
| KU-F40 Fecal Analyzer [16] | Overall Parasite Detection | 2.81 (Detection Level) | 8.74 (Detection Level) | Not Applicable | >94.7 |
| AiDx Assist (Stool) [57] | Schistosoma mansoni | Reference | 56.9 (Fully Auto) | 86.8 (Semi-Auto) | ~84-87 |
| AiDx Assist (Urine) [57] | Schistosoma haematobium | Reference | 91.9 (Fully Auto) | 94.6 (Semi-Auto) | ~91 |
Operational Validation
Once diagnostic accuracy is established, the system's integration into the routine workflow must be validated.
- Throughput and Usability: Assess the time required for scanning and analysis compared to manual methods. Systems like the Kubic FLOTAC Microscope (KFM) can complete scanning in minutes, freeing operator time [4] [56].
- Biosafety and Automation: Evaluate the biosafety advantages of enclosed, automated systems (e.g., KU-F40) versus open-slide manual microscopy [16].
- Portability and Field Deployment: For field applications, as relevant to USB-based systems, validate performance in non-laboratory settings. Portable systems like the KFM and AiDx Assist are designed for this purpose [4] [57].
Experimental Protocols for FEC System Validation
Protocol: Diagnostic Concordance Study
This protocol is designed to validate the accuracy of an automated USB microscope FEC system against manual microscopy.
- Objective: To determine the sensitivity, specificity, and concordance of the automated FEC system for detecting and quantifying parasite eggs in fecal samples.
- Materials:
- Procedure:
- Sample Preparation: Prepare slides from each fecal sample using a standardized method like Mini-FLOTAC [4]. Ensure samples cover a spectrum of egg concentrations.
- Reference Standard Creation: Each slide is independently examined by two expert microscopists using manual optical microscopy. A composite reference standard is created: a sample is positive if either microscopist identifies eggs, confirmed by a third expert in case of disagreement [10].
- Digital Imaging and Analysis:
- Scan the prepared slides using the USB digital microscope system.
- Run the autonomous AI analysis to generate egg counts and identifications.
- In a separate session, have an expert microscopist verify the eggs detected by the AI in the digital images (expert-verified AI) [10].
- Data Collection: Record egg counts and species identification from manual microscopy, autonomous AI, and expert-verified AI.
- Statistical Analysis:
- Calculate sensitivity and specificity for each method against the composite reference.
- Compute the concordance rate between the automated methods and manual microscopy. The target is ≥95.2% concordance [55].
- Analyze the mean absolute error (MAE) of fecal egg counts. For example, the KFM system achieved an MAE of only 8 eggs per sample [4].
Protocol: Limit of Detection and Linearity
This protocol establishes the lowest egg concentration the system can reliably detect and how egg counts correlate with actual concentrations.
- Objective: To determine the limit of detection (LoD) and linearity of the automated FEC system.
- Materials: Egg-spiked samples with known, serial-diluted concentrations of parasite eggs [4].
- Procedure:
- Sample Spiking: Create a series of samples spiked with known numbers of parasite eggs, ranging from zero to a high concentration.
- Analysis: Process and analyze each spiked sample using the automated FEC system.
- Data Analysis:
- LoD: The lowest concentration at which the system can consistently detect eggs (e.g., in 95% of replicates).
- Linearity: Assess the correlation between the egg counts reported by the system and the known spike-in counts. A high coefficient of determination (R²) indicates good linearity.
The Scientist's Toolkit
Table 2: Essential Research Reagents and Materials for Automated FEC Validation
| Item | Function / Principle | Example Use Case |
|---|---|---|
| FLOTAC / Mini-FLOTAC | A sensitive, standardized method for fecal egg concentration and counting using flotation solutions [4] [56]. | Creating consistent, comparable fecal samples for imaging and analysis in cattle FEC [4] [13]. |
| Kato-Katz Thick Smear | A widely used method in human parasitology for qualitative and semi-quantitative detection of helminth eggs [10]. | Validation of digital systems for soil-transmitted helminths (STH) in human stool samples [10] [57]. |
| Kubic FLOTAC Microscope (KFM) | A portable, AI-powered digital microscope designed for autonomous analysis of FLOTAC samples in lab and field settings [4] [56]. | Serves as a benchmark system and research platform for automated parasite egg detection. |
| Whole Slide Imaging (WSI) Scanner | Digitizes entire microscope slides at high resolution, enabling remote diagnosis and AI analysis [55] [10]. | Used in digital pathology validation and for STH diagnosis from Kato-Katz slides [55] [10]. |
| AI Verification Software | A tool that allows expert microscopists to review and confirm AI-generated detections in digital images [10]. | Critical for the "expert-verified AI" workflow, improving sensitivity and specificity [10]. |
Data Management and Reporting
A successful validation is fully traceable and auditable. Key practices include:
- Data Integrity: Maintain raw data, including original digital images, AI outputs, and manual count records. Use standardized data formats (e.g., TIFF) to ensure compatibility [58] [54].
- Documentation: Create a validation report that includes the protocol, all raw data, analysis methods, and conclusions. This report is essential for both internal quality control and external accreditation [54].
- Regulatory Pathways: Be aware that tools developed for in-house use are Laboratory Developed Tests (LDTs), while commercial distribution may require FDA clearance or CE-marking under IVDR [54].
The following diagram summarizes the comprehensive, multi-phase validation pathway from initial planning to final accredited use.
The accurate quantification of gastrointestinal parasite eggs in fecal samples, expressed as eggs per gram (EPG), is a cornerstone of veterinary parasitology. It is essential for diagnosing infections, monitoring anthelmintic treatment efficacy, and conducting epidemiological studies [59]. For decades, the McMaster technique has served as the widely accepted benchmark for quantitative coproscopic analysis. However, the emergence of newer techniques, such as the FLOTAC and Mini-FLOTAC, has prompted a critical re-evaluation of performance standards in fecal egg counting (FEC) [60]. This is particularly relevant in the context of developing novel automated systems, such as those utilizing USB microscopes, where established manual methods provide the essential reference for validation. This application note provides a detailed comparison of these gold standard techniques, presenting structured quantitative data and detailed protocols to serve as a foundation for researchers and scientists, especially those engaged in the development and calibration of next-generation automated FEC systems.
Comparative Performance of FEC Techniques
A comprehensive analysis of recent comparative studies reveals distinct performance characteristics for each method. The following tables summarize key findings regarding diagnostic sensitivity and egg recovery efficiency across different host species.
Table 1: Comparative Diagnostic Sensitivity of FEC Techniques in Equine and Camelids
| Parasite | Host | McMaster | Mini-FLOTAC | OvaCyte Telenostic (OCT) | Citation |
|---|---|---|---|---|---|
| Strongyles | Horse | 0.94 | 0.94 | 0.98 | [60] |
| Parascaris spp. | Horse | 0.83 | 0.96 | 0.96 | [60] |
| Anoplocephala spp. | Horse | 0.44 | 0.46 | 0.86 | [60] |
| Strongyloides westeri | Horse | 0.88 | 0.88 | 0.74 | [60] |
| Strongyles | Camel | 48.8% positive | 68.6% positive | N/A | [22] |
| Strongyloides spp. | Camel | 3.5% positive | 3.5% positive | N/A | [22] |
| Moniezia spp. | Camel | 2.2% positive | 7.7% positive | N/A | [22] |
Table 2: Relative Egg Counting Efficiency and Method Parameters
| Parameter | McMaster | Mini-FLOTAC | Wisconsin | Parasight AIO | Citation |
|---|---|---|---|---|---|
| Multiplication Factor | 25 | 5 | 1 | 1 | [7] |
| Relative Strongyle Egg Recovery (vs. McMaster) | 1x | ~5x | ~15x | ~15x | [7] |
| Effective Multiplication Factor (Relative to Mini-FLOTAC) | 5x | 1x | ~1.6x | ~1.6x | [7] |
| Mean Strongyle EPG in Pigs | 893 | Higher than McMaster | N/A | N/A | [59] |
| Mean Strongyle EPG in Camels | 330.1 | 537.4 | N/A | N/A | [22] |
| Required Equipment | Microscope, standard centrifuge (optional) | Microscope, Fill-FLOTAC | Microscope, fixed-angle centrifuge | Proprietary automated device | [59] [7] |
Experimental Protocols for Key FEC Techniques
The McMaster Technique
The McMaster technique is a quantitative flotation method that utilizes a counting chamber with a known volume to estimate the number of eggs per gram of feces [59] [22].
- Sample Preparation: Weigh a specific amount of feces (e.g., 4-6 g). Combine it with a flotation solution (e.g., saturated sodium chloride with a specific gravity of 1.20) to achieve a defined total volume (e.g., 60 mL if using 4 g of feces, or 84 mL if using 6 g) [59] [22].
- Homogenization and Filtration: Thoroughly mix the fecal suspension to homogenize it. Filter the suspension through a sieve (e.g., 0.3 mm mesh) to remove large debris [22].
- Chamber Filling: Using a pipette, draw the filtered suspension and fill both chambers of the McMaster slide. The chambers are designed to allow eggs to float to the top while the debris settles.
- Egg Counting: Allow the slide to stand for a few minutes (e.g., 5-10 minutes) for egg flotation. Place the slide under a microscope and count the eggs within the engraved grids of both chambers.
- EPG Calculation: The number of eggs counted is multiplied by a predetermined multiplication factor to calculate the EPG. This factor is based on the mass of feces examined in the chamber volume. For example: EPG = (Egg count) × (Total volume of flotation fluid / Volume of chamber) × (1 / Mass of feces used). A common multiplication factor is 50 [22].
The Mini-FLOTAC Technique
The Mini-FLOTAC is a quantitative centrifugal flotation method that does not require a centrifuge for the final flotation step, making it more portable and accessible [59] [27].
- Sample Preparation with Fill-FLOTAC: The Fill-FLOTAC system is often used for standardization. Place a standard amount of feces (e.g., 5 g) into the device's collector. Add a specific volume of flotation solution (e.g., 45 mL of sodium chloride solution, SG 1.20) to the main container [59].
- Homogenization: Attach the filled collector to the container and homogenize the mixture through rotating and vertical movements. A filter in the device helps remove large particles.
- Chamber Filling: Attach a pipette tip to the device and directly fill the two chambers of the Mini-FLOTAC apparatus with the homogenized suspension.
- Flotation and Counting: Screw the chamber onto the base of the Mini-FLOTAC apparatus and let it stand for about 10-15 minutes to allow passive flotation of the eggs. After this period, rotate the top part of the apparatus to align the chambers with the microscope objective. Count the eggs in both chambers.
- EPG Calculation: The egg count is multiplied by a correction factor specific to the dilution and chamber volume. For the described protocol using 5g of feces in 45mL of fluid, a correction factor of 5 is used: EPG = (Total egg count in both chambers) × 5 [59].
The Scientist's Toolkit: Essential Research Reagent Solutions
Table 3: Key Reagents and Materials for Fecal Egg Counting
| Item | Typical Specification/Example | Function in FEC Protocol |
|---|---|---|
| Flotation Solution | Saturated Sodium Chloride (NaCl, SG 1.20), Sodium Nitrate (NaNO₃, SG 1.20-1.25), Zinc Sulfate (ZnSO₄, SG 1.35) [59] [7] [27] | Creates a solution denser than parasite eggs, causing them to float to the surface for collection and counting. |
| Fill-FLOTAC Device | Graduated container (e.g., 45 mL) with screw cap, integrated collector, and filter [59] | Standardizes the process of sample homogenization, filtration, and transfer to the counting chambers, minimizing error. |
| Counting Chamber | McMaster slide (two chambers, 0.15 mL each) or Mini-FLOTAC chambers (2 mL total volume) [59] [22] | Holds a precise volume of fecal suspension, enabling quantitative measurement of egg concentration. |
| Microscope | Light microscope (e.g., Olympus CX23, Olympus BX41) [59] [22] | Essential for the visual identification and manual counting of parasite eggs, larvae, oocysts, and cysts. |
| Centrifuge | Fixed-angle centrifuge (e.g., for Wisconsin or FLOTAC protocols) [7] | Used in specific methods to enhance egg recovery by forcing eggs into the flotation solution through centrifugation. |
The diagnosis of gastrointestinal parasites through fecal egg count (FEC) is a cornerstone of veterinary medicine and public health. Traditional methods, while effective, are often time-consuming, require specialized personnel, and are susceptible to human error. The Kubic FLOTAC Microscope (KFM) emerges as a technological solution, designed to be a compact, low-cost, versatile, and portable digital microscope [61] [62]. It is engineered to analyze fecal specimens prepared with the FLOTAC or Mini-FLOTAC techniques in both field and laboratory settings [13]. This case study details the validation of the KFM within the context of a broader thesis on automated fecal egg counting systems, framing its performance, applications, and integration with artificial intelligence (AI) for researchers and drug development professionals.
The KFM is a self-contained diagnostic system with several key characteristics that make it suitable for both research and field applications [62].
- Design and Portability: The microscope is cubic (20 × 20 × 20 cm), compact, and portable. It features an integrated lithium battery with an autonomy of up to 20 hours, eliminating the need for an external power source during field use [62].
- Cost-Effectiveness: With an approximate cost of 600 euros, it is positioned as a low-cost solution for resource-limited settings [62].
- Automation and Digital Workflow: The KFM can autonomously scan and acquire images from a FLOTAC or Mini-FLOTAC chamber within minutes. This digital workflow frees the operator to perform other tasks and facilitates the storage and re-analysis of image data [13].
- AI Integration: The system includes a web interface for control and is connected to a dedicated AI server for image analysis. This allows for the development and implementation of deep learning models for the automated detection and quantification of parasitic elements [4] [13].
Validation in Cattle: Core Experimental Findings
The initial and fundamental validation of the KFM was performed for the detection of gastrointestinal nematode (GIN) eggs in cattle.
Experimental Protocol
- Sample Preparation: Thirty fecal samples from cattle experimentally infected with GINs were processed using the Mini-FLOTAC technique [61] [62]. This technique uses flotation solutions (e.g., FS2 sodium chloride-based, s.g. = 1200; FS7 zinc sulphate-based, s.g. = 1350) to concentrate parasitic eggs for accurate quantification [63].
- Comparative Analysis: Each prepared sample was analyzed in parallel using two devices:
- Traditional Optical Microscope (OM): The established standard for fecal egg counting.
- Kubic FLOTAC Microscope (KFM): The digital system under validation.
- Data Comparison: The fecal egg counts (FEC) obtained from both methods were statistically compared to determine the level of agreement [61] [62].
Quantitative Results and Validation Data
The comparison between the KFM and the traditional optical microscope demonstrated a very high level of agreement, as summarized in the table below.
Table 1: Validation Results for KFM vs. Traditional Microscopy in Cattle GIN Detection
| Validation Metric | Result | Interpretation |
|---|---|---|
| Concordance Correlation Coefficient | 0.999 [61] [62] | Indicates near-perfect agreement between the two methods. |
| Mean Discrepancy (Eggs per Gram) | -0.425 ± 7.370 [61] [62] | A very low and non-significant average difference in egg counts. |
| Image Quality | Comparable to traditional OM [61] [62] | Confirms the KFM's optical system provides diagnostically reliable images. |
This validation established that the KFM is a reliable tool for quantitative FEC of GINs in cattle, providing results that are statistically equivalent to those from traditional microscopy [61].
Advanced Application: AI-Powered Discrimination of Trematode Eggs
Beyond simple counting, the KFM system has been optimized for a more complex task: the automated differentiation of morphologically similar parasite eggs.
Experimental Protocol for AI Workflow
- Study Focus: Discrimination between Fasciola hepatica and Calicophoron daubneyi eggs, which are challenging to distinguish by the human eye [4].
- Dataset Creation: A dataset for training and evaluating the AI model was created using both egg-spiked samples and samples from natural infections [4].
- AI Model Integration: The KFM's automated detection system was enhanced with additional image processing steps and a robust deep learning detection model to improve discrimination [4].
- Performance Assessment: The system's performance was evaluated on a separate dataset of field samples, with egg counts verified by optical microscopy [4].
Performance of the AI Workflow
The AI-enhanced KFM system demonstrated high diagnostic performance for this challenging task.
Table 2: Performance of AI-KFM in Discriminating F. hepatica and C. daubneyi
| Performance Metric | Result | Significance |
|---|---|---|
| Mean Absolute Error (MAE) | 8 eggs per sample [4] | Demonstrates a high level of quantitative accuracy in automated counting. |
| Key Achievement | Successful discrimination between two morphologically similar trematode eggs [4] | Highlights the advanced capability of the AI software beyond simple nematode egg counting. |
This application underscores the KFM's potential not just to automate existing tasks, but to perform complex diagnostic differentiation that exceeds human capability in a consistent and standardized manner [4].
Broader Applications and Impact
The utility of the KFM extends beyond cattle and into broader public health and research contexts.
- Public Health and Human Parasitology: The KFM has been successfully deployed in health screening programs for migrant populations in Southern Italy. In one study, it was used for the diagnosis of soil-transmitted helminths (STHs) like hookworms and Trichuris trichiura, showing no statistically significant differences in egg counts compared to the Mini-FLOTAC used with an optical microscope [63]. This demonstrates its applicability in human parasitological monitoring.
- A Platform for AI Research: The KFM has fostered collaborative research in AI. The first "AI-KFM challenge" was an international competition hosted on Kaggle, providing a standardized dataset of KFM-acquired images for participants to develop advanced object detection models for gastrointestinal nematode eggs [13]. This initiative accelerates the development of fully automated FEC solutions.
The Scientist's Toolkit: Essential Research Reagents and Materials
The following table details key components required to implement the KFM system and its associated protocols.
Table 3: Essential Research Reagents and Materials for KFM-Based Fecal Egg Counting
| Item | Function | Application Note |
|---|---|---|
| Kubic FLOTAC Microscope (KFM) | A portable digital microscope for automated scanning and image acquisition of fecal samples. | The core hardware. Features a web interface and connects to an AI server for analysis [4] [62]. |
| Mini-FLOTAC / Fill-FLOTAC Set | Devices for standardizing sample preparation and flotation for fecal egg counts. | Used with the KFM; considered a sensitive, accurate, and standardized FEC technique [61] [64]. |
| Flotation Solutions (FS) | Solutions of specific gravity (e.g., FS2, FS7) to float parasite eggs to the surface for detection. | Critical for the Mini-FLOTAC preparation protocol. Different solutions are optimal for different parasite types [63]. |
| AI Detection Model | A deep learning software for the automatic identification and quantification of parasite eggs in digital images. | Integrated into the KFM system; can be trained to detect and discriminate specific parasites [4] [13]. |
Experimental Workflow Diagram
The following diagram illustrates the end-to-end workflow for fecal egg count using the KFM system, from sample collection to final analysis.
The Kubic FLOTAC Microscope represents a significant advancement in parasitological diagnosis. Validation studies in cattle have confirmed that it provides quantitative results equivalent to traditional optical microscopy [61] [62]. Its integration with artificial intelligence enables not only automation but also enhanced diagnostic capabilities, such as discriminating between challenging parasite species [4]. As a portable, cost-effective, and digitally native platform, the KFM is a powerful tool for improving the efficiency and accuracy of fecal egg counting in veterinary medicine, public health surveillance, and research aimed at combating anthelmintic resistance [63] [64]. Its role as a platform for collaborative AI development, exemplified by the AI-KFM challenge [13], ensures it will remain at the forefront of technological innovation in parasitology.
Automated fecal egg counting (FEC) systems represent a significant advancement in veterinary parasitology, addressing the limitations of traditional manual methods such as operator dependency, time consumption, and diagnostic variability [65] [66]. The OvaCyte Telenostic (OCT) analyser is an automated digital microscope that utilizes artificial intelligence (AI) to identify and count parasite eggs in fecal samples from multiple host species at the point-of-care [67]. This case study evaluates the performance of the OvaCyte system in detecting and quantifying gastrointestinal parasites in canine, equine, and ovine samples, providing researchers and drug development professionals with comprehensive analytical data and standardized protocols for implementing this technology in parasitological research and anthelmintic development programs.
Comparative Sensitivity Across Host Species
Table 1: Diagnostic sensitivity of the OvaCyte system across host species
| Host Species | Parasite Type | OvaCyte Sensitivity | Comparator Method(s) | Reference Method Sensitivity |
|---|---|---|---|---|
| Canine | Roundworm (Toxocara spp.) | 90-100%* | Centrifugal Flotation (1g) | Significantly lower (P < 0.05) [65] |
| Canine | Hookworm (Ancylostoma spp.) | 90-100%* | Centrifugal Flotation (1g) | Significantly lower (P < 0.05) [65] |
| Canine | Cystoisospora spp. | 90% | Passive Flotation | Significantly lower (P < 0.001) [65] |
| Canine | Capillaria spp. | 100% | All flotation methods | Significantly lower (P < 0.001) [65] |
| Equine | Strongyles | 98% | McMaster, Mini-FLOTAC | 96% (McMaster), 94% (Mini-FLOTAC) [66] |
| Equine | Parascaris spp. | 96% | McMaster, Mini-FLOTAC | 83% (McMaster), 96% (Mini-FLOTAC) [66] |
| Equine | Anoplocephala spp. | 86% | McMaster, Mini-FLOTAC | 44% (McMaster), 46% (Mini-FLOTAC) [66] |
| Equine | Strongyloides westeri | 74% | McMaster, Mini-FLOTAC | 88% (both methods) [66] |
| Ovine | Strongyles | High correlation (r = 0.93-0.98) | McMaster | 72% accuracy (OvaCyte) vs. 45% (McMaster) [26] |
*Exact sensitivity values for canine roundworm and hookworm were reported as significantly higher than traditional methods but within the 90-100% range.
Quantitative Correlation with Established Methods
Table 2: Correlation statistics between OvaCyte and established FEC methods
| Host Species | Correlation Metric | Value | Comparative Method |
|---|---|---|---|
| Equine | Strongyle egg count correlation (ρ) | ≥ 0.94 | McMaster & Mini-FLOTAC [66] |
| Ovine | Strongyle egg count correlation (r) | 0.93 (field samples) | McMaster [26] |
| Ovine | Strongyle egg count correlation (r) | 0.98 (experimental samples) | McMaster [26] |
| Ovine | Precision (Coefficient of Variation) | 5.6-40% | More precise than McMaster [26] |
Specificity and Agreement Metrics
Table 3: Specificity and statistical agreement of OvaCyte with reference methods
| Host Species | Parasite Type | OvaCyte Specificity | Cohen's Kappa Agreement | Reference Specificity |
|---|---|---|---|---|
| Canine | Various GIPs | Slightly lower than flotation methods | N/A | Higher for flotation methods [65] |
| Equine | Strongyles | >0.90 | High | >0.90 (both methods) [66] |
| Equine | Parascaris spp. | 0.96 | Moderate | 0.96 (Mini-FLOTAC), 0.99 (McMaster) [66] |
| Equine | Anoplocephala spp. | 0.95 | Low | 1.00 (both methods) [66] |
| Equine | Strongyloides westeri | 0.99 | High | 1.00 (both methods) [66] |
Experimental Protocols
Canine Gastrointestinal Parasite Detection Protocol
Sample Collection and Preparation:
- Collect 40g fresh fecal samples and store at 4°C if not processed immediately [65].
- For OvaCyte analysis, place 2g of well-mixed fecal material into the provided tube [65].
- Seal tube with filter cap and add 12mL of proprietary OvaCyte flotation fluid (specific gravity not specified) [65].
- Homogenize thoroughly by gently squeezing the tube until fecal matter is completely dislodged and mixed [65] [68].
Automated Analysis Procedure:
- Draw homogenized slurry into a 20mL syringe, ensuring no air bubbles are present [65].
- Transfer solution to OvaCyte Pet cassette and place on instrument [65].
- Initiate automated sequence: shaking phase followed by flotation phase and image capture (~250 images) [65].
- AI model analyzes images in cloud-based system, identifying and counting eggs/oocysts [65].
- Results reported as eggs/oocysts per gram (epg/opg) with multiplication factor [65].
Quality Control:
- AI includes specialized filter for distinguishing similar eggs (e.g., T. vulpis and Capillaria spp.) based on major and minor axis measurements [65].
- Total hands-on time: approximately 2 minutes [67] [68].
- Total processing time: less than 20 minutes [68].
Equine Strongyle Egg Count Protocol
Sample Preparation:
- Mix multiple fecal balls to ensure even egg distribution [66].
- Add fecal matter to graduated cylinder containing 42mL saturated sodium chloride solution (NaCl, SG 1.2) until total volume reaches 45mL (3g feces, 1:14 dilution) [66].
- Homogenize with floatation fluid using spatula and filter through tea strainer followed by 212μm wire mesh [66].
Comparative Analysis:
- Process prepared filtrate in parallel using OvaCyte, McMaster, and Mini-FLOTAC techniques [66].
- For OvaCyte, follow standard protocol with species-specific AI model for equine parasites [66] [67].
- For McMaster, use standard chamber counting technique [66].
- For Mini-FLOTAC, use apparatus with equivalent flotation solution [66].
Statistical Evaluation:
- Calculate correlation coefficients for pairwise comparisons of egg counts [66].
- Dichotomize outcomes for Cohen's kappa agreement statistics [66].
- Perform Bayesian latent class analysis to estimate sensitivity and specificity in absence of gold standard [66].
Ovine Strongyle Egg Count Validation Protocol
Experimental Design:
- Experiment A: Process feces with three known egg concentrations using OvaCyte (extended and standard mode) in parallel with McMaster [26].
- Experiment B: Use spiked fecal samples with different egg concentrations [26].
- Field Validation: Analyze samples from naturally infected sheep [26].
Sample Processing:
- Use identical sample preparations processed in parallel with both OvaCyte and McMaster methods [26].
- For OvaCyte, use OvinePlus model with appropriate flotation solution [26].
- Assess accuracy, precision, and sensitivity across multiple replicates [26].
Data Analysis:
- Calculate correlation coefficients between methods for experimental and field samples [26].
- Determine within-replicate variability for both methods at all concentrations [26].
- Compare proportion of egg-positive samples detected by each method [26].
Workflow and System Architecture
Research Reagent Solutions
Table 4: Essential research materials for OvaCyte system implementation
| Reagent/Material | Specification | Function in Protocol |
|---|---|---|
| OvaCyte Flotation Fluid | Proprietary formulation | Enables egg flotation through specific gravity optimization [65] |
| Saturated Sodium Chloride (NaCl) | Specific gravity 1.2 | Traditional flotation solution for comparative methods [66] |
| Zinc Sulfate (ZnSO₄) | Specific gravity 1.2 | Flotation solution for parasite oocysts in canine studies [65] |
| OvaCyte Sample Tubes | With filter caps | Contain feces and flotation fluid during homogenization [65] |
| OvaCyte Cassettes | High-volume, disposable | Hold prepared sample for automated imaging [65] [68] |
| Tea Strainer | Standard kitchen type | Removes large particulate debris during initial filtration [65] [66] |
| Wire Mesh Filter | 212μm aperture | Removes smaller debris while allowing parasite eggs to pass [66] |
Discussion
The OvaCyte system demonstrates consistently high sensitivity across multiple host species, particularly for clinically significant parasites. In canine samples, its performance in detecting Cystoisospora spp. (90%) and Capillaria spp. (100%) significantly outperformed all flotation methods (P < 0.001) [65]. The system showed remarkable sensitivity for equine strongyles (98%) and Parascaris spp. (96%), though with slightly lower specificity for some parasite species [66]. For ovine strongyles, the strong correlation (r = 0.93-0.98) with McMaster counts and superior precision (CV 5.6-40%) indicates reliable quantitative performance [26].
The slightly lower specificity observed for certain parasites in equine samples [66] and canine samples [65] suggests the AI classification algorithms may benefit from further refinement to reduce false positives. However, the significantly higher sensitivity for challenging-to-detect parasites like Anoplocephala spp. in horses (86% vs. 44-46% for traditional methods) [66] represents a substantial diagnostic advancement.
From a research perspective, the OvaCyte system addresses critical limitations of traditional FEC methods, including operator fatigue, inter-technician variability, and the extensive training requirements for accurate morphological identification [66] [1]. The automated digital workflow enables standardized data collection essential for anthelmintic efficacy trials and longitudinal parasitological studies.
The cloud-based architecture facilitates continuous improvement of AI algorithms and potential expansion to additional parasite species [68]. This system represents a significant step toward fully automated, point-of-care parasitological diagnostics that can generate consistent, reproducible data for research and drug development applications.
The validation of automated diagnostic systems, such as a USB microscope-based fecal egg counting (FEC) system, requires rigorous assessment using standardized performance metrics. In parasitology research, these metrics determine the reliability and diagnostic power of egg counting techniques, guiding scientists and drug development professionals in selecting appropriate methods for their specific applications. The fundamental parameters—sensitivity, specificity, precision, and accuracy—each provide distinct insights into technical performance, while correlation coefficients offer statistical evidence of method agreement [69]. Understanding these metrics is paramount for researchers developing automated counting systems, as they form the quantitative foundation for evaluating system performance against established reference methods and for demonstrating improved diagnostic capabilities in the field of veterinary parasitology.
The terminology used in evaluating FEC techniques requires precise application, as parameters like "analytical sensitivity" are often misused when referring to the detection limit, creating confusion in the literature [69]. Furthermore, quantitative performance parameters, particularly accuracy and precision, hold significant relevance for FEC techniques, with precision being arguably the more important of the two for comparative studies [69]. This protocol details the methodology for calculating these critical metrics and establishing their statistical significance within the context of automated fecal egg counting system validation.
Key Performance Metrics: Definitions and Calculations
Qualitative Diagnostic Parameters
Qualitative parameters determine a technique's ability to correctly classify samples as positive or negative for the presence of parasite eggs. While these metrics are fundamental, their relevance is most pronounced at low egg count levels接近检测限时最相关 [69].
Sensitivity: The proportion of true positive samples correctly identified as positive by the test. Also known as the true positive rate.
- Calculation: Sensitivity = [True Positives / (True Positives + False Negatives)] × 100
- Application Note: In FEC studies, sensitivity is highly dependent on the egg count level. For instance, at very low egg concentrations (e.g., 50 EPG), the Mini-FLOTAC method demonstrated significantly higher sensitivity (100%) compared to the McMaster technique (0-66.6%) in cattle gastrointestinal nematode detection [70].
Specificity: The proportion of true negative samples correctly identified as negative by the test. Also known as the true negative rate.
- Calculation: Specificity = [True Negatives / (True Negatives + False Positives)] × 100
- Application Note: Specificity is crucial for confirming the absence of infection, though it is less frequently the focus in FEC comparative studies where the primary goal is often quantification rather than pure presence/absence detection [69].
Quantitative Diagnostic Parameters
Quantitative parameters assess how well a technique measures the magnitude of egg excretion, which is critical for assessing infection intensity and anthelmintic efficacy.
Accuracy: The closeness of agreement between a measured value and the true value. In FEC, this is often expressed as the recovery rate—the percentage of known eggs recovered by the technique.
- Calculation: Accuracy (Recovery Rate) = (Observed FEC / True FEC) × 100
- Application Note: Studies using egg-spiked faecal samples have shown significant differences in accuracy between methods. For example, the McMaster technique showed higher overall recovery rates (74.6%) compared to Mini-FLOTAC (60.1%) in chicken faeces, though this varies with flotation fluid and egg count levels [71].
Precision: The closeness of agreement between independent test results obtained under stipulated conditions. Precision is often reported as the coefficient of variation (CV).
- Calculation: CV = (Standard Deviation / Mean Egg Count) × 100
- Application Note: Precision is arguably more important than accuracy for FEC techniques used in comparative studies such as fecal egg count reduction tests (FECRT) [69]. Mini-FLOTAC demonstrates higher precision (CV of 10.0%) compared to McMaster (CV of 47.5-69.4%) in cattle GI nematode detection across multiple egg count levels [70].
Table 1: Performance Comparison of Fecal Egg Counting Techniques
| Technique | Overall Sensitivity | Overall Accuracy (Recovery Rate) | Precision (Coefficient of Variation) | Analytical Sensitivity (EPG) |
|---|---|---|---|---|
| Mini-FLOTAC | 100% [70] | 60.1-98.1% [71] [70] | 10.0% [70] | 5 EPG [70] |
| McMaster (Grids) | 0-66.6% (<100 EPG) [70] | 74.6-83.2% [71] [70] | 47.5% [70] | 50 EPG [70] |
| McMaster (Chambers) | 0-66.6% (<100 EPG) [70] | 63.8% [70] | 69.4% [70] | 15 EPG [70] |
| Kato-Katz | 88.1% (A. lumbricoides) [72] | Varies by parasite species [72] | Not consistently reported | Protocol-dependent |
Correlation Coefficients for Method Comparison
Correlation coefficients provide a statistical measure of the relationship between two measurement techniques, which is particularly valuable when validating new automated systems against established manual methods.
Pearson's Correlation Coefficient (r): Measures the strength and direction of the linear relationship between two variables. It is not sensitive to differences in mean signal intensities or range [73].
- Range: +1 (perfect positive correlation) to -1 (perfect negative correlation)
- Application Note: A study comparing McMaster and Kato-Katz for soil-transmitted helminths in human stool found significant correlation (R~s~ >0.32) for all parasites, though the strength varied by species [72]. For automated systems, Pearson's correlation between manual and automated counts from the same samples validates the fundamental counting accuracy.
Manders' Split Coefficients (M1 and M2): Proportional to the amount of fluorescence of the colocalizing pixels, these coefficients express the fraction of intensity in a channel that is located in pixels where there is above-zero intensity in the other channel [73]. While developed for fluorescence microscopy, these principles can be adapted for automated egg counting to determine the coincidence of detection events between different analytical methods.
- Range: 0 to 1
- Application Note: Manders' coefficients are useful when the correlation between two methods is not proportional, such as when one technique systematically undercounts or overcounts compared to another [73].
Table 2: Correlation Coefficients in Microscopy and Diagnostic Applications
| Coefficient | Statistical Relationship Measured | Value Range | Primary Application in FEC |
|---|---|---|---|
| Pearson's (r) | Linear relationship between two variables | -1 to +1 | Overall agreement between manual and automated counts |
| Spearman's (ρ) | Monotonic relationship (based on rank) | -1 to +1 | Method comparison when relationship is not strictly linear |
| Manders' (M1, M2) | Fraction of signal colocalizing above a threshold | 0 to 1 | Proportional agreement between techniques |
| Intraclass Correlation | Agreement between measures of the same class | 0 to 1 | Consistency between repeated measures or observers |
Experimental Protocols for Metric Validation
Protocol 1: Determining Sensitivity and Specificity Using Spiked Samples
Purpose: To establish the diagnostic sensitivity and specificity of an automated fecal egg counting system across clinically relevant egg concentration ranges.
Materials:
- Negative fecal samples (confirmed parasite-free)
- Concentrated egg suspension with known concentration
- Standard laboratory equipment for fecal sample processing
- USB microscope automated counting system
- Reference method (e.g., Mini-FLOTAC or McMaster)
Procedure:
- Sample Preparation: Prepare egg-spiked fecal samples at five different concentrations: 10, 50, 100, 200, and 500 eggs per gram (EPG) using the dilution series method [70]. Use a minimum of 12 replicates per concentration level to ensure statistical power.
- Blinded Analysis: Process each sample through the automated USB microscope system following standardized protocols. The operator should be blinded to the expected egg concentrations to prevent bias.
- Reference Testing: Simultaneously process aliquots of the same spiked samples using an established reference method with known performance characteristics.
- Data Collection: Record both qualitative (positive/negative) and quantitative (EPG) results from both methods. For qualitative assessment, establish a detection threshold based on the system's analytical sensitivity.
- Calculation: Construct a 2×2 contingency table comparing the automated system results to the known status of samples (for sensitivity) and to negative controls (for specificity). Calculate sensitivity and specificity with 95% confidence intervals.
Troubleshooting Notes:
- If sensitivity is low at specific EPG ranges, investigate the image processing algorithms and detection thresholds for potential optimization.
- If specificity is compromised (high false positives), review the classification algorithms for non-egg particles that may be misclassified.
Protocol 2: Assessing Accuracy and Precision
Purpose: To determine the quantitative accuracy (recovery rate) and precision (coefficient of variation) of the automated counting system.
Materials:
- Precisely spiked fecal samples with known egg concentrations (true EPG)
- Automated USB microscope system
- Data recording spreadsheet
Procedure:
- Sample Preparation: Create a dilution series of spiked samples covering the expected working range of the system (e.g., 50-1000 EPG). Determine the true concentration of the spiked samples using highly accurate methods such as volumetric counting or flow cytometry where possible.
- Repeated Measures: Process each sample repeatedly (minimum n=10) using the automated system. Ensure samples are thoroughly homogenized between replicates to minimize technical variation.
- Data Analysis:
- Calculate accuracy as: (Mean Observed FEC / True FEC) × 100
- Calculate precision as: (Standard Deviation / Mean) × 100 for each concentration level
- Trend Analysis: Plot recovery rates and coefficients of variation against egg concentrations to identify any concentration-dependent performance characteristics.
Application Note: Research indicates that precision tends to be lower at low egg counts and improves with increasing egg concentrations. For example, one study showed McMaster precision increasing from 22% to 87% as egg counts rose from 50 to 1250 EPG [71]. Your automated system should demonstrate a similar or improved pattern.
Protocol 3: Method Comparison Using Correlation Coefficients
Purpose: To validate the automated USB microscope system against established reference methods using statistical correlation measures.
Materials:
- Field samples with naturally varying egg counts (n≥30)
- Automated USB microscope system
- Reference method (e.g., Mini-FLOTAC, McMaster, or Kato-Katz)
- Statistical analysis software
Procedure:
- Sample Collection: Collect fresh fecal samples from naturally infected hosts, ensuring a wide range of egg counts is represented from negative to high positive.
- Parallel Processing: Divide each sample and process simultaneously using both the automated system and the reference method. Maintain consistent technical procedures throughout.
- Data Collection: Record quantitative EPG values from both methods. Ensure the sample size is sufficient (typically n≥30) for correlation analysis.
- Statistical Analysis:
- Calculate Pearson's correlation coefficient to assess linear relationship
- Generate a Bland-Altman plot to visualize agreement and identify any systematic biases
- Perform regression analysis to derive conversion equations if necessary
- Validation: Establish predetermined acceptability criteria (e.g., r > 0.85, no significant bias in Bland-Altman plot) before beginning the experiment.
Advanced Application: For super-resolution imaging or when signals don't perfectly overlap, consider implementing cross-correlation function (CCF) analysis, which identifies spatial correlation as a function of distance rather than requiring perfect pixel overlap [74]. This method is particularly valuable when validating enhanced imaging systems with improved resolution.
The Scientist's Toolkit: Essential Research Reagents and Materials
Table 3: Essential Research Reagents and Materials for FEC Method Validation
| Item | Function | Application Notes |
|---|---|---|
| Saturated Sodium Chloride Solution | Flotation fluid (specific gravity = 1.20) | Standard flotation fluid for nematode eggs; cost-effective but may distort delicate eggs [71] |
| Sugar Solution | Flotation fluid (specific gravity = 1.32) | Higher specific gravity solution; increases accuracy of both McMaster and Mini-FLOTAC by approximately 10% but increases processing time [71] |
| McMaster Slide | Reference counting chamber | Established reference method; multiplication factor varies (typically 15-50) based on chamber design [71] [70] |
| Mini-FLOTAC Apparatus | Reference counting chamber | Emerging reference standard; provides higher sensitivity and precision than McMaster, especially at low EPG [70] |
| Digital USB Microscope | Image acquisition for automated counting | Critical component; ensure adequate resolution (≥2MP) and compatible magnification (100-400x) for egg detection |
| Image Analysis Software | Automated egg identification and counting | Custom or commercial software implementing machine learning algorithms for pattern recognition |
Workflow Visualization: Experimental Validation Pathway
Validation Workflow for Automated FEC Systems
Advanced Applications: Correlation Analysis in Automated Systems
Correlation Analysis Methods for System Validation
For advanced automated systems, particularly those employing super-resolution capabilities, traditional pixel-wise colocalization analyses (like Pearson's correlation) may prove insufficient as improved resolution reduces signal overlap [74]. In these cases, spatial cross-correlation methods such as Colocalization by Cross-Correlation (CCC) provide superior analytical capabilities by identifying correlations as a function of distance rather than requiring direct overlap [74].
When implementing these advanced correlation techniques, proper image pre-processing is essential:
- Convert images to formats supporting negative values (e.g., 32-bit) before background subtraction
- Prepare segmented image masks defining foreground and background regions
- Ensure accurate image scaling metadata is present in all dimensions
- Apply deconvolution algorithms to enhance effective resolution [75]
The output from cross-correlation analysis includes confidence values (0-1) indicating the likelihood of true spatial correlation, with higher values indicating more reliable results. This approach is particularly valuable when validating automated systems against each other or against higher-resolution reference methods.
The rigorous validation of automated fecal egg counting systems requires comprehensive assessment across multiple performance metrics. Sensitivity, specificity, accuracy, and precision each provide distinct insights into system performance, while correlation coefficients offer statistical evidence of method agreement with established techniques. The protocols outlined herein provide a standardized framework for researchers and drug development professionals to quantitatively validate their automated systems, ensuring reliable performance across the spectrum of diagnostic applications. As automated systems continue to evolve, implementing these robust validation methodologies will be essential for advancing parasite diagnostics and anthelmintic development programs.
Conclusion
Automated fecal egg counting systems that combine USB digital microscopy with artificial intelligence represent a significant leap forward for parasitology research and anthelmintic development. These systems address critical limitations of traditional methods by enhancing throughput, standardizing results, reducing human error, and enabling field-based applications. Validation studies consistently demonstrate strong agreement with established techniques, with several automated systems showing superior sensitivity, particularly for low-level infections. Future directions should focus on refining AI algorithms to expand the range of detectable parasite species, improving affordability and accessibility for wider deployment, and fully integrating these systems into digital platforms for data management and remote consultation. Their adoption promises to accelerate drug efficacy studies, improve parasite control strategies, and provide more robust tools for monitoring anthelmintic resistance.
References
- 1. #AI-Powered Microscopy Aims to Save North Carolina ... [https://ncinnovation.org/media/ai-powered-microscopy-aims-to-save-north-carolina-farmers-millions/]
- 2. Comparison between methods for measuring fecal egg ... [https://pmc.ncbi.nlm.nih.gov/articles/PMC8703008/]
- 3. Comparative studies on faecal egg counting techniques ... [https://www.sciencedirect.com/science/article/pii/S2667114X21000406]
- 4. A dedicated deep learning workflow for automatic Fasciola ... [https://www.sciencedirect.com/science/article/pii/S0020751925001419]
- 5. The Fecal Egg Count Reduction Test using the Wisconsin ... [https://www.ksvdl.org/resources/news/diagnostic_insights_for_technicians/april2017/fecal.html]
- 6. USB Microscope Camera in the Real World: 5 Uses You'll ... [https://www.linkedin.com/pulse/usb-microscope-camera-real-world-5-uses-youll-gav8f/]
- 7. Relative egg extraction efficiencies of manual and ... [https://pmc.ncbi.nlm.nih.gov/articles/PMC11038241/]
- 8. USB Microscope Drivers and Software [https://plugable.com/pages/microscope-drivers?srsltid=AfmBOorc1Mpy4ooQVwcmUdoc1ShOZwS-WPZOBeZJYi4F2jylodsr0hs6]
- 9. Digital USB Microscope Market Predictions and ... [https://www.datainsightsmarket.com/reports/digital-usb-microscope-1532722]
- 10. AI-supported versus manual microscopy of Kato-Katz ... [https://www.nature.com/articles/s41598-025-07309-7]
- 11. Laboratory validation of the automated diagnosis of intestinal ... [https://parasitesandvectors.biomedcentral.com/articles/10.1186/s13071-024-06434-y]
- 12. A Modified Sample Preparation Protocol for High-Efficiency ... [https://www.mdpi.com/2072-666X/16/8/847]
- 13. Automating parasite egg detection: insights from the first AI ... [https://www.frontiersin.org/journals/artificial-intelligence/articles/10.3389/frai.2024.1325219/full]
- 14. Comparison of ovine faecal Strongyle egg counts from an ... [https://www.sciencedirect.com/science/article/abs/pii/S0304401723001073]
- 15. The Kubic FLOTAC microscope (KFM): a new compact ... [https://pmc.ncbi.nlm.nih.gov/articles/PMC7938342/]
- 16. The clinical application value of the KU-F40 fully automatic ... [https://www.nature.com/articles/s41598-025-09935-7]
- 17. Automated Fecal Egg Count Analyzers Market [https://dataintelo.com/report/automated-fecal-egg-count-analyzers-market]
- 18. Development of a Lab-on-a-Disk Platform with Digital ... [https://www.mdpi.com/2072-666X/10/12/852]
- 19. parasite Automated using fluorescence labelling... faecal egg counting [https://pubmed.ncbi.nlm.nih.gov/27025771/]
- 20. Choosing Your Ideal Digital Microscope: The Essential Guide [https://evidentscientific.com/en/insights/choosing-your-ideal-digital-microscope-the-essential-guide]
- 21. How to Use a Digital Microscope: Setup, Focus & Tips [https://tomlov.com/blogs/blog/how-to-use-digital-microscope?srsltid=AfmBOors-yQgcjXj8PUvCBAcjmSsGQTdnlxnOwFE4jBRivrN76AN-gqk]
- 22. Comparative assessment of Mini-FLOTAC, McMaster and ... [https://parasitesandvectors.biomedcentral.com/articles/10.1186/s13071-024-06637-3]
- 23. Comparing the Performance of McMaster, FLOTAC and ... [https://www.mdpi.com/2076-0817/14/11/1075]
- 24. A comparison of Mini-FLOTAC and McMaster techniques ... [https://www.sciencedirect.com/science/article/pii/S2667114X22000292]
- 25. Mini-FLOTAC, an Innovative Direct Diagnostic Technique for ... [https://pmc.ncbi.nlm.nih.gov/articles/PMC3731229/]
- 26. Comparative evaluation of an AI-based counting system ... [https://www.sciencedirect.com/science/article/pii/S030440172500144X]
- 27. Flotation techniques (FLOTAC and mini- ... [https://pmc.ncbi.nlm.nih.gov/articles/PMC5701314/]
- 28. Mini-FLOTAC, Kato-Katz and McMaster: three methods, one ... [https://parasitesandvectors.biomedcentral.com/articles/10.1186/1756-3305-7-271]
- 29. Appalachian State University Develops AI-Driven Robotic ... [https://www.govtech.com/education/higher-ed/appalachian-state-university-develops-ai-driven-robotic-microscope]
- 30. FECPAK uses AI to give farmers instant FEC results [https://fecpak.com/nz/resources/media-releases/may-2025]
- 31. Guide to Performing McMaster's Fecal Egg Count for Small ... [https://edis.ifas.ufl.edu/publication/VM266]
- 32. ZEISS Celldiscoverer 7 – High-Quality Data Acquisition ... [https://www.zeiss.com/microscopy/us/products/imaging-systems/celldiscoverer-7.html]
- 33. ImageXpress Pico Automated Cell Imaging System [https://www.moleculardevices.com/products/cellular-imaging-systems/high-content-imaging/imagexpress-pico]
- 34. The faecal egg count reduction test: Will identification of ... [https://www.sciencedirect.com/science/article/pii/S2211320725000120]
- 35. Faecal egg count reduction test, deep amplicon ... [https://pmc.ncbi.nlm.nih.gov/articles/PMC12444184/]
- 36. McMaster egg counting technique: Calculation of results [https://www.rvc.ac.uk/static/review/parasitology/EggCount/Calculation.htm]
- 37. Digital Image Analysis to Estimate the Minimum Number of ... [https://pmc.ncbi.nlm.nih.gov/articles/PMC6662016/]
- 38. 9 Best Digital Microscopes (Fall 2025 ) – The Complete Guide [https://theoptics.org/best-digital-microscope/]
- 39. Training Set Design for Uneven Correction in... Illumination [https://pubmed.ncbi.nlm.nih.gov/40510308/]
- 40. The effect of counting duration on quantitative fecal egg ... [https://www.sciencedirect.com/science/article/pii/S2590138919300165]
- 41. USB microscopes: What are they? | A full guide by TAGARNO [https://tagarno.com/blog/alternative-to-usb-microscopes/]
- 42. How Microscopy Software Works — In One Simple Flow ... [https://www.linkedin.com/pulse/how-microscopy-software-works-one-simple-flow-2025-5zske/]
- 43. Efficacy of USB microscopes for imaging forensic materials [https://www.sciencedirect.com/science/article/abs/pii/S0379073819303731]
- 44. Automated parasite faecal egg counting using ... [https://www.sciencedirect.com/science/article/abs/pii/S0020751916300042]
- 45. AI-based hardware and software tools in microscopy to boost ... [https://pmc.ncbi.nlm.nih.gov/articles/PMC12518252/]
- 46. AI Optimization in 2025: Smarter Techniques and Tools [https://www.rolustech.com/blog/ai-optimization-2025]
- 47. Optimize AI Models Like a Pro: 10 Techniques for Better ... [https://www.artiba.org/blog/optimize-ai-models-like-a-pro-10-techniques-for-better-results]
- 48. Addressing AI bias: a human-centric approach to fairness [https://www.ey.com/en_us/insights/emerging-technologies/addressing-ai-bias-a-human-centric-approach-to-fairness]
- 49. Small Ruminant Q & A | DIY fecal egg counting [http://www.sheep101.info/QandA/DIYFEC.html]
- 50. Medical Imaging Equipment: Preventive Maintenance for ... [https://oxmaint.com/blog/post/medical-imaging-equipment-preventive-maintenance-for-diagnostic-accuracy]
- 51. Maintaining Your Digital Pathology Equipment: Essential ... [https://www.grundium.com/blog/maintaining-your-digital-pathology-equipment-essential-care-practices/]
- 52. Microscope Cleaning & Maintenance: Expert Guide for ... [https://www.zeiss.com/microscopy/en/resources/insights-hub/foundational-knowledge/microscope-cleaning--maintenance.html]
- 53. How to Clean and Sterilize a Digital Microscope? [https://precipoint.com/en/digital-microscopy/how-to-clean-and-sterilize-a-digital-microscope]
- 54. A Guide for the Deployment, Validation, and Accreditation ... [https://www.preprints.org/manuscript/202509.1090]
- 55. Validating Whole Slide Imaging for Diagnostic Purposes ... [https://www.cap.org/protocols-and-guidelines/cap-guidelines/current-cap-guidelines/validating-whole-slide-imaging-for-diagnostic-purposes-in-pathology]
- 56. Automating parasite egg detection: insights from the first AI ... [https://pmc.ncbi.nlm.nih.gov/articles/PMC11390596]
- 57. Evaluation of the AiDx Assist device for automated ... [https://www.frontiersin.org/journals/parasitology/articles/10.3389/fpara.2025.1440299/full]
- 58. How Differential Interference Contrast Works — In One... Microscopy [https://www.linkedin.com/pulse/how-differential-interference-contrast-microscopy-tidhe]
- 59. Comparison of McMaster and Mini-FLOTAC techniques for the ... [https://pmc.ncbi.nlm.nih.gov/articles/PMC10062010/]
- 60. Comparison of the Automated OvaCyte Telenostic Faecal ... [https://www.mdpi.com/2076-2615/13/24/3874]
- 61. The Kubic FLOTAC microscope (KFM): a new compact ... [https://pubmed.ncbi.nlm.nih.gov/33213534/]
- 62. The Kubic FLOTAC microscope (KFM): a new compact ... [https://www.cambridge.org/core/journals/parasitology/article/kubic-flotac-microscope-kfm-a-new-compact-digital-microscope-for-helminth-egg-counts/8CCA3F011B5AB0CAD0FC8AB4B7B07417]
- 63. Improving Diagnosis of Intestinal Parasites Towards a ... [https://link.springer.com/article/10.1007/s40475-022-00280-7]
- 64. A Qualitative Market Analysis Applied to Mini-FLOTAC and ... [https://www.frontiersin.org/journals/veterinary-science/articles/10.3389/fvets.2020.580649/full]
- 65. Comparing the performance of OvaCyte and traditional ... [https://parasitesandvectors.biomedcentral.com/articles/10.1186/s13071-025-06935-4]
- 66. Comparison of the Automated OvaCyte Telenostic Faecal ... [https://pmc.ncbi.nlm.nih.gov/articles/PMC10740962/]
- 67. About OvaCyte [https://www.telenostic.com/about-ovacyte/]
- 68. AI-Powered fecal analysis for parasites [https://www.dvm360.com/view/ai-powered-fecal-analysis-for-parasites]
- 69. What makes a good fecal egg count technique? [https://pubmed.ncbi.nlm.nih.gov/34218175/]
- 70. Cattle gastrointestinal nematode egg-spiked faecal samples [https://parasitesandvectors.biomedcentral.com/articles/10.1186/s13071-020-04107-0]
- 71. Accuracy and precision of McMaster and Mini-FLOTAC egg ... [https://www.sciencedirect.com/science/article/abs/pii/S0304401720301382]
- 72. A Comparison of the Sensitivity and Fecal Egg Counts of the ... [https://journals.plos.org/plosntds/article?id=10.1371/journal.pntd.0001201]
- 73. Colocalization Analysis [https://imagej.net/imaging/colocalization-analysis]
- 74. Colocalization by cross-correlation, a new method of ... [https://bmcbioinformatics.biomedcentral.com/articles/10.1186/s12859-024-05675-z]
- 75. Microscopy colocalization theoretical background [https://svi.nl/ColocalizationTheory]