Accurate qPCR Differentiation of Entamoeba histolytica vs. dispar: A Complete Guide for Researchers & Drug Developers
This comprehensive guide explores the critical importance of differentiating the pathogenic Entamoeba histolytica from its non-pathogenic counterpart, E.
Accurate qPCR Differentiation of Entamoeba histolytica vs. dispar: A Complete Guide for Researchers & Drug Developers
Abstract
This comprehensive guide explores the critical importance of differentiating the pathogenic Entamoeba histolytica from its non-pathogenic counterpart, E. dispar, using quantitative PCR (qPCR) methodologies. Tailored for researchers, scientists, and drug development professionals, the article begins with foundational knowledge on the clinical and public health implications of accurate differentiation. It then details current, optimized qPCR protocols, primer/probe designs, and best practices for application in clinical and research settings. The guide further addresses common troubleshooting scenarios, assay optimization strategies, and critical validation steps. Finally, it provides a comparative analysis of qPCR against other diagnostic methods (microscopy, culture, ELISA), evaluating sensitivity, specificity, cost, and throughput. The synthesis empowers professionals to implement robust, reliable differentiation assays essential for accurate diagnosis, epidemiological studies, and therapeutic development.
Entamoeba histolytica vs. dispar: Why Differentiation Matters in Research and Therapeutics
Within the context of molecular parasitology research, particularly the differentiation of Entamoeba histolytica and Entamoeba dispar via qPCR, understanding the divergent clinical outcomes of these morphologically identical species is paramount. This whitepaper delineates the significant global disease burden imposed by pathogenic E. histolytica and contrasts it with the commensal nature of E. dispar, framing this imperative within the necessity for precise diagnostic tools. Accurate differentiation is not merely academic; it directs clinical management, controls inappropriate drug use, and focuses public health resources on true amebiasis.
Global Disease Burden of Amebiasis Caused byE. histolytica
Entamoeba histolytica is the causative agent of amebiasis, a leading parasitic cause of death worldwide. It is responsible for invasive intestinal and extra-intestinal disease, including amebic colitis and liver abscess.
Table 1: Global Burden of Amebiasis (Recent Estimates)
| Metric | Value | Source/Notes |
|---|---|---|
| Annual Deaths | 40,000 - 100,000 | WHO estimates; remains a top parasitic killer. |
| Annual Morbidity (Symptomatic Cases) | ~50 million | Leading to ~4 million cases of invasive disease. |
| Prevalence (Global) | ~500 million carriers | Majority are asymptomatic cyst passers. |
| Disability-Adjusted Life Years (DALYs) | ~2.4 million | Significant contributor to global diarrheal disease burden. |
| High-Risk Regions | Tropical & subtropical: South Asia, Africa, Latin America, Mexico | Linked to poor sanitation and socioeconomic factors. |
| Case Fatality Rate (Amebic Liver Abscess) | 1-3% (with treatment) | Can exceed 40% if untreated or with complications. |
The CommensalEntamoeba dispar: Epidemiology and Implications
E. dispar is genetically distinct but microscopically identical to E. histolytica. It colonizes the human gut but does not invade tissues or cause disease. Its prevalence is significantly higher than E. histolytica in many regions.
Table 2: Contrasting Features of E. histolytica and E. dispar
| Feature | Entamoeba histolytica | Entamoeba dispar |
|---|---|---|
| Pathogenic Potential | Pathogenic; causes invasive disease. | Non-pathogenic commensal. |
| Clinical Relevance | Requires treatment upon detection. | Does not require antiparasitic treatment. |
| Global Prevalence | ~50-100 million infections. | Much more common; often 10:1 ratio to E. histolytica. |
| Host Tissue Interaction | Lytic necrosis; invades intestinal mucosa & liver. | Non-invasive; resides in gut lumen. |
| Key Virulence Factors | Gal/GalNAc lectin, amoebapores, cysteine proteases. | Homologous genes present but non-functional or differently expressed. |
| Public Health Imperative | Target for surveillance, diagnosis, and treatment. | Differentiation crucial to avoid misdiagnosis and unnecessary treatment. |
The Diagnostic Imperative and qPCR Differentiation
Microscopy cannot differentiate these species, leading to massive over-reporting of amebiasis. Antigen detection and molecular methods, specifically quantitative PCR (qPCR), are the gold standard.
Core qPCR Protocol for E. histolytica/dispar Differentiation
Principle: Multiplex qPCR targeting species-specific genomic sequences (e.g., 18S rRNA or other conserved genes) with TaqMan probes.
Reagents:
- Template DNA: Purified from stool (fresh, frozen, or preserved in SAF or ethanol) or abscess aspirate using a validated stool DNA kit (e.g., QIAamp PowerFecal Pro DNA Kit).
- Primers & Probes:
- E. histolytica-specific forward, reverse, and probe (e.g., FAM-labeled).
- E. dispar-specific forward, reverse, and probe (e.g., HEX/VIC-labeled).
- Internal Control primers/probe (e.g., CY5-labeled) to detect PCR inhibition.
- Master Mix: Commercial multiplex qPCR master mix (e.g., TaqPath ProAmp Master Mix).
- Equipment: Real-time PCR system with multicolor detection capability.
Procedure:
- DNA Extraction: Follow manufacturer's protocol with included bead-beating step for cyst wall disruption. Include a negative extraction control.
- qPCR Reaction Setup (20 µL):
- Multiplex Master Mix: 10 µL
- Primer/Probe Mix (final concentration optimized): 2 µL
- Template DNA (5-50 ng): 5 µL
- Nuclease-free water: to 20 µL
- Cycling Conditions:
- Activation: 95°C for 10 min (Hot-Start polymerase).
- 45 Cycles of:
- Denaturation: 95°C for 15 sec.
- Annealing/Extension: 60°C for 60 sec (data acquisition).
- Analysis:
- Set fluorescence thresholds manually or automatically.
- Determine cycle threshold (Ct) for each channel.
- Interpretation: A valid run requires no amplification in negative controls. Sample is positive for a species if Ct < 40 in the respective channel. The internal control must amplify (Ct < 35) to rule out inhibition.
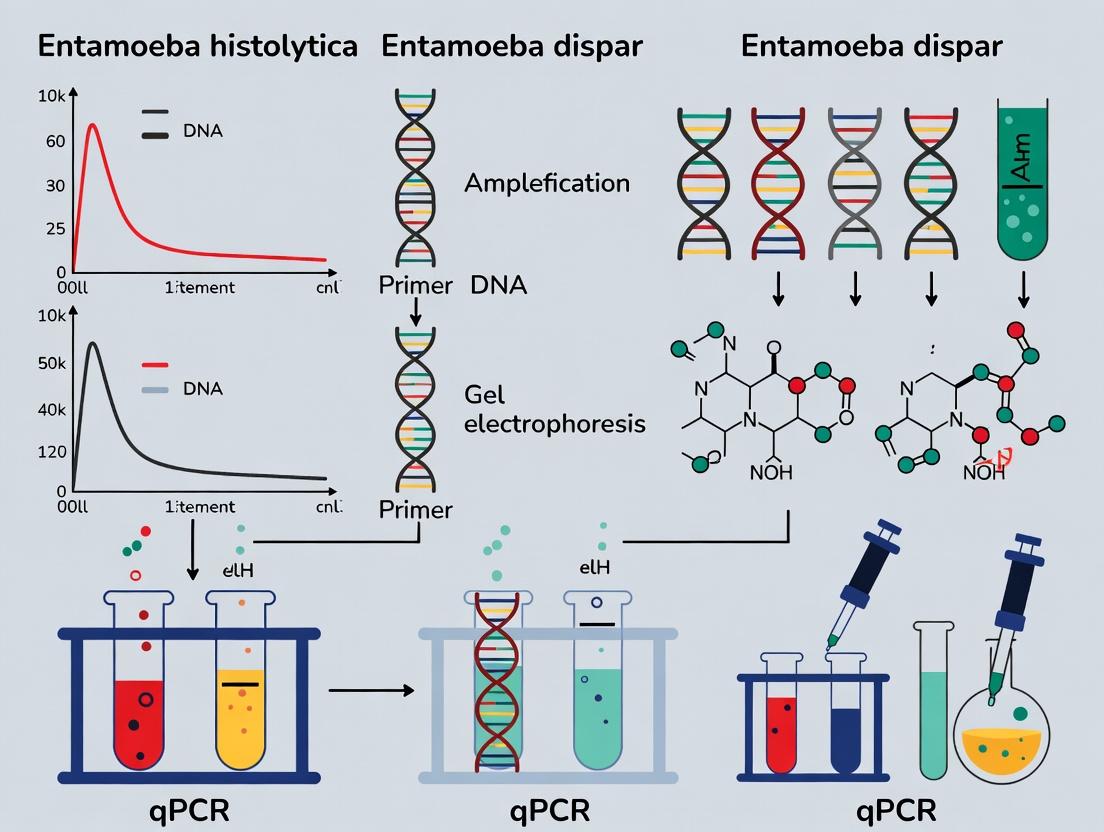
Title: qPCR Workflow for Entamoeba Differentiation
The Scientist's Toolkit: Research Reagent Solutions
Table 3: Essential Reagents for Entamoeba Differentiation Research
| Item | Function & Rationale |
|---|---|
| Stool DNA Stabilization Buffer (e.g., RNAlater, SAF) | Preserves nucleic acids immediately upon collection, critical for accurate molecular analysis and preventing cyst degradation. |
| High-Efficiency Stool DNA Kit (with bead-beating) | Mechanical disruption of hardy Entamoeba cyst walls is essential for high DNA yield and sensitivity. |
| Species-Specific TaqMan Assay Kits | Validated primer/probe sets for E. histolytica, E. dispar, and E. moshkovskii ensure specific, reproducible differentiation. |
| Multiplex qPCR Master Mix | Optimized for simultaneous detection of multiple targets with internal controls, saving sample and time. |
| Quantified Genomic DNA Standards | Cloned target sequences for generating standard curves are vital for absolute quantification and assay validation. |
| Cultured Trophozoites (Axenic E. histolytica HM-1:IMSS, E. dispar SAW760) | Provide positive control material for molecular assays and are essential for fundamental pathogenicity research. |
| Anti-Gal/GalNAc Lectin Antibodies | Key tool for studying the primary virulence factor of E. histolytica in adhesion and invasion assays. |
Title: Pathogenic vs Commensal Outcome from Genetic Divergence
Accurate differentiation between Entamoeba histolytica and Entamoeba dispar is a cornerstone of clinical diagnosis and epidemiological research, as these morphologically identical amoebae exhibit starkly divergent pathogenic potential. This whitepaper serves as a technical guide within a broader thesis focused on advancing qPCR-based differentiation methodologies. It details the critical genetic and virulence factor disparities that form the molecular basis for such assays, enabling researchers and drug development professionals to target E. histolytica-specific pathogenicity mechanisms.
Core Genomic and Genetic Differences
While E. histolytica and E. dispar share ~90% genome sequence identity, key differences underlie pathogenicity.
Table 1: Comparative Genomic Features
| Feature | Entamoeba histolytica (HM-1:IMSS) | Entamoeba dispar (SAW760) |
|---|---|---|
| Estimated Genome Size | ~20 Mb (14 chromosomes) | ~23 Mb (14 chromosomes) |
| Coding Genes | ~8,200 | ~8,900 |
| tRNA Genes | ~70 | ~200 |
| Repetitive Elements | Abundant SINEs (EhSINEs) | Different SINE repertoire (EdSINEs) |
| Key Divergent Loci | Gal/GalNAc lectin, cysteine proteases, amoebapore genes | Homologs present but with sequence and copy number variations |
Experimental Protocol: Species-Specific qPCR Assay
- Primer/Probe Design: Target multicopy, species-specific loci. Common targets include the 18S rRNA gene or the serine-rich E. histolytica protein (SREHP) gene.
- E. histolytica Forward: 5'-GCA TCA ATT GAA GAG ATT TGT-3'
- E. histolytica Reverse: 5'-GCC TTC CCC TTC CGT CTA-3'
- Probe: [FAM]-AGC CAC ACT GAC TAT CCC-[MGBNFQ]
- DNA Extraction: Use a commercial stool DNA kit with mechanical lysis (bead beating) for robust cyst wall disruption.
- qPCR Mix (25 µL): 12.5 µL of 2X TaqMan Environmental Master Mix, 0.9 µM each primer, 0.25 µM probe, 5 µL of template DNA.
- Cycling Conditions: 95°C for 10 min; 45 cycles of 95°C for 15 sec and 60°C for 1 min.
- Analysis: Use a standard curve from cloned target DNA for quantification. Include negative controls and a spike-in internal control to detect PCR inhibition.
Virulence Factor Divergence
Pathogenicity in E. histolytica is multifactorial, driven by molecules either absent, divergent, or differentially expressed in E. dispar.
Table 2: Key Virulence Factor Differences
| Virulence Factor | Function | E. histolytica Status | E. dispar Status |
|---|---|---|---|
| Gal/GalNAc Lectin | Adhesion, cytolysis, immune evasion | Expressed, highly immunogenic | Structurally different; reduced binding capacity |
| Cysteine Proteases (CPs) | Degrade extracellular matrix, cleave immune factors | High activity (e.g., CP-A5, CP-A2) | Altered substrate specificity; lower proteolytic activity |
| Amoebapores | Pore-forming peptides, bacterial lysis | Three functional isoforms (A, B, C) | Genes present but sequences divergent; reduced lytic activity |
| Phagocytic Machinery | Engulfment of host cells, nutrient acquisition | Efficient, rapid | Impaired phagocytic efficiency |
Experimental Protocol: Assessing Cysteine Protease Activity via Zymography
- Sample Preparation: Culture trophozoites, lyse in non-reducing buffer. Clarify supernatant is the enzyme source.
- Gel Electrophoresis: Cast an SDS-PAGE gel co-polymerized with 0.1% gelatin as substrate. Load samples without boiling or reduction.
- Electrophoresis & Renaturation: Run gel at 4°C. Subsequently, incubate gel in 2.5% Triton X-100 for 1 hr to remove SDS and renature enzymes.
- Development Incubation: Incubate gel in activation buffer (e.g., 100 mM Na-acetate, pH 4.5, 10 mM DTT) for 16-24 hrs at 37°C.
- Staining & Analysis: Stain with Coomassie Blue. Proteolytic activity appears as clear bands against a blue background. Compare banding patterns and intensities between species.
Signaling and Pathogenicity Pathways
The differential regulation of stress response and virulence pathways is a key determinant of pathogenicity.
Title: Divergent Stress & Virulence Pathways in E. histolytica vs. E. dispar
The Scientist's Toolkit: Research Reagent Solutions
Table 3: Essential Materials for Differentiation & Virulence Research
| Item | Function / Application | Example Product / Note |
|---|---|---|
| Stool DNA Extraction Kit with Bead Beating | Efficient lysis of hardy Entamoeba cysts for molecular analysis. | QIAamp PowerFecal Pro DNA Kit |
| Species-Specific qPCR Assay Mix | Accurate, sensitive detection and quantification of E. histolytica DNA. | Custom TaqMan assays targeting 18S rRNA or SREHP gene. |
| Axenic Culture Media | For maintaining virulent E. histolytica and E. dispar reference strains. | TYI-S-33 medium, supplemented with vitamins and serum. |
| Recombinant Gal/GalNAc Lectin | Positive control for adhesion/invasion studies and immunoassays. | Purified Lgl1 subunit from E. histolytica. |
| Fluorogenic Cysteine Protease Substrate | Quantifying CP activity in cell lysates or culture supernatants. | Z-Arg-Arg-AMC (for CP-A2-like activity). |
| Specific Cysteine Protease Inhibitor | Validating the role of CPs in phenotypic assays. | E-64 (irreversible inhibitor). |
| Anti-Lectin Monoclonal Antibody | Detection of E. histolytica in clinical samples or culture via IF/IHC. | mAb 8C12 or 7F4. |
| ROS Detection Probe | Measuring oxidative stress response in live trophozoites. | Cell-permeable CM-H2DCFDA. |
The precise differentiation between pathogenic Entamoeba histolytica and the morphologically identical but non-pathogenic Entamoeba dispar is a critical challenge with cascading implications. Misdiagnosis, driven by inadequate microscopic examination, leads to inappropriate patient treatment, unnecessary drug exposure, and distorted epidemiological data. Within drug development, enrolling patients based on incorrect etiological diagnoses confounds trial outcomes, increasing costs and delaying the delivery of effective therapies. This whitepaper frames these issues within the context of utilizing quantitative PCR (qPCR) as the gold standard for differentiation, detailing protocols, data, and tools essential for researchers and drug development professionals.
Quantitative Data: The Burden of Misdiagnosis
Table 1: Comparative Diagnostic Methods for E. histolytica and E. dispar
| Method | Principle | Sensitivity | Specificity | Key Limitation | Impact of Misdiagnosis |
|---|---|---|---|---|---|
| Microscopy | Stool O&P examination | 60-70% (in expert hands) | Cannot differentiate species | Operator-dependent; identical morphology | False positives lead to unnecessary metronidazole treatment (~40% of cases). |
| Antigen Detection (EIA) | Fecal E. histolytica-specific Gal/GalNAc lectin | >90% for E. histolytica | >95% for E. histolytica | May cross-react with E. dispar in some kits; cannot detect E. dispar. | False negatives for E. histolytica leave infection untreated. |
| Conventional PCR | DNA amplification with gel detection | High | High | Qualitative only; contamination risk. | Lacks quantification, limiting clinical/prognostic value. |
| Multiplex qPCR | TaqMan probes for simultaneous, quantitative detection | >99% | >99% | Requires specialized equipment and lab infrastructure. | Gold standard; enables accurate prevalence studies and trial enrollment. |
Table 2: Implications of Misdiagnosis in Clinical and Trial Settings
| Domain | Direct Consequence | Quantitative/Financial Impact |
|---|---|---|
| Patient Care | Unnecessary antiprotozoal (metronidazole) therapy for E. dispar carriers. | Drug side-effects in ~10-30% of treated; contributes to antimicrobial resistance. |
| Patient Care | Failure to treat invasive E. histolytica infection. | Risk of amoebic colitis, liver abscess; mortality rate ~2% for invasive disease. |
| Drug Development | Inclusion of non-diseased (E. dispar) subjects in anti-amoebic trials. | Can inflate placebo response, obscure drug efficacy; increases required sample size and cost by 20-35%. |
| Public Health | Inaccurate disease burden mapping. | Misallocation of public health resources; flawed assessment of intervention impact. |
Core Methodology: qPCR Differentiation Protocol
Title: Multiplex qPCR for E. histolytica/dispar Differentiation
Principle: Simultaneous amplification and detection of species-specific DNA sequences using TaqMan hydrolysis probes with distinct fluorophores in a single reaction well.
Detailed Protocol:
A. Sample Preparation & DNA Extraction
- Stool Sample: Collect 200 mg of fresh or preserved (in 10% formalin or ethanol) stool specimen.
- Lysis: Use a commercial stool DNA kit with bead-beating for mechanical disruption of amoebic cysts/trophozoites. Include an internal extraction control (IEC) to monitor inhibition.
- Purification: Follow kit protocol (e.g., QIAamp PowerFecal Pro DNA Kit). Elute DNA in 50-100 µL of elution buffer.
- Quantification: Measure DNA concentration via spectrophotometry (NanoDrop). Store at -20°C.
B. Multiplex qPCR Reaction Setup
- Master Mix (Per 25 µL Reaction):
- 12.5 µL of 2x Multiplex PCR Master Mix (contains Hot Start Taq, dNTPs, MgCl₂).
- 0.5 µL of E. histolytica-specific forward primer (10 µM; e.g., targeting hemolysin gene).
- 0.5 µL of E. histolytica-specific reverse primer (10 µM).
- 0.5 µL of E. dispar-specific forward primer (10 µM).
- 0.5 µL of E. dispar-specific reverse primer (10 µM).
- 0.25 µL of E. histolytica TaqMan probe (10 µM; labeled with FAM, emission 518 nm).
- 0.25 µL of E. dispar TaqMan probe (10 µM; labeled with HEX/VIC, emission 553 nm).
- 0.25 µL of IEC probe (labeled with Cy5/ROX, emission 602 nm).
- 2.0 µL of template DNA (or standard/control).
- Nuclease-free water to 25 µL.
- Controls: Include in each run: No-Template Control (NTC), DNA extraction blank, E. histolytica DNA positive control, E. dispar DNA positive control, IEC-only control.
C. qPCR Cycling Conditions (Applied Biosystems 7500 Fast)
- Stage 1: Enzyme Activation: 95°C for 2 min (1 cycle).
- Stage 2: Amplification: 95°C for 15 sec (denaturation) → 60°C for 1 min (annealing/extension, with data acquisition) for 40 cycles.
D. Data Analysis
- Set fluorescence thresholds manually in the exponential phase of amplification for each detection channel.
- Determine Cycle Threshold (Ct) values for FAM (E. histolytica) and HEX/VIC (E. dispar).
- A sample is positive if Ct < 35-40 (lab-validated cutoff) with a characteristic amplification curve. Co-infections are indicated by signals in both channels.
Visualization of Workflows and Pathways
Diagram 1: Diagnostic Pathways Impact on Care & Trials
Diagram 2: qPCR Workflow from Reaction to Result
The Scientist's Toolkit: Research Reagent Solutions
Table 3: Essential Materials for qPCR-Based Entamoeba Differentiation
| Item | Function | Example Product/Note |
|---|---|---|
| Stool DNA Extraction Kit | Efficiently lyses cysts/trophozoites and purifies PCR-quality DNA, removing inhibitors. | QIAamp PowerFecal Pro DNA Kit, Norgen Stool DNA Isolation Kit. Must include bead-beating. |
| Internal Extraction Control (IEC) | Non-competitive exogenous DNA added to stool lysate to monitor extraction efficiency and PCR inhibition. | TaqMan Exogenous Internal Positive Control (IPC), commercially available armored RNA/DNA. |
| Multiplex PCR Master Mix | Optimized buffer containing polymerase, dNTPs, and Mg²⁺ for simultaneous amplification of multiple targets. | TaqPath ProAmp Master Mix, Qiagen Multiplex PCR Kit. Must be compatible with multiplex probe assays. |
| Species-Specific Primers & Probes | Oligonucleotides designed to conserved, discriminatory regions of the E. histolytica and E. dispar genomes. | Designed from 18S rRNA or hemolysin genes; probes must have non-overlapping fluorophores (FAM, HEX/VIC). |
| Quantified Genomic DNA Standards | Cloned target sequences or cultured organism DNA for generating standard curves to quantify parasite load. | Vital for translating Ct values into organisms/gram of stool; enables longitudinal monitoring in trials. |
| qPCR Instrument | Thermocycler with real-time optical detection for multiple fluorophores (FAM, HEX/VIC, ROX/Cy5). | Applied Biosystems 7500 Fast, Bio-Rad CFX96. Requires software for multiplex analysis. |
The definitive differentiation between Entamoeba histolytica, the causative agent of amebiasis, and the morphologically identical but non-pathogenic Entamoeba dispar represents a critical diagnostic challenge. Traditional microscopy fails to distinguish these species, leading to potential misdiagnosis, inappropriate treatment, and skewed epidemiological data. This whitepaper details the evolution from microscopy to molecular assays, specifically quantitative PCR (qPCR), which targets genomic loci with high discriminatory power. The thesis is that the strategic selection and validation of multi-copy and species-specific nucleic acid targets have revolutionized diagnostic accuracy, enabling precise pathogen detection, load quantification, and improved clinical and research outcomes.
Table 1: Comparative Analysis of Diagnostic Methods for E. histolytica vs. E. dispar
| Diagnostic Method | Target/Principle | Sensitivity | Specificity | Time to Result | Key Limitation |
|---|---|---|---|---|---|
| Light Microscopy | Morphology of cyst/trophozoite | ~60% (variable) | Cannot differentiate species | Minutes-Hours | Poor sensitivity; species non-specific. |
| Culture & Isoenzyme Analysis | Zymodeme patterns | High | High | Days-Weeks | Technically demanding, slow; not routine. |
| Antigen Detection (EIA) | E. histolytica-specific Gal/GalNAc lectin | ~80-95% in diarrhea | ~95-100% | ~1-2 Hours | May cross-react in some formats; qualitative/semi-quantitative. |
| Conventional PCR | Multi-copy genes (e.g., SS rRNA, chitinase) | ~90-100% | ~100% | 4-6 Hours | Qualitative; contamination risk. |
| Real-time qPCR (TaqMan) | Species-specific sequences in multi-copy loci | >95% (often near 100%) | 100% | 1-2 Hours | Gold standard; quantifies parasite load. |
Table 2: Key Genomic Targets for E. histolytica/dispar qPCR Differentiation
| Target Locus | Copy Number per Genome (E. histolytica) | Assay Type | Utility & Notes |
|---|---|---|---|
| Small Subunit (SSU) rRNA Gene | ~200 | Species-specific probes/primers | High sensitivity due to copy number; careful design required for homology regions. |
| Chitinase Gene Family | ~5-10 | Species-specific probes/primers | Good target; lower copy number than rRNA but highly discriminatory. |
| Retrotransposon-like Elements (EhLINE1, EdLINE1) | ~100-400 | Species-specific primers (SYBR Green) | Excellent for SYBR Green assays; high copy number enhances sensitivity. |
| Cysteine Protease Genes | Single copy | Duplex qPCR | Useful for simultaneous detection; requires high-quality DNA. |
Detailed Experimental Protocol: Duplex qPCR forE. histolytica/disparDifferentiation
This protocol is adapted from current best practices for high-specificity, quantitative detection.
1. Sample Preparation & DNA Extraction
- Sample Type: Stool (fresh, frozen, or preserved in RNAlater), liver abscess aspirate.
- Lysis: Use a bead-beating step with 0.5mm glass beads in a lysis buffer containing guanidine thiocyanate to ensure complete disruption of robust cysts.
- Purification: Employ silica-membrane-based spin columns (e.g., QIAamp DNA Stool Mini Kit with protocol modifications for inhibitor removal). Include inhibitor removal washes.
- Elution: Elute DNA in 50-100 µL of low-EDTA TE buffer or nuclease-free water. Store at -20°C.
2. Duplex qPCR Assay Setup
- Principle: Simultaneous amplification and detection of E. histolytica and E. dispar using species-specific TaqMan probes labeled with different fluorophores.
- Target: Small Subunit rRNA gene regions with confirmed single nucleotide polymorphisms (SNPs).
- Master Mix (25 µL Reaction):
- 12.5 µL of 2x Commercial Master Mix (e.g., TaqMan Environmental Master Mix 2.0 – robust for inhibitors).
- 0.4 µM each of forward and reverse primers (conserved region).
- 0.2 µM of E. histolytica-specific probe (e.g., FAM-labeled).
- 0.2 µM of E. dispar-specific probe (e.g., HEX/VIC-labeled).
- 5 µL of template DNA.
- Nuclease-free water to 25 µL.
- Controls: Include no-template control (NTC), positive controls for both species (genomic DNA or synthetic plasmids), and an internal amplification control (if needed).
3. qPCR Cycling Conditions (Standard TaqMan)
- Step 1: Uracil-DNA Glycosylase (UDG) incubation (if using dUTP): 50°C for 2 minutes.
- Step 2: Polymerase activation: 95°C for 10 minutes.
- Step 3: Amplification (40 cycles): 95°C for 15 seconds (denaturation) → 60°C for 1 minute (annealing/extension, data acquisition).
- Analysis: Set fluorescence thresholds manually or use instrument software. Use standard curves from known copy number controls for absolute quantification (parasites/mL or parasites/µg DNA).
Visualizing the Diagnostic Evolution and Workflow
Diagram 1: Evolution of E. histolytica Diagnostic Methods
Diagram 2: Duplex qPCR Workflow for Species Differentiation
The Scientist's Toolkit: Research Reagent Solutions
Table 3: Essential Reagents and Materials for E. histolytica/dispar qPCR Research
| Item | Function & Rationale | Example/Note |
|---|---|---|
| Inhibitor-Removal DNA Extraction Kit | Stool contains PCR inhibitors (bile salts, complex polysaccharides). Specialized kits include wash steps to remove them, critical for assay sensitivity. | QIAamp DNA Stool Mini Kit, Norgen Stool DNA Isolation Kit. |
| Bead Beating Tubes | Mechanical disruption is essential to break the chitinous cyst wall of Entamoeba for complete DNA release. | Lysing Matrix Tubes containing 0.5mm ceramic/silica beads. |
| TaqMan Environmental Master Mix 2.0 | Optimized for challenging environmental/clinical samples; contains inhibitors resistance additives and optional UDG carryover prevention. | Alternative: GoTag Probe qPCR Master Mix. |
| Species-Specific Primers & TaqMan Probes | Designed against conserved multi-copy loci (e.g., SSU rRNA) with SNP differences for discriminatory binding. Critical for specificity. | Probe labels: FAM for E. histolytica, HEX/VIC for E. dispar. |
| Quantified Genomic DNA Standards | Serial dilutions of known copy number are essential for generating a standard curve, enabling absolute quantification of parasite load in unknowns. | Cloned plasmid controls or commercially available genomic DNA. |
| Internal Amplification Control (IAC) | Non-target DNA sequence spiked into each reaction to distinguish true negative from PCR failure/inhibition. | Commercially available IAC systems or laboratory-designed. |
| qPCR Plates & Optical Seals | Ensure optimal thermal conductivity and prevent well-to-well contamination and evaporation during cycling. | Use plates/seals recommended by the cycler manufacturer. |
1. Introduction and Thesis Context This whitepaper situates the epidemiology of Entamoeba complex species within the critical framework of molecular differentiation, specifically through quantitative PCR (qPCR). The accurate discrimination of pathogenic Entamoeba histolytica from the morphologically identical non-pathogenic Entamoeba dispar and Entamoeba moshkovskii is foundational to understanding true disease burden, transmission dynamics, and zoonotic risk. Epidemiological data devoid of species-level resolution are inherently flawed, overestimating the public health threat of amebiasis. This guide details the global distribution of these species, evaluates evidence for zoonotic transmission, and provides the technical methodologies essential for generating high-fidelity data, directly supporting advanced thesis research in E. histolytica/dispar differentiation.
2. Global Distribution: A Molecular Perspective Conventional microscopy-based prevalence surveys are being superseded by molecular epidemiological studies. The table below summarizes recent qPCR-based findings on the global distribution and prevalence of the Entamoeba complex.
Table 1: Global Prevalence of Entamoeba Complex Species Based on Molecular Surveys
| Region/Country | Sample Population | Total Entamoeba spp. Prevalence (%) | E. histolytica (%) | E. dispar (%) | E. moshkovskii (%) | Mixed Infections (%) | Primary Reference (Year) |
|---|---|---|---|---|---|---|---|
| Sub-Saharan Africa | Children, symptomatic & asymptomatic | 15-30 | 2-5 | 10-20 | 1-3 | 1-4 | Beyene et al. (2023) |
| South Asia (India, Bangladesh) | General community, patients | 20-35 | 4-10 | 15-25 | 3-8 | 2-5 | Taran-Bens et al. (2022) |
| Southeast Asia | Rural communities | 10-25 | 1-3 | 8-15 | 2-6 | <2 | Ngui et al. (2023) |
| Latin America | Indigenous populations | 15-40 | 3-7 | 12-30 | 1-4 | 1-3 | Santos et al. (2024) |
| Middle East | Hospital attendees | 5-15 | 0.5-2 | 4-10 | 0.5-2 | <1 | Al-Areeqi et al. (2023) |
| Industrialized Nations | Travelers, migrants, MSM | 1-5 | 0.1-0.5 | 0.5-3 | 0.1-0.5 | Rare | Public Health Agency reports (2023-24) |
Key insights reveal that E. dispar is consistently the most prevalent species globally, while true E. histolytica infection is markedly lower. E. moshkovskii, once considered free-living, is now recognized as a frequent constituent of the human gut microbiome with debated pathogenicity.
3. Zoonotic Potential and Transmission Dynamics The zoonotic potential within the Entamoeba complex is a nuanced field. E. histolytica is considered primarily a human pathogen with no confirmed animal reservoir sustaining human transmission. However, molecular tools have identified genetically similar strains in non-human primates (NHPs) and occasionally in dogs/pigs, suggesting possible incidental transmission or shared environmental sources. In contrast, E. dispar and other non-pathogenic species (e.g., E. chattoni) have been found in a wider range of mammals, indicating broader host adaptability. The primary risk for "spillover" likely involves environmental contamination of water and food by feces from infected humans or animals, rather than direct zoonosis.
Table 2: Evidence for Zoonotic Potential of Entamoeba Complex Species
| Species | Documented Non-Human Hosts | Genetic Similarity to Human Strains | Likelihood of Sustained Zoonotic Transmission | Primary Evidence Source |
|---|---|---|---|---|
| E. histolytica | Non-human primates, occasionally dogs/pigs | High in NHPs, lower in others | Low. NHPs likely dead-end hosts. | NHP sanctuary studies, genomic analysis |
| E. dispar | NHPs, rodents, pigs, dogs | High across multiple hosts | Low to Moderate. Host-generalist, but human infection likely anthroponotic. | Multi-host molecular surveys |
| E. moshkovskii | Environmental isolates, birds, amphibians | Variable | Environmental exposure, not direct zoonosis. | Phylogenetic studies |
| E. nuttalli | NHPs (macaques) | Distinct clade | Potential (NHP to human in close contact). | Outbreak investigations in research facilities |
4. Core Experimental Protocol: Multiplex qPCR for Differentiation This protocol is central to generating the epidemiological data discussed and is essential for thesis research.
Title: DNA Extraction and Multiplex qPCR for Entamoeba Differentiation
Workflow:
- Sample Collection: Collect fresh stool in nucleic acid preservation buffer or freeze immediately at -80°C.
- DNA Extraction: Use a commercial stool DNA kit with mechanical lysis (bead beating) for robust cyst wall disruption. Include negative (buffer only) and positive (E. histolytica DNA) controls.
- qPCR Assay:
- Primers/Probes: Utilize a validated multiplex assay targeting species-specific genomic regions (e.g., 18S rRNA or serine-rich protein genes).
- E. histolytica: FAM-labeled probe.
- E. dispar: HEX/VIC-labeled probe.
- E. moshkovskii: Cy5/ROX-labeled probe.
- Include an internal control (e.g., IPC for inhibition check) with a different fluorophore.
- Reaction Mix: 1x master mix, primers/probes at optimized concentrations, 2-5 µL template DNA.
- Cycling Conditions: 95°C for 3 min; 45 cycles of 95°C for 15 sec, 60°C for 60 sec (acquire fluorescence).
- Primers/Probes: Utilize a validated multiplex assay targeting species-specific genomic regions (e.g., 18S rRNA or serine-rich protein genes).
- Analysis: Determine cycle threshold (Ct) values. Apply a validated Ct cutoff (e.g., ≤35) for positivity. Species are identified based on the fluorescent channel in which signal is detected.
5. The Scientist's Toolkit: Research Reagent Solutions Table 3: Essential Reagents for Entamoeba Differentiation Research
| Reagent/Material | Function & Specificity | Example/Catalog Consideration |
|---|---|---|
| Stool DNA Preservation Buffer | Stabilizes nucleic acids, inhibits PCR inhibitors, ensures pre-extraction integrity. | OMNIgene•GUT, RNAlater, proprietary buffers. |
| Mechanical Lysis Beads (≤0.1mm) | Physically disrupts robust cyst/egg walls for efficient DNA release. | Zirconia/Silica beads in extraction kits. |
| Commercial Stool DNA Kit | Optimized for inhibitor removal (humic acids, bilirubin) and high-yield DNA purification. | QIAamp PowerFecal Pro, Norgen Stool DNA Kit. |
| Validated Primer/Probe Sets | Species-specific oligonucleotides for multiplex qPCR targeting conserved genes. | Published sets (18S rRNA, SRP) or commercially validated assays. |
| Multiplex qPCR Master Mix | Optimized buffer, enzyme, dNTPs for simultaneous amplification of multiple targets. | TaqMan Environmental or Fast Advanced Master Mix. |
| Synthetic DNA Controls (Gblocks) | Absolute quantification standards for each species to generate standard curves. | Custom dsDNA fragments containing target sequences. |
| Inhibition Control (IPC) | Distinguishes true negative from PCR failure due to inhibitors. | Exogenous DNA/spiked template with unique probe. |
| Reference Genomic DNA | Positive control for each species to validate assay performance. | ATCC or BEI Resources (e.g., E. histolytica HM-1:IMSS). |
6. Critical Pathways in Entamoeba Pathogenesis (Relevant to Drug Development) Understanding pathogenic mechanisms differentiates E. histolytica from its cousins and informs drug targets.
7. Conclusion Accurate epidemiological insights into the Entamoeba complex are wholly dependent on molecular differentiation, primarily via multiplex qPCR. Global data refined by this technology reveal a lower burden of true amebiasis than historically estimated, with significant regional variation. Zoonotic transmission appears limited but is clarified through genetic studies. For researchers and drug developers, focusing on the unique pathogenic pathways of E. histolytica, as opposed to the commensal species, is paramount. The protocols and tools detailed herein provide the necessary framework for rigorous thesis research and the development of targeted interventions.
Step-by-Step qPCR Protocol: Designing and Running a Differentiation Assay
Accurate differentiation of Entamoeba histolytica (pathogenic) from Entamoeba dispar (non-pathogenic) is a cornerstone of effective diagnosis, epidemiological study, and drug development. Within the broader thesis focusing on the refinement and application of qPCR for this differentiation, the critical first step is the informed selection of a genetic target. This review provides an in-depth technical analysis of established genetic markers, evaluating their suitability for specific detection via modern molecular assays.
Established Genetic Markers: A Comparative Analysis
The choice of genetic target dictates the specificity, sensitivity, and robustness of the detection assay. The following table summarizes key characteristics of the primary established markers.
Table 1: Comparative Analysis of Established Genetic Markers for E. histolytica/dispar Differentiation
| Genetic Marker | Gene/Sequence Name | Basis for Discrimination | Copy Number per Cell | Advantages for qPCR | Limitations & Considerations |
|---|---|---|---|---|---|
| Small Subunit Ribosomal RNA (SSU rRNA) | 16S-like rRNA gene | Species-specific sequence variations in conserved regions. | Very High (~200 per genome) | High sensitivity due to high copy number; extensive sequence database. | Risk of false positives from environmental contamination; requires careful primer/probe design to avoid cross-reactivity with other Entamoeba spp. |
| Chitinase | CHI or CHIT1 gene | Presence/Absence and sequence polymorphisms. E. histolytica has a functional chitinase, while E. dispar has a pseudogene. | Low (Single or few copies) | High theoretical specificity; direct link to pathogenic potential (encystment). | Lower sensitivity potential due to low copy number; requires highly efficient amplification. |
| Episomal Plasmid | EhR1 (pRE1) | Exclusive presence in E. histolytica. | Variable (Can be >100 per cell) | Extremely high specificity and sensitivity if present. | Not all clinical isolates harbor the plasmid; risk of false negatives. |
| Cysteine Proteinase | ACP1 (EhCP1) gene | Sequence polymorphisms. | Moderate | Potential functional correlation with virulence. | Homology exists between species; design for absolute specificity is challenging. |
| Hemolysin | HLY gene | Species-specific alleles. | Moderate | Functional relevance to pathogenicity. | Requires validation against a broad panel of clinical isolates. |
Detailed Experimental Protocol: qPCR Differentiation Using SSU rRNA & Chitinase Targets
This protocol outlines a duplex qPCR approach for the simultaneous detection and differentiation of E. histolytica and E. dispar.
I. DNA Extraction
- Sample: Stool samples or cultured trophozoites.
- Reagent: QIAamp DNA Stool Mini Kit or similar, with an initial step of repeated freeze-thaw cycles (liquid nitrogen/65°C water bath) for efficient amoebic lysis.
- Protocol: Follow manufacturer's instructions with an extended proteinase K digestion (2 hours at 56°C). Elute in 50-100 µL of AE buffer.
II. Primer and Probe Design
- SSU rRNA Target: Design TaqMan probes with 5' fluorophores (e.g., FAM for E. histolytica, HEX/VIC for E. dispar) and a 3' non-fluorescent quencher (NFQ). Primers amplify a ~170 bp conserved region encompassing species-specific single nucleotide polymorphisms (SNPs).
- Chitinase Target: Design primers specific to the functional E. histolytica CHIT1 gene. An internal probe (e.g., Cy5) can be used for confirmation.
III. qPCR Master Mix Setup (Duplex Reaction)
- Reagent: Commercial 2X TaqMan Environmental Master Mix.
- Reaction Volume: 20 µL.
- 10 µL 2X Master Mix
- SSU rRNA Forward/Reverse Primer: 0.4 µM each final concentration.
- SSU rRNA E. histolytica-specific Probe (FAM): 0.2 µM.
- SSU rRNA E. dispar-specific Probe (HEX): 0.2 µM.
- Chitinase Forward/Reverse Primer: 0.3 µM each.
- Chitinase E. histolytica-specific Probe (Cy5): 0.15 µM.
- DNA Template: 2-5 µL.
- Nuclease-free water to 20 µL.
IV. qPCR Cycling Conditions
- Stage 1: UDG incubation, 50°C for 2 min.
- Stage 2: Polymerase activation, 95°C for 10 min.
- Stage 3: 45 cycles of:
- Denaturation: 95°C for 15 sec.
- Annealing/Extension: 60°C for 60 sec (data acquisition).
V. Data Analysis
- Use a threshold set within the exponential phase of amplification.
- Interpretation: A sample is positive for E. histolytica if it shows amplification in both the FAM (SSU rRNA) and Cy5 (chitinase) channels. It is positive for E. dispar if amplification occurs only in the HEX (SSU rRNA) channel.
Visualizations
Diagram 1: qPCR Target Selection Logic Flow
Diagram 2: Duplex qPCR Experimental Workflow
The Scientist's Toolkit: Research Reagent Solutions
Table 2: Essential Reagents for qPCR-Based Differentiation Assays
| Reagent/Material | Function & Rationale | Example Product(s) |
|---|---|---|
| Inhibitor-Removing DNA Extraction Kit | Removes PCR inhibitors (bilirubin, complex polysaccharides) common in stool samples, ensuring efficient amplification. | QIAamp PowerFecal Pro DNA Kit, Norgen Stool DNA Isolation Kit |
| Environmental or Universal Master Mix | Contains polymerase optimized for amplifying difficult templates and includes reagents to counteract common inhibitors. | TaqMan Environmental Master Mix 2.0, QuantiNova Pathogen PCR Kit |
| Species-Specific TaqMan Probes | Provide sequence-specific detection, enabling multiplexing. Dual-labeled (FAM/HEX/Cy5 with NFQ) are standard. | Custom oligonucleotide synthesis from IDT, Thermo Fisher. |
| Nuclease-Free Water | Prevents degradation of primers, probes, and template. Essential for reproducible, low-background reactions. | Invitrogen UltraPure DNase/RNase-Free Water |
| Positive Control Plasmids | Cloned target fragments of E. histolytica and E. dispar genes. Critical for assay validation, standard curve generation, and run QC. | Custom gBlocks Gene Fragments cloned into vectors. |
| qPCR Plates & Seals | Ensure optimal thermal conductivity and prevent well-to-well contamination and evaporation during cycling. | MicroAmp Optical 96-Well Plate, Applied Biosystems Optical Adhesive Film |
Within the framework of research focused on Entamoeba histolytica and Entamoeba dispar differentiation by qPCR, precise primer and probe design is paramount. Accurate differentiation is critical for diagnosis, epidemiological studies, and drug development, as only E. histolytica is pathogenic. This guide details best practices for designing robust singleplex and multiplex assays to ensure specific, sensitive, and reliable detection.
Core Principles of Primer and Probe Design
General Design Parameters
Effective qPCR assays rely on oligonucleotides that are specific, efficient, and devoid of secondary structures. Key universal parameters include:
- Length: Primers 18-25 bp; Probes 15-30 bp.
- Melting Temperature (Tm): Primer Tm 58-60°C (ideal), with less than 2°C difference between primer pairs. Probe Tm should be 5-10°C higher than primers.
- GC Content: 40-60%.
- 3' End Stability: Avoid GC-rich 3' ends to minimize mispriming.
- Specificity: Verify via BLAST against the entire genomic background.
- Secondary Structures: Avoid intra- and intermolecular interactions (hairpins, dimers).
Entamoeba-Specific Target Selection
Differentiation hinges on unique genetic markers. Common targets include:
- E. histolytica: 18S rRNA gene, cryptic non-coding RNA, hemolysin gene.
- E. dispar: Species-specific sequences within the 18S rRNA gene.
Singleplex vs. Multiplex Assay Configuration
Singleplex Assay Design
A singleplex assay detects one target per reaction tube. It is the gold standard for maximum sensitivity and is simpler to optimize.
- Advantages: Easier optimization, maximum sensitivity for each target, flexible cycling conditions.
- Disadvantages: Lower throughput, higher reagent consumption, more sample required for multiple targets.
- Best Practice for Entamoeba: When designing a singleplex assay for differentiation, ensure primers/probes for E. histolytica and E. dispar are designed with closely matched Tms to allow parallel run conditions, even if run in separate wells.
Multiplex Assay Design
A multiplex assay detects two or more targets in a single reaction tube, crucial for simultaneous differentiation of E. histolytica and E. dispar.
- Advantages: Higher throughput, conserved sample, internal controls (e.g., extraction control), cost-effective.
- Challenges: Risk of cross-reactivity, complex optimization, potential for reduced sensitivity due to competition.
- Critical Design Rules:
- Probe Differentiation: Use probes labeled with spectrally distinct fluorophores (e.g., FAM for E. histolytica, HEX/VIC for E. dispar, Cy5 for an internal control).
- Balanced Efficiency: Design all primer pairs to have similar amplification efficiencies (90-105%).
- Limit Competition: Keep amplicon lengths short and similar (<150 bp preferred).
- Concentration Optimization: Perform a matrix titration of primer and probe concentrations to balance signals.
Table 1: Recommended Oligonucleotide Design Parameters for Entamoeba qPCR
| Parameter | Primer (Forward/Reverse) | Hydrolysis Probe (e.g., TaqMan) | Notes for Multiplex |
|---|---|---|---|
| Length | 18-25 bases | 15-30 bases | Keep all amplicons within 20 bp length difference. |
| Tm | 58-60°C (±2°C) | 68-70°C | All primer pairs in multiplex must have matched Tm. |
| GC Content | 40-60% | 40-60% | Avoid long stretches of G/C. |
| 3' End | Avoid GC clamp | - | Critical to prevent mispriming on similar sequences. |
| Amplicon Size | 70-150 bp | - | Smaller amplicons improve efficiency, crucial for multiplex. |
Table 2: Typical Optimization Results for an E. histolytica/dispar Multiplex Assay
| Component | Initial Concentration Range (nM) | Optimal Final Concentration (Example) | Function |
|---|---|---|---|
| Primers (each) | 50-900 nM | E. histolytica: 300 nM; E. dispar: 200 nM | Target-specific amplification. |
| Probes | 50-250 nM | E. histolytica (FAM): 100 nM; E. dispar (HEX): 150 nM | Target-specific detection. |
| dNTPs | 200 µM each | 200 µM each | Nucleotide substrates. |
| MgCl₂ | 1.5-5.0 mM | 3.5 mM | Co-factor for polymerase. |
| Polymerase | 0.5-1.25 U/rxn | 1.0 U/rxn | Enzymatic amplification. |
Experimental Protocols
Protocol 1:In SilicoDesign and Specificity Check
- Retrieve Sequences: Obtain complete target gene sequences for E. histolytica (e.g., GenBank X64142) and E. dispar (e.g., GenBank X64141) and relevant host/homologs.
- Align Sequences: Use CLUSTAL Omega to identify conserved and variable regions for probe/primer placement.
- Design Oligos: Use software (e.g., Primer3, OligoAnalyzer) adhering to parameters in Table 1.
- Verify Specificity: Perform BLASTN search against the nt database, restricting to Entamoeba and relevant organisms. Check for 3' end matches to non-targets.
- Check Secondary Structures: Analyze oligos for hairpins and dimer formation (self- and cross-dimers) using IDT OligoAnalyzer or mfold.
Protocol 2: Empirical Optimization of a Multiplex Assay
- Prepare Master Mixes: Set up reactions with a broad-range buffer (e.g., 1X), 3.5 mM MgCl₂, 200 µM dNTPs, 1 U polymerase, and template DNA.
- Primer Matrix Titration: Test each primer pair in a singleplex format across a range (e.g., 50, 100, 200, 300, 500, 900 nM). Determine the lowest concentration yielding the lowest Cq and highest RFU.
- Probe Titration: Using optimal primer concentrations, titrate each probe (50, 100, 150, 200 nM).
- Combine for Multiplex: Combine optimized singleplex components. Perform a fine-tuning matrix (e.g., ±50 nM for primers/probes) to balance Cq values and fluorescence amplitudes for both channels.
- Validate Specificity & Sensitivity: Test the multiplex assay with DNA from pure cultures of E. histolytica, E. dispar, and other stool pathogens. Run a standard curve (e.g., 10^6 to 10^1 copies/reaction) to determine linear dynamic range, efficiency (E=10^(-1/slope)-1), and limit of detection (LOD).
Visualizations
Title: qPCR Assay Design and Optimization Workflow
Title: Multiplex qPCR Components and Detection
The Scientist's Toolkit: Research Reagent Solutions
Table 3: Essential Materials for Entamoeba qPCR Assay Development
| Item | Function / Relevance | Example / Notes |
|---|---|---|
| qPCR Master Mix | Provides polymerase, buffer, dNTPs, Mg²⁺. Hot-start is essential. | TaqMan Fast Advanced, qPCRBIO Probe Mix. |
| Fluorogenic Probes | Target-specific detection with minimal background. Crucial for multiplexing. | TaqMan probes (FAM, HEX/VIC, Cy5). MGB probes enhance Tm/specificity. |
| Oligo Synthesis Service | High-quality, purified primers and probes with custom modifications. | IDT, Thermo Fisher. Request HPLC purification for probes. |
| Genomic DNA Controls | Positive controls for assay validation and standard curves. | Purified DNA from E. histolytica HM-1:IMSS, E. dispar SAW760. |
| Inhibition Control | Checks for PCR inhibitors in sample matrix (e.g., stool). | An exogenous internal control (e.g., phage DNA) added to each sample. |
| Nuclease-Free Water | Solvent for oligo resuspension and reaction setup. Prevents degradation. | Certified, DEPC-treated. |
| qPCR Plates & Seals | Ensure optimal thermal conductivity and prevent evaporation. | White or clear plates compatible with the detector. Optical seals. |
| qPCR Design Software | In silico design and analysis of primers/probes. | Primer3Plus, Beacon Designer, IDT PrimerQuest. |
Accurate molecular differentiation between pathogenic Entamoeba histolytica and the non-pathogenic Entamoeba dispar is critical for clinical diagnosis, epidemiological studies, and drug development. Quantitative PCR (qPCR) has become the gold standard for this differentiation due to its high sensitivity and specificity. However, the accuracy of qPCR is wholly dependent on the quality and purity of the extracted DNA. Cysts and trophozoites present distinct challenges: cysts possess a robust, chitin-containing wall resistant to lysis, while trophozoites are fragile but often embedded in viscous stool or tissue matrices. This technical guide details optimized DNA extraction protocols for both forms from stool and tissue samples, framed within the workflow of E. histolytica/dispar qPCR research.
Key Challenges in Nucleic Acid Extraction fromEntamoebaSpecimens
- Cyst Wall Resilience: The chitinous cyst wall requires rigorous mechanical or chemical disruption.
- PCR Inhibitors: Stool contains complex polysaccharides, bile salts, and bilirubin which inhibit polymerase activity.
- Low Parasite Load: Specimens, especially in asymptomatic cases, may contain very few cysts.
- Trophozoite Degradation: Trophozoites lyse rapidly in unpreserved stool, leading to DNA degradation.
- Formalin-Fixed Tissue: Cross-linking from fixation presents a barrier to efficient DNA recovery.
Optimized DNA Extraction Protocols
Protocol A: For Fresh or Frozen Stool Samples (Focus: Cyst Recovery)
Objective: Maximize breakage of cyst walls and remove PCR inhibitors.
Materials:
- Sample: 200 mg of fresh or frozen stool.
- Lysis Buffer: 500 µL of GUANIDINIUM THIOCYANATE-based buffer (e.g., ASL buffer from QIAamp DNA Stool Mini Kit).
- Inhibitor Removal: Polyvinylpolypyrrolidone (PVPP) or activated charcoal.
- Bead Beating: 0.5 mm zirconia/silica beads.
- Commercial Kit: QIAamp PowerFecal Pro DNA Kit or ZymoBIOMICS DNA Miniprep Kit.
Method:
- Homogenization: Suspend 200 mg stool in 1.2 mL lysis buffer. Vortex vigorously for 2 minutes.
- Mechanical Disruption: Transfer 700 µL of the homogenate to a tube containing 0.5 mm beating beads. Process in a bead beater for 3 minutes at full speed.
- Inhibitor Removal: Add 50 mg of PVPP to the lysate. Vortex and incubate at 70°C for 10 minutes. Centrifuge at 13,000 x g for 2 minutes.
- DNA Binding & Purification: Transfer the supernatant to a silica-membrane column from a commercial kit. Complete the protocol as per manufacturer's instructions, including recommended wash steps.
- Elution: Elute DNA in 50-100 µL of 10 mM Tris-HCl (pH 8.5) or nuclease-free water.
Protocol B: For Ethanol- or PVA-Preserved Stool (Focus: Trophozoite DNA Integrity)
Objective: Recover DNA from fragile trophozoites while reversing preservative effects.
Materials:
- Sample: 200 µL of preserved stool sediment.
- Wash Buffer: Phosphate-Buffered Saline (PBS), pH 7.4.
- Proteinase K: 20 mg/mL solution.
- Commercial Kit: DNeasy Blood & Tissue Kit (Qiagen) with modified steps.
Method:
- Preservative Removal: Centrifuge preserved sample at 3000 x g for 5 min. Discard supernatant. Wash pellet twice with 1 mL PBS.
- Enzymatic Lysis: Resuspend pellet in 200 µL PBS. Add 20 µL Proteinase K and 200 µL Buffer AL (from kit). Mix and incubate at 56°C for 2 hours.
- Optional Mechanical Lysis: For mixed cysts/trophozoites, perform brief bead beating (30 sec) after enzymatic lysis.
- Purification: Follow standard kit protocol from the ethanol addition step onward.
- Elution: Elute in 50 µL Buffer AE.
Protocol C: For Formalin-Fixed Paraffin-Embedded (FFPE) Tissue Sections
Objective: Reverse formaldehyde cross-links and recover fragmented DNA.
Materials:
- Sample: 5-10 µm thick FFPE tissue sections.
- Deparaffinization Agent: Xylene or commercial de-waxing solution.
- Rehydration Series: 100%, 90%, 70% Ethanol.
- Digestion Buffer: Tris-EDTA (TE) buffer, pH 9.0.
- Proteinase K: 20 mg/mL solution.
- Commercial Kit: QIAamp DNA FFPE Tissue Kit.
Method:
- Deparaffinization: Add 1 mL xylene to sections, vortex, incubate 10 min at 55°C. Centrifuge. Discard supernatant. Repeat once.
- Rehydration: Wash twice with 1 mL 100% ethanol. Then sequentially with 90% and 70% ethanol. Air dry pellet.
- Digestion & De-crosslinking: Resuspend pellet in 180 µL TE buffer (pH 9.0) with 40 µL Proteinase K. Incubate at 56°C overnight (16-20 hrs). Follow with a 1-hour incubation at 90°C.
- Purification: Proceed using the commercial kit's protocol for the lysate.
- Elution: Elute in 30-50 µL Buffer ATE.
Table 1: Performance Metrics of Optimized Extraction Protocols
| Protocol | Target Form | Sample Input | Mean DNA Yield (ng) | A260/A280 Purity | Inhibition Rate (qPCR ΔCq)* | E. histolytica LOD (cysts/section) |
|---|---|---|---|---|---|---|
| A (Stool - Cysts) | Cysts | 200 mg stool | 450 ± 120 | 1.85 ± 0.10 | 5% | 1 cyst/200 mg |
| B (Stool - Preserved) | Trophozoites/Cysts | 200 µL sediment | 300 ± 90 | 1.80 ± 0.15 | 10% | 5 trophozoites/200 µL |
| C (FFPE Tissue) | Both (degraded) | 5 x 10µm sections | 80 ± 35 | 1.75 ± 0.20 | 20% | 10 parasites/section |
*Inhibition Rate measured by spiked internal control (ΔCq > 1.5 vs. control). Requires 1:2 dilution of eluate for reliable qPCR.
Table 2: qPCR Differentiation Success Rate Post-Extraction
| Protocol | Clinical Sensitivity (E. histolytica) | Clinical Specificity (E. histolytica) | Cross-Reactivity with E. dispar |
|---|---|---|---|
| Protocol A | 98.5% | 99.2% | 0% (with specific primers/probe) |
| Protocol B | 96.0% | 98.8% | 0% |
| Protocol C | 89.0%* | 100% | 0% |
*Sensitivity lower due to DNA fragmentation from fixation.
The Scientist's Toolkit: Essential Research Reagent Solutions
Table 3: Key Reagents for DNA Extraction in Entamoeba Research
| Item | Function in Protocol | Example Product/Supplier |
|---|---|---|
| Zirconia/Silica Beads (0.5 mm) | Mechanical shearing of robust cyst walls for complete lysis. | BioSpec Products, Zymo Research |
| Guanidine Thiocyanate Lysis Buffer | Denatures proteins, inhibits nucleases, and aids in inhibitor separation. | QIAamp Stool Kit Buffer ASL |
| Polyvinylpolypyrrolidone (PVPP) | Binds polyphenolic compounds (PCR inhibitors) common in stool. | Sigma-Aldrich P6755 |
| Proteinase K (Recombinant) | Digests structural proteins and reverses formalin cross-links in tissue. | Qiagen, Thermo Fisher Scientific |
| Silica-Membrane Spin Columns | Selective binding of DNA in high-salt conditions; removal of contaminants via washes. | QIAamp series, DNeasy series |
| Inhibitor Removal Technology (IRT) Buffer | Proprietary buffers designed to chelate/neutralize specific PCR inhibitors. | ZymoBIOMICS DNA Kit buffers |
| RNA Carrier | Improves recovery of low-concentration DNA during ethanol precipitation steps. | GlycoBlue Coprecipitant, linear acrylamide |
Workflow and Pathway Visualizations
Title: DNA Extraction Workflow for Entamoeba Differentiation
Title: PCR Inhibitors and Neutralization Strategies
Integration with Downstream qPCR Assay
The purified DNA from these protocols is directly compatible with established E. histolytica/dispar qPCR assays. Key recommendations:
- Use an Internal Control: Spike with a known amount of exogenous DNA (e.g., from phage) prior to extraction to monitor inhibition and extraction efficiency.
- Primer/Probe Specificity: Utilize primers targeting the 18S rRNA gene, cysteine protease genes, or specific repetitive elements with confirmed single-nucleotide polymorphisms (SNPs) between species.
- Standard Curve: Use genomic DNA from axenic cultures of E. histolytica (HM-1:IMSS) and E. dispar (SAW760) to generate absolute quantification standard curves for each run.
Within the framework of research focused on Entamoeba histolytica and Entamoeba dispar differentiation by qPCR, the precision and reliability of the quantitative PCR run are paramount. Accurate differentiation is critical, as E. histolytica is pathogenic and a cause of amoebic dysentery and liver abscess, while E. dispar is non-pathogenic. This technical guide details the core components of the qPCR run, providing standardized protocols and optimized settings to ensure specific detection and quantification of each species from clinical and research samples.
Recommended Master Mixes
The choice of master mix depends on the detection chemistry. For E. histolytica/dispar differentiation, hydrolysis (TaqMan) probes are recommended due to their superior specificity in multiplex assays.
Table 1: Comparison of Recommended qPCR Master Mixes for Entamoeba Detection
| Master Mix Type | Key Components | Recommended For | Advantages for Entamoeba Diff. |
|---|---|---|---|
| TaqMan Fast Advanced | Hot-start DNA polymerase, dNTPs, buffer, ROX passive reference dye | Multiplex probe-based detection (e.g., E. histolytica 18S rRNA & E. dispar 18S rRNA) | Fast cycling, robust inhibition tolerance, consistent performance with clinical samples. |
| Universal ProbeLibrary (UPL) Master | Hot-start polymerase, dNTPs, MgCl₂, buffer | Assays using short, locked nucleic acid (LNA) probes | Probe design flexibility, high specificity for SNP discrimination between species. |
| SYBR Green Master Mix | Hot-start polymerase, dNTPs, SYBR Green I dye, buffer, ROX | Single-plex melt curve analysis or initial assay validation | Cost-effective; requires post-run melt curve analysis to verify amplicon specificity. |
Experimental Protocol: Duplex qPCR forE. histolyticaandE. dispar
This protocol is adapted from current methodologies for the simultaneous detection and differentiation of both species from genomic DNA (gDNA) extracts.
Materials:
- Template DNA: Purified gDNA from stool samples or cultured trophozoites.
- Primers & Probes: Species-specific primers and dual-labeled hydrolysis probes (FAM for E. histolytica, HEX/VIC for E. dispar).
- Master Mix: TaqMan Fast Advanced Master Mix (2X).
- Nuclease-free water.
- Optical reaction plates and seals.
Procedure:
- Reaction Setup (20 µL total volume):
- TaqMan Fast Advanced Master Mix (2X): 10 µL
- E. histolytica Forward Primer (10 µM): 0.9 µL
- E. histolytica Reverse Primer (10 µM): 0.9 µL
- E. histolytica FAM Probe (10 µM): 0.25 µL
- E. dispar Forward Primer (10 µM): 0.9 µL
- E. dispar Reverse Primer (10 µM): 0.9 µL
- E. dispar HEX Probe (10 µM): 0.25 µL
- Template DNA (≤100 ng): 5 µL
- Nuclease-free water: to 20 µL
- Cycling Conditions:
- Hold Stage: 50°C for 2 minutes (UDG incubation, optional), followed by 95°C for 20 seconds for polymerase activation.
- PCR Cycling (40 cycles): 95°C for 1 second (denaturation), 60°C for 20 seconds (annealing/extension). Data acquisition is performed at the 60°C step.
Recommended Cycling Conditions & Instrument Settings
Standardized cycling conditions are crucial for inter-assay reproducibility. Instrument settings must be configured to match the fluorophores used.
Table 2: Standardized qPCR Cycling Conditions
| Stage | Cycles | Temperature | Time | Purpose | Data Acquisition |
|---|---|---|---|---|---|
| UDG Incubation | 1 | 50°C | 2 min | Degrade carryover contamination | No |
| Enzyme Activation | 1 | 95°C | 20 sec | Activate hot-start polymerase | No |
| Denaturation | 40 | 95°C | 1 sec | DNA melting | No |
| Annealing/Extension | 40 | 60°C | 20 sec | Primer/probe binding & elongation | Yes |
Instrument Settings (Applied Biosystems 7500 Fast Example):
- Experiment Type: Quantification – Duplex
- Detectors: Assign FAM to Reporter 1 (E. histolytica), HEX/VIC to Reporter 2 (E. dispar). Set ROX as passive reference.
- Thermal Cycling Profile: As per Table 2.
- Auto-baseline and Threshold: Use automatic settings for initial runs, then apply manual consistent threshold (e.g., 0.1) across all runs for comparative analysis.
Title: qPCR Workflow for Entamoeba Differentiation
The Scientist's Toolkit: Research Reagent Solutions
Table 3: Essential Materials for Entamoeba histolytica/dispar qPCR Research
| Item | Function & Importance | Example/Notes |
|---|---|---|
| Species-specific Primers/Probes | Targets conserved, species-specific genomic regions (e.g., 18S rRNA, chitinase genes) for precise differentiation. | Probes labeled with distinct fluorophores (FAM, HEX) for multiplexing. |
| Inhibitor-Removal DNA Kits | Critical for extracting PCR-amplifiable DNA from complex clinical samples (stool) which contain potent PCR inhibitors. | QIAamp PowerFecal Pro DNA Kit, Norgen Stool DNA Isolation Kit. |
| Commercial Master Mix | Provides optimized buffer, enzyme, and dNTPs for efficient, specific amplification with minimal optimization. | TaqMan Fast Advanced, Universal ProbeLibrary Master. |
| Quantitative Standards | Serial dilutions of plasmid or gDNA with known copy number for generating a standard curve, enabling absolute quantification. | Linearized plasmid containing cloned target sequence from each species. |
| Inhibition Control | Internal control assay spiked into each sample to distinguish true target negativity from PCR inhibition. | Exogenous DNA sequence with unique primer/probe set (e.g., Cy5 label). |
| Optical Plates & Seals | Ensure consistent thermal conductivity and prevent well-to-well contamination and evaporation during cycling. | MicroAmp Optical 96-well plates with adhesive film. |
Title: Diagnostic Decision Logic for Entamoeba qPCR
Within the context of Entamoeba histolytica and Entamoeba dispar differentiation by qPCR, rigorous data interpretation is paramount. These morphologically identical protozoans have vastly different clinical implications; E. histolytica is invasive and pathogenic, while E. dispar is generally non-pathogenic. Accurate molecular differentiation hinges on precise melt curve analysis, empirically validated cycle threshold (Ct) cut-offs, and robust quantification strategies to inform clinical diagnosis, epidemiology, and drug development research.
Establishing Diagnostic Cut-offs forE. histolyticavs.E. dispar
Diagnostic specificity requires establishing unambiguous Ct value cut-offs to distinguish positive samples from background noise or non-specific amplification. This is particularly critical in multiplex assays designed to differentiate the two species.
Protocol for Cut-off Validation:
- Template Preparation: Generate a standard dilution series (e.g., 10^6 to 10^1 copies/µL) for both E. histolytica and E. dispar using cloned plasmid DNA or synthetic gBlocks.
- qPCR Run: Perform qPCR in triplicate for each dilution using the species-specific primers and probes. Include no-template controls (NTCs) in triplicate.
- Data Collection: Record Ct values for all wells.
- Statistical Analysis:
- Calculate the mean and standard deviation (SD) of the Ct values for the NTCs.
- Establish a preliminary cut-off at Mean(NTC) + 3*SD. Any sample with a Ct value lower (i.e., detected earlier) than this threshold is considered potentially positive.
- Determine the Limit of Detection (LoD) as the lowest concentration where 95% of replicates are detected above the preliminary cut-off.
- Using clinical or spiked samples, perform a receiver operating characteristic (ROC) curve analysis to validate the cut-off against a gold standard (e.g., nested PCR followed by sequencing), optimizing for both sensitivity and specificity.
Table 1: Example Ct Cut-off and LoD Data for a Hypothetical Duplex Assay
| Species | Target Gene | LoD (copies/µL) | Mean Ct at LoD | Established Diagnostic Ct Cut-off | Specificity vs. Other Species |
|---|---|---|---|---|---|
| E. histolytica | 18S rRNA | 5 | 35.2 ± 0.8 | 38.0 | No cross-reactivity with E. dispar, E. moshkovskii |
| E. dispar | 18S rRNA | 5 | 34.8 ± 0.7 | 37.5 | No cross-reactivity with E. histolytica, E. moshkovskii |
| NTC | -- | -- | Undetected (Ct=40) | 40.0 | -- |
Analyzing Melt Curves for Specificity and Genotyping
Melt curve analysis following SYBR Green-based qPCR is a cost-effective tool for differentiating amplicons based on their melting temperature (Tm). Even when using probe-based assays for primary detection, melt analysis can verify amplicon identity.
Protocol for High-Resolution Melt (HRM) Analysis:
- qPCR-HRM Setup: Perform qPCR using SYBR Green chemistry and species-specific primers that amplify regions with known sequence variations between E. histolytica and E. dispar.
- Post-Amplification Melting: After the final amplification cycle, slowly heat the product from 65°C to 95°C (e.g., 0.1°C/sec) while continuously monitoring fluorescence.
- Data Normalization: Use the instrument software to normalize and temperature-shift the melt curves. Plot the negative derivative of fluorescence versus temperature (-dF/dT vs. T).
- Peak Analysis: Identify the peak Tm for each sample. Compare sample Tm to the Tm of known reference controls.
- Genotype Clustering: Use advanced HRM software to perform curve shape analysis and generate difference plots or confidence interval plots for precise genotype clustering.
Table 2: Characteristic Melt Curve Tm for Entamoeba spp. Differentiation
| Species | Target Locus | Amplicon Length (bp) | Expected Tm Range (°C) | Distinguishing Feature |
|---|---|---|---|---|
| E. histolytica | Chitinase | 183 | 78.5 ± 0.3 | Single, distinct peak |
| E. dispar | Chitinase | 183 | 76.0 ± 0.3 | Clear 2.5°C shift from E. histolytica |
| E. moshkovskii | 18S rRNA | 150 | 80.2 ± 0.4 | Higher Tm distinct from both |
| Primer-Dimer | -- | -- | < 75.0 | Broad, low-temperature peak |
Diagram Title: High-Resolution Melt Curve Analysis Workflow
Quantification Strategies: Absolute vs. Relative
Choosing the correct quantification approach depends on the research question—whether determining exact parasite load (critical for virulence studies) or measuring gene expression changes (e.g., in drug response assays).
A. Absolute Quantification for Parasite Burden
- Method: Uses a standard curve of known copy numbers to interpolate the quantity in an unknown sample.
- Application in Entamoeba Research: Quantifying cyst or trophozoite equivalents in stool or liver abscess samples. This is essential for establishing correlations between parasite load and disease severity.
Protocol for Standard Curve Generation:
- Standard Preparation: Serially dilute (10-fold) a quantified DNA template (plasmid or genomic DNA) across at least 5 orders of magnitude, encompassing the expected target range in samples.
- qPCR Run: Amplify standards and unknown samples on the same plate.
- Curve Fitting: Plot the Ct values of the standards against the log of their starting quantity. The software generates a linear regression line (y = mx + b), where efficiency E = 10^(-1/slope) - 1.
- Sample Interpolation: The software uses the regression equation to calculate the starting quantity (N) for each unknown sample: N = 10^((Ct - b) / m).
B. Relative Quantification for Gene Expression
- Method: Compares expression of a target gene to one or more reference genes (e.g., actin, GAPDH) using the ΔΔCt method.
- Application in Entamoeba Research: Studying differential expression of virulence factors (e.g., galactose/N-acetylgalactosamine inhibitable lectin) in E. histolytica under drug pressure or during encystation.
Diagram Title: Quantification Strategy Selection Logic
Table 3: Comparison of qPCR Quantification Methods for Entamoeba Research
| Aspect | Absolute Quantification | Relative Quantification (ΔΔCt) |
|---|---|---|
| Primary Use | Determining exact copy number/load | Measuring fold-change in gene expression |
| Standard Required | External DNA standard curve | Endogenous reference gene(s) |
| Key Output | Copies/µL or equivalents/mL | Fold-change (2^-ΔΔCt) |
| Critical Validation | Standard curve efficiency (90-110%), R² >0.99 | Reference gene stability (geNorm, NormFinder) |
| Application Example | E. histolytica burden in liver abscess aspirate | Upregulation of amoebapore genes under oxidative stress |
The Scientist's Toolkit: Research Reagent Solutions
Table 4: Essential Reagents for E. histolytica/dispar qPCR Research
| Reagent/Material | Function & Specification | Key Consideration for Entamoeba Research |
|---|---|---|
| Species-Specific Primers/Probes | Amplify and detect unique genomic regions (e.g., 18S rRNA, chitinase, surface protein genes). | Must be validated against a panel of related species (E. moshkovskii, E. bangladeshi) to ensure specificity. |
| Commercial qPCR Master Mix | Provides enzymes, dNTPs, buffer, and optimized dye (SYBR Green or probe-compatible). | Choose mixes resistant to inhibitors common in stool samples (e.g., containing UDG for carryover prevention). |
| Synthetic gBlock or Plasmid DNA | Serve as quantifiable positive controls and standards for absolute quantification. | Cloned sequences must contain the exact amplicon region. Include a spacer to mimic genomic context if needed. |
| Inhibitor Removal Kit (Stool/DNA) | Purify PCR-amplifiable DNA from complex biological samples like stool or abscess material. | Critical for clinical sensitivity. Efficiency should be validated with spiked samples. |
| Reference Gene Assay (e.g., Actin, GAPDH) | For normalization in relative quantification studies of E. histolytica gene expression. | Must demonstrate stable expression under all experimental conditions (e.g., drug treatment, life cycle stage). |
| HRM Calibration Dye | Enhances temperature resolution and uniformity in High-Resolution Melt analysis. | Required for reliable discrimination of Tm differences <0.5°C between species. |
| Nuclease-Free Water | Diluent for standards, controls, and master mix preparation. | Essential to prevent contaminating nucleases from degrading primers, probes, and templates. |
1. Introduction Within the broader thesis on Entamoeba histolytica and dispar differentiation by qPCR, this document details the translation of this core molecular technique into applied settings. Accurate discrimination between the pathogenic E. histolytica and the non-pathogenic E. dispar is critical for clinical management, epidemiological understanding, and therapeutic development. This guide provides technical protocols and frameworks for these applications.
2. Clinical Diagnostics: Protocol for Differential Detection The primary clinical application is the specific identification of E. histolytica in stool samples to guide metronidazole treatment, avoiding unnecessary therapy for E. dispar colonization.
2.1 Detailed Protocol: DNA Extraction and qPCR
- Sample Preparation: Suspend ~200 mg of fresh or frozen stool in 1.4 mL of phosphate-buffered saline. Vortex thoroughly.
- DNA Extraction: Use a commercially available stool DNA isolation kit. Include a process control (e.g., a known bacteriophage) spiked into the lysis buffer to monitor extraction efficiency and PCR inhibition.
- qPCR Reaction Setup:
- Primers/Probes: Use species-specific TaqMan probes.
- E. histolytica: Target the 18S rRNA or chromosomal pattern gene.
- E. dispar: Target species-specific sequences.
- Internal Control: Include primers/probes for the spike-in bacteriophage or a human housekeeping gene (if extracting from cultured trophozoites).
- Master Mix: 1X qPCR master mix, forward/reverse primers (400 nM each), probe (200 nM), template DNA (5 μL), nuclease-free water to 25 μL.
- Primers/Probes: Use species-specific TaqMan probes.
- Cycling Conditions: 95°C for 3 min; 45 cycles of 95°C for 15 sec, 60°C for 1 min (data acquisition).
- Analysis: Determine cycle threshold (Ct). A sample is positive if Ct < 40 with a characteristic amplification curve. Differentiation is based on which probe signal is detected.
2.2 Key Performance Data
Table 1: Diagnostic Performance of a Representative Multiplex qPCR Assay
| Metric | E. histolytica Detection | E. dispar Detection |
|---|---|---|
| Analytical Sensitivity | 1-10 parasites per reaction | 1-10 parasites per reaction |
| Analytical Specificity | 100% (no cross-reactivity with E. dispar, E. moshkovskii, G. lamblia, etc.) | 100% (no cross-reactivity with E. histolytica) |
| Clinical Sensitivity | 96-100% compared to antigen testing | 98-100% compared to PCR gold standard |
| Clinical Specificity | 99-100% | 99-100% |
3. Cohort Studies: Protocol for Epidemiological Surveillance qPCR enables high-throughput screening to determine the true prevalence and pathogenic burden in endemic populations.
3.1 Detailed Protocol: Large-Scale Screening Workflow
- Study Design: Define cohort (e.g., children <5 years, immigrants from endemic areas). Collect stool samples in nucleic acid preservative (e.g., RNAlater) for batch processing.
- High-Throughput DNA Extraction: Utilize 96-well plate format robotic extraction systems. Include one negative (water) and one positive (E. histolytica DNA) control per plate.
- Multiplex qPCR Setup: Perform a singleplex or duplex reaction for differentiation. Use a automated liquid handler for reproducibility.
- Data Management: Record Ct values, sample metadata (age, symptoms, location) in a linked database. Calculate prevalence ratios and odds ratios using statistical software.
3.2 Key Cohort Data Output
Table 2: Example Data Output from a Cohort Study in an Endemic Region (N=2000)
| Pathogen | Number Positive | Prevalence (%) | Asymptomatic Carriage (%) | Associated with Diarrhea (Odds Ratio, 95% CI) |
|---|---|---|---|---|
| Entamoeba histolytica | 85 | 4.25 | 40% | 4.2 (2.8–6.3) |
| Entamoeba dispar | 310 | 15.5 | 92% | 1.1 (0.8–1.5) |
| Co-infection | 12 | 0.6 | 33% | 5.8 (2.1–16.0) |
4. Anti-Amebic Drug Screening: Protocol for In Vitro Trophozoite Assay qPCR quantifies parasite DNA as a surrogate for viable trophozoite number, offering an objective endpoint for drug efficacy.
4.1 Detailed Protocol: Drug Screening with qPCR Readout
- Culture: Maintain E. histolytica (HM-1:IMSS strain) trophozoites in TYI-S-33 medium at 37°C.
- Drug Incubation: Harvest log-phase trophozoites. Seed 96-well plates at 5 x 10^3 trophozoites/well in 200 μL medium. Add serial dilutions of test compounds (e.g., metronidazole as control, novel libraries). Include no-drug controls. Incubate for 48-72 hours.
- Sample Processing: Post-incubation, lyse plates by freezing at -80°C for ≥1 hour. Thaw and mix. Transfer 100 μL of lysate for DNA extraction (96-well plate format).
- Quantitative PCR: Perform qPCR targeting a single-copy E. histolytica gene. Run in triplicate. Include a standard curve of known trophozoite numbers (e.g., 10^1 to 10^6 parasites) from a parallel lysed culture plate to convert Ct to parasite equivalents.
- Analysis: Calculate % inhibition relative to no-drug control. Determine IC50/IC90 values using non-linear regression (e.g., four-parameter logistic model).
4.2 Key Screening Data Output
Table 3: Example Anti-Amebic Drug Screening Results
| Compound | IC50 (μM) | IC90 (μM) | 95% CI for IC50 | Selectivity Index (vs. mammalian cells) |
|---|---|---|---|---|
| Metronidazole (Control) | 1.2 | 4.8 | 0.9–1.6 | >100 |
| Novel Compound A | 0.08 | 0.35 | 0.05–0.12 | 45 |
| Novel Compound B | 15.6 | >50 | 12.1–20.2 | 1.2 |
5. The Scientist's Toolkit: Research Reagent Solutions
Table 4: Essential Materials for E. histolytica/dispar qPCR Applications
| Item | Function | Example Product/Catalog |
|---|---|---|
| Stool DNA Isolation Kit | Efficiently extracts inhibitor-free DNA from complex stool matrices. | QIAamp PowerFecal Pro DNA Kit |
| qPCR Master Mix | Provides polymerase, dNTPs, buffer, and optimized chemistry for probe-based detection. | TaqMan Environmental Master Mix 2.0 |
| Species-Specific Primers/Probes | Oligonucleotides for specific amplification of E. histolytica or E. dispar DNA. | Custom-designed from published sequences (e.g., Verweij et al., 2004 JCM). |
| Internal Control DNA/Spike | Monitors for PCR inhibition and extraction efficiency. | MS2 bacteriophage or exogenous synthetic DNA. |
| E. histolytica Reference DNA | Positive control for assay validation and standard curve generation. | ATCC 30459D-5 |
| TYI-S-33 Medium | For axenic cultivation of E. histolytica trophozoites for drug assays. | ATCC Medium 2154 |
| 96-Well Plate Sealer | Prevents evaporation and contamination during thermal cycling. | Microseal 'B' Adhesive Seals |
6. Visualizations
Title: Clinical Diagnostic qPCR Workflow
Title: Cohort Study Analysis Pathway
Title: Drug Screening with qPCR Endpoint
Solving Common qPCR Pitfalls: Enhancing Sensitivity and Specificity for Entamoeba Detection
Within the critical research on Entamoeba histolytica and Entamoeba dispar differentiation by qPCR, the analysis of stool samples presents a formidable analytical challenge. PCR inhibition, caused by a complex milieu of biological and chemical substances in feces, directly compromises diagnostic accuracy, pathogen load quantification, and genotyping studies. This whitepaper provides an in-depth technical guide to the sources, detection, and strategic overcoming of PCR inhibition, ensuring reliable molecular diagnostics and research outcomes.
Inhibitory substances co-extracted with nucleic acids interfere with polymerase activity, nucleic acid denaturation, or fluorescence detection.
Table 1: Common PCR Inhibitors in Stool Samples and Their Modes of Action
| Inhibitor Category | Specific Compounds/Components | Primary Mechanism of Interference |
|---|---|---|
| Bile Salts & Bilirubin | Cholate, deoxycholate, bilirubin | Disruption of polymerase enzyme activity; binding to DNA. |
| Complex Polysaccharides | Glycogen, plant-derived polysaccharides | Binding of essential cations (Mg2+); increased viscosity. |
| Bacterial Metabolites | Short-chain fatty acids (e.g., formic, acetic), phenols | Lowering local pH; denaturation of enzymes. |
| Hemoglobin Derivatives | Heme, porphyrins | Interference with the fluorescence detection system; inhibition of polymerase. |
| Food Derivatives | Polyphenols (e.g., tannins, humic acids), calcium ions | Binding to proteins/DNA; chelation of Mg2+ cofactors. |
| Host Molecules | Immunoglobulins, mucin, urea | Protein-mediated enzyme inhibition; disruption of primer annealing. |
Detection and Assessment of Inhibition
Prior to implementing inhibition strategies, its presence must be confirmed.
Protocol 1: Internal Control (IC) Spike-in Assay for Inhibition Detection
- Spike-in Addition: Introduce a known, low copy number of a non-competitive synthetic DNA or RNA sequence (or a whole organism control unrelated to the target, e.g., phage DNA) into each sample lysate prior to nucleic acid extraction.
- Co-amplification: Perform a multiplex qPCR assay with separate primer/probe sets for the target (E. histolytica/dispar) and the spiked IC.
- Analysis: Compare the Cq value of the IC in the test sample to the mean Cq from inhibition-free control reactions (e.g., in nuclease-free water).
- Result Interpretation: A significant delay in IC Cq (e.g., ΔCq > 2-3 cycles) indicates the presence of PCR inhibitors in the sample extract.
Protocol 2: Sample Dilution Test
- Prepare Dilutions: Create a series of dilutions (e.g., 1:2, 1:5, 1:10) of the extracted nucleic acid sample in nuclease-free water.
- Amplify: Run qPCR for the target on each dilution.
- Analysis: Plot the observed Cq values against the log of the dilution factor.
- Result Interpretation: A non-linear relationship, where the Cq shift is less than expected (e.g., a 1:10 dilution should yield ~3.3 cycles later Cq), confirms the presence of inhibitors that are being diluted out.
Strategic Approaches to Overcome Inhibition
Optimized Nucleic Acid Extraction
The choice of extraction method is the first and most critical line of defense.
Table 2: Comparison of Extraction Method Efficacy Against Inhibitors
| Method | Principle | Efficacy Against Stool Inhibitors | Key Considerations for Entamoeba |
|---|---|---|---|
| Phenol-Chloroform | Organic separation, protein precipitation. | High for polysaccharides, proteins. | Labor-intensive, hazardous chemicals; requires careful phase separation. |
| Silica-Membrane Spin Columns | Selective binding in high chaotropic salt, washing, elution. | Moderate to High (dependent on wash stringency). | Standard method; wash buffers with ethanol are critical for inhibitor removal. |
| Magnetic Bead-Based | Binding to paramagnetic particles, magnetic separation/wash. | High (allows for more stringent/voluminous washes). | Amenable to automation; often includes tailored stool pretreatment steps. |
| Inhibition-Resistant Polymerase Additives | Use of polymerases with enhanced tolerance or specialized reaction buffers. | Used as a supplement post-extraction. | Not a replacement for clean extraction but a useful adjunct for residual inhibition. |
Protocol 3: Modified Magnetic Bead Extraction with Inhibitor Removal Wash This protocol incorporates an additional wash step to remove common stool inhibitors.
- Sample Pretreatment: Homogenize ~200 mg stool in 1-2 mL of a specialized lysis buffer containing guanidinium thiocyanate, EDTA, and a detergent.
- Binding: Add proteinase K, incubate at 56°C for 15 min. Add isopropanol and magnetic beads, mix thoroughly.
- Wash 1 (Primary): Separate beads, discard supernatant. Wash with a buffer containing high concentrations of chaotropic salt and ethanol.
- Wash 2 (Inhibitor Removal): Critical Step. Wash beads with a buffer containing 70-80% ethanol supplemented with 100-200 mM NaCl. This helps displace residual polysaccharides and bile salts.
- Final Wash & Elution: Perform a final 80% ethanol wash. Dry beads and elute DNA in a low-EDTA TE buffer or nuclease-free water. Elution at 65°C for 5 min can increase yield.
PCR Reaction Engineering
Use of Inhibition-Resistant Polymerases: Employ engineered polymerases (e.g., Tth or recombinant Taq with accessory proteins) that are tolerant to heme, bile salts, and humic acids. Buffer Modification: Increase MgCl2 concentration to counteract chelators. Include amplification facilitators such as bovine serum albumin (BSA, 0.1-0.5 mg/mL), which binds polyphenols and heme, or betaine (0.5-1.2 M), which stabilizes polymerase and aids in denaturing complex DNA. Reaction Clean-up (Post-Extraction): For stubborn inhibition, use commercial "PCR inhibitor removal" spin columns on the extracted DNA prior to setting up the qPCR.
Sample Dilution
As per Protocol 2, simple dilution of the DNA template can reduce inhibitor concentration below a functional threshold. This is a pragmatic first-line strategy, albeit with a potential reduction in sensitivity for low-copy-number targets.
Alternative Sample Processing
Cyst Enrichment: For Entamoeba, a formalin-ethyl acetate sedimentation or gradient centrifugation step can partially purify cysts from soluble inhibitors prior to DNA extraction, though it may reduce overall recovery.
The Scientist's Toolkit: Research Reagent Solutions
Table 3: Essential Materials for Overcoming PCR Inhibition in Stool qPCR
| Item | Function & Rationale |
|---|---|
| Inhibitor-Resistant DNA Polymerase Mix | Contains polymerases and buffer formulations specifically optimized for challenging samples like stool. |
| External or Internal Inhibition Control | Synthetic oligonucleotide or non-pathogenic organism DNA to spike into samples to monitor inhibition. |
| Bovine Serum Albumin (BSA), Molecular Grade | Acts as a competitive binder for common inhibitors like polyphenols and humic acids. |
| Guanidinium Thiocyanate-Based Lysis Buffer | A powerful chaotropic agent that denatures proteins, inactivates nucleases, and facilitates inhibitor separation. |
| Magnetic Bead-Based NA Extraction Kit (Stool-Specific) | Provides optimized buffers for stool lysis and inhibitor removal via magnetic wash steps. |
| PCR Inhibitor Removal Spin Columns | Used post-extraction for an additional clean-up of particularly difficult samples. |
| Betaine Solution (5M) | A chemical chaperone that reduces DNA secondary structure and stabilizes polymerase. |
| MgCl2 Solution (25-50mM) | To supplement reaction buffers where chelation of Mg2+ by inhibitors is suspected. |
Accurate differentiation of Entamoeba histolytica from E. dispar via qPCR in stool samples is non-negotiable for appropriate clinical and research conclusions. A systematic, multi-layered strategy—combining an optimized, stringent nucleic acid extraction protocol, the use of inhibitor-resistant enzymes and reaction additives, and rigorous monitoring via internal controls—is essential to overcome the pervasive challenge of PCR inhibition. Implementing these protocols ensures data integrity, maximizes detection sensitivity, and advances the reliability of molecular parasitology research.
Visualizations
Strategy Workflow for Inhibitor Management
Common Inhibitors and Their Primary Mechanisms
In the specific context of molecular differentiation between Entamoeba histolytica and Entamoeba dispar via qPCR, obtaining sufficient and pure template DNA from clinical (e.g., stool) or environmental samples is a pervasive challenge. Low parasite load, inefficient DNA extraction, and the presence of PCR inhibitors frequently result in low DNA yield or target copy number, jeopardizing assay sensitivity and specificity. This technical guide details current, validated pre-PCR enrichment and concentration techniques essential for robust E. histolytica/dispar qPCR diagnostics and research.
Core Challenges inEntamoebaSample Processing
E. histolytica cysts/trophozoites in stool samples are often present in low numbers (<1000 cysts per gram) and are unevenly distributed. Concurrently, stool is a complex matrix rich in polysaccharides, bilirubin, and complex fats that act as potent PCR inhibitors. Direct DNA extraction often yields DNA concentrations below the limit of detection (LOD) for standard qPCR assays targeting the 18S rRNA or other discriminatory genes.
Pre-PCR Enrichment and Concentration Techniques
Physical Enrichment of Parasites
Prior to DNA extraction, physical separation of cysts from fecal debris can significantly increase target concentration.
Protocol: Ether Concentration Method (Modified from Ridley & Hawgood, 1956)
- Emulsify 1-2 g of stool in 10 mL of saline.
- Filter through a double-layered gauze or a 500 µm sieve into a 15 mL conical tube.
- Add 3-4 mL of diethyl ether, stopper, and shake vigorously for 1 minute.
- Centrifuge at 500 x g for 3 minutes. Four layers will form: ether, plug of debris, saline, sediment.
- Freeze the tube in ethanol-dry ice to solidify the ether plug. Decant all liquid and plug, leaving the sediment.
- Use the sediment for immediate DNA extraction or store at -80°C.
DNA Extraction & Post-Extraction Concentration
Choice of extraction kit and subsequent concentration are critical.
Protocol: Silica-Membrane Column-Based Extraction with Carrier RNA
- Use a high-efficiency stool DNA kit (e.g., QIAamp PowerFecal Pro DNA Kit).
- Critical Step: Include 1-2 µg of carrier RNA (e.g., poly-A RNA) in the lysis buffer. This improves adsorption of minute amounts of parasitic DNA to the silica membrane, reducing loss.
- Perform extraction per manufacturer's instructions.
- Elute in a small volume (20-50 µL) of TE buffer or nuclease-free water.
Protocol: Ethanol/Sodium Acetate Re-precipitation for Concentrating Eluted DNA
- To the eluted DNA (e.g., 50 µL), add 5 µL of 3M sodium acetate (pH 5.2) and 125 µL of ice-cold 100% ethanol.
- Mix and incubate at -80°C for 30 minutes or -20°C overnight.
- Centrifuge at >12,000 x g for 30 minutes at 4°C.
- Carefully decant supernatant. Wash pellet with 200 µL of 70% ethanol.
- Centrifuge at 12,000 x g for 5 minutes. Air-dry pellet for 5-10 minutes.
- Resuspend pellet in 10-20 µL of TE buffer (a 2.5-5x concentration factor).
Target-Specific Pre-Amplification
For ultra-low copy numbers, a target-specific pre-amplification step can be employed.
Protocol: Nested PCR Pre-Amplification for qPCR
- Design an outer primer set spanning a larger region of the E. histolytica/dispar 18S rRNA gene.
- Perform a first-round, low-cycle (10-15 cycles) standard PCR with the extracted DNA.
- Dilute the first-round product 1:10 to 1:100.
- Use this diluted product as template for the standard, species-specific qPCR assay. Critical: Establish rigorous contamination controls (separate rooms, UV treatment, uracil-DNA glycosylase).
Comparative Data of Techniques
Table 1: Impact of Pre-PCR Techniques on qPCR Detection of E. histolytica
| Technique | Sample Input | Mean DNA Yield (ng/µL) | Mean Ct Value Improvement vs. Direct Extraction | Estimated Fold-Increase in Sensitivity |
|---|---|---|---|---|
| Direct Extraction (Kit only) | 200 mg stool | 0.5 ± 0.3 | Baseline (Ct = Undetected) | 1x |
| Ether Concentration + Extraction | 200 mg stool | 2.1 ± 1.1 | ΔCt = -3.5 | ~10x |
| Extraction with Carrier RNA | 200 mg stool | 1.8 ± 0.9* | ΔCt = -2.8 | ~7x |
| Ethanol Re-precipitation (Post-Extraction) | 50 µL eluate | N/A (Concentration) | ΔCt = -1.5 | ~3x |
| Nested Pre-Amplification (15 cycles) | 2 µL extract | N/A (Target Amplified) | ΔCt = -8 to -10 | ~250-1000x |
Yield reflects total nucleic acid; carrier increases recovery of low-concentration DNA. *Comparison is for samples initially undetected becoming positive.
Table 2: Recommended Technique Selection Based on Scenario
| Scenario (Suspected Parasite Load) | Recommended Pre-PCR Strategy | Rationale |
|---|---|---|
| High (Symptomatic, dysentery) | Direct extraction or Ether concentration | Adequate target; priority is speed and inhibitor removal. |
| Low (Asymptomatic carrier) | Ether concentration + Extraction with Carrier RNA | Maximizes physical and chemical recovery of limited targets. |
| Very Low / Trace (Post-treatment monitoring) | Combined Ether/Carrier RNA + Ethanol Re-precipitation | Aggressive concentration at both parasite and DNA levels. |
| Unknown / Inhibitor-Rich Sample | Above + Dilution of extract (1:5, 1:10) | Addresses both low yield and co-purified PCR inhibitors. |
Workflow and Pathway Diagrams
Diagram 1: Pre-PCR Workflow for Low Yield Entamoeba DNA
Diagram 2: Stool Inhibitor Impact on qPCR
The Scientist's Toolkit: Research Reagent Solutions
Table 3: Essential Materials for Pre-PCR Concentration in Entamoeba Research
| Item | Function | Example Product/Note |
|---|---|---|
| Carrier RNA | Improves binding of low-concentration nucleic acids to silica membranes during extraction, reducing loss. | Polyadenylic Acid (Poly-A), 1 mg/mL. Add to lysis buffer. |
| Inhibitor-Removal Stool DNA Kit | Optimized buffers to remove polysaccharides, humic acids, and bile salts. | QIAamp PowerFecal Pro, Norgen Stool DNA Isolation Kit. |
| Silica Membrane Mini-Columns | Standard for nucleic acid binding/washing; carrier RNA enhances efficiency. | Included in kits from Qiagen, Macherey-Nagel. |
| Glycogen (Molecular Grade) | Acts as a co-precipitant during ethanol precipitation, visible pellet for low DNA. | 20 µg per precipitation reaction. |
| PCR Inhibitor Removal Resin | Can be used post-extraction to "clean" DNA of remaining inhibitors. | Zymo Research OneStep PCR Inhibitor Removal Kit. |
| Hot-Start, Inhibitor-Tolerant DNA Polymerase | For pre-amplification PCR; resistant to trace inhibitors carryover. | Thermo Scientific Platinum Taq High Fidelity. |
| Species-Specific Primers/Probes | For both nested pre-amplification and final qPCR differentiation. | E. histolytica 18S rRNA (accession X64142), E. dispar (accession X64143). |
| Nuclease-Free Water & TE Buffer | For final DNA resuspension; TE stabilizes dilute DNA. | Invitrogen UltraPure, pH 8.0. |
Within the broader context of developing a highly specific multiplex qPCR assay for the differentiation of Entamoeba histolytica and Entamoeba dispar, the mitigation of non-specific amplification (NSA) and primer-dimer formation is paramount. These artifacts compromise sensitivity, quantitation accuracy, and diagnostic reliability. This guide details the systematic optimization of annealing temperature and probe chemistry to achieve maximum specificity.
Theoretical Underpinnings and Impact onEntamoebaDiagnostics
Both E. histolytica (pathogenic) and E. dispar (non-pathogenic) share significant genomic homology, making primer and probe design inherently challenging. NSA can lead to false-positive signals for E. histolytica, with severe clinical consequences. Primer-dimers, consuming primers and dNTPs, reduce amplification efficiency, potentially causing false-negative results. Optimization targets the selective amplification of unique target sequences, such as the 18S rRNA gene or specific genomic islands.
Optimization of Annealing Temperature (Ta)
The annealing temperature is the most critical variable for specificity. A Ta too low promotes off-target binding; a Ta too high reduces yield.
Experimental Protocol: Temperature Gradient qPCR
- Primer Design: Design primers targeting species-specific loci (e.g., E. histolytica: GenBank X64142; E. dispar: GenBank X64143). Primer length: 18-22 bp. GC content: 40-60%.
- Reaction Setup: Prepare a master mix containing:
- 1X Hot Start DNA Polymerase Buffer
- 3-5 mM MgCl2 (initial concentration)
- 0.2 mM each dNTP
- 0.2 µM each forward and reverse primer
- 1X intercalating dye (e.g., SYBR Green I)
- 1 µL DNA template (from stool samples, cultured trophozoites, or spiked controls)
- 0.5-1 unit Hot Start DNA Polymerase
- Nuclease-free water to final volume (e.g., 20 µL).
- Gradient Programming: Run on a gradient-capable thermal cycler. Use a two-step protocol:
- Initial Denaturation: 95°C for 2 min.
- 40 cycles of: Denaturation (95°C, 15 sec); Annealing/Extension (Gradient from 50°C to 65°C, 60 sec).
- Melting Curve Analysis: 65°C to 95°C, increment 0.5°C.
- Data Analysis: The optimal Ta is the highest temperature that yields the lowest Cq with a single, sharp melt peak matching the positive control.
Table 1: Representative Results from Annealing Temperature Gradient on Synthetic Entamoeba DNA
| Annealing Temp (°C) | E. histolytica Cq (Mean) | E. dispar Cq (Mean) | ∆Cq (E.hist - E.dis) | Melt Peak Tm (°C) | Specificity Note |
|---|---|---|---|---|---|
| 50.0 | 22.5 | 23.1 | -0.6 | 78.5, 72.1* | Multiple peaks |
| 55.0 | 23.1 | 23.8 | -0.7 | 78.5 | Specific |
| 58.5 | 23.3 | 24.0 | -0.7 | 78.6 | Optimal |
| 62.0 | 24.9 | 25.5 | -0.6 | 78.7 | Specific |
| 65.0 | 28.7 | No Amp | N/A | N/A | Loss of E. dispar |
*Secondary lower-Tm peak indicates primer-dimer.
Title: Annealing Temperature Optimization Workflow
Advanced Probe Chemistry for Multiplex Differentiation
While intercalating dyes detect all dsDNA, sequence-specific probes are essential for multiplex assays. Probe chemistry choice impacts background, multiplexing capacity, and specificity.
Experimental Protocol: Probe-Based Multiplex Assay Setup
- Probe Selection:
- TaqMan Probes (Hydrolysis): Dual-labeled (FAM/BHQ1 for E. histolytica, HEX/BHQ1 for E. dispar). Design probes within a highly divergent region of the amplicon. A 3'-blocking phosphate is optional to prevent extension.
- Locked Nucleic Acid (LNA) Probes: Incorporate LNA nucleotides to increase Tm and specificity, allowing for shorter probes ideal for discriminating single nucleotide polymorphisms (SNPs) between species.
- Reaction Optimization: Use the optimized Ta from Section 2. Titrate probe concentration (50-250 nM) against a fixed primer concentration (200 nM). Include an internal control probe (e.g., VIC-labeled).
- Quencher Comparison: Test dark quenchers (BHQ-2, BHQ-3) against traditional TAMRA for lower background, especially in multiplex setups.
Table 2: Comparison of Probe Chemistries for Entamoeba histolytica/dispar Differentiation
| Probe Chemistry | Label (Example) | Quencher | Key Advantage | Limitation | Best For |
|---|---|---|---|---|---|
| TaqMan | FAM | BHQ-1 | Well-established, robust | Limited multiplex channels | Standard singleplex/duplex |
| TaqMan-MGB | NED | NFQ-MGB | Shorter probes, higher specificity & Tm | More expensive | Discriminating high homology targets |
| LNA | HEX | BHQ-1 | Extremely high specificity & Tm; SNP discrimination | Complex design/synthesis | SNP-based differentiation |
| Dual-Hybridization Probes | LC610, LC670 | None (FRET) | In-tube melt curve for variant ID | Requires compatible instrument | Research/sequencing confirmation |
Title: NSA/Primer-Dimer Causes and Optimization Strategies
The Scientist's Toolkit: Research Reagent Solutions
Table 3: Essential Reagents for Optimizing Entamoeba qPCR Assays
| Reagent/Material | Function & Rationale | Example Product/Brand |
|---|---|---|
| Hot-Start DNA Polymerase | Prevents primer extension during setup, drastically reducing primer-dimer formation. Essential for complex templates. | Thermo Fisher Platinum Taq, Takara Ex Taq HS, Qiagen HotStarTaq Plus |
| dNTP Mix | Nucleotide building blocks. Balanced, high-purity mixes ensure fidelity. Low concentration can reduce primer-dimer. | Thermo Fisher dNTP Set, Promega dNTP Mix |
| MgCl2 Solution | Cofactor for polymerase. Concentration directly affects primer annealing and dimer formation. Requires titration. | Provided with enzyme or separate (e.g., Sigma-Aldrich) |
| qPCR Probe Master Mix | Optimized buffer, enzyme, dNTPs for probe-based assays. Often includes ROX as a passive reference dye. | Thermo Fisher TaqMan Universal MM II, Bio-Rad SsoAdvanced Universal Probes Supermix |
| Sequence-Specific Probes | Provides target-specific detection. MGB or LNA modifications enhance discrimination of homologous sequences. | Custom orders from IDT, Thermo Fisher, or Eurogentec |
| Nuclease-Free Water | Solvent. Must be free of contaminants and nucleases to prevent degradation of primers/probes/template. | Ambion Nuclease-Free Water, Sigma-Aldrich |
| Synthetic gBlock DNA | Quantified, sequence-perfect positive control for E. histolytica and E. dispar. Critical for optimizing sensitivity and cross-reactivity. | IDT gBlocks Gene Fragments |
| Inhibitor Removal Beads/Columns | For stool DNA extraction. Removes PCR inhibitors (bile salts, complex polysaccharides) common in clinical samples. | Qiagen PowerFecal Pro DNA Kit, Zymo Research Inhibitor Removal Technology |
The differentiation of Entamoeba histolytica (pathogenic) from Entamoeba dispar (non-pathogenic) via qPCR is critical for accurate diagnosis and epidemiological studies. A central limitation in this research, particularly when screening for asymptomatic carriers or individuals with low parasite burdens, is the assay's Limit of Detection (LOD). This whitepaper details technical strategies to refine qPCR assays to achieve lower, more robust LODs, enabling the reliable detection of minute quantities of target DNA, a prerequisite for understanding true infection prevalence and disease dynamics.
Core Strategies for LOD Improvement
Improving LOD is a multi-faceted endeavor focusing on pre-amplification sample processing, amplification chemistry, and post-amplification analysis.
| Strategy Category | Specific Approach | Theoretical Impact on LOD | Key Consideration for E. histolytica/dispar |
|---|---|---|---|
| Sample Preparation | Automated nucleic acid extraction (magnetic beads) | Increases yield and purity of target DNA. Reduces inhibitors. | Efficient lysis of robust cyst walls is crucial. |
| Inhibitor Removal (e.g., with polyvinylpolypyrrolidone) | Reduces false negatives by removing PCR inhibitors (common in stool). | Essential for complex stool matrices from asymptomatic carriers. | |
| Target Enrichment (e.g., centrifugation, filtration) | Concentrates parasites prior to DNA extraction. | Must preserve fragile trophozoites if present. | |
| Assay Chemistry | Use of qPCR Master Mixes with Inhibitor Resistance | Tolerant to common inhibitors, improving reaction efficiency. | Commercial mixes vary; require validation with stool eluates. |
| Assay Design Optimization | Shorter amplicons (80-150 bp) amplify more efficiently from degraded/Fragmented DNA. | Must be designed within conserved, differentiating genomic regions. | |
| Probe Chemistry (e.g., minor groove binder (MGB) probes) | Increase Tm and specificity, allowing shorter, more specific probes. | Enhables differentiation of single-nucleotide polymorphisms (SNPs) between species. | |
| Digital PCR (dPCR) | Absolute quantification without standard curves. More tolerant to inhibitors. | Emerging as gold standard for ultra-low target detection and validation. | |
| Reaction & Analysis | Increased Template Volume | Puts more target DNA copies into the reaction. | Limited by inhibitor carryover; typically max 5-10 µL of eluate in 20-25 µL reaction. |
| Nested or Semi-Nested PCR | Dramatically increases sensitivity. | High contamination risk; requires strict physical separation and controls. | |
| Replication (e.g., 8-12 technical replicates) | Statistical detection of very low copy numbers (Poisson distribution). | Distinguishes true low-positive from stochastic amplification failure. |
Detailed Experimental Protocol: A Tiered Approach for LOD Determination and Validation
This protocol outlines a comprehensive method to both improve and rigorously validate a new, lower LOD for a E. histolytica/dispar multiplex qPCR assay.
A. Materials & Reagents (The Scientist's Toolkit)
| Research Reagent Solution | Function & Rationale |
|---|---|
| Mock Stool Matrix | A defined, pathogen-free stool suspension used to spike standards, mimicking the inhibitor background of real samples. |
| Inhibitor-Resistant qPCR Master Mix | Contains polymerase, buffers, and dNTPs optimized for robustness against humic acids, bile salts, and complex polysaccharides. |
| Species-Specific MGB TaqMan Probes | E. histolytica-specific probe (e.g., FAM-labeled), E. dispar-specific probe (e.g., HEX/VIC-labeled). MGB moiety enhances SNP discrimination. |
| Synthetic gBlock Gene Fragments | Cloned DNA sequences containing the exact target regions for both species. Provides absolute copy number standard without extraction variability. |
| Magnetic Bead-Based NA Extraction Kit | Provides high, reproducible DNA yield and purity. Automated platforms preferred for consistency. |
| Inhibitor Removal Beads (PVPP) | Added during extraction to bind and remove phenolic compounds. |
| Digital PCR (dPCR) System | Used as a orthogonal method to confirm copy numbers in low-positive samples and validate the new qPCR LOD. |
B. Protocol Steps
- Assay Re-optimization:
- Redesign primers/probes to generate amplicons ≤100 bp targeting the Eh-specific and Ed-specific SNP regions.
- Perform primer/probe concentration optimization (e.g., 50-900 nM range) using a mid-range copy number standard (e.g., 10^3 copies/µL) in the presence of 20% mock stool matrix.
- Select the combination yielding the lowest Cq with maximum ΔRn.
Sample Processing Refinement:
- Spike known copy numbers (e.g., 1000 to 1 copy) of synthetic gBlock standards into 200 mg of mock stool matrix.
- Extract using the automated magnetic bead protocol, incorporating a PVPP pre-wash step.
- Elute in a small, defined volume (e.g., 50 µL) to maximize concentration.
LOD Determination Experiment:
- Prepare a 10-fold serial dilution of gBlock standards from 10^3 to 10^0 copies/µL in nuclease-free water and in 20% mock stool eluate.
- Run the qPCR assay with 12 technical replicates per dilution point for each matrix.
- Use a cycle threshold (Cq) cutoff of 40. A positive result is defined as amplification with the characteristic sigmoidal curve.
Data Analysis & LOD Calculation:
- Calculate the hit rate (% of positive replicates) for each dilution level.
- The probabilistic LOD (the concentration detected at ≥95% probability) is determined using probit or logistic regression analysis on the hit rate data.
- The absolute LOD (the lowest concentration with 95% of replicates positive) is identified from the dilution series.
Validation with Clinical Samples:
- Obtain archival DNA from previously characterized low-positive and negative samples.
- Re-test all samples in triplicate with the refined assay.
- Confirm copy numbers in discrepant or very low-positive samples (Cq > 38) using a multiplex dPCR assay as a reference standard.
Data Presentation: Example LOD Validation Results
Table 1: Hit Rate Analysis for LOD Determination of Refined E. histolytica Assay
| Target Concentration (copies/reaction) | Positive Replicates (Water Matrix) | Hit Rate (Water) | Positive Replicates (Stool Matrix) | Hit Rate (Stool) |
|---|---|---|---|---|
| 10 | 12/12 | 100% | 12/12 | 100% |
| 5 | 12/12 | 100% | 11/12 | 91.7% |
| 2 | 10/12 | 83.3% | 9/12 | 75% |
| 1 | 7/12 | 58.3% | 5/12 | 41.7% |
| 0.5 | 3/12 | 25% | 2/12 | 16.7% |
| 0 (NTC) | 0/12 | 0% | 0/12 | 0% |
| Probabilistic LOD (95% Detection) | 1.8 copies/rxn | 2.7 copies/rxn |
Table 2: Comparison of Assay Performance Before and After Refinement
| Parameter | Original Assay | Refined Assay | Improvement Factor |
|---|---|---|---|
| Amplicon Length | 170 bp | 92 bp | Better efficiency from fragmented DNA |
| Probe Chemistry | Standard TaqMan | MGB-TaqMan | Increased specificity & signal |
| LOD in Water | 10 copies/rxn | 1.8 copies/rxn | 5.6x more sensitive |
| LOD in Stool Matrix | 20 copies/rxn | 2.7 copies/rxn | 7.4x more sensitive |
| Inhibition Resistance (Cq shift) | ΔCq = +3.5 | ΔCq = +0.8 | Significantly more robust |
Mandatory Visualizations
Tiered LOD Validation Workflow
Multipronged Strategy for LOD Improvement
Within the critical research on Entamoeba histolytica and Entamoeba dispar differentiation by qPCR, robust quality control (QC) is paramount for ensuring diagnostic accuracy, reliable quantification, and valid research conclusions. This technical guide details the essential QC pillars—Internal Controls, No-Template Controls, and Standard Curves—framed within this specific parasitological context.
Internal Controls: Monitoring Reaction Integrity
An Internal Control (IC), often an exogenous synthetic oligonucleotide or a conserved host gene, is co-amplified with the target to identify PCR inhibition and reaction failures.
Key Considerations forE. histolytica/disparqPCR:
- Exogenous IC: A non-competitive synthetic sequence with distinct primers/probe (e.g., using a HEX/VIC fluorophore vs. FAM for target) spiked into each reaction. It validates master mix integrity.
- Endogenous IC: Amplification of a conserved single-copy host gene (e.g., human β-actin) from the sample DNA. It confirms nucleic acid extraction quality and the absence of inhibitors but requires careful validation to avoid interference.
Experimental Protocol: Incorporating an Exogenous IC
- IC Design: Synthesize a 100-150 bp dsDNA fragment with no homology to known sequences.
- Master Mix Preparation: Add IC DNA to the qPCR master mix at a predetermined concentration yielding a Ct between 25-30.
- Assay Setup: Run target and IC assays in multiplex or parallel singleplex reactions.
- QC Criteria: An out-of-range IC Ct (e.g., > ±2 SD from mean) in a sample indicates potential inhibition, invalidating the target result.
No-Template Controls: Contamination Surveillance
No-Template Controls (NTCs) are reactions containing all PCR components except the template nucleic acid, replaced with nuclease-free water or buffer.
Protocol and Interpretation:
- Placement: Include at least one NTC per run, preferably after high-concentration samples.
- Acceptance Criterion: The NTC must show no amplification (Ct = undetermined) for the target assay. Any amplification in the NTC signifies amplicon contamination, compromising all subsequent data.
- Multi-fluorophore NTCs: In multiplex assays with an IC, the NTC must show amplification only for the IC channel.
Standard Curves: The Foundation of Reliable Quantification
Standard curves are essential for determining target copy number, assessing assay efficiency, and defining the linear dynamic range.
Experimental Protocol: Generating a Standard Curve forE. histolytica
Standard Preparation:
- Obtain a gBlock gene fragment containing the target amplicon sequence for the E. histolytica 18S rRNA or other specific gene.
- Quantify the DNA spectrophotometrically (A260) and calculate the copy number using the formula:
Copies/μL = (Concentration (g/μL) × 6.022×10^23) / (Length (bp) × 660 g/mol). - Perform a 10-fold serial dilution in nuclease-free water, typically from 10^7 to 10^1 copies/μL, using carrier DNA (e.g., 10 ng/μL yeast tRNA) to stabilize dilute standards.
qPCR Run: Amplify each standard dilution in triplicate alongside test samples.
Data Analysis: The qPCR software plots the mean Ct value of each standard against the log10 of its starting quantity. A linear regression line is fitted.
Key QC Parameters from the Standard Curve:
Table 1: Standard Curve QC Parameters and Acceptance Criteria
| Parameter | Definition | Ideal Value (Acceptance Range) | Implication for E. histolytica/dispar Assay |
|---|---|---|---|
| Slope | Rate of Ct change per log10 unit. | -3.32 (-3.1 to -3.6) | Defines PCR efficiency. |
| Efficiency (E) | % of template doubled per cycle. E = [10^(-1/slope) -1]*100% | 100% (90%-110%) | Critical for accurate quantification. |
| Y-Intercept | Theoretical Ct at 1 copy. | Variable (should be consistent between runs) | Indicator of assay sensitivity. |
| R^2 | Goodness of fit. | ≥ 0.990 | High confidence in linearity. |
| Dynamic Range | Range of concentrations where linearity holds. | Typically 6-7 logs | Must cover expected pathogen load in clinical samples. |
The Scientist's Toolkit: Research Reagent Solutions
Table 2: Essential Reagents for Entamoeba qPCR QC
| Item | Function & Rationale |
|---|---|
| Synthetic gBlock Gene Fragments | Precisely defined sequence for generating absolute quantification standards for E. histolytica and E. dispar. |
| Commercial Inhibition-Resistant Master Mix | Contains additives to mitigate effects of common inhibitors (polysaccharides, heme) in stool DNA extracts. |
| Exogenous Internal Control Kit (e.g., IC DNA, Primers/Probe) | Ready-to-use, validated system to monitor PCR inhibition without cross-reactivity. |
| UDG/UNG Enzyme & dUTP | Prevents carryover contamination by degrading PCR products from previous runs containing uracil. |
| Nuclease-Free Water (PCR Grade) | Essential for NTCs and dilutions to avoid RNase/DNase contamination. |
| Carrier DNA/RNA | Stabilizes dilute standard curves and improves nucleic acid recovery during extraction. |
| Multiplex qPCR Probes (e.g., FAM, HEX/VIC, Cy5) | Allows simultaneous detection of pathogen target, internal control, and host control in a single well. |
Visualizing the Integrated QC Workflow
Title: Integrated qPCR Quality Control Workflow Decision Tree
Title: Stepwise Protocol for qPCR Standard Curve Creation
Integrating rigorous internal controls, vigilant no-template controls, and meticulously constructed standard curves forms the non-negotiable foundation for trustworthy Entamoeba histolytica and dispar qPCR research. This triad directly addresses the key challenges of inhibition, contamination, and quantitative inaccuracy, ensuring data integrity from the bench to clinical or pharmacological application.
Within the context of research focused on the differentiation of Entamoeba histolytica and Entamoeba dispar by qPCR, assay validation is not merely a regulatory formality but a scientific imperative. Accurate differentiation is critical, as only E. histolytica is invasive and pathogenic, while E. dispar is commensal. Misdiagnosis has significant implications for patient treatment and epidemiological understanding. This guide details the core validation parameters—reproducibility, precision, and robustness—providing a technical framework for establishing a reliable, fit-for-purpose qPCR assay in your laboratory.
Defining Validation Parameters forEntamoebaqPCR
- Reproducibility (Inter-assay Precision): The agreement between results of experiments conducted across different runs, by different operators, using different equipment, over different days. It assesses the assay's consistency in a real-world lab setting.
- Precision (Repeatability/Intra-assay Precision): The agreement between independent replicate measurements from the same run under identical conditions. It measures the inherent noise of the assay.
- Robustness: The capacity of the assay to remain unaffected by small, deliberate variations in method parameters (e.g., annealing temperature, master mix lot, template concentration). It identifies critical control points in the protocol.
Experimental Protocols for Core Validation Studies
A. Protocol for Precision (Repeatability) and Reproducibility Assessment
- Sample Preparation: Create a panel of DNA samples: (i) High-titer E. histolytica gDNA (e.g., from strain HM-1:IMSS), (ii) High-titer E. dispar gDNA (e.g., from strain SAW760), (iii) A known mixture of both, and (iv) Negative control (e.g., DNA from commensal gut flora).
- Replication Strategy: For repeatability, aliquot a single preparation of each sample. Run 10 technical replicates per sample in a single qPCR plate/run. For reproducibility, prepare fresh aliquots from stock for three separate runs performed on different days by two different analysts.
- qPCR Execution: Use a previously published or optimized multiplex TaqMan assay targeting species-specific loci (e.g., E. histolytica 18S rRNA or Eh-cysteine peptidase gene and E. dispar 18S rRNA gene). Use a probe for an internal control (e.g., a human housekeeping gene if simulating clinical samples).
- Data Analysis: Record Cq values for each target. Calculate the mean, standard deviation (SD), and coefficient of variation (%CV = (SD/Mean)*100) for each sample group across all replicates.
B. Protocol for Robustness Testing
- Parameter Variation: Test the following deliberate variations against the optimized protocol (control condition):
- Annealing Temperature: ±2°C from optimal.
- Master Mix: Two different approved lots or brands.
- Template Input Volume: ±25% from standard.
- Reverse Transcription Step (if RT-qPCR): Variation in incubation time (±5 minutes).
- Experimental Design: For each parameter variation, test the same panel of samples (including low-titer positive near the Limit of Detection) in triplicate.
- Analysis: Compare mean Cq, SD, and assay efficiency (from standard curve) of the varied conditions to the control. A robust assay will show no statistically significant difference (e.g., p > 0.05 via t-test) in these key metrics.
Table 1: Precision and Reproducibility Data for E. histolytica-Specific qPCR Assay
| Sample Type | Analytic | Mean Cq (Repeatability, n=10) | SD | %CV | Mean Cq (Reproducibility, n=18 across 3 runs) | SD | %CV |
|---|---|---|---|---|---|---|---|
| High Titer E. histolytica | E. histolytica | 18.5 | 0.15 | 0.81% | 18.7 | 0.28 | 1.50% |
| Low Titer E. histolytica (near LOD) | E. histolytica | 32.8 | 0.42 | 1.28% | 33.1 | 0.85 | 2.57% |
| E. dispar Only | E. histolytica | Undetected | N/A | N/A | Undetected | N/A | N/A |
| Mixed Infection | E. histolytica | 22.1 | 0.19 | 0.86% | 22.3 | 0.35 | 1.57% |
Table 2: Robustness Testing Results for Key Protocol Parameters
| Varied Parameter | Condition | Mean Cq Shift vs. Control | Efficiency Shift vs. Control | Impact Assessment |
|---|---|---|---|---|
| Annealing Temperature | +2°C | +0.4 | -3.5% | Minor (Acceptable) |
| Annealing Temperature | -2°C | +0.8 | -7.2% | Noticeable (Requires Monitoring) |
| Master Mix Lot | Lot B | +0.2 | +1.1% | Negligible |
| Template Volume | -25% | +1.1 | -5.8% | Noticeable (Requires Calibration) |
Visualization of Workflows and Relationships
Title: qPCR Assay Validation Workflow for Entamoeba
Title: Entamoeba Differentiation qPCR Workflow
The Scientist's Toolkit: Key Research Reagent Solutions
Table 3: Essential Materials for Entamoeba histolytica/dispar qPCR Validation
| Item | Function & Rationale | Example/Note |
|---|---|---|
| Species-Specific Primers/Probes | Targets conserved, divergent genomic regions (e.g., 18S rRNA, cysteine protease genes) for definitive differentiation. Must be validated in silico and empirically. | Multiplex TaqMan assays from peer-reviewed publications; FAM for E. histolytica, HEX for E. dispar. |
| Quantified Genomic DNA Standards | Crucial for generating standard curves to determine assay efficiency, limit of detection (LOD), and absolute quantification. | Commercially available or lab-purified gDNA from reference strains (e.g., ATCC HM-1:IMSS for E. histolytica). |
| Inhibitor-Resistant Master Mix | Contains polymerase, dNTPs, buffers. Essential for robust amplification from complex samples like stool, which contain PCR inhibitors. | Use mixes with uracil-DNA glycosylase (UDG) to prevent carryover contamination and enhancers for inhibition tolerance. |
| Internal Control Template | Distinguishes true target negativity from PCR failure due to inhibition or extraction error. | A non-competitor synthetic DNA or RNA spiked into each sample prior to extraction, detected with a separate probe (e.g., Cy5 channel). |
| Negative Control Panel | To establish assay specificity and rule out cross-reactivity or contamination. | DNA from E. dispar, Giardia, Cryptosporidium, common gut bacteria, and human host cells. |
| Digital Pipettes & Calibrated Tips | Ensures precise and accurate liquid handling, directly impacting repeatability and reproducibility data. | Regular calibration is mandatory. Use low-retention tips for viscous master mixes. |
qPCR vs. Traditional Methods: A Critical Evaluation for Diagnostic and Research Accuracy
In the research landscape of Entamoeba histolytica and Entamoeba dispar differentiation, accurate diagnostic methodology is paramount. The broader thesis posits that molecular techniques, specifically quantitative Polymerase Chain Reaction (qPCR), are not merely incremental improvements but represent a paradigm shift in diagnostic sensitivity, specificity, and differential capability. This whitepaper provides a head-to-head technical comparison of qPCR against traditional and contemporary methods—microscopy, culture, and antigen testing—within this specific research context.
Experimental Protocols for Key Cited Methodologies
1. qPCR for E. histolytica/dispar Differentiation
- DNA Extraction: Stool samples are homogenized and subjected to mechanical lysis (e.g., bead beating) followed by chemical lysis with a guanidinium thiocyanate-based buffer. DNA is purified using silica-column or magnetic bead-based kits.
- Primer/Probe Design: Target multi-copy genomic loci (e.g., 18S rRNA gene). Use species-specific TaqMan probes labeled with distinct fluorophores (e.g., FAM for E. histolytica, HEX/VIC for E. dispar). An internal control (e.g., a phage DNA spiked during extraction) is essential.
- Amplification: Reaction mix includes hot-start DNA polymerase, dNTPs, primers, probes, and template DNA. Cycling conditions: 95°C for initial denaturation (5 min), followed by 40-45 cycles of 95°C (15 sec) and 60°C (1 min). Data is collected at the annealing/extension step.
- Analysis: Cycle threshold (Ct) values are determined. Specimen positivity and species differentiation are based on fluorescence crossing a threshold within the validated Ct range. The internal control must amplify to validate the result.
2. Microscopy (Wet Mount & Permanent Stain)
- Fresh Specimen Examination: A direct wet mount is prepared from fresh or preserved stool with saline and iodine. Cysts/trophozoites are identified morphologically at 400x magnification. Differentiation between E. histolytica and E. dispar is impossible based on morphology alone.
- Trichrome Staining: A fixed stool smear is stained with Wheatley's trichrome stain. This allows for clearer visualization of nuclear characteristics and chromatoid bodies but still cannot differentiate the two species reliably.
3. Culture (Robinson's Medium)
- Inoculation: Fresh stool sample is emulsified in the culture medium, typically a complex agar with bacterial flora.
- Incubation: Tubes are incubated at 35-37°C and examined microscopically for trophozoites after 24, 48, and 72 hours.
- Sub-culturing & Isotyping: Positive cultures require sub-culturing. Subsequent isoenzyme analysis by electrophoresis or species-specific PCR is mandatory for definitive E. histolytica identification.
4. Antigen Detection (ELISA/EIA)
- Test Procedure: Stool supernatant or lysate is added to a microtiter well coated with E. histolytica-specific monoclonal antibodies (e.g., against the Gal/GalNAc lectin).
- Incubation & Detection: After incubation and washing, a detector antibody conjugated to an enzyme (e.g., horseradish peroxidase) is added. A colorimetric substrate yields a measurable signal proportional to antigen present.
- Analysis: Optical density is measured. A cutoff value, determined from negative controls, distinguishes positive from negative samples.
Table 1: Comparative Diagnostic Performance for Entamoeba histolytica Detection
| Method | Target | Approx. Sensitivity (%) | Approx. Specificity (%) | Time to Result | Species Differentiation? | Key Limitation |
|---|---|---|---|---|---|---|
| Microscopy | Cysts/Trophozoites | 50-60% | >95%* | 30 mins | No | Operator-dependent; cannot differentiate E. histolytica from E. dispar; low sensitivity. |
| Culture | Viable Trophozoites | 50-70% | Variable | 3-7 days | Requires add-on test | Fastidious; requires isoenzyme or PCR for confirmation; not routine. |
| Antigen Test | E. histolytica-specific antigen (e.g., Gal/GalNAc lectin) | 80-90% | >95% | 2-4 hours | Yes (if test is specific) | May miss low antigen load; quality varies by kit. |
| qPCR | Species-specific DNA sequences | >95% | >99% | 3-5 hours | Yes | Requires nucleic acid extraction; risk of PCR inhibition. |
*Specificity is high only for *Entamoeba genus, not for species.* Specificity is 100% if followed by confirmatory testing; otherwise, low due to inability to differentiate species by morphology alone.
Table 2: Research Reagent Solutions Toolkit
| Item | Function in E. histolytica/dispar Research |
|---|---|
| Guanidinium-based Lysis Buffer | Effective denaturation of proteins and RNases/DNases for robust nucleic acid preservation from stool. |
| Inhibition-Resistant Polymerase | Hot-start DNA polymerase formulated to withstand common PCR inhibitors (e.g., bilirubin, complex polysaccharides) found in stool. |
| Species-specific TaqMan Probes | Fluorophore- and quencher-labeled oligonucleotides that provide real-time, specific detection of E. histolytica vs. E. dispar DNA. |
| Internal Control DNA | Non-competitive exogenous DNA spiked into each sample to control for extraction efficiency and PCR inhibition, ensuring result validity. |
| Monoclonal Antibody (α-Gal/GalNAc) | Key reagent for antigen tests and research assays, specifically binding the pathogenic E. histolytica lectin. |
| Robinson's Medium Components | Nutritional agar, serum, and bacterial mix to support the growth of fastidious Entamoeba trophozoites. |
Visualizations
Title: qPCR Workflow for Species Differentiation
Title: Method Comparison Against a Composite Gold Standard
Thesis Context: The differentiation of Entamoeba histolytica, the causative agent of amebiasis, from the non-pathogenic Entamoeba dispar is a critical diagnostic and research challenge. Quantitative PCR (qPCR) has emerged as the gold standard for this differentiation, enabling precise quantification of parasite load and guiding clinical and drug development decisions. This whitepaper provides a technical cost-benefit analysis of implementing qPCR differentiation assays across common laboratory platforms, framed within the imperative for accurate, high-throughput data in protozoan research.
Accurate differentiation between E. histolytica and E. dispar is non-negotiable for epidemiological studies, patient management, and evaluating drug efficacy in development pipelines. Misidentification leads to unnecessary treatment or missed interventions. qPCR assays targeting species-specific genomic loci (e.g., the 18S rRNA gene or cryptic plasmids) provide the sensitivity, specificity, and quantitative data required. The choice of qPCR platform significantly impacts research throughput, data turnaround time, and resource allocation, directly affecting project timelines and costs.
Platform Comparison: Throughput, Time, and Cost
The following table summarizes key performance and resource metrics for three common qPCR platform classes used in parasitology research.
Table 1: Platform Comparison for Entamoeba histolytica/dispar qPCR
| Platform Type | Example Systems | Max Samples/Run (Throughput) | Assay Turnaround Time (Hands-on + Runtime) | Initial Capital Investment | Cost per Sample (Reagents + Consumables) | Ideal Use Case |
|---|---|---|---|---|---|---|
| Standard Block-based | Applied Biosystems 7500, Bio-Rad CFX96 | 96-well: 88-94 samples 384-well: 352-382 samples | 3-5 hours (0.5h setup + 1.5-2.5h run + analysis) | $$ (Moderate) | $2.50 - $4.00 | Targeted studies, batch processing, multi-target validation. |
| High-Throughput / Array Card | Applied Biosystems TaqMan Array Card | Up to 384 samples (8 samples/card, 48 targets each) | 4-6 hours (1h setup + 2-2.5h run + analysis) | $$$ (High for loader) | $8.00 - $12.00 (per sample, per card) | High-plex screening (simultaneous pathogen detection), large cohort surveillance. |
| Rapid/Low-throughput | Applied Biosystems QuantStudio 3, Bio-Rad CFX Opus 96 | 96-well: 88-94 samples | 1.5-2.5 hours (0.5h setup + 0.5-1h fast run + analysis) | $ (Lower) | $2.50 - $4.00 | Rapid diagnostic confirmation, small batch runs, pilot studies. |
Notes: Costs are approximate and vary by region and supplier. Sample counts exclude necessary controls (NTC, positive).
Core Experimental Protocol:Entamoebahistolytica/dispar Differentiation by qPCR
A. Sample Preparation & DNA Extraction
- Protocol: Use a commercially available stool DNA extraction kit (e.g., QIAamp PowerFecal Pro DNA Kit) optimized for difficult substrates and PCR inhibitors. Include a known positive control (cloned target DNA) and a no-template control (NTC). Quantify DNA using a spectrophotometer (e.g., NanoDrop). Standardize input DNA to 10-50 ng/µL for the reaction.
B. qPCR Reaction Setup
- Master Mix: Use a probe-based chemistry (e.g., TaqMan Environmental Master Mix 2.0) for superior specificity in complex samples.
- Primers/Probes: Employ validated, species-specific primers and dual-labeled probes (FAM/BHQ1 for E. histolytica, HEX/VIC/BHQ1 for E. dispar). An internal amplification control (IAC) with a distinct fluorophore (e.g., Cy5) is mandatory for identifying PCR inhibition.
- Reaction Volume: 20-25 µL final volume.
- Plate Setup: Run samples, standards (a 5-6 point serial dilution of known copy number), and controls in triplicate.
C. qPCR Cycling Conditions (Standard Block)
- UNG Incubation: 50°C for 2 min (optional, to prevent amplicon carryover).
- Initial Denaturation: 95°C for 10 min.
- Amplification (40 cycles):
- Denature: 95°C for 15 sec.
- Anneal/Extend: 60°C for 1 min (acquire fluorescence).
- Hold: 4°C.
D. Data Analysis
- Set a consistent fluorescence threshold within the exponential phase for all assays.
- Determine cycle threshold (Ct) values for each sample.
- Generate a standard curve from the serial dilution. The assay is valid with amplification efficiency of 90-110% and R² > 0.99.
- Quantify E. histolytica and E. dispar DNA copy number/µL from the respective standard curves. A sample is positive if Ct < 40 (or a validated cutoff) and shows exponential amplification.
Title: qPCR Workflow for Entamoeba Differentiation
Key Signaling Pathway inEntamoeba histolyticaPathogenesis
Understanding the pathways targeted in drug development contextualizes the need for precise quantification.
Title: E. histolytica Actin Signaling & Drug Target
The Scientist's Toolkit: Research Reagent Solutions
Table 2: Essential Materials for E. histolytica/dispar qPCR Research
| Item | Function & Rationale |
|---|---|
| Stool DNA Stabilization Buffer | Preserves nucleic acids and inactivates pathogens immediately upon collection, crucial for field studies and accurate quantification. |
| Inhibitor-Resistant DNA Polymerase Master Mix | Essential for robust amplification from stool-derived DNA, which contains polysaccharides, bilirubin, and other PCR inhibitors. |
| Species-Specific TaqMan Assays | Pre-validated primer/probe sets for E. histolytica (e.g., locus 001544) and E. dispar (e.g., locus 001488). Ensure 100% specificity. |
| Cloned Plasmid DNA Controls | Precisely quantified gBlocks or plasmids containing target sequences. Serve as absolute standards for copy number quantification and run-to-run calibration. |
| Internal Amplification Control (IAC) | Non-competitive synthetic DNA with distinct fluorophore. Distinguishes true target absence from PCR failure due to inhibition. |
| Automated Nucleic Acid Extractor | Increases throughput, improves reproducibility, and reduces hands-on time for processing large sample batches in epidemiological studies. |
| Multichannel Pipette & Liquid Handler | Critical for accurate, high-speed plating of 96/384-well qPCR reactions, minimizing set-up errors and time. |
The selection of a qPCR platform for Entamoeba differentiation research is a function of project scale, speed, and budget. For most academic and drug development labs, a standard 96-well block cycler offers the best balance of throughput, cost per sample, and flexibility. High-throughput array systems are justifiable for massive, multi-pathogen surveillance studies despite higher per-sample cost. Rapid cyclers are invaluable for clinics or labs requiring immediate confirmatory results.
Integrating the detailed protocol, robust reagent toolkit, and platform analysis outlined here will optimize resource allocation, ensure data fidelity, and accelerate research outcomes in the critical fight against amebiasis.
A cornerstone thesis in molecular parasitology is the precise differentiation of the pathogenic Entamoeba histolytica from the non-pathogenic Entamoeba dispar, traditionally achieved via singleplex qPCR targeting species-specific genetic loci. However, clinical reality involves complex, polyparasitic infections that confound diagnosis and treatment outcomes. This technical guide frames multiplex PCR development within this thesis, arguing that advancing beyond single-plex differentiation to simultaneous, multi-analyte detection is critical for accurate epidemiological understanding, individualized therapy, and drug development for amoebiasis and its syndemics.
Core Principles of Multiplex qPCR Design
Successful multiplexing for enteric pathogens requires meticulous optimization to overcome primer-dimer formation, cross-reactivity, and differential amplification efficiency. Key design pillars include:
- Amplicon Size Discrimination: Targeting short, distinct amplicon lengths (80-250 bp) for each target to ensure uniform amplification efficiency.
- Probe Chemistry Selection: Utilizing fluorescent probes (TaqMan, Molecular Beacons) with non-overlapping emission spectra. Modern instruments support 4-6 color channels.
- Primer/Probe Specificity Validation: In silico analysis against genomic databases (e.g., NCBI) followed by empirical testing against a panel of related organisms.
- Universal Thermal Cycling Conditions: A single annealing/extension temperature must work for all primer sets.
Target Selection for Entamoeba and Common Co-infecting Pathogens
Based on recent prevalence studies and clinical relevance, a high-yield multiplex panel would include the following targets, with quantitative data from recent meta-analyses summarized below.
Table 1: Key Diagnostic Targets and Prevalence Data in Regions Endemic for Amoebiasis
| Pathogen Category | Specific Target | Genetic Marker | Clinical Significance | Average Co-infection Prevalence with E. histolytica* (%) |
|---|---|---|---|---|
| Entamoeba spp. | E. histolytica | 18S rRNA / Chitinase | Causes amoebic dysentery, liver abscess. | N/A (Primary Target) |
| E. dispar | 18S rRNA / Chitinase | Non-pathogenic, requires differentiation. | 15-30% in symptomatic patients | |
| Bacterial | Shigella spp./EIEC | ipaH gene | Bacillary dysentery; mimics amoebiasis. | 5-12% |
| Salmonella spp. | invA gene | Typhoidal & non-typhoidal fever. | 3-8% | |
| Protozoan | Giardia duodenalis | tpi or gdh genes | Causes giardiasis, watery diarrhea. | 10-25% |
| Cryptosporidium spp. | 18S rRNA | Severe diarrhea in immunocompromised. | 4-10% |
*Data synthesized from recent (2020-2023) studies in endemic regions of Asia and Africa.
Detailed Experimental Protocol: A 6-Plex qPCR Assay Workflow
This protocol outlines the development and validation of a hypothetical hexaplex assay.
I. Primer and Probe Design
- Retrieve complete genome sequences for all target organisms from NCBI GenBank.
- Align sequences for conserved gene regions (e.g., 18S rRNA for protozoa, ipaH for Shigella).
- Design primers and TaqMan probes using software (e.g., Primer3, Beacon Designer). Ensure Tm of primers is 58-60°C and probes are 10°C higher. Label probes with distinct fluorophores (FAM, HEX/VIC, Cy3, Cy5, ROX, Quasar670).
- Synthesize oligonucleotides with appropriate quenchers (e.g., BHQ-1, BHQ-2).
II. Reaction Optimization
- Master Mix: Use a commercial multiplex PCR master mix (e.g., Qiagen Multiplex PCR Plus, TaqPath Proamp).
- Concentration Titration: Perform a matrix titration of primer (50-900 nM final) and probe (50-250 nM final) concentrations for each target in uniplex and multiplex formats.
- Thermal Cycling: Optimize on a capable thermocycler (e.g., Bio-Rad CFX96, QuantStudio 12K). Standard protocol: 95°C for 3 min; 40 cycles of 95°C for 15 sec, 60°C for 60 sec (single acquisition).
- Validation: Test against DNA from mono-infections, co-infections, and negative controls. Determine limit of detection (LoD) and linear dynamic range for each target separately and in combination.
III. Data Analysis
- Set fluorescence threshold manually in the exponential phase of amplification or use instrument-derived algorithms.
- Determine Ct values. For quantification, use standard curves for each target.
- Specificity is confirmed by the absence of signal in non-target channels.
Diagram 1: Multiplex qPCR Diagnostic Workflow
The Scientist's Toolkit: Research Reagent Solutions
Table 2: Essential Materials for Multiplex qPCR Development
| Item | Example Product (Vendor) | Function in Experiment |
|---|---|---|
| Multiplex qPCR Master Mix | TaqPath Proamp Master Mix (Thermo Fisher) | Provides optimized buffer, polymerase, and dNTPs for simultaneous amplification of multiple targets. |
| Fluorogenic Probes | TaqMan Probes with BHQ quenchers (IDT) | Target-specific oligonucleotides labeled with a reporter dye and quencher; enable real-time detection. |
| Primer Sets | Ultramer DNA Oligos (IDT) | High-fidelity, species-specific primers for each pathogen target. |
| DNA Extraction Kit | QIAamp PowerFecal Pro DNA Kit (Qiagen) | Efficiently isolates inhibitor-free microbial DNA from complex stool matrices. |
| Positive Control DNA | ATCC Genomic DNA (e.g., E. histolytica HM-1:IMSS) | Validates assay sensitivity and serves as a standard for quantification. |
| qPCR Instrument | CFX96 Touch Deep Well (Bio-Rad) | Real-time thermocycler with multiple optical channels for multiplex detection. |
| Analysis Software | Bio-Rad CFX Maestro Software | Analyzes amplification curves, assigns Ct values, and manages standard curves for quantification. |
Challenges and Future Perspectives
Current challenges include managing amplification bias in high-order multiplexes (>10-plex) and the cost of reagent optimization. Future directions integrate digital PCR for absolute quantification without standard curves and the development of point-of-care cartridge-based systems incorporating isothermal multiplex methods (e.g., RPA, LAMP) for field deployment. For drug development, such multiplex tools are indispensable for defining patient cohorts in clinical trials and for assessing drug efficacy against specific pathogen combinations.
Diagram 2: Logical Progression from Thesis to Application
This whitepaper serves as a technical guide within a broader thesis focused on Entamoeba histolytica and Entamoeba dispar differentiation via quantitative PCR (qPCR). A critical step in translating laboratory diagnostics to patient care is establishing a robust correlation between molecular quantification data—specifically Cycle Threshold (Ct) values—and clinical disease severity. For pathogens like E. histolytica, which can cause a spectrum of illness from asymptomatic colonization to amebic dysentery and liver abscess, this correlation is essential for prognosis, treatment stratification, and drug development.
The Clinical Spectrum of Entamoeba Infection and the Need for Quantification
Entamoeba histolytica infection manifests with highly variable outcomes. E. dispar, a morphologically identical but non-pathogenic species, necessitates precise differentiation. Disease severity in E. histolytica infection is often categorized as follows:
- Asymptomatic Cyst Passer: No clinical symptoms, low-level intestinal colonization.
- Non-Invasive Diarrhea: Mild, self-limiting intestinal disturbance.
- Amoebic Dysentery: Severe, invasive colitis with blood and mucus in stool.
- Amoebic Liver Abscess (ALA): Extraintestinal invasion, leading to hepatic tissue destruction.
qPCR provides not only species-specific discrimination but also a quantitative measure of parasitic load via Ct values. A lower Ct value indicates a higher starting quantity of target DNA in the sample. The central hypothesis is that this parasitic load correlates with the level of tissue invasion and thus, clinical severity.
Data Synthesis: Reported Correlations between Ct Values and Severity
The table below summarizes findings from recent studies investigating the relationship between E. histolytica qPCR Ct values and clinical presentations.
Table 1: Correlation of E. histolytica qPCR Ct Values with Clinical Disease Severity
| Clinical Outcome / Sample Type | Median Ct Value (Range) | Parasitic Load Interpretation | Key Association & Study Context |
|---|---|---|---|
| Asymptomatic Infection (Stool) | 32.5 (28.0 – 38.0) | Low | Detectable DNA often indicates colonization; load may fluctuate. Distinction from E. dispar is critical. |
| Amoebic Dysentery (Stool) | 18.8 (16.5 – 22.0) | Very High | Strong correlation with high load. Ct values often significantly lower than asymptomatic cases (p<0.001). |
| Amoebic Liver Abscess (Abscess Pus) | 15.2 (12.0 – 20.0) | Extremely High | Lowest Ct values observed, reflecting massive local parasite burden in aspirated material. |
| Amoebic Liver Abscess (Concurrent Stool) | 25.0 (20.0 – 32.0) | Moderate to Low | Stool load may not correlate directly with extraintestinal severity, highlighting compartmentalization. |
| Post-Treatment (Successful) | Ct increase of >5 cycles or negative | Drastic Reduction | Rising Ct (decreasing load) is a primary molecular endpoint for drug efficacy trials. |
Core Experimental Protocol: Linking Ct to Clinical Severity
This section details a standardized protocol for generating the data required to establish the correlation.
Protocol Title: Tripartite Analysis of Entamoeba histolytica Infection: qPCR Quantification, Clinical Staging, and Biomarker Correlation.
4.1 Sample Collection and Clinical Phenotyping:
- Cohort Definition: Enroll patients with microscopy-positive or antigen-positive for Entamoeba species, alongside healthy controls from endemic areas.
- Sample Types: Collect fresh stool (≥200mg), blood (serum/plasma), and, where clinically indicated, liver abscess aspirate.
- Clinical Metadata: Assign a standardized Clinical Severity Score (CSS) (e.g., 0: Asymptomatic, 1: Mild diarrhea, 2: Dysentery, 3: ALA). Record symptoms, imaging (for ALA), and standard hematology (e.g., leukocytosis) and biochemistry (e.g., liver enzymes).
4.2 DNA Extraction and qPCR Differentiation/Quantification:
- Extraction: Use a validated stool DNA kit with bead-beating for robust cyst lysis. Include an internal extraction control (IEC) to monitor inhibition.
- qPCR Assay: Perform a multiplex TaqMan qPCR targeting:
- E. histolytica-specific gene (e.g., 18S rRNA or Gal/GalNAc lectin).
- E. dispar-specific gene.
- An internal amplification control (IAC).
- Quantification Standard: Run a 5-point standard curve (e.g., 10^1 to 10^5 copies/reaction) of cloned target sequence with each plate to convert Ct to estimated copy number.
- Quality Control: All samples run in duplicate. Ct > 40 reported as negative. Inhibited samples (IEC/AIC failure) are re-extracted or diluted.
4.3 Data Analysis for Correlation:
- Perform statistical analysis (e.g., non-parametric Kruskal-Wallis test) to compare Ct values across CSS groups.
- Calculate correlation coefficients (e.g., Spearman's rho) between Ct values and continuous biomarkers (e.g., C-reactive protein levels).
- Determine optimal Ct cut-off values for predicting invasive disease using Receiver Operating Characteristic (ROC) curve analysis.
Visualizing the Research Pathway
Title: Research Workflow: Clinical qPCR Correlation Study
Title: Ct Value Interpretation and Clinical Decision Path
The Scientist's Toolkit: Key Research Reagent Solutions
Table 2: Essential Reagents and Materials for E. histolytica/dispar qPCR Severity Studies
| Item | Function in the Protocol | Critical Specification/Note |
|---|---|---|
| Species-Specific TaqMan Assays | Differentiation and quantification of E. histolytica vs. E. dispar. | Must target multi-copy genes (e.g., 18S rRNA) for high sensitivity. Verify no cross-reactivity. |
| Internal Extraction Control (IEC) | Monitors inhibition and efficiency of DNA extraction from complex samples like stool. | A non-target DNA sequence spiked into lysis buffer. |
| Internal Amplification Control (IAC) | Detects PCR inhibition in the final reaction mix. | A synthetic template with distinct probe (e.g., VIC dye) co-amplified in the multiplex. |
| Quantified DNA Standard | Enables conversion of Ct to copy number/μL for absolute quantification. | Serial dilutions of plasmid containing target amplicon. Stability is key. |
| Inhibitor-Resistant DNA Polymerase | Robust amplification from samples with PCR inhibitors (common in stool). | Essential for reliable Ct values from all clinical samples. |
| Standardized Clinical Data Form | Ensures consistent collection of metadata for accurate severity scoring. | Should include symptoms, duration, travel history, and imaging findings. |
| Positive Control (Genomic DNA) | E. histolytica and E. dispar cultured trophozoite DNA. | Verifies assay performance. Use at low copy number near assay limit. |
| Negative Biological Controls | DNA from healthy donor stool samples. | Identifies background or contamination issues. |
Within the specific research context of Entamoeba histolytica and E. dispar differentiation—a critical diagnostic and epidemiological challenge due to their morphologic identity but divergent pathogenic potential—the debate on optimal molecular detection strategies is intense. Targeted quantitative PCR (qPCR) has been the gold standard, offering sensitive, specific, and rapid quantification. However, the advent of metagenomic Next-Generation Sequencing (NGS) presents a paradigm shift. This technical guide evaluates whether these broad, untargeted approaches are poised to replace or, more likely, complement targeted qPCR in parasitology and infectious disease research.
Technical Comparison: qPCR vs. NGS-Based Approaches
The following table summarizes the core quantitative and functional differences between these methodologies in the context of Entamoeba detection and differentiation.
Table 1: Comparative Analysis of qPCR and NGS for Entamoeba Detection
| Feature | Targeted qPCR | Metagenomic NGS (Shotgun) | Targeted NGS (Amplicon-Based) |
|---|---|---|---|
| Primary Goal | Quantify specific, known targets. | Discover all nucleic acids in sample; profile community. | Deeply sequence specific target regions (e.g., 16S rRNA, Eh-specific loci). |
| Sensitivity | Extremely high (can detect <1 parasite/µl). | Lower; limited by sequencing depth and host DNA. | High, but generally lower than qPCR. |
| Specificity | Very high; defined by primer/probe. | Low; identifies all sequenced organisms. | High; defined by PCR primers. |
| Quantitative Ability | Excellent (absolute quantification). | Semi-quantitative (relative abundance). | Semi-quantitative. |
| Multiplexing Capacity | Moderate (typically 4-6 plex). | Essentially unlimited. | High (hundreds of targets). |
| Turnaround Time | Fast (< 4 hours). | Slow (24 hrs to several days). | Moderate to Slow. |
| Cost per Sample | Low. | High. | Moderate. |
| E. histolytica/dispar Differentiation | Direct, via specific probes. | Indirect, via sequence alignment. | Direct, via amplicon sequence. |
| Key Advantage | Speed, sensitivity, cost-efficiency for known targets. | Unbiased discovery, detection of co-infections, strain typing. | Scalable multiplexing, detailed variant analysis. |
Experimental Protocols in Context
Protocol 1: Targeted qPCR forE. histolytica/disparDifferentiation
This is a standard protocol based on validated assays targeting the 18S rRNA or other specific genomic regions.
- DNA Extraction: Use a stool DNA extraction kit with bead-beating for cyst disruption. Include internal control DNA to monitor inhibition.
- Primer/Probe Design: Utilize published, species-specific TaqMan assays. Example:
- E. histolytica Forward: 5'-AAGCATTGTTTCTAGATCTGAG-3'
- E. histolytica Reverse: 5'-AAGAGGTCTAACCGAAATTAG-3'
- Probe: [FAM]-CCGGTCCATCCATCAC-[BHQ1]
- E. dispar assay uses a separate probe (e.g., HEX/VIC-labeled).
- qPCR Setup: 20µl reactions containing 1x Master Mix, 0.4µM each primer, 0.2µM probe, 5µl DNA template. Run in triplicate.
- Thermocycling: 95°C for 3 min; 45 cycles of 95°C for 15 sec, 60°C for 1 min.
- Analysis: Generate standard curve from plasmid controls containing target sequence. Quantify copy number/µl of stool eluate.
Protocol 2: Metagenomic NGS for Stool Sample Analysis
This protocol outlines a shotgun metagenomics workflow applicable to pathogen discovery.
- Sample Preprocessing: Enrich microbial biomass via differential centrifugation or filtration to reduce host DNA.
- DNA Extraction & QC: Use a broad-spectrum extraction kit. Quantify DNA via fluorometry and assess integrity via gel electrophoresis.
- Library Preparation: Fragment DNA (e.g., via sonication), perform end-repair, adenylation, and ligate sequencing adaptors. Amplify library via limited-cycle PCR.
- Sequencing: Pool libraries and sequence on an Illumina NovaSeq or MiSeq platform (2x150 bp recommended).
- Bioinformatics:
- Quality Control & Host Depletion: Trim adapters (Trimmomatic), filter low-quality reads. Align to human genome (Bowtie2/BWA) and remove aligned reads.
- Taxonomic Profiling: Align remaining reads to comprehensive microbial databases (NCBI nr, RefSeq) using tools like Kraken2/Bracken or MetaPhlAn.
- Entamoeba Specific Analysis: Extract all reads classified as Entamoeba. Map to reference genomes of E. histolytica HM-1:IMSS, E. dispar SAW760, etc., using BWA or minimap2. Call SNPs for strain differentiation.
Protocol 3: Amplicon-Based NGS (Targeted) forEntamoeba
This protocol focuses on deep sequencing of a discriminatory locus.
- Target Selection: Choose a hypervariable region (e.g., partial 18S rRNA gene).
- PCR Amplification: Use pan-Entamoeba primers with overhang adapters for Nextera/X sequencing.
- Library Indexing & Pooling: Perform a second, limited-cycle PCR to add dual indices and full sequencing adapters. Pool equimolar amounts of each sample library.
- Sequencing: Run on MiSeq with v2/v3 chemistry (2x250 bp).
- Bioinformatics:
- Denoising & ASV Generation: Process with DADA2 or USEARCH to generate Amplicon Sequence Variants (ASVs).
- Taxonomy Assignment: BLAST ASVs against a curated Entamoeba sequence database.
- Phylogenetic Analysis: Align sequences, build a tree to visualize genetic relationships between samples.
Visualizing Workflows and Relationships
Workflow for Choosing Between qPCR and NGS in Entamoeba Research
Synergistic Cycle of NGS Discovery and qPCR Validation
The Scientist's Toolkit: Research Reagent Solutions
Table 2: Essential Reagents for Entamoeba Molecular Research
| Item | Function in qPCR | Function in NGS | Example Product/Brand |
|---|---|---|---|
| Inhibitor-Removal Stool DNA Kit | Critical for removing PCR inhibitors (bile salts, complex carbs) from fecal samples. | Essential for obtaining high-quality, sherable DNA for library prep. | QIAamp PowerFecal Pro, MagMAX Microbiome. |
| Species-Specific TaqMan Assays | Provides primer/probe sets for specific detection and quantification of E. histolytica vs. E. dispar. | Not typically used. May serve as positive control for extraction. | Custom assays from Thermo Fisher, IDT. |
| Internal Control DNA/Assay | Monitors for PCR inhibition in each sample reaction, ensuring result validity. | Can be spiked-in for monitoring extraction and library prep efficiency. | EXO Internal Positive Control (Thermo Fisher). |
| High-Fidelity PCR Master Mix | Used for standard PCR to generate control plasmids or amplicons for sequencing. | Used in amplicon-based NGS for target amplification with minimal errors. | Q5 Hot Start (NEB), KAPA HiFi. |
| NGS Library Prep Kit | Not applicable. | Converts fragmented DNA into sequencing-ready libraries with adapters and indices. | Illumina DNA Prep, Nextera XT. |
| Microbial DNA Standard | Used to generate standard curves for absolute quantification. | Used as a mock community control for benchmarking NGS pipeline accuracy and bias. | ZymoBIOMICS Microbial Community Standard. |
| Bioinformatics Software | Simple analysis (e.g., QuantStudio Design & Analysis). | Crucial. For taxonomic profiling, variant calling, and phylogenetic analysis. | Kraken2, MetaPhlAn, BWA, GATK, DADA2. |
Metagenomic and NGS approaches are not direct replacements for targeted qPCR in the differentiation of Entamoeba histolytica and E. dispar. Instead, they serve powerfully complementary roles. qPCR remains the unrivaled method for rapid, sensitive, and cost-effective diagnostics and high-throughput screening in defined epidemiological studies. NGS, particularly in its amplicon-based form, excels as a discovery and research tool, uncovering strain-level diversity, zoonotic linkages, and complex polymicrobial interactions that can inform the development of better, more specific qPCR assays. The future of molecular parasitology lies in a synergistic model: using NGS for broad discovery and assay design, and qPCR for focused validation, surveillance, and clinical application.
Conclusion
The accurate differentiation of Entamoeba histolytica from E. dispar via qPCR is no longer a research luxury but a cornerstone of precise amebiasis management and investigation. This guide has synthesized the journey from foundational need to optimized application, demonstrating that a well-designed and validated qPCR assay offers unparalleled specificity, sensitivity, and quantitative capability essential for modern biomedical research. While challenges like sample inhibition exist, systematic troubleshooting and rigorous validation ensure reliable results. Compared to traditional methods, qPCR stands as the definitive technique for drug efficacy studies, epidemiological surveillance, and confirming clinical diagnoses, directly impacting patient outcomes and therapeutic development. Future directions point towards the integration of multiplex panels for syndromic testing, the exploration of digital PCR for absolute quantification, and the use of these molecular tools to unravel host-parasite interactions and resistance mechanisms. For researchers and drug developers, mastering this differentiation is fundamental to advancing both our understanding and our arsenal against this significant global pathogen.