A Comprehensive SYBR Green qPCR Protocol for Sensitive Detection and Subtyping of Blastocystis sp.
This article provides a complete guide for researchers and drug development professionals on implementing SYBR Green-based real-time PCR (qPCR) for the detection and subtyping of Blastocystis.
A Comprehensive SYBR Green qPCR Protocol for Sensitive Detection and Subtyping of Blastocystis sp.
Abstract
This article provides a complete guide for researchers and drug development professionals on implementing SYBR Green-based real-time PCR (qPCR) for the detection and subtyping of Blastocystis. The protocol covers foundational principles, from the clinical and zoonotic relevance of Blastocystis subtypes to the advantages of molecular diagnostics over traditional methods. It delivers a detailed, step-by-step methodological workflow encompassing DNA extraction, primer selection, reaction optimization, and melt curve analysis for subtype discrimination. Critical troubleshooting and optimization strategies are discussed to enhance sensitivity and specificity, addressing common pitfalls like inhibitor removal and subtype-specific amplification biases. Finally, the protocol is validated through comparative analysis with other molecular techniques and its application in epidemiological studies, providing a robust, cost-effective tool for advancing Blastocystis research and clinical investigation.
Understanding Blastocystis: Subtype Diversity, Clinical Relevance, and the Need for Molecular Diagnostics
Blastocystis sp. is a single-celled, anaerobic protist that colonizes the gastrointestinal tracts of a vast range of hosts, including humans and numerous other animals [1] [2]. It is considered the most common eukaryotic organism in the human gut, with a global distribution and an estimated presence in over a billion people [1] [3]. Despite its prevalence, the clinical significance of Blastocystis remains a subject of intense debate. Historically often classified as a parasite, emerging evidence suggests it may be a commensal organism, or even a beneficial member of the gut microbiome, associated with increased bacterial diversity and healthier gut profiles [1] [4] [5].
The organism is genetically highly diverse, and is classified into numerous subtypes (STs) based on the small subunit ribosomal RNA (SSU rRNA) gene [4]. At least 10 subtypes (ST1-ST10) have been found in humans, with ST1-ST4 being the most common [6] [5]. The distribution of these subtypes varies geographically; for instance, ST4 is common in Europe but rare in other regions [5]. Understanding this diversity is crucial, as different subtypes may have varying impacts on human health [1]. The study of Blastocystis perfectly embodies the One Health concept, which integrates human, animal, and environmental health. Its transmission dynamics involve multiple routes, including human-to-human, zoonotic (animal-to-human), and waterborne transmission, with recent evidence also pointing to soil as a potential reservoir [3] [4]. This protocol application note details the use of SYBR Green-based real-time quantitative PCR (qPCR) for the detection, quantification, and subtyping of Blastocystis sp., a critical tool for advancing research within this One Health framework.
Quantitative Profiling of Blastocystis: Prevalence and Subtype Distribution
Epidemiological studies using molecular methods have revealed wide variations in the prevalence and genetic diversity of Blastocystis across different populations and geographic regions. The tables below summarize key findings from recent studies.
Table 1: Global Prevalence of Blastocystis sp. in Selected Populations
| Population / Cohort | Sample Size (n) | Prevalence (%) | Detection Method | Citation |
|---|---|---|---|---|
| Honduran Rural Children | 95 | 71.6% | Multi-parallel qPCR | [7] |
| Rural Community, N. Thailand | 45 | 73.0% | Morphology & qPCR | [4] |
| Asymptomatic Children (6 countries) | 244 | 36.0% | Specific qPCR | [5] |
| Immunocompromised & Control Patients (France) | 186 | 14.5% | Specific qPCR | [6] |
Table 2: Distribution of Blastocystis Subtypes in Human Populations
| Subtype (ST) | Prevalence in Asymptomatic Children (n=81) [5] | Notes on Host Association and Geography |
|---|---|---|
| ST3 | 49% | Most common subtype in humans globally [5] |
| ST1 | 36% | Common in humans; also found in pigs [4] [5] |
| ST2 | 25% | Common in humans [5] |
| ST4 | Detected | Common in Europe; dominant in rodents [1] [4] |
| ST5 | Detected | Typically found in pigs [4] |
| ST6 | Detected | Avian subtype; more frequent in Asia [6] [4] |
| ST7 | Detected | Avian subtype; more frequent in Asia and the Middle East [6] [4] |
Note: Co-infections with multiple subtypes are not exceptional, found in 12% of samples in one study [5].
SYBR Green qPCR Protocol for Blastocystis Detection and Subtyping
The following section provides a detailed methodology for the detection and genetic characterization of Blastocystis sp. from stool samples using SYBR Green qPCR and amplicon sequencing.
Sample Collection and DNA Extraction
- Sample Collection: Stool samples should be collected in sterile containers and stored immediately at -20°C until processing. An aliquot of 50-200 mg of stool is recommended for DNA extraction [6] [5].
- DNA Extraction: Extract genomic DNA using a commercial stool DNA isolation kit (e.g., DNeasy PowerSoil DNA Isolation Kit from Qiagen or MP FastDNA for Soil Kit) according to the manufacturer's instructions [7] [5]. DNA extracts should be eluted in a suitable buffer and stored at -20°C. The quality and quantity of DNA can be assessed using a spectrophotometer.
Real-Time qPCR with SYBR Green
This protocol is adapted from established methods for detecting enteric pathogens and can be applied to Blastocystis [8].
- Primer Design: Primers should target a region of the Blastocystis small subunit ribosomal RNA (SSU rRNA) gene that allows for broad detection across subtypes. In silico validation against a sequence database is essential.
- Reaction Setup: The following table lists the recommended components for a single 50 µL SYBR Green qPCR reaction.
Research Reagent Solutions
| Component | Final Concentration/Amount | Function |
|---|---|---|
| 2x SYBR Green Master Mix | 25 µL | Contains DNA polymerase, dNTPs, buffer, and SYBR Green dye |
| Forward Primer | Up to 900 nM | Target-specific amplification |
| Reverse Primer | Up to 900 nM | Target-specific amplification |
| Template DNA | Up to 1000 ng | Contains target sequence for amplification |
| Nuclease-Free Water | To a final volume of 50 µL | Adjusts reaction volume |
Thermal Cycling Conditions: Run the reaction on a real-time PCR instrument (e.g., Rotor-Gene Q, QuantStudio 7 flex) using the following cycling program [9] [8]:
- Initial Denaturation/Activation: 95°C for 10-15 min (1 cycle)
- Amplification: 40-45 cycles of:
- Denaturation: 95°C for 15 sec
- Annealing/Extension: 60°C for 30-60 sec
- Melting Curve Analysis: 60°C to 95°C with continuous fluorescence acquisition.
Data Analysis:
- Quantification: Generate a standard curve using a plasmid of known copy number containing the target SSU rRNA gene fragment. The parasite load in unknown samples can be calculated from the standard curve [6] [7].
- Specificity Check: Analyze the melting curve at the end of the run to confirm the specificity of the amplification and to check for primer-dimer formation [8].
Subtyping by Amplicon Sequencing
- Nested PCR for Subtyping: Use qPCR-positive samples as a template for a subsequent nested or semi-nested PCR with primers targeting a barcode region of the SSU rRNA gene, which allows for subtype discrimination [5].
- Library Preparation and Sequencing: Purify the resulting amplicons and prepare sequencing libraries using a dual-indexing approach (e.g., with Illumina Nextera XT indices) to allow for multiplexing [5]. Sequence the pooled libraries on a platform such as the Illumina MiSeq (2 × 250 bp kit).
- Bioinformatic Analysis: Process the sequencing reads through a pipeline that includes primer trimming, quality filtering, denoising (to generate Zero-radius Operational Taxonomic Units, ZOTUs), and clustering against a reference database of known Blastocystis subtypes to assign subtypes [5].
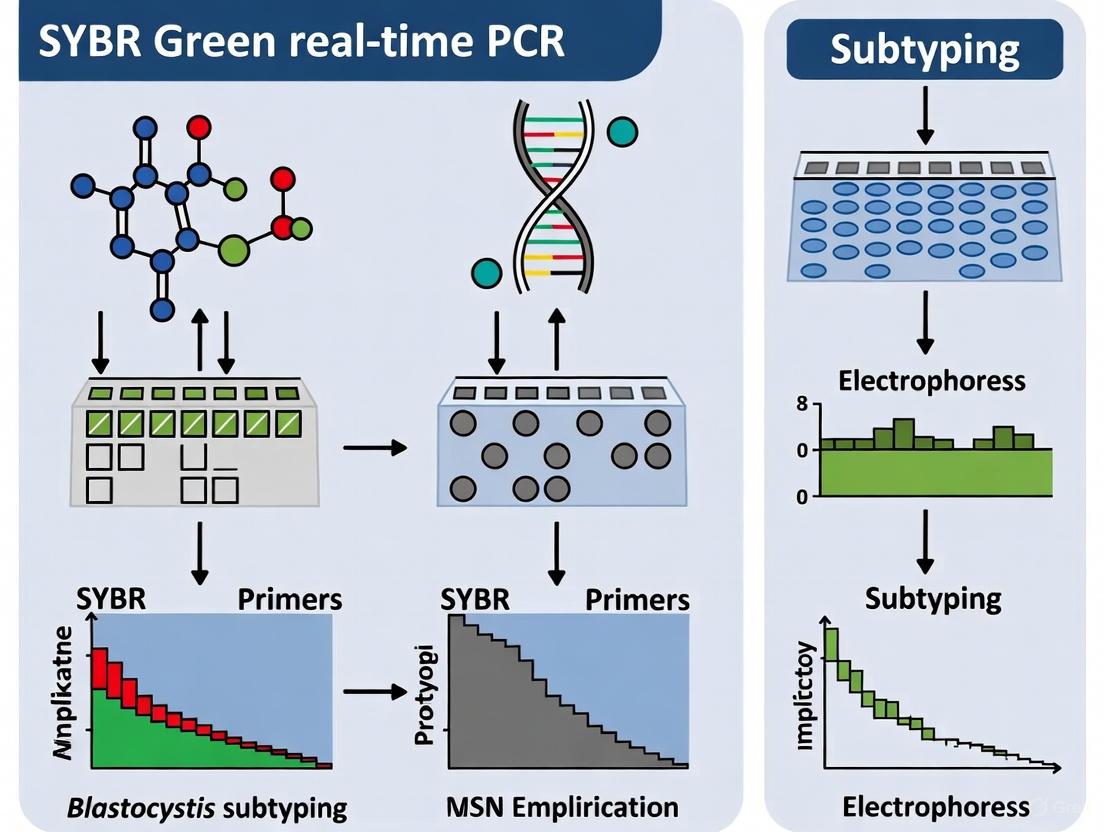
The following workflow diagram illustrates the complete process from sample to result:
Discussion and One Health Perspective
The application of sensitive molecular techniques like SYBR Green qPCR has been pivotal in reshaping our understanding of Blastocystis. These methods have consistently shown that traditional microscopic diagnosis greatly underestimates the prevalence of this protist [6]. The high prevalence of Blastocystis in healthy individuals, coupled with its correlation with higher bacterial richness and diversity in the gut, strongly supports its role as a common commensal [1] [5]. Furthermore, the ability to quantify parasite load and distinguish subtypes is essential for investigating potential associations between specific subtypes (e.g., the reportedly more inflammatory ST7 in Southeast Asia) and disease states [1].
The detection of Blastocystis across human, animal, and environmental samples underscores its relevance to the One Health concept. Large-scale initiatives like the COST Action CA21105 "Blastocystis under One Health" are working to harmonize diagnostic methodologies, create comprehensive databases, and promote interdisciplinary collaboration to fully elucidate the transmission dynamics and public health significance of this ubiquitous protist [3] [2]. The protocol outlined here, focusing on accessible SYBR Green qPCR, provides researchers with a robust tool to contribute to this important field of study.
Blastocystis sp. is a common anaerobic protist found in the gastrointestinal tracts of diverse hosts worldwide. Understanding its clinical significance and transmission dynamics relies heavily on molecular subtyping, which classifies isolates based on genetic variation in the small subunit ribosomal RNA (SSU rRNA) gene. While subtypes ST1-ST4 dominate human infections, ongoing research continues to identify novel subtypes and clarify the role of zoonotic transmission. This application note details a SYBR Green real-time PCR protocol for detecting and subtyping Blastocystis, providing researchers with a powerful tool to explore subtype diversity, distribution, and clinical relevance.
The Essential Role of Molecular Subtyping
Subtype Diversity and Distribution
Molecular characterization of Blastocystis has revealed extensive genetic diversity, with at least 44 subtypes (STs) proposed based on SSU rRNA gene sequences [10]. Humans are primarily colonized by ST1-ST4, which collectively account for over 90% of infections globally [11]. However, subtype distribution exhibits significant geographical variation. ST3 is generally the most prevalent subtype in human populations, but regional differences exist. For instance, a 2024 study of school children in Hainan, China, found ST3 (60.4%) predominated, followed by ST1 (27.8%), ST7 (10.4%), ST6 (0.7%), and ST2 (0.7%) [12]. Conversely, a 2025 study from Iran reported ST7 (30%) as the most prevalent subtype across all samples, followed by ST3 (28%), ST2 (16%), ST1 (14%), ST5 (6%), and ST14 (6%) [10].
ST4 demonstrates particularly interesting geographical patterns. While it is almost as common as ST1 and ST3 in some European countries, this subtype is virtually absent in most Asian and Middle Eastern regions [11]. The rare subtypes ST6 and ST7, considered "avian subtypes," are found more frequently in Asia and the Middle East but are uncommon in Western countries [6].
Zoonotic Potential and Novel Subtypes
Blastocystis exhibits loose host specificity, with many subtypes found in both humans and animals, suggesting zoonotic transmission. A 2022 systematic review and meta-analysis of Blastocystis in dogs and cats found significant subtype diversity in these animals, with ST1-ST8, ST10, ST23, and ST24 reported in dogs, and ST1-ST4, ST10, and ST14 in cats [13]. This overlap with human-infective subtypes indicates their potential role as reservoirs for human infections.
Recent studies continue to identify novel subtypes, expanding our understanding of Blastocystis genetic diversity. In 2023, researchers identified and validated a novel subtype, ST41, in a Colombian patient undergoing colorectal cancer screening [14]. Another 2023 study proposed four new subtypes designated ST35-ST38 from various animal hosts [15]. These discoveries highlight that Blastocystis subtype diversity is not yet fully characterized and that ongoing surveillance is crucial.
Table 1: Global Distribution of Major Blastocystis Subtypes in Human Populations
| Subtype | General Prevalence | Geographical Variations | Common Host Associations |
|---|---|---|---|
| ST1 | Common (~30.9% in dogs) [13] | Prevalent across regions | Humans, dogs, cats, various animals [13] |
| ST2 | Common (~39.3% in dogs) [13] | Prevalent across regions | Humans, dogs, cats, various animals [13] |
| ST3 | Most common overall (~41.3% in dogs) [13] | Dominant in many surveys [12] | Considered primarily anthroponotic [10] |
| ST4 | Variable (1-17% based on method) [11] | Common in Europe, rare in Asia [11] | Primarily found in rodents [10] |
| ST5 | Uncommon | Found in various regions | Pigs, livestock, humans [16] [10] |
| ST6 | Rare in West, more common in East | Regional variation [12] | Birds, humans [6] [12] |
| ST7 | Rare in West, more common in East | Regional variation [12] | Birds, humans [6] [12] |
Table 2: Recently Identified Novel Blastocystis Subtypes
| Subtype | Year Reported | Host Source | Reference |
|---|---|---|---|
| ST35 | 2023 | Little yellow-shouldered bat (Sturnira lilium) | [15] |
| ST36 | 2023 | Rodent (Heteromyidae) | [15] |
| ST37 | 2023 | Human (Brazil) | [15] |
| ST38 | 2023 | European water vole (Arvicola amphibius) | [15] |
| ST41 | 2023 | Human (Colombia) | [14] |
SYBR Green Real-Time PCR Protocol for Blastocystis Detection and Subtyping
The following diagram illustrates the complete workflow for Blastocystis detection and subtyping using SYBR Green real-time PCR:
Detailed Experimental Procedures
Sample Collection and DNA Extraction
Materials:
- Fresh stool samples (200 mg aliquots)
- DNA Stool Minikit (Qiagen, France) or FavorPrep Stool DNA Isolation Mini Kit
- Phosphate-buffered saline (PBS), pH 7.2
- Microcentrifuge tubes
- Centrifuge capable of 8,000 × g
- QIAcube automated extraction system (optional)
Protocol:
- Collect fresh stool samples and store at -20°C until processing.
- For DNA extraction, dilute 200 mg stool sample in PBS (pH 7.2) to create a 10% suspension.
- Vortex thoroughly and centrifuge at 8,000 × g for 5 minutes.
- Transfer 140-200 μL of supernatant to a new tube for DNA extraction.
- Perform DNA extraction according to manufacturer's instructions.
- Elute DNA in 200 μL of elution buffer or RNase-free water.
- Store extracted DNA at -20°C until PCR analysis.
Note: DNA can be extracted directly from stool samples or from cultured isolates. Cultivation in clotted fetal bovine serum medium or Jones medium supplemented with 10% horse serum for 72 hours at 37°C under anaerobic conditions prior to DNA extraction can increase parasite density and improve detection sensitivity [6] [16].
Primer Design and Validation
Primer Sequences: For amplification of the SSU rRNA gene barcode region (~300-620 bp):
- Forward primer (RD5): 5'-ATCTGGTTGATCCTGCCAGT-3' [16]
- Reverse primer (BhRDr): 5'-GAGCTTTTTAACTGCAACAACG-3' [16]
Alternatively, for real-time PCR with HRM analysis:
- Forward primer: 5'-CGAATGGCTCATTATATCAGTT-3'
- Reverse primer: 5'-AAGCTGATAGGGCAGAAACT-3' [10]
Validation Steps:
- Validate primer specificity in silico using BLAST against the NCBI database.
- Test primers with DNA from known Blastocystis subtypes (ST1-ST17) as positive controls.
- Verify absence of cross-reactivity with DNA from other common intestinal parasites (e.g., Giardia intestinalis, Entamoeba histolytica, Entamoeba dispar).
- Establish standard curves using serial dilutions of control DNA to determine amplification efficiency.
SYBR Green qPCR Reaction Setup
Reaction Composition:
- 4.0 μL HOT FIREPol EvaGreen HRM Mix (Solis BioDyne)
- 0.1 μM of each forward and reverse primer
- 3.0 μL template DNA
- DNase/RNase-free water to 20 μL total reaction volume [10]
Alternative Master Mix:
- 10.0 μL Xpert Fast SYBR (Uni) Blue mix (GRiSP)
- 0.1 μM of each primer
- 3.0 μL template DNA
- Nuclease-free water to 20 μL total volume [17]
Thermal Cycling Conditions:
- Initial denaturation: 95°C for 5 minutes
- 35-40 cycles of:
- Denaturation: 95°C for 20-45 seconds
- Annealing: 59-60°C for 45 seconds
- Extension: 72°C for 60-90 seconds
- Melting curve analysis: 65°C to 95°C with continuous fluorescence measurement [16] [17] [10]
Melting Curve Analysis and Subtype Identification
Following amplification, perform high-resolution melting (HRM) curve analysis to differentiate subtypes based on their distinct melting temperatures (Tm). The following diagram illustrates the relationship between subtype identification methods:
HRM Analysis Protocol:
- After the final PCR extension, hold at 65°C for 1 minute.
- Gradually increase temperature to 95°C at a rate of 0.1-0.2°C per second while continuously monitoring fluorescence.
- Analyze melting curves using the real-time PCR instrument software.
- Compare sample Tm values to established standards for subtype identification.
- For validation, purify representative amplicons and perform sequencing.
Research Reagent Solutions
Table 3: Essential Reagents for Blastocystis Subtyping Using SYBR Green qPCR
| Reagent/Category | Specific Product Examples | Function/Application |
|---|---|---|
| DNA Extraction Kits | QIAamp DNA Stool Mini Kit (Qiagen), FavorPrep Stool DNA Isolation Mini Kit | Efficient DNA extraction from complex stool matrices |
| qPCR Master Mixes | HOT FIREPol EvaGreen HRM Mix (Solis BioDyne), Xpert Fast SYBR (Uni) Blue mix (GRiSP) | Sensitive detection with HRM capability for subtype differentiation |
| Primer Sets | RD5/BhRDr (barcoding), BL18SPPF1/BL18SR2PP (qPCR) | Specific amplification of SSU rRNA gene regions for detection and subtyping |
| Positive Controls | DNA from reference isolates (ST1-ST4, ST5-ST9) | Validation of assay performance and sensitivity across subtypes |
| Sequencing Kits | MinION-tailed primers (Nanopore), Sanger sequencing reagents | Verification of novel subtypes and mixed infections |
Applications and Methodological Considerations
Advantages of SYBR Green-Based Approaches
SYBR Green qPCR coupled with HRM analysis offers several advantages for Blastocystis subtyping. This method provides a cost-effective and rapid alternative to sequencing for initial subtype screening, with the ability to process large sample sets efficiently [10]. The closed-tube system minimizes contamination risks while allowing detection of mixed infections through analysis of melting curve profiles. The real-time quantitative capability enables correlation of parasite load with clinical symptoms, which has been a challenge in Blastocystis research [6].
Technical Considerations and Validation
While SYBR Green qPCR with HRM is highly effective for subtyping common variants, several considerations are essential for reliable results. Primer selection critically impacts detection range; the RD5/BhRDr primer pair can amplify non-Blastocystis DNA (e.g., fungal sequences) in stool samples, requiring careful interpretation [11]. Melting temperature differences between subtypes may be subtle, necessitating optimization of HRM conditions and inclusion of known subtype controls in each run. For definitive identification of novel subtypes or verification of mixed infections, sequencing of qPCR products remains essential [17] [15].
Validation should include testing with all known subtypes to establish reference melting temperatures and ensure detection capability. For comprehensive subtyping, the barcoding method (amplifying approximately 600 bp of the 5' end of the SSU rRNA gene) followed by sequencing and phylogenetic analysis provides the most reliable identification, particularly for novel sequences [15] [11].
This application note demonstrates that SYBR Green real-time PCR with HRM analysis is a powerful, efficient method for Blastocystis detection and subtyping. The protocol enables researchers to accurately identify the common ST1-ST4 subtypes while also detecting zoonotic transmission and novel subtypes. As research continues to reveal the complex epidemiology and potential clinical significance of different Blastocystis subtypes, this methodology provides an essential tool for advancing our understanding of this ubiquitous gut protist. The continuing discovery of novel subtypes, such as ST35-ST38 and ST41, highlights the importance of robust subtyping methods in elucidating the full spectrum of Blastocystis diversity and its implications for human health.
The accurate detection and subtyping of Blastocystis sp., a common intestinal protist with global distribution, is crucial for understanding its epidemiology and potential role in human health [18] [19]. Traditional diagnostic methods, primarily microscopy and culture, have been the cornerstone of parasitological diagnosis for decades. However, within the specific context of Blastocystis subtyping research, these methods present significant limitations for comprehensive strain characterization. This application note details the comparative sensitivity of traditional techniques versus modern SYBR Green real-time PCR (qPCR) protocols, providing a validated experimental framework to overcome these diagnostic challenges.
Table 1: Comparative Sensitivity of Diagnostic Methods for Blastocystis sp. Detection
| Diagnostic Method | Reported Sensitivity | Key Limitations for Subtyping |
|---|---|---|
| Direct Light Microscopy (DLM) | 29% [6] | Cannot provide subtype information; sensitivity is poor [18]. |
| Xenic In Vitro Culture (XIVC) | 52% [6] | Time-consuming; subtype growth bias affects representation [6]. |
| Conventional PCR (cPCR) | 24% (in a gut-healthy cohort) [18] | Lower sensitivity than qPCR; less suitable for quantifying parasite load [18]. |
| SYBR Green qPCR | 29% (in a gut-healthy cohort), identifying 12 more positives than cPCR [18] | High sensitivity and quantification capability; enables direct sequencing of products for subtyping [6]. |
Experimental Protocol: SYBR Green qPCR for Blastocystis Detection and Subtyping
DNA Extraction from Stool Samples
The DNA extraction method critically influences detection sensitivity. A manual extraction protocol has been demonstrated to identify significantly more positive specimens compared to automated systems, particularly for samples with low parasite loads [20] [21].
- Reagent: QIAamp DNA Stool Mini Kit (Qiagen).
- Procedure:
- Homogenize 200 mg of stool sample in phosphate-buffered saline (PBS).
- Add a bead-beating step (30 m/s for 3 minutes) to ensure efficient mechanical lysis of robust Blastocystis cyst walls.
- Continue extraction according to the manufacturer's instructions.
- Elute the purified DNA in a final volume of 200 µL [20] [21].
- Inhibition Check: Include an internal control or spike a positive control into the sample to check for PCR inhibitors [20].
SYBR Green qPCR Assay
This protocol is adapted from high-sensitivity assays targeting the Small Subunit Ribosomal RNA (SSU rRNA) gene [6].
- Primers: BL18SPPF1 (5'-AGTAGTCATACGCTCGTCTCAAA-3') and BL18SR2PP (5'-TCTTCGTTACCCGTTACTGC-3'), which amplify an approximately 300 bp fragment of the SSU rRNA gene [22].
- Reaction Setup:
- Xpert Fast SYBR (Uni) Blue mix: 10 µL
- Forward Primer (10 µM): 0.5 µL
- Reverse Primer (10 µM): 0.5 µL
- Template DNA: 2 µL
- Nuclease-free water: to a final volume of 20 µL
- qPCR Cycling Conditions (Run on a Bio-Rad CFX96 or similar):
- Initial Denaturation: 95°C for 10 minutes
- 40 Cycles of:
- Denaturation: 95°C for 15 seconds
- Annealing/Extension: 60°C for 30 seconds (with fluorescence acquisition)
- Melting Curve Analysis: 65°C to 95°C, increment 0.5°C, with continuous fluorescence acquisition.
Data Analysis and Subtyping
- Quantification: Generate a standard curve using a dilution series of known Blastocystis cell counts or a plasmid containing the target gene to estimate the fecal protist load in samples [18].
- Subtyping: Purify qPCR amplicons from positive samples using a PCR purification kit. Submit the purified product for Sanger sequencing. Identify the subtype (ST) by comparing the obtained sequence to the NCBI GenBank database using BLASTn or the Blastocystis Subtyping Module [22] [6]. For detecting mixed-subtype infections, Next-Generation Sequencing (NGS) of the qPCR amplicons is recommended [18] [19].
The following diagram illustrates the integrated workflow for Blastocystis subtyping research, from sample preparation to final subtype identification.
The Scientist's Toolkit: Research Reagent Solutions
Table 2: Essential Reagents and Kits for Blastocystis qPCR and Subtyping
| Item | Function/Application | Example Product |
|---|---|---|
| Manual DNA Extraction Kit | Optimal DNA purification from complex stool matrices; maximizes sensitivity for low-load samples. | QIAamp DNA Stool Minikit (Qiagen) [20] [21] |
| SYBR Green qPCR Master Mix | Sensitive detection and quantification of Blastocystis SSU rDNA; allows melt curve analysis. | Xpert Fast SYBR (Uni) Blue mix (GRiSP) [22] |
| SSU rRNA Primers | Amplification of a barcode region for detection and subsequent subtyping. | BL18SPPF1 / BL18SR2PP [22] |
| PCR Purification Kit | Purification of qPCR amplicons prior to sequencing to remove primers and dNTPs. | GRS PCR and Gel Band Purification Kit (GRiSP) [22] |
| Sanger Sequencing Service | Determination of the Blastocystis subtype from a purified amplicon. | Commercial services (e.g., Eurofins Genomics) [20] |
| NGS Service (Optional) | High-resolution detection of mixed Blastocystis subtype infections within a single sample. | Illumina MiSeq (e.g., for 2x250 bp sequencing) [18] |
Why SYBR Green qPCR? Advantages in Sensitivity, Quantification, and Accessibility for Blastocystis Subtyping
Blastocystis is a common gut protist with significant genetic diversity, classified into subtypes (STs) based on the small subunit ribosomal RNA (SSU rRNA) gene [11]. Molecular characterization is essential for understanding its epidemiology and potential pathogenicity. This application note details the advantages of SYBR Green qPCR for Blastocystis detection, quantification, and subtyping. We provide a validated protocol that offers a superior combination of sensitivity, cost-effectiveness, and workflow efficiency for research and drug development.
Performance Advantages of SYBR Green qPCR
Enhanced Detection Sensitivity
Compared to conventional PCR (cPCR), SYBR Green qPCR demonstrates significantly higher sensitivity for detecting Blastocystis in clinical samples. A direct comparison on 288 stool DNA samples revealed a higher prevalence with qPCR (29%) than with cPCR (24%), confirming its superior capability to identify low-level colonization [18]. Furthermore, molecular methods substantially outperform traditional parasitological techniques. One study showed direct-light microscopy and xenic in vitro culture had only 29% and 52% sensitivity, respectively, compared to a TaqMan qPCR assay, highlighting the limitations of non-molecular approaches [6].
Table 1: Comparative Sensitivity of Blastocystis Detection Methods
| Method | Relative Sensitivity | Key Limitation |
|---|---|---|
| Direct-Light Microscopy | 29% [6] | Poor sensitivity, operator-dependent |
| Xenic In Vitro Culture (XIVC) | 52% [6] | Time-consuming, slow growth for some STs [6] |
| Conventional PCR (cPCR) | Baseline (24% prevalence) [18] | Lower detection limit, no quantification |
| SYBR Green qPCR | Higher (29% prevalence) [18] | Requires melt curve analysis for specificity |
Accurate Quantification and Subtyping
A key advantage of SYBR Green qPCR is the ability to quantify the parasite's fecal load, which can be correlated with clinical parameters. Protocols can be designed to generate amplicons suitable for subsequent High-Resolution Melting (HRM) analysis or sequencing to determine subtypes [23].
Table 2: SYBR Green qPCR Performance Characteristics for Pathogen Detection
| Parameter | Performance | Experimental Note |
|---|---|---|
| Limit of Detection (LOD) | As low as 10 copies/µl [23] | LOD varies by primer set and target gene |
| Amplification Efficiency | 95.77% to 103.11% [23] | Slope of -3.2497 to -3.4277, R² of 0.9942-0.9998 |
| Quantification Range | 5 to 7 orders of magnitude [24] | Reliable quantification from low to high loads |
| Subtyping Compatibility | High (via HRM or sequencing) [23] | Post-amplification analysis determines STs |
Experimental Protocol: SYBR Green qPCR for Blastocystis
The following diagram illustrates the complete experimental workflow from sample collection to data analysis for Blastocystis detection and subtyping using SYBR Green qPCR.
Reagents and Equipment
Table 3: Research Reagent Solutions and Essential Materials
| Item | Function / Description | Example / Specification |
|---|---|---|
| DNA Extraction Kit | Isolation of high-quality genomic DNA from stool. | QIAamp Fast DNA Stool Mini Kit (Qiagen) [25] |
| SYBR Green Master Mix | Contains SYBR dye, Taq polymerase, dNTPs, and optimized buffer. | Includes a hot-start Taq polymerase [26] |
| Primers | Targets a specific region of the Blastocystis SSU rRNA gene. | e.g., RD5 (F: 5'-GGAACCTTCTCGTTCGCTATC-3') and BhRDr (R: 5'-TGCCTTCCTTTGGATGTGGT-3') [25] |
| Optical Plate/Strip | Holds reactions for fluorescence detection in the thermocycler. | Compatible with the real-time PCR instrument |
| Real-Time PCR Instrument | Performs thermal cycling and measures fluorescence in real time. | e.g., ABI 7500, LightCycler LC 480 I [25] [18] |
Step-by-Step Procedure
DNA Extraction
qPCR Reaction Setup
- Prepare reactions in a final volume of 20 µL on ice.
- Reagent Composition:
- 10 µL of 2X SYBR Green Master Mix
- 0.1 - 0.5 µM of each forward and reverse primer (e.g., RD5/BhRDr) [25]
- 2 - 5 µL of DNA template
- Nuclease-free water to 20 µL
- Include a negative control (nuclease-free water) and a positive control (DNA from a known Blastocystis isolate or a plasmid control) in each run.
qPCR Amplification
- Run the plate in a real-time PCR instrument using the following cycling conditions, unless specified otherwise by the master mix manufacturer:
- After amplification, immediately proceed to melt curve analysis.
Melting Curve Analysis
- Generate a melt curve to verify amplification specificity using the instrument's standard SYBR Green melt curve program (e.g., from 65°C to 95°C, with continuous fluorescence measurement) [26]. A single, sharp peak indicates specific amplification.
Data Analysis
- Quantification: Set the fluorescence threshold in the exponential phase of amplification to determine the Quantification Cycle (Cq). Use a standard curve of known copy numbers for absolute quantification [26].
- Subtyping: Purify the qPCR amplicon and perform Sanger sequencing. Submit the resulting sequence to online databases like PubMedST.org for subtype and allele identification [11].
SYBR Green qPCR is a powerful, accessible, and robust method that advances Blastocystis research. It provides the high sensitivity needed for accurate prevalence studies, the quantitative data essential for investigating clinical relevance, and a flexible platform that supports cost-effective subtyping. This protocol provides researchers and drug development professionals with a reliable tool to deepen the understanding of Blastocystis epidemiology and host-parasite interactions.
Step-by-Step SYBR Green qPCR Workflow: From Sample to Subtype Result
The reliability of Blastocystis subtyping research using SYBR Green real-time PCR is fundamentally dependent on the initial DNA extraction process. Inconsistent DNA yield, purity, and the presence of PCR inhibitors from stool specimens can significantly compromise downstream molecular results, leading to inaccurate subtype identification and erroneous epidemiological conclusions [20] [27]. The choice between manual and automated nucleic acid extraction methods is therefore not merely a matter of convenience but a critical methodological consideration that directly impacts data integrity. This application note provides a structured comparison of these methodologies, evaluates their performance within the context of Blastocystis research, and delivers optimized protocols to ensure high-quality genetic data for SYBR Green real-time PCR assays.
Performance Comparison: Manual vs. Automated DNA Extraction
A comparative analysis of DNA extraction methods reveals significant differences in performance, particularly for the detection of Blastocystis in stool samples.
Table 1: Comparative Performance of DNA Extraction Methods for Blastocystis Detection
| Extraction Method | Key Characteristics | Reported Positivity Rate for Blastocystis |
Key Advantages | Key Limitations |
|---|---|---|---|---|
| Manual (with bead-beating) [20] [27] | QIAamp DNA Stool Mini Kit (Qiagen); includes bead-beating step. | 71.1% (54/76 true positive samples) [20] | Higher sensitivity, especially for low parasite loads; effective lysis of tough cysts [20] [27]. | More hands-on time; potential for higher sample-to-sample variability. |
| Automated (without bead-beating) [20] | QIAsymphony DNA extractor (Qiagen); uses swab in transport medium. | 52.6% (40/76 true positive samples) [20] | Standardized workflow; reduced hands-on time and cross-contamination risk [28]. | Significantly lower sensitivity (p < 0.05); may fail to lyse robust parasite forms [20]. |
| QIAamp PowerFecal Pro DNA Kit (QB) [27] | Commercial kit combining chemical and mechanical lysis. | Highest PCR detection rate for mixed parasitic infections (61.2%) [27] | Effective for a wide range of parasites; reduces PCR inhibitors [27]. | Commercial cost. |
The data demonstrates that manual DNA extraction with a bead-beating step yields significantly higher sensitivity for Blastocystis detection compared to automated methods without this mechanical lysis step. One study found that manual extraction identified 34.7% more true positive samples than an automated platform [20]. The failure of automated systems is particularly pronounced in samples with low parasite loads, where the mean Ct value for samples missed by automated extraction was 34.37, compared to 19.38 for other positives when tested with manual extraction [20]. Incorporating bead-beating is crucial, as it provides incremental yield by effectively lysing a greater representation of Gram-positive bacteria and robust microbial forms in stool [28].
Recommended Protocols
Manual DNA Extraction with Bead-Beating forBlastocystis
This protocol is adapted from the highly sensitive QIAamp DNA Stool Mini Kit method, validated for Blastocystis research [20].
Workflow: Manual DNA Extraction with Bead-Beating
Materials & Reagents
- QIAamp DNA Stool Mini Kit (Qiagen, Cat. No. 51504) [20]
- Proteinase K
- Ethanol (96-100%)
- PBS (Phosphate Buffered Saline)
- Bead-beating tube containing 1.4 mm ceramic or silica beads [27]
- Microcentrifuge tubes (1.5 mL and 2 mL)
- Thermal shaker or water bath
- Microcentrifuge
- Vortexer
- Bead beater homogenizer (e.g., FastPrep-24) [28]
Step-by-Step Procedure
- Sample Preparation: Weigh 180-220 mg of stool into a 2 mL microcentrifuge tube. For preserved samples, wash with PBS first [27].
- Lysis: Add 1.4 mL of ASL buffer from the kit to the sample. Vortex vigorously until the stool is thoroughly homogenized.
- Bead-Beating: Transfer the homogenate to a bead-beating tube. Secure the tubes in a bead beater and homogenize at 6.0 m/s for 40-60 seconds [28] [20]. This mechanical lysis is critical for breaking tough
Blastocystiscysts. - Incubation: Heat the lysate at 70°C for 10 minutes to further facilitate lysis. Vortex briefly, then centrifuge at 14,000 × g for 1 minute.
- Inhibitor Removal: Transfer 1.2 mL of the supernatant to a new 2 mL tube. Add one InhibitEX tablet, vortex immediately for 1 minute, and incubate at room temperature for 2 minutes. Centrifuge at 14,000 × g for 3 minutes.
- Protein Digestion: Transfer 200 µL of the supernatant to a new 1.5 mL tube. Add 25 µL of Proteinase K and 200 µL of AL buffer. Mix by pulse-vortexing and incubate at 70°C for 10 minutes.
- DNA Precipitation: Add 200 µL of ethanol (96-100%) to the lysate and mix by pulse-vortexing.
- DNA Binding and Washing: Pipet the mixture onto a QIAamp Mini spin column. Centrifuge at 14,000 × g for 1 minute. Place the column in a clean 2 mL collection tube. Wash sequentially with 500 µL AW1 buffer (centrifuge at 14,000 × g for 1 min) and 500 µL AW2 buffer (centrifuge at 14,000 × g for 3 min).
- Elution: Place the column in a clean 1.5 mL microcentrifuge tube. Add 50-100 µL of AE elution buffer pre-heated to 55-70°C to the center of the membrane. Incubate at room temperature for 5 minutes, then centrifuge at 14,000 × g for 1 minute to elute the DNA.
- Storage: Store the extracted DNA at -20°C or -80°C until used in SYBR Green qPCR.
Automated DNA Extraction with Integrated Bead-Beating
For higher throughput laboratories, automated extraction can be optimized by integrating a bead-beating step prior to processing on the instrument.
Workflow: Automated DNA Extraction with Integrated Bead-Beating
Materials & Reagents
- KingFisher Apex System (ThermoFisher Scientific) or equivalent automated nucleic acid extractor [28]
- Compatible magnetic bead-based DNA extraction kit (e.g., MagMAX Microbiome Ultra Nucleic Acid Isolation Kit)
- Deep-well plates (96-well)
- Tip combs
- Bead-beating tubes with beads
Step-by-Step Procedure
- Pre-Lysis and Bead-Beating: In a bead-beating tube, combine 100-300 µL of stool (or 200 mg) with the recommended lysis buffer. Perform bead-beating off-instrument at 6.0 m/s for 40 seconds [28].
- Clarification: Centrifuge the lysate to pellet debris. Transfer the clarified supernatant to the designated deep-well plate for the automated system.
- Reagent Loading: Add magnetic beads, wash buffers, and elution buffer to their assigned wells according to the kit and instrument specifications.
- Automated Run: Execute the automated extraction protocol. The system will perform the remaining steps, including further binding, washing, and final elution.
- Storage: Collect the eluted DNA in a 96-well plate and store at -20°C or -80°C.
The Scientist's Toolkit: Essential Reagents and Equipment
Table 2: Key Research Reagent Solutions for DNA Extraction from Stool
| Item | Function/Application | Example Products |
|---|---|---|
| Silica Membrane/Magnetic Bead Kits | Selective binding and purification of nucleic acids from complex lysates. | QIAamp DNA Stool Mini Kit (manual) [20]; MagMAX Microbiome Ultra Kit (automated) |
| Bead-Beating Tubes | Mechanical disruption of resilient microbial and protozoan cell walls. | Tubes with 0.1-1.4 mm ceramic, silica, or zirconia beads [28] [27] |
| Inhibitor Removal Reagents | Neutralize common PCR inhibitors (e.g., bile salts, complex polysaccharides) from stool. | InhibitEX tablets (in QIAamp kits) [29] |
| Proteinase K | Enzymatic digestion of proteins to facilitate lysis and degrade nucleases. | Molecular biology-grade Proteinase K [20] |
| Automated Nucleic Acid Extractors | High-throughput, standardized purification of DNA. | KingFisher Apex, MagNA Pure 96, QIAcube [28] [22] [30] |
The selection of a DNA extraction method for Blastocystis subtyping is a critical determinant of research success. Manual methods incorporating a rigorous bead-beating step currently provide superior sensitivity and are strongly recommended for maximizing detection, especially in cases of low parasite load or for comprehensive subtyping. While automated systems offer valuable advantages in throughput and reproducibility, their performance is contingent upon the integration of effective mechanical lysis prior to extraction. The protocols detailed herein provide a robust foundation for obtaining high-quality DNA from stool specimens, thereby ensuring the reliability and accuracy of subsequent SYBR Green real-time PCR analyses for Blastocystis subtyping.
Within the framework of developing SYBR Green real-time PCR protocols for Blastocystis subtyping research, the selection and design of primers targeting the Small Subunit Ribosomal RNA (SSU rRNA) gene is a critical foundational step. The SSU rRNA gene serves as the primary molecular marker for detecting and differentiating Blastocystis subtypes due to its high genetic diversity among strains [31] [6]. This protocol details a method for broad detection and subtyping of Blastocystis sp., enabling researchers to investigate its prevalence, genetic diversity, and zoonotic transmission dynamics.
Primer Design Principles for the SSU rRNA Gene
The design of primers for detecting Blastocystis must account for the significant genetic variation across known subtypes while ensuring broad detection capability.
- Sequence Conservation Analysis: Before design, align full-length SSU rRNA gene sequences from all known subtypes (e.g., ST1-ST44) to identify conserved regions suitable for pan-Blastocystis primers [32].
- Amplicon Length Considerations: For SYBR Green-based qPCR, design amplicons between 300-600 bp. Shorter amplicons improve amplification efficiency, while longer fragments provide more sequence information for reliable subtyping [22] [6] [10].
- Subtype Discrimination: While the initial goal is broad detection, primer design should facilitate downstream subtyping via sequencing or High-Resolution Melting (HRM) analysis. The amplified region must contain sufficient polymorphic sites to discriminate between subtypes [10].
Recommended Primer Sequences and Properties
The following primers have been validated across multiple studies for broad detection of Blastocystis subtypes.
Table 1: Primer Sequences for SSU rRNA Gene Amplification
| Primer Name | Sequence (5' to 3') | Target Region | Amplicon Size | Primary Application |
|---|---|---|---|---|
| BL18SPPF1 | CGAATGGCTCATTATATCAGTT | SSU rRNA | ~300 bp | SYBR Green qPCR & HRM [22] [10] |
| BL18SR2PP | AAGCTGATAGGGCAGAAACT | SSU rRNA | ~300 bp | SYBR Green qPCR & HRM [22] [10] |
| RD5 | ATCTGGTTGATCCTGCCAGT | SSU rRNA | ~600 bp | Conventional PCR & Sequencing [33] [34] |
| BhRDr | GAGCTTTTTAACTGCAACAACG | SSU rRNA | ~600 bp | Conventional PCR & Sequencing [33] [34] |
| Af* | AACCTGGTTGATCCTGCCAGTAGTC | SSU rRNA | ~1800 bp | Full-length gene sequencing [32] |
| Br* | TGATCCTTCTGCAGGTTCAACCTAC | SSU rRNA | ~1800 bp | Full-length gene sequencing [32] |
Note: Primers Af and Br are universal eukaryotic primers used for generating full-length SSU rRNA gene sequences, typically for novel subtype identification [32].
Detailed Experimental Protocol
DNA Extraction from Stool Samples
- Sample Preparation: Suspend 200 mg of stool in phosphate-buffered saline (PBS) and homogenize thoroughly. Centrifuge at 8000× g for 5 minutes to pellet particulate matter [22].
- Nucleic Acid Isolation: Extract DNA from 140-200 μL of supernatant using commercial stool DNA extraction kits (e.g., QIAamp DNA Stool Mini Kit, Qiagen) following manufacturer's protocols [22] [6] [10].
- DNA Storage: Elute DNA in RNase-free water or elution buffer and store at -20°C until PCR analysis.
SYBR Green Real-Time PCR Setup
The following protocol utilizes the BL18SPPF1/BL18SR2PP primer pair for sensitive detection and subtyping potential.
Table 2: SYBR Green qPCR Reaction Setup
| Component | Volume per Reaction (μL) | Final Concentration |
|---|---|---|
| HOT FIREPol EvaGreen HRM Mix (Solis BioDyne) | 10.0 | 1X |
| Forward Primer (10 μM) | 0.8 | 0.4 μM |
| Reverse Primer (10 μM) | 0.8 | 0.4 μM |
| Template DNA | 2.0 | - |
| DNase/RNase-free Water | 6.4 | - |
| Total Volume | 20.0 | - |
Thermocycling Conditions:
- Initial Denaturation: 95°C for 15 minutes
- 40 Cycles of:
- Denaturation: 95°C for 15 seconds
- Annealing: 60°C for 30 seconds
- Extension: 72°C for 30 seconds
- High-Resolution Melting (HRM) Analysis:
- Denaturation: 95°C for 15 seconds
- Annealing: 60°C for 1 minute
- Gradual heating to 95°C at 0.1°C per second with continuous fluorescence acquisition [10]
Post-Amplification Analysis
- Melting Curve Analysis: Analyze melting curves to identify different subtypes based on distinct melting temperatures (Tm). ST1-ST4, ST7, and ST14 show distinguishable Tm values [10].
- Gel Electrophoresis: Verify amplicon size by running 5 μL of PCR product on a 1.5-2% agarose gel.
- Sequencing for Subtype Confirmation: Purify remaining PCR product and submit for Sanger sequencing or use advanced sequencing methods (e.g., Oxford Nanopore, Illumina) for mixed infections [22] [33] [32].
Workflow Visualization
Research Reagent Solutions
Table 3: Essential Research Reagents for Blastocystis SSU rRNA Detection
| Reagent/Category | Specific Examples | Function/Purpose |
|---|---|---|
| DNA Extraction Kits | QIAamp DNA Stool Mini Kit (Qiagen), FavorPrep Stool DNA Isolation Mini Kit | Efficient DNA isolation from complex stool matrices [22] [10] |
| qPCR Master Mixes | HOT FIREPol EvaGreen HRM Mix, Xpert Fast SYBR (Uni) Blue mix | Sensitive detection with SYBR Green chemistry suitable for HRM [22] [10] |
| Sequence-Free Typing | High-Resolution Melting (HRM) Analysis | Discriminate subtypes without sequencing based on Tm differences [10] |
| Confirmatory Sequencing | Sanger Sequencing, Oxford Nanopore MinION, Illumina MiSeq | Definitive subtype identification and mixed infection detection [22] [33] [32] |
| Positive Controls | DNA from reference strains (ATCC), previously typed clinical isolates | Assay validation and quality control [6] |
Expected Results and Data Interpretation
When implementing this protocol, researchers can expect:
- Amplification Curves: Positive samples typically show exponential amplification between 20-35 cycles, depending on parasite load [6].
- Melting Temperatures: Different subtypes yield distinct Tm values; for example, ST3 and ST7 can be differentiated by their characteristic melting peaks [10].
- Subtype Distribution: In human and animal populations, ST1-ST4 are most common in humans, while animals frequently harbor ST5, ST10, and ST14 [33] [10] [34].
- Mixed Infections: Next-generation sequencing often reveals complex mixed subtype infections that may be missed by Sanger sequencing alone [33] [34].
Technical Considerations and Troubleshooting
- Inhibition Control: Include internal amplification controls to detect PCR inhibitors common in stool samples.
- Primer Specificity: Regularly BLAST primer sequences against updated databases to ensure continued specificity as new subtypes are discovered.
- Sensitivity Optimization: For low-abundance samples, consider nested PCR approaches, though this may increase contamination risk.
- Subtype Validation: For novel subtypes, obtain full-length SSU rRNA gene sequences using long-read sequencing technologies (e.g., Oxford Nanopore) [32].
This comprehensive protocol for primer design and selection enables robust detection and subtyping of Blastocystis,- significantly enhancing epidemiological studies and zoonotic transmission research. The integration of SYBR Green qPCR with HRM analysis provides a cost-effective approach for large-scale screening, while subsequent sequencing allows for precise subtype identification crucial for understanding the molecular epidemiology of this ubiquitous gut protist.
Within the framework of developing a SYBR Green real-time quantitative PCR (qPCR) protocol for Blastocystis subtyping research, the preparation of the master mix and the setup of the reaction are critical steps that dictate the assay's overall success. This protocol details the optimization of these components to ensure high sensitivity, specificity, and reproducibility for the detection and differentiation of Blastocystis subtypes, which are crucial for epidemiological studies and investigating the potential pathogenicity of this common gut protist [6] [10].
The following workflow outlines the complete qPCR process, from sample preparation to data analysis, highlighting the core steps involved in the master mix and reaction setup.
The Scientist's Toolkit: Research Reagent Solutions
A successful SYBR Green qPCR relies on a set of core components. The table below details the essential reagents and their functions, with specific considerations for Blastocystis detection.
Table 1: Essential Reagents for SYBR Green qPCR Master Mix Preparation
| Reagent | Function | Key Considerations for Blastocystis Subtyping |
|---|---|---|
| Hot-Start DNA Polymerase [35] | Catalyzes DNA synthesis; hot-start minimizes non-specific amplification. | Essential for sensitive detection from complex stool-derived DNA [6]. |
| SYBR Green I Dye [35] [36] | Binds dsDNA, enabling real-time product detection. | Cost-effective for screening; requires melt curve analysis for specificity [10]. |
| dNTP Mix [35] | Building blocks for new DNA strands. | Standard dATP, dCTP, dGTP, dTTP mixtures are suitable. |
| Reaction Buffer [35] | Provides optimal ionic conditions and Mg²⁺ for polymerase activity. | Mg²⁺ concentration (typically 3-6 mM) may require optimization [35]. |
| Primers [6] [10] | Sequence-specific oligonucleotides that define the amplicon. | Target the SSU rRNA gene; design for high specificity and ~80-150 bp amplicon [6] [36]. |
| Passive Reference Dye [35] | Normalizes for well-to-well variations. | Required by some instruments; use ROX or similar as recommended. |
| Nuclease-Free Water [35] | Solvent for the reaction. | Must be high-quality to avoid contaminants. |
Master Mix Formulation and Optimization
Standard Master Mix Composition
A typical 20 µL SYBR Green qPCR reaction mixture for Blastocystis detection can be assembled as follows, based on common commercial mixes and the protocol from Hamed Mirjalali et al. [10]:
- 2X SYBR Green Master Mix (e.g., HOT FIREPol EvaGreen HRM Mix): 10 µL
- This pre-formulated mix typically contains hot-start Taq DNA polymerase, SYBR Green I dye, dNTPs, MgCl₂, and reaction buffer, ensuring consistency and reducing pipetting steps.
- Forward and Reverse Primers (10 µM each): 0.8 µL each (final concentration 400 nM each)
- DNA Template: 2-5 µL
- The optimal volume should be determined empirically, but the input mass should be kept low (e.g., equivalent to 100 pg of genomic DNA) to minimize inhibitors [35].
- Nuclease-Free Water: to 20 µL
Critical Optimization Parameters
Primer Design and Concentration: Primers are the foundation of assay specificity. For Blastocystis subtyping, they must target a variable region of the small subunit ribosomal RNA (SSU rRNA) gene [6] [10] [37]. The use of primer design software is highly recommended [36]. The optimal primer concentration (often 50-400 nM) should be determined through a concentration gradient test to maximize signal and minimize primer-dimer formation [35] [36].
Magnesium Concentration: While master mixes contain a standard Mg²⁺ concentration (often 3.5-4.5 mM), further optimization may be needed. Lower concentrations can reduce non-specific amplification, which is critical when using SYBR Green dye [35].
Template Quality and Quantity: DNA extracted from stool samples must be pure and free of PCR inhibitors. The use of a stool DNA isolation kit is recommended [6] [10]. The integrity and concentration of the DNA template should be verified by spectrophotometry (A260/A280 ratio of ~1.8-2.0) [35].
Experimental Protocol: Reaction Setup and Thermocycling
Step-by-Step Reaction Setup
- Thaw and Mix: Thaw all reagents (master mix, primers, water, DNA templates) on ice or a cooling block. Gently vortex and briefly centrifuge to collect contents at the bottom of the tubes.
- Prepare Master Mix: In a sterile, nuclease-free microcentrifuge tube, calculate and combine all components for the total number of reactions (including extra for pipetting error). The table below provides a sample setup for a single 20 µL reaction.
- Aliquot: Dispense the appropriate volume of master mix into each well of a qPCR plate or tube.
- Add Template: Add the required volume of each DNA sample to the respective wells. Include a no-template control (NTC) containing nuclease-free water instead of DNA.
- Seal the Plate: Apply an optical adhesive seal firmly to prevent evaporation and cross-contamination.
- Centrifuge: Briefly centrifuge the plate to ensure all liquid is at the bottom of the wells and free of air bubbles.
- Load Instrument: Place the plate in the real-time PCR instrument and set up the run protocol as detailed in Section 4.2.
Table 2: Sample Single 20 µL Reaction Setup
| Component | Volume per Reaction | Final Concentration/Amount |
|---|---|---|
| 2X SYBR Green Master Mix | 10.0 µL | 1X |
| Forward Primer (10 µM) | 0.8 µL | 400 nM |
| Reverse Primer (10 µM) | 0.8 µL | 400 nM |
| Nuclease-Free Water | 2.4 - 5.4 µL | - |
| DNA Template | 5.0 µL (variable) | e.g., 10-100 ng |
| Total Volume | 20.0 µL |
Thermocycling Conditions
The following cycling protocol is a robust starting point, adapted for Blastocystis detection [6] [10] [17]. Parameters may require optimization for specific thermocyclers and primer sets.
- Initial Denaturation: 95°C for 5-15 minutes (activates hot-start polymerase).
- Amplification (40-45 cycles):
- Denaturation: 95°C for 15-30 seconds.
- Annealing: 60°C for 30-60 seconds (acquire fluorescence signal at this step).
- Extension: 72°C for 30 seconds.
- Melting Curve Analysis:
- 95°C for 15 seconds.
- 60°C for 60 seconds.
- Gradual increase to 95°C (e.g., at 0.1-0.5°C/sec) with continuous fluorescence acquisition.
The workflow below details the procedural steps for the specific application of setting up and running a SYBR Green qPCR for Blastocystis subtyping.
Troubleshooting and Quality Control
- High Background or Primer-Dimer: This is indicated by a melt curve peak at a significantly lower temperature than the specific product. To resolve, optimize primer concentrations, use a hot-start polymerase, or increase the annealing temperature [35] [36].
- No Amplification or High Cq Values: Check DNA quality and concentration, ensure primer sequences are correct for the target Blastocystis SSU rRNA region, and verify reagent integrity [6].
- Non-Specific Amplification: Multiple peaks in the melt curve suggest non-specific products. Optimize Mg²⁺ concentration, annealing temperature, or redesign primers for greater specificity [35].
- Inconsistent Replicates: Ensure reagents are thoroughly mixed before use and that pipetting is accurate.
Quality Control Measures:
- No-Template Control (NTC): Must be negative for amplification to rule out contamination.
- Positive Control: A known Blastocystis DNA sample should amplify with the expected Cq and melt curve profile.
- Melt Curve Analysis: This is a mandatory step for SYBR Green assays to verify amplification of a single, specific product [36] [38]. Different Blastocystis subtypes may produce distinct melt curves, which can be leveraged for preliminary identification [10].
Within the framework of research on SYBR Green real-time PCR protocols for Blastocystis subtyping, the optimization of thermocycling conditions is a critical determinant of assay success. This protocol details the establishment of a robust SYBR Green qPCR method, incorporating High-Resolution Melting (HRM) analysis for the specific detection and differentiation of Blastocystis subtypes. The approach balances high amplification efficiency with exceptional specificity, which is paramount for accurate subtyping in complex stool sample matrices and for investigating cross-species transmission dynamics [22] [10]. The following sections provide a detailed, step-by-step guide to reagent preparation, instrument setup, and data analysis, supported by quantitative performance data.
Key Performance Metrics for SYBR Green qPCR
The following table summarizes the typical performance characteristics achievable with an optimized SYBR Green qPCR protocol, as demonstrated in applications for pathogen detection and genotyping.
Table 1: Quantitative Performance Metrics of SYBR Green qPCR Assays
| Performance Parameter | Reported Value | Experimental Context |
|---|---|---|
| Amplification Efficiency | 99.4% | Detection of Oncomelania hupensis quadrasi DNA [39] |
| Linear Dynamic Range | 102 to 106 gene copies/μL | Diagnosis of infectious bronchitis virus [40] |
| Limit of Detection (LOD) | 1 copy/μL [39] | Oncomelania hupensis quadrasi DNA detection [39] |
| Assay Sensitivity | At least 10x higher than conventional gel electrophoresis [40] | Infectious bronchitis virus detection [40] |
| Inter-Assay Variability | 0.6–1.8% Coefficient of Variation (CV) [40] | Infectious bronchitis virus diagnosis [40] |
| Melting Temperature Difference | 2.73°C for species differentiation [41] | Differentiation of Plasmodium species via HRM [41] |
Application Notes & Experimental Protocol
This protocol is designed for the detection and subtyping of Blastocystis sp. from human and animal stool samples, leveraging SYBR Green-based qPCR followed by High-Resolution Melting (HRM) analysis [22] [10].
Research Reagent Solutions
The following reagents are essential for the execution of this protocol.
Table 2: Essential Research Reagents and Materials
| Item | Function / Description | Example Product / Specification |
|---|---|---|
| SYBR Green Master Mix | Provides hot-start Taq DNA polymerase, dNTPs (with dUTP), MgCl2, UDG, and the SYBR GreenER fluorescent dye for qPCR [42]. | SYBR GreenER qPCR SuperMix Universal [42] |
| Primer Pair | Targets a ~300 bp fragment of the Blastocystis 18S SSU rRNA gene for amplification and subtyping [22]. | BL18SPPF1 / BL18SR2PP [22] |
| DNA Extraction Kit | For purification of high-quality genomic DNA from complex stool samples. | FavorPrep Stool DNA Isolation Mini Kit [10] |
| ROX Reference Dye | An optional passive reference dye for normalizing fluorescent signals in real-time PCR instruments that require it [42]. | Provided separately with some SuperMix kits [42] |
| Nuclease-Free Water | Solvent for diluting primers and adjusting reaction volumes; must be free of nucleases to prevent degradation of reaction components. | DNase/RNase-free water [10] |
Step-by-Step Procedure
Sample Preparation and DNA Extraction
- Stool Sample Collection: Collect human or animal stool samples using sterile containers. Macroscopic examination is recommended to assess consistency [10].
- DNA Extraction: Purify genomic DNA from approximately 200 mg of stool sample using a specialized stool DNA isolation kit, following the manufacturer's instructions [10].
- DNA Quantification and Storage: Determine the concentration and purity of the extracted DNA using a spectrophotometer (e.g., NanoDrop). A 260/280 ratio of ~1.8 is indicative of pure DNA. Store eluted DNA at -20°C until PCR setup [41].
Primer Reconstitution and Reaction Setup
- Primer Preparation: Resuspend lyophilized primers in nuclease-free water to create a concentrated stock (e.g., 100 μM). From this, prepare a 10 μM working solution for both forward and reverse primers [42].
- Master Mix Preparation: Thaw the SYBR Green SuperMix and other components on ice. For multiple reactions, prepare a master mix to minimize pipetting errors and ensure consistency [42]. A sample reaction setup for a 20 μL volume is below.
Table 3: Reaction Setup for a 20 μL Volume
| Component | Volume per 20 μL Reaction | Final Concentration |
|---|---|---|
| 2X SYBR GreenER qPCR SuperMix | 10.0 μL | 1X |
| Forward Primer (10 μM) | 0.4 μL | 200 nM |
| Reverse Primer (10 μM) | 0.4 μL | 200 nM |
| ROX Reference Dye (if required) | Variable* | As per instrument specs |
| Template DNA | 2.0 μL | Up to 100 ng |
| Nuclease-Free Water | To 20.0 μL | - |
*Consult instrument guidelines for the correct volume of ROX dye [42].
- Plate Sealing: Gently mix the reaction, ensure all components are at the bottom of the well, and seal the PCR plate. Centrifuge briefly if necessary [42].
Thermocycling and HRM Analysis
Program the real-time PCR instrument using the following cycling parameters, which are optimized to balance efficiency and specificity:
- UDG Incubation: 50°C for 2 minutes (Activates UDG to prevent carryover contamination) [42].
- Polymerase Activation/Initial Denaturation: 95°C for 10 minutes [42].
- Amplification (40 cycles):
- Denaturation: 95°C for 15 seconds.
- Annealing/Extension: 60°C for 60 seconds. Acquire fluorescence at the end of this step [42].
- High-Resolution Melting (HRM) Analysis:
Workflow Visualization
The following diagram illustrates the complete experimental workflow for Blastocystis subtyping, from sample collection to data analysis.
Data Analysis and Interpretation
- Amplification Curve Analysis: Examine the amplification plots to ensure early Cq values for positive controls and a clear logarithmic phase. The no-template control (NTC) should show no amplification.
- Melting Curve Analysis: Analyze the HRM data by viewing the derivative of the melting curve (-dF/dT vs. Temperature). Distinct, sharp peaks indicate specific amplification. Different Blastocystis subtypes will display characteristic melting temperatures (Tm) due to sequence variations in the amplified region [10]. Differences as small as 2.7°C can be significant for differentiation [41].
- Subtype Identification: Compare the Tm values and normalized melting profiles of unknown samples to those of known subtype controls run in the same assay. Confirm novel or ambiguous subtypes using Sanger sequencing or targeted amplicon sequencing (e.g., Oxford Nanopore Technologies) [22].
This detailed application note provides a validated framework for implementing SYBR Green qPCR with HRM analysis for Blastocystis subtyping. By adhering to the specified thermocycling conditions and reagent specifications, researchers can achieve a sensitive, specific, and cost-effective method that is essential for elucidating the epidemiology and zoonotic transmission of this common gut protist.
Within the context of a broader thesis on SYBR Green real-time PCR protocols, this application note details the implementation of High-Resolution Melting (HRM) curve analysis for the detection and subtyping of Blastocystis sp., a common intestinal protist with uncertain pathogenicity. Molecular subtyping is crucial for understanding its epidemiology and zoonotic potential. Traditional Sanger sequencing, while accurate, is often cost-prohibitive and time-consuming for large-scale screening. SYBR Green-based HRM analysis presents a rapid, cost-effective, and closed-tube alternative for differentiating Blastocystis subtypes directly after amplification, making it particularly valuable for high-throughput studies and surveillance in developing countries [43] [10] [44]. This protocol focuses on subtyping based on the small subunit ribosomal RNA (SSU rRNA) gene, the standard genetic marker for Blastocystis.
Application Data: Subtype Distribution and Melting Profiles
Data from recent studies utilizing HRM for Blastocystis subtyping reveal distinct subtype distributions across different hosts and geographical regions. The following tables summarize key findings on subtype prevalence and their characteristic melting temperatures.
Table 1: Prevalence of Blastocystis Subtypes in Recent HRM Studies
| Study Population / Location | Sample Size (n) | Most Prevalent Subtype(s) | Other Detected Subtypes | Citation |
|---|---|---|---|---|
| Humans & Domestic Animals, Iran | 730 | ST7 (30%), ST3 (28%) | ST2 (16%), ST1 (14%), ST5 (6%), ST14 (6%) | [43] [10] |
| Symptomatic Human Isolates, Egypt | 54 | ST3 (54.7%) | ST4 (27.8%), ST1 (18.5%) | [45] |
| Shepherd Dogs, Portugal | 50 | ST1-ST4, ST14* | Mixed infections frequently observed | [22] |
| Livestock (Cattle, Sheep, Chickens), Iran | 173 | ST10 (53.3%), ST14 (35.6%) | ST1 (2.2%), ST5 (6.7%), ST7 (2.2%) | [46] |
*Specific prevalence percentages for each subtype were not provided in the source; the study confirmed the presence of these zoonotic subtypes.
Table 2: Characteristic Melting Temperatures (Tm) of Common Blastocystis Subtypes
| Blastocystis Subtype | Approximate Melting Temperature (Tm) | Notes |
|---|---|---|
| ST1 | Specific Tm values varied by study and instrument but were consistently distinguishable from other subtypes. | HRM differentiates ST1 from ST2, ST3, etc. [46]. |
| ST2 | Differentiable Tm from ST1 and ST3. | |
| ST3 | Wild-type, mutant, and heterozygous intrasubtypes show distinct HRM curves [45]. | |
| ST4 | Distinct Tm profile. | |
| ST5 | Distinct Tm profile. | |
| ST7 | Distinct Tm profile. | |
| ST10 | Distinct Tm profile. | |
| ST14 | Distinct Tm profile. |
It is critical to note that absolute Tm values are not universal; they depend on factors like instrument model, reagent chemistry, and amplicon length. Therefore, each laboratory must establish its own reference Tm values for known subtypes using controlled standards [44].
Experimental Protocol: HRM for Blastocystis Subtyping
The following is a detailed methodology for detecting and subtyping Blastocystis sp. from stool samples using SYBR Green-based real-time PCR and HRM analysis.
Sample Collection and DNA Extraction
- Sample Collection: Collect fresh stool samples from human or animal subjects. Store samples at -20°C if not processed immediately.
- DNA Extraction: Extract genomic DNA from approximately 200 mg of stool using a commercial stool DNA isolation kit (e.g., FavorPrep Stool DNA Isolation Mini Kit or QIAamp DNA Mini Kit) following the manufacturer's instructions [10] [22].
- DNA Quantification and Storage: Quantify the extracted DNA using a spectrophotometer and store at -20°C until PCR amplification.
Primer Design and Real-Time PCR Amplification
This protocol targets a ~300 bp fragment of the SSU rRNA gene, a region suitable for HRM-based subtyping [44] [22].
Primer Sequences:
- Forward: 5'-CGAATGGCTCATTATATCAGTT-3'
- Reverse: 5'-AAGCTGATAGGGCAGAAACT-3' [10]
PCR Reaction Setup:
- Master Mix: Prepare a 20 µL reaction volume using a HOT FIREPol EvaGreen HRM Mix or similar SYBR Green-based mix.
- Components:
- 4.0 µL EvaGreen HRM Mix
- 10.2 µL DNase/RNase-free water
- 0.4 µL of each primer (10 µM each)
- 5.0 µL DNA template
- Include Controls: Always run a no-template control (NTC) with molecular grade water and positive controls (DNA from known Blastocystis subtypes, if available) in each run.
Real-Time PCR Cycling Conditions:
- Initial Denaturation: 95°C for 15 minutes
- Amplification (40 cycles):
- Denaturation: 95°C for 15 seconds
- Annealing: 60°C for 30 seconds
- Extension: 72°C for 30 seconds
- Data Acquisition: Acquire the SYBR Green signal at the end of each extension step.
High-Resolution Melting (HRM) Analysis
- Melting Curve Generation: Immediately after amplification, run the HRM step on the same instrument.
- Denaturation: 95°C for 1 minute
- Renaturation: 40°C for 1 minute
- Melting: Gradually increase the temperature from 60°C to 90°C, acquiring fluorescence data continuously at a high rate (e.g., 0.1°C per second).
- Data Analysis:
- Use the instrument's software to generate normalized and temperature-shifted difference plots from the raw melting curve data.
- Cluster the samples based on their distinct melting curve profiles.
- Assign subtypes by comparing the melting curves of unknown samples to those of the positive controls or established reference standards.
Workflow Visualization
The following diagram illustrates the complete experimental workflow for Blastocystis subtyping using HRM analysis.
The Scientist's Toolkit: Research Reagent Solutions
Table 3: Essential Reagents and Materials for HRM-based Subtyping
| Item | Function / Application | Example Product / Specification |
|---|---|---|
| DNA Extraction Kit | Isolation of high-quality genomic DNA from complex stool matrices. | QIAamp DNA Stool Mini Kit (Qiagen), FavorPrep Stool DNA Isolation Mini Kit (FavorGen) [10] [22] |
| SYBR Green HRM Master Mix | Contains all components (hot-start Taq polymerase, dNTPs, buffer, SYBR Green dye) for real-time PCR and subsequent HRM analysis in a pre-optimized mix. | HOT FIREPol EvaGreen HRM Mix (Solis BioDyne), Type-It HRM PCR Kit (Qiagen) [10] |
| SSU rRNA Primers | Specific amplification of the barcoding region of the Blastocystis SSU rRNA gene for subtype discrimination. | BL18SPPF1 (Fwd), BL18SR2PP (Rev) [22] |
| Optical Plates/Tubes | Ensure clear signal detection during real-time PCR and HRM; must be compatible with the real-time PCR instrument. | White-walled 96-well plates or 0.1 mL strip tubes with optical seals. |
| Positive Control DNA | Validates the entire workflow; consists of DNA from confirmed Blastocystis subtypes (e.g., ST1, ST3). | Cultured Blastocystis cells or cloned plasmid DNA from reference strains [44] [45] |
| Automated Extraction System (Optional) | Increases throughput, reproducibility, and minimizes cross-contamination during DNA extraction. | QIAcube (Qiagen) [22] |
This application note establishes that SYBR Green-based HRM analysis is a robust, efficient, and accessible molecular tool for the detection and subtyping of Blastocystis sp. Its ability to discriminate between subtypes and even identify intrasubtype variations directly after amplification makes it an indispensable method for large-scale epidemiological studies, zoonotic transmission tracking, and routine laboratory diagnostics, effectively supporting the objectives of a thesis focused on advancing SYBR Green real-time PCR protocols.
Enhancing Assay Performance: Tackling Sensitivity, Specificity, and Subtype Biases
The application of SYBR Green real-time PCR for the molecular subtyping of Blastocystis sp. represents a significant advancement in understanding the epidemiology and host specificity of this common gut protozoan. However, the accuracy of this sensitive molecular technique is frequently compromised when analyzing complex stool samples, which are replete with PCR inhibitors. These inhibitors include complex polysaccharides, bilirubin, bile salts, and various metabolic byproducts that co-extract with nucleic acids and interfere with the polymerase chain reaction [47]. Such substances can sequester essential reaction components, degrade enzymes, or interfere with the polymerase's active site, leading to false-negative results or a significant decrease in detection sensitivity [48] [47]. For Blastocystis researchers, this is particularly problematic as it can lead to an underestimation of subtype prevalence and diversity, thereby skewing epidemiological data and hampering investigations into the potential pathogenicity or commensal relationships of different subtypes.
The critical importance of detecting and overcoming PCR inhibition is highlighted by studies reporting that 32.6% of stool samples can exhibit inhibition severe enough to prevent amplification without appropriate sample treatment [48]. Furthermore, inhibitor-resistant PCR reagents have demonstrated variable efficacy across different sample matrices, with no single chemistry performing optimally across all sample types [47]. This application note provides detailed strategies and validated protocols to overcome PCR inhibition specifically in the context of SYBR Green real-time PCR-based Blastocystis subtyping research, ensuring reliable and reproducible results.
Understanding Inhibition and Its Impact on Blastocystis Research
Common Inhibitors in Stool Samples
Stool samples represent one of the most challenging matrices for molecular diagnostics due to their complex composition. The primary inhibitors found in human and animal feces include:
- Complex polysaccharides: Co-precipitate with DNA during extraction and inhibit polymerase activity.
- Bile salts: Disrupt the formation of the primer-template complex.
- Heme and its derivatives: Interfere with the polymerase's active site.
- Proteases: Can degrade the DNA polymerase enzyme essential for amplification.
- Bilirubin: Known to inhibit PCR at very low concentrations [47].
The presence and concentration of these inhibitors can vary significantly based on the host's diet, health status, and the specific stool collection methods employed, introducing substantial variability into the analytical process.
Consequences for Blastocystis Subtyping
The impact of uninhibited PCR on Blastocystis research is profound. Inhibition can lead to:
- Reduced Sensitivity: Diminished ability to detect low-abundance subtypes, resulting in inaccurate prevalence data.
- False-Negative Results: Complete amplification failure for samples with low parasitic load.
- Inaccurate Melting Temperature (Tm) Analysis: Altered Tm values in SYBR Green-based assays can lead to misidentification of subtypes.
- Compromised Subtype Discrimination: High-resolution melting (HRM) analysis, increasingly used for Blastocystis subtyping, is particularly vulnerable to inhibition-induced profile changes [10].
Studies have shown that melting temperature reproducibility can be significantly affected by inhibition, with standard errors of measurement for Tm values reaching up to 0.354°C in the presence of inhibitors, potentially confounding subtype discrimination [48].
Quantitative Assessment of Inhibition Challenges
Table 1: Documented PCR Inhibition Rates in Stool Samples Across Studies
| Study Focus | Inhibition Rate in Native Stools | Primary Detection Method | Reference |
|---|---|---|---|
| Norovirus Detection | 32.6% (28/86 samples) | SYBR Green RT-PCR | [48] |
| mcr-1 Gene Detection | 33.3% (1/3 positive samples missed without enrichment) | SYBR Green RT-PCR | [49] |
| Francisella tularensis Detection | Variable inhibition requiring specialized reagents | TaqMan PCR | [47] |
Table 2: Efficacy of Different Inhibition Mitigation Strategies in Stool Samples
| Mitigation Strategy | Reported Efficacy | Limitations | Best Use Case |
|---|---|---|---|
| 10-Fold Dilution of Template | Resolved inhibition in 100% of affected samples (28/28) | Reduces template concentration; may affect sensitivity | High template abundance samples |
| Bovine Serum Albumin (BSA) Addition | Resolved inhibition in 85.7% of samples (24/28) | Inconsistent performance across sample types | Mild to moderate inhibition |
| Selective Broth Enrichment | Increased detection rate to 100% for mcr-1 targets [49] | Adds 24-48 hours to protocol; may alter original microbial composition | Low-abundance targets |
| Inhibitor-Resistant Polymerase chemistries | Variable across matrices; KAPA Blood PCR showed most consistency [47] | Higher cost; may require protocol optimization | High-throughput screening |
Recommended Protocols for Overcoming Inhibition
Internal Control-Based SYBR Green RT-PCR with Melting Curve Analysis
The incorporation of an internal control is fundamental for distinguishing true target negatives from inhibition-induced false negatives. The following protocol has been adapted from a norovirus detection method and optimized for Blastocystis subtyping applications [48].
Reagents and Equipment:
- HOT FIREPol EvaGreen HRM Mix (or equivalent SYBR Green master mix)
- Blastocystis-specific primers (e.g., targeting SSU rRNA gene)
- Foreign RNA internal control (non-competitive with target)
- One-step RT-PCR equipment with melting curve capability
- DNA/RNA-free water
Protocol Steps:
- Internal Control Design: Prepare an internal control RNA sequence that is amplified by the same primers as the Blastocystis target but yields an amplicon with a distinct melting temperature (approximately 3°C lower than the target amplicon) [48].
- Reaction Setup: In a 25 μL reaction volume, combine:
- 1x HOT FIREPol EvaGreen HRM Mix
- 400 nM forward and reverse primers
- 3.8 × 10⁻⁵ ng internal RNA control (approximately 117,500 copies) [48]
- 2-5 μL of extracted sample DNA
- DNA/RNA-free water to volume
- Thermal Cycling Conditions:
- Reverse transcription: 50°C for 15-30 minutes
- Initial denaturation: 95°C for 10 minutes
- 40-45 cycles of:
- Denaturation: 95°C for 15 seconds
- Annealing: 55-60°C for 30 seconds
- Extension: 72°C for 30 seconds
- Melting curve analysis: 65°C to 95°C with continuous fluorescence monitoring
- Interpretation:
- Positive for Blastocystis: Peak at expected Tm (e.g., 85-88°C)
- Internal control: Peak at lower Tm (e.g., 81.5°C)
- Inhibition: Absence of both peaks
- Partial inhibition: Increased Ct value for internal control compared to control reactions
This method's validation demonstrated a high level of agreement (Kappa value: 0.90) with conventional RT-PCR while offering superior sensitivity and built-in inhibition detection [48].
Sample Pre-treatment and Dilution Approach
When internal controls indicate inhibition, a simple 10-fold dilution of the extracted DNA template has proven highly effective.
Validation Data: In a comprehensive evaluation, a 10-fold dilution successfully resolved inhibition in all 28 stool samples that initially showed complete amplification failure, outperforming BSA addition which failed in 4 of the 28 samples [48].
Optimized Dilution Protocol:
- Quantify extracted DNA using fluorometric methods.
- Prepare a 1:10 dilution of the DNA extract in DNAse-free water or elution buffer.
- Test both undiluted and diluted samples in parallel SYBR Green RT-PCR reactions.
- Include appropriate positive and negative controls with each run.
- For quantitative applications, apply a correction factor of 10x to account for the dilution.
Advantages: This approach is simple, cost-effective, and does not require additional reagents. It works by reducing the concentration of inhibitors below their interference threshold while often retaining sufficient target DNA for detection, particularly with the enhanced sensitivity of real-time PCR.
Selective Broth Enrichment for Enhanced Detection
For samples with low parasitic load or persistent inhibition, selective broth enrichment prior to DNA extraction can significantly improve detection rates.
Protocol Adapted from mcr-1 Detection Studies [49]:
- Enrichment Medium Preparation: Prepare Luria-Bertani (LB) broth or a specialized parasitic culture medium supplemented with antibiotics to suppress bacterial overgrowth.
- Sample Processing:
- Emulsify 100-200 mg of stool sample in 1 mL of enrichment broth.
- Incubate at 37°C for 24-48 hours to allow propagation of Blastocystis cells.
- DNA Extraction: Following enrichment, concentrate the culture by centrifugation and extract DNA using a commercial stool DNA isolation kit.
- Downstream Application: Use the extracted DNA in the SYBR Green RT-PCR protocol described in section 4.1.
Efficacy: This approach increased detection sensitivity from 66.7% (2/3 positive samples) to 100% (3/3 positive samples) for mcr-1 genes in human stool samples and is expected to provide similar benefits for Blastocystis detection [49]. The enrichment step simultaneously dilutes inhibitors and increases the target nucleic acid concentration, thereby improving the signal-to-noise ratio in subsequent PCR reactions.
The Scientist's Toolkit: Essential Reagents and Materials
Table 3: Research Reagent Solutions for Inhibition-Resistant Blastocystis PCR
| Reagent/Material | Function | Specific Application Notes |
|---|---|---|
| HOT FIREPol EvaGreen HRM Mix | Fluorescent DNA binding dye for real-time PCR and melting curve analysis | Enables high-resolution melting analysis for subtype discrimination [10] |
| Phire Hot Start DNA Polymerase with STR Boost | Inhibitor-resistant polymerase formulation | Effective for direct amplification from complex samples [47] |
| Bovine Serum Albumin (BSA) | Additive that binds inhibitors | Use at 0.1-0.5 μg/μL final concentration; effective for mild inhibition |
| FavorPrep Stool DNA Isolation Kit | Optimized nucleic acid extraction | Includes inhibitor removal steps; validated for parasitic DNA isolation [10] |
| Locked Nucleic Acid (LNA) dT Blockers | Prevents non-specific amplification | Use at 250 ng/reaction to improve specificity in complex samples [50] |
| Custom RNA Internal Control | Inhibition detection | Must produce distinct Tm from target; validates reaction integrity [48] |
Workflow Visualization and Strategic Implementation
The following workflow diagram illustrates the integrated approach to managing PCR inhibition in Blastocystis subtyping research:
Diagram 1: Comprehensive workflow for addressing PCR inhibition in Blastocystis research
Successful Blastocystis subtyping using SYBR Green real-time PCR in stool samples requires a systematic approach to identify and overcome PCR inhibition. Based on current evidence, the following strategic recommendations are provided:
Implement Internal Controls Routinely: The incorporation of a non-competitive internal control with distinct melting temperature provides the most reliable method for detecting inhibition and should be included in all diagnostic and research assays [48].
Adopt a Hierarchical Approach to Inhibition Management: Begin with a 10-fold dilution of template DNA as a first-line intervention, as this method resolved inhibition in 100% of cases in validation studies and is both simple and cost-effective [48].
Reserve Enrichment Protocols for Challenging Samples: For samples with low parasitic load or when dilution approaches fail, selective broth enrichment provides a powerful method to enhance detection sensitivity while simultaneously mitigating inhibition [49].
Validate Any Protocol Changes: When implementing inhibitor-resistant polymerases or other specialized reagents, thorough validation against known positive and negative samples is essential to ensure maintained sensitivity and specificity [47].
Leverage Melting Curve Analysis for Quality Control: The melting temperature not only provides subtype discrimination capability but also serves as a quality indicator; significant deviations from expected Tm values may indicate residual inhibition or other reaction abnormalities [48] [10].
The strategies outlined in this application note provide a comprehensive framework for obtaining reliable, reproducible results in SYBR Green real-time PCR-based Blastocystis subtyping, ultimately enhancing the quality of epidemiological and clinical research on this intriguing gut microeukaryote.
Blastocystis is a common gut protist colonizing over a billion people worldwide, with significant genetic diversity classified into subtypes (STs) based on small subunit ribosomal RNA (SSU rRNA) gene analysis [51] [3] [52]. Among the numerous subtypes identified, ST1-ST4 represent the majority of human cases, yet their detection efficiency varies considerably across molecular assays [51] [10]. The challenge of consistent subtype detection is particularly pronounced for ST4, which demonstrates remarkable geographical variation in prevalence and often evades amplification in conventional PCR systems [51] [52]. Furthermore, rare subtypes beyond the dominant ST1-ST4 present additional amplification hurdles due to sequence polymorphisms in primer binding regions [53] [10].
The epidemiological significance of accurate ST4 detection is underscored by growing evidence of its potential beneficial role in gut health. Recent research suggests Blastocystis ST4 colonization is associated with protective immune responses and modulation of gut microbiome composition [54]. ST4 has demonstrated the ability to alter microbial communities, promote T helper 2 (Th2) and T regulatory (Treg) responses, and accelerate recovery in experimental colitis models [54]. These findings highlight the critical need for reliable detection methods that can accurately capture the prevalence and distribution of ST4 and rare subtypes in human, animal, and environmental samples [3].
This application note establishes a optimized SYBR Green real-time PCR framework for comprehensive Blastocystis subtyping, addressing the specific amplification challenges of ST4 and rare subtypes through primer refinement, reaction optimization, and advanced melt curve analysis.
Experimental Protocols for Enhanced Subtype Detection
Primer Design and Validation Strategy
Subtype-Specific Primer Development:
- Sequence Selection: Download SSU rDNA Blastocystis subtype sequence data from public databases such as PubMLST . Perform multiple sequence alignment using tools like ClustalW implemented in BioEdit to identify conserved regions within subtypes and variable regions between subtypes [53].
- ST4-Targeted Primers: Design primers specifically targeting the 5' end of the SSU rRNA locus for ST4. The primers must be validated against other subtypes to ensure specificity [53]. For broader detection, use previously published universal Blastocystis primers: forward 5'-CGAATGGCTCATTATATCAGTT-3' and reverse 5'-AAGCTGATAGGGCAGAAACT-3' [10].
- Validation Workflow: Test primer specificity using DNA from confirmed ST1-ST4 cultures. Include negative controls without template and positive controls for each subtype. Verify amplification products through sequencing and melt curve analysis [53] [10].
Table 1: Primer Sequences for Blastocystis Subtype Detection
| Target | Primer Name | Sequence (5' to 3') | Product Size | Specificity |
|---|---|---|---|---|
| Universal Blastocystis | BhRDr_F | CGAATGGCTCATTATATCAGTT | ~500 bp | All subtypes [10] |
| Universal Blastocystis | BhRDr_R | AAGCTGATAGGGCAGAAACT | ~500 bp | All subtypes [10] |
| ST4-specific | STS4_F | GTCTTTCCCTGTCTATTCTGCA | 487 bp | ST4 [53] |
| ST4-specific | STS4_R | AATTCGGTCTGCTTCTTCTG | 487 bp | ST4 [53] |
Optimized SYBR Green qPCR Protocol
Reaction Setup:
- Master Mix Preparation: Prepare reactions using HOT FIREPol EvaGreen HRM Mix or SsoAdvanced Universal SYBR Green Supermix [54] [10]. Each 20 μL reaction should contain: 1X HRM mix, 0.3-0.5 μM of each primer, and 2-4 μL of template DNA.
- Thermal Cycling Conditions: Optimize cycling parameters as follows: initial denaturation at 95°C for 5-10 minutes; 45 cycles of 95°C for 15 seconds, 55-60°C for 30 seconds, and 72°C for 15-30 seconds [55] [54]. Include a melt curve stage with continuous fluorescence measurement from 65°C to 95°C with 0.2°C increments.
- Quality Control: Include non-template controls (NTC) to detect primer-dimer formation or contamination. Use positive controls for each subtype when available. Perform all reactions in triplicate to ensure reproducibility [55] [56].
qPCR Data Collection and Analysis:
- Threshold Setting: Set the threshold in the linear phase of the amplification plot where PCR efficiency is optimal [56]. Use the instrument's software to determine Cq (quantification cycle) values.
- Standard Curve Generation: For absolute quantification, prepare a 5-log dilution series of known template DNA (10^1 to 10^5 copies/μL) to generate a standard curve. The efficiency (E) can be calculated from the slope of the standard curve using the formula: E = [10^(-1/slope)] - 1. Acceptable efficiency ranges from 90-110% [55] [56].
- Melt Curve Analysis: After amplification, perform high-resolution melting (HRM) analysis by gradually increasing temperature while monitoring fluorescence. Analyze the melting temperature (Tm) of generated amplicons using instrument software [10].
High-Resolution Melting (HRM) Analysis for Subtype Differentiation
HRM Protocol:
- Reaction Conditions: Use the same reaction components as standard SYBR Green qPCR but with HRM-compatible master mixes containing saturating DNA dyes [10].
- Data Normalization: Normalize fluorescence data by setting pre-melt and post-melt regions to 0% and 100% melted, respectively. This normalization allows direct comparison of curve shapes between samples.
- Difference Plot Generation: Generate difference plots by subtracting each sample curve from a reference curve (usually the most common subtype) to visualize subtle Tm differences between subtypes [10].
Table 2: Characteristic Melting Temperatures for Blastocystis Subtypes
| Subtype | Approximate Tm Range (°C) | Relative Prevalence in Humans | Notes |
|---|---|---|---|
| ST1 | 78.5-79.5 | High [52] | Often associated with IBS [10] |
| ST2 | 79.5-80.5 | High [52] | Linked to gastrointestinal symptoms [10] |
| ST3 | 80.5-81.5 | Highest [52] [10] | Most common subtype globally |
| ST4 | 81.5-82.5 | Variable [51] | Geographically restricted; beneficial potential [54] |
| ST5 | 77.5-78.5 | Rare [10] | Primarily found in pigs |
| ST7 | 82.5-83.5 | Rare [10] | Mainly detected in birds and domestic animals |
The Scientist's Toolkit: Research Reagent Solutions
Table 3: Essential Reagents for Blastocystis Subtyping Research
| Reagent/Category | Specific Examples | Function/Application | Optimization Notes |
|---|---|---|---|
| DNA Extraction Kits | QIAamp Fast DNA Stool Mini Kit, FavorPrep Stool DNA Isolation Mini Kit [54] [10] | Efficient DNA isolation from complex stool samples | Consistent yield is critical for reproducible Cq values |
| qPCR Master Mixes | SsoAdvanced Universal SYBR Green Supermix, HOT FIREPol EvaGreen HRM Mix [54] [10] | Provides enzymes, buffers, and detection chemistry for qPCR | HRM-optimized mixes essential for subtype discrimination |
| Passive Reference Dyes | ROX dye [55] [56] | Normalizes for well-to-well variations | Concentration must be optimized for each instrument platform |
| Primer Sets | Subtype-specific primers (Table 1), Universal Blastocystis primers [53] [10] | Target amplification of specific Blastocystis sequences | Validation against all subtypes prevents amplification bias |
| Positive Controls | Cultured Blastocystis subtypes (ST1-ST4) [51] [54] | Assay validation and run-to-run comparison | Maintain reference cultures in IMDM with 10% horse serum |
Workflow Visualization
Troubleshooting Variable Subtype Amplification
Addressing ST4 Amplification Failure:
- Primer Mismatch Evaluation: Analyze ST4 sequences for polymorphisms in primer binding regions. Redesign primers if conserved regions show variability across ST4 isolates [53]. Test multiple primer sets to identify the most reliable for ST4 detection.
- Annealing Temperature Optimization: Perform temperature gradient PCR (55-65°C) to identify optimal annealing conditions for ST4 amplification. ST4 may require different conditions than more common subtypes [53].
- Template Quality Assessment: Verify DNA integrity through gel electrophoresis and quantify using spectrophotometry (A260/A280 ratio of 1.8-2.0 indicates pure DNA) [55]. Poor template quality disproportionately affects rare subtype detection.
Enhancing Rare Subtype Detection:
- Nested PCR Approach: Implement a nested PCR protocol for samples with low parasite loads or rare subtypes. Use universal Blastocystis primers in the first round, followed by subtype-specific primers in the second round [53].
- Magnesium Concentration Adjustment: Optimize MgCl2 concentration (typically 3-6 mM) to improve amplification efficiency of rare subtypes [55]. Higher magnesium concentrations can enhance amplification of difficult templates but may reduce specificity.
- Inhibition Testing: Spike samples with known positive controls to identify PCR inhibition. Dilute template DNA or implement additional purification steps if inhibition is detected [55].
Data Analysis and Interpretation Guidelines
Melt Curve Analysis for Subtype Discrimination:
- Tm Calling: Determine the melting temperature (Tm) as the peak of the first derivative plot (-dF/dT). Compare sample Tm values to reference values established using control subtypes [10].
- Mixed Infection Detection: Identify samples with multiple melting peaks as potential mixed infections. For confirmation, clone PCR products and sequence multiple clones, or use subtype-specific PCR [53] [52].
- Normalization and Clustering: Use HRM software to normalize and cluster melt curves. Samples clustering separately from known subtypes may represent rare or novel subtypes requiring sequencing confirmation [10].
Quality Assessment Parameters:
- Amplification Efficiency: Calculate efficiency from standard curve slope. Ideal efficiency is 100% (slope = -3.32), with 90-110% considered acceptable [56].
- Precision Evaluation: Determine inter-assay and intra-assay variability through replicate measurements. Standard deviation ≤0.25 for Cq values enables reliable detection of 2-fold differences [56].
- Sensitivity Determination: Establish the limit of detection (LOD) using serial dilutions of positive controls. For absolute quantification, ensure the standard curve spans at least 5 orders of magnitude [56].
The optimized SYBR Green qPCR and HRM protocol presented here enables reliable detection of Blastocystis ST4 and rare subtypes, addressing a critical methodological gap in gut microbiome and parasitology research. The integration of subtype-specific primer design with advanced melt curve analysis creates a robust framework for comprehensive subtyping that can be implemented in most molecular laboratories.
Accurate detection of ST4 is particularly valuable for investigating its potential beneficial role in gut health, as suggested by recent studies showing association with protective immune responses and microbiome modulation [54]. Furthermore, this protocol supports the objectives of initiatives like the COST Action CA21105 "Blastocystis under One Health," which aims to standardize detection methodologies and understand subtype distribution across human, animal, and environmental reservoirs [3].
As research continues to elucidate the functional differences between Blastocystis subtypes, the methodological approach described here will facilitate larger-scale epidemiological studies and contribute to resolving the ongoing debate about Blastocystis' role in human health and disease.
Optimizing Primer Concentration and Annealing Temperature for Specific Melt Peaks
Within molecular parasitology research, precise differentiation of Blastocystis subtypes is crucial for understanding their potential pathogenicity and transmission patterns. This application note provides a detailed protocol for optimizing SYBR Green-based real-time PCR assays to generate specific melt peaks for accurate Blastocystis subtyping. We present systematic methodologies for primer concentration and annealing temperature optimization, alongside quality control measures to ensure assay specificity and reproducibility. These protocols enable researchers to distinguish between genetically similar subtypes through melt curve analysis, facilitating more reliable molecular epidemiological studies of this common gut protist.
SYBR Green chemistry provides an accessible, cost-effective method for quantitative PCR (qPCR) and genotyping applications, but its nonspecific binding characteristics necessitate rigorous optimization to ensure data accuracy. The dye fluoresces when bound to any double-stranded DNA, including primer dimers and non-specific amplification products, which can compromise results if not properly addressed [57]. For Blastocystis research, where genetic diversity encompasses at least 17 distinct subtypes (STs) with clinical relevance, assay specificity becomes paramount [11].
Melt curve analysis serves as an essential quality control step, enabling verification that fluorescence signals originate from specific target amplification rather than artifacts [57]. This technique gradually increases temperature after amplification, measuring fluorescence decrease as DNA denatures. The resulting melt curves, when converted to derivative plots, reveal peaks corresponding to specific amplicons with characteristic melting temperatures (Tm) [57]. Well-optimized assays produce single, sharp peaks indicating specific amplification, while multiple peaks, shoulders, or broad peaks suggest non-specific amplification or primer-dimer formation [57] [58].
Material and Methods
Research Reagent Solutions
The following table outlines essential reagents and materials required for implementing these protocols:
Table 1: Essential Research Reagents and Materials
| Item | Function/Application | Specifications |
|---|---|---|
| SYBR Green Master Mix | Fluorescent detection of amplified DNA | Includes optimized buffer, DNA polymerase, dNTPs, and SYBR Green dye |
| Blastocystis-specific Primers | Amplification of subtype-specific regions | Designed targeting SSU rDNA; 20-30 nucleotides; 30-70% GC content [11] [59] |
| Template DNA | Sample material for amplification | Fecal DNA extracts or cultured Blastocystis isolates [11] |
| qPCR Instrument | Amplification and fluorescence detection | Must include melt curve analysis capability |
| Agarose Gel Equipment | Post-amplification verification | Used to confirm single amplicon presence after optimization [57] |
Primer Design Considerations for Blastocystis Subtyping
Effective subtyping of Blastocystis requires primers targeting appropriate genetic regions with sufficient discriminatory power:
- Target Region: The small subunit (SSU) ribosomal DNA (rDNA) gene serves as the primary target due to its multiple copy number (ensuring high sensitivity) and established databases for subtype identification [11].
- Barcoding Approach: For comprehensive subtyping, the "barcoding" method using a forward primer with broad eukaryotic specificity (RD5) and a Blastocystis-specific reverse primer (BhRDr) amplifies approximately 600 bp of the 5'-end of the SSU rDNA gene [11]. This region provides sufficient sequence variation for reliable subtype discrimination through sequencing and melt curve analysis.
- Primer Design Rules:
Experimental Workflow for Assay Optimization
The following diagram illustrates the comprehensive optimization workflow from initial primer design through validated assay implementation:
Primer Concentration Optimization Protocol
Optimal primer concentration balances robust amplification with minimal primer-dimer formation:
- Prepare Reaction Master Mixes: Using a SYBR Green master mix, create separate master mixes with different primer concentration combinations.
- Concentration Matrix Design: Test three different concentrations (e.g., 300 nM, 500 nM, 800 nM) of both forward and reverse primers in a full factorial design, following the ranges recommended for your specific master mix [59].
- Amplification Conditions:
- Initial denaturation: 95°C for 2-10 minutes
- 40 cycles of:
- Denaturation: 95°C for 15-30 seconds
- Annealing: 60°C for 30-60 seconds (initial temperature)
- Extension: 72°C for 30-60 seconds
- Melt Curve Analysis:
- Temperature ramp from 60°C to 95°C
- Continuous fluorescence monitoring
- Data Analysis: Select primer concentrations yielding the lowest Ct (threshold cycle) value with a single, sharp melt peak.
Table 2: Primer Concentration Matrix Optimization Results
| Forward Primer (nM) | Reverse Primer (nM) | Ct Value | Melt Peak Profile | Recommended |
|---|---|---|---|---|
| 300 | 300 | 25.3 | Single sharp peak | Yes |
| 300 | 500 | 24.8 | Single sharp peak | Yes |
| 300 | 800 | 24.9 | Minor shoulder present | No |
| 500 | 300 | 24.7 | Single sharp peak | Yes |
| 500 | 500 | 24.5 | Single sharp peak | Optimal |
| 500 | 800 | 24.6 | Broad peak | No |
| 800 | 300 | 25.1 | Multiple peaks | No |
| 800 | 500 | 24.9 | Broad peak | No |
| 800 | 800 | 25.2 | Primer-dimer evident | No |
Annealing Temperature Optimization Protocol
Fine-tuning annealing temperature is critical for specific primer binding:
- Gradient PCR Setup: Using optimized primer concentrations, run parallel reactions across a temperature gradient (typically 55-65°C).
- Amplification Parameters: Maintain consistent cycle parameters except for the annealing temperature.
- Analysis Criteria: Evaluate reactions based on:
- Lowest Ct value indicating efficient amplification
- Single, sharp melt peak confirming specificity
- Highest fluorescence signal representing robust amplification
- Validation: Confirm specific amplification by agarose gel electrophoresis, visualizing a single band of expected size [57].
Table 3: Annealing Temperature Optimization Parameters
| Parameter | Evaluation Method | Optimal Outcome |
|---|---|---|
| Amplification Efficiency | Ct value analysis | Lowest Ct within linear range |
| Reaction Specificity | Melt curve analysis | Single, sharp peak |
| Product Uniformity | Agarose gel electrophoresis | Single band of expected size |
| Signal Intensity | End-point fluorescence | High fluorescence signal |
| Temperature Range | Gradient PCR | 55-65°C for most applications |
Troubleshooting Melt Curve Anomalies
Despite careful optimization, melt curves may display anomalies requiring intervention:
- Multiple Peaks: Indicates non-specific amplification or primer-dimer formation. Remedies include increasing annealing temperature, reducing primer concentration, or redesigning primers [57] [58].
- Shoulder Peaks: Suggest non-specific amplification or multiple products. Increase annealing temperature in 1-2°C increments or modify magnesium concentration.
- Broad Peaks: Often result from heterogeneous PCR products or asymmetric GC distribution. Verify primer specificity and consider redesign if issues persist [58].
- Unexpected Tm Shifts: Can indicate SNP presence in primer binding sites, particularly relevant for Blastocystis subtyping where genetic variation within STs can reach 3% [11].
For persistent issues, agarose gel electrophoresis provides confirmation of amplification specificity, showing a single band corresponding to the expected amplicon size [57].
Validation and Quality Control
PCR Efficiency Determination
Assay performance must be validated through efficiency calculations:
- Standard Curve Preparation: Serially dilute (1:10 or 1:2) DNA template across at least 5 orders of magnitude.
- Amplification: Run qPCR with optimized conditions for all dilution points.
- Efficiency Calculation: Using the formula ( E = 10^{(-1/slope)} - 1 ), where the slope is derived from the plot of Ct versus log template concentration.
- Acceptance Criteria: PCR efficiency of 90-110% (slope of -3.6 to -3.1) indicates a robust, optimized assay [59].
Blastocystis Subtyping Specific Considerations
For reliable subtyping, incorporate these specialized controls:
- Subtype Reference Controls: Include known Blastocystis subtype controls when available to validate melt peak consistency.
- Mixed ST Detection: Be aware that mixed ST infections can produce complex melt curves; sequencing validation is recommended for ambiguous results [11].
- Method Selection: Choose between STS primers or barcoding approaches based on research goals, noting that barcoding detects more subtypes while STS primers facilitate mixed ST identification [11].
Systematic optimization of primer concentration and annealing temperature is fundamental to generating specific melt peaks essential for reliable Blastocystis subtyping. The protocols detailed herein enable researchers to establish robust SYBR Green qPCR assays capable of distinguishing between genetically similar Blastocystis subtypes. Proper implementation of these methods, coupled with rigorous validation through efficiency measurements and melt curve analysis, ensures data quality and reproducibility in molecular epidemiological studies of this complex gut protist.
The molecular characterization of Blastocystis sp., a common gut protist with debated pathogenicity, relies heavily on identifying its numerous subtypes (STs). The genetic diversity of Blastocystis has significant implications for understanding its potential zoonotic transmission and clinical relevance [11]. While Sanger sequencing of the small subunit ribosomal RNA (SSU rRNA) gene is a common subtyping method, it often fails to detect mixed-subtype infections, as it typically reveals only the dominant subtype [17]. High-Resolution Melting (HRM) curve analysis, performed following SYBR Green-based real-time PCR, has emerged as a powerful, cost-effective, and rapid alternative. This Application Note details protocols for using HRM to identify and validate mixed subtype infections of Blastocystis within the context of SYBR Green real-time PCR protocols for subtyping research.
The principle of HRM analysis is based on the precise monitoring of the dissociation of double-stranded DNA amplicons as the temperature increases. Subtle differences in the DNA sequence—such as nucleotide composition, length, and GC content—between different Blastocystis subtypes result in amplicons with distinct melting temperatures ((T_m)) and characteristic curve shapes [60]. When a sample contains a single subtype, it typically produces a single, distinct melting peak. In contrast, a sample with a mixed infection can produce a complex, multi-phasic melting curve representing the combined profile of the different subtypes present [17]. This document provides a standardized workflow to interpret these complex signatures and confirm mixed infections.
Melting Curve Fundamentals and Blastocystis Subtyping
The Basis of Subtype Discrimination
The SSU rRNA gene is the standard genetic marker for Blastocystis subtyping. At least 44 subtypes have been described, with ST1-ST10 being the most common in humans and animals [61]. The HRM technique leverages sequence polymorphisms within this gene. The internal transcribed spacer (ITS) region, located between the 16S and 23S ribosomal DNA, has been shown to generate melt curves of greater complexity and a wider (T_m) range compared to 16S rDNA amplicons, thereby enhancing interspecies discrimination [60]. This makes it an excellent target for differentiating closely related organisms.
In a typical HRM analysis, a DNA intercalating dye is used to fluoresce during the PCR amplification. Following PCR, the amplicons are heated from a lower to a higher temperature (e.g., 65°C to 95°C). As the temperature passes the (T_m) of discrete domains within the amplicon, the DNA strands separate, and the fluorescence signal drops precipitously. The resulting data is presented as a melting curve, often shown as the negative derivative of fluorescence (F) over temperature (T) (-dF/dT versus T), which yields distinct peaks for each melting domain.
Challenges of Mixed Infections
Conventional Sanger sequencing is limited in detecting mixed infections because it produces a single consensus sequence, often from the most abundant subtype in the sample. This can lead to an underestimation of subtype diversity and misinterpretation of transmission dynamics. For instance, a study on shepherd dogs using SYBR Green qPCR and melting curve analysis revealed a high occurrence of Blastocystis and frequent mixed infections, a finding that was further confirmed by the superior resolution of targeted-amplicon Next-Generation Sequencing (NGS) [17]. This underscores the need for techniques like HRM as a screening tool to flag samples potentially containing multiple subtypes for further, more detailed analysis.
Experimental Workflow for HRM Analysis
The following section outlines the step-by-step protocol from sample collection through data interpretation for identifying mixed Blastocystis subtype infections.
Sample Collection and DNA Extraction
- Sample Source: Fresh stool samples from humans or animals are collected using sterile containers. Ethical approval and informed consent are mandatory for human samples [10].
- Storage: Stool aliquots should be stored at -20°C or -80°C prior to DNA extraction to preserve nucleic acid integrity.
- DNA Extraction: Use commercial kits designed for stool DNA isolation, such as the QIAamp DNA Stool Mini Kit (Qiagen) or the FavorPrep Stool DNA Isolation Mini Kit, following the manufacturer's instructions [10] [62]. Extract DNA from approximately 200 mg of stool sample and elute in a final volume of 50-200 µL. The quality and quantity of the extracted DNA can be assessed using a spectrophotometer or fluorometer.
SYBR Green qPCR and HRM Protocol
This protocol is adapted from established methods for Blastocystis detection and subtyping [10] [17].
- Primers: Use primers targeting a ~300 bp fragment of the Blastocystis SSU rRNA gene.
- Forward: 5'-CGAATGGCTCATTATATCAGTT-3'
- Reverse: 5'-AAGCTGATAGGGCAGAAACT-3' [10]
- Reaction Setup:
- Total Volume: 20 µL
- Master Mix: 10 µL of 2X HOT FIREPol EvaGreen HRM Mix (Solis BioDyne) or equivalent SYBR Green HRM master mix.
- Primers: 0.5 µM each of forward and reverse primer.
- Template DNA: 2-5 µL of extracted DNA.
- Nuclease-Free Water: To volume.
- qPCR Cycling Conditions:
- Initial Denaturation: 95°C for 15 minutes.
- Amplification (40 cycles):
- Denaturation: 95°C for 15 seconds.
- Annealing: 60°C for 30 seconds.
- Extension: 72°C for 30 seconds.
- HRM Analysis:
- After the final PCR cycle, heat the amplicons from 65°C to 95°C, increasing the temperature incrementally by 0.1-0.2°C per step with a continuous fluorescence acquisition.
Data Interpretation and Analysis
- Normalization: Use the instrument's software to normalize the raw melting curve data by setting pre- and post-melt regions.
- Difference Plot: Generate a difference plot by subtracting the curve of a chosen reference sample (e.g., a known ST3) from all other samples. This enhances visualization of subtle curve differences.
- Identifying Mixed Infections: Samples infected with a single subtype will cluster together and show a smooth, single-peak derivative curve. Samples with complex, multi-phasic curves that do not cluster with known reference subtypes are strong candidates for mixed infections [17]. Advanced analysis can employ machine learning algorithms trained on a library of known subtype melt curves for automated classification [60].
Validation of Mixed Infections
Suspected mixed infections identified by HRM must be confirmed using an orthogonal method.
- Targeted-Amplicon Next-Generation Sequencing (NGS): This is the gold-standard confirmatory method. Amplify the target region (SSU rRNA) with barcoded primers and sequence on a platform like Oxford Nanopore Technologies (ONT) or Illumina. This allows for the direct sequencing of thousands of individual amplicons, providing a quantitative profile of all subtypes present in the mixture [17].
- Cloning and Sanger Sequencing: The traditional method involves ligating the PCR amplicons into a plasmid vector, transforming bacteria, and then picking and sequencing multiple clones. The proportion of different subtypes among the sequenced clones reflects the mixture composition, though it is more labor-intensive and less quantitative than NGS.
Research Reagent Solutions
Table 1: Essential Reagents for Blastocystis HRM Subtyping
| Reagent/Material | Function | Example Product & Specification |
|---|---|---|
| DNA Extraction Kit | Isolation of high-quality genomic DNA from complex stool samples. | QIAamp DNA Stool Mini Kit (Qiagen); FavorPrep Stool DNA Isolation Mini Kit [10] [62]. |
| HRM Master Mix | Provides all components for qPCR and subsequent high-resolution melt analysis, including a saturating DNA dye. | HOT FIREPol EvaGreen HRM Mix (Solis BioDyne) [10]; Xpert Fast SYBR (Uni) Blue mix (GRiSP) [17]. |
| Oligonucleotide Primers | Specific amplification of the target SSU rRNA or ITS gene region for subtyping. | BL18SPPF1 (Fwd): 5'-CGAATGGCTCATTATATCAGTT-3' / BL18SR2PP (Rev): 5'-AAGCTGATAGGGCAGAAACT-3' [10] [17]. |
| Reference DNA Controls | Positive controls for known subtypes to establish a baseline HRM library and for run-to-run calibration. | DNA from cultured isolates or cloned plasmids of ST1-ST4, etc. [6] [11]. |
| NGS Kit (Validation) | For confirmatory analysis of mixed infections by deep sequencing. | ONT or Illumina library preparation kits for amplicon sequencing [17]. |
Expected Results and Data Presentation
Successful application of this protocol will yield a range of melting curves. The following table summarizes quantitative data from relevant studies to set expectations for subtype distribution and detection sensitivity.
Table 2: Blastocystis Subtype Distribution and Detection Sensitivity from Representative Studies
| Study Context | Prevalence | Common Subtypes Identified | Remarks on Mixed Infections & Sensitivity |
|---|---|---|---|
| Shepherd Dogs [17] | 60% (30/50) | ST1, ST2, ST3, ST4, ST14 | Targeted-amplicon NGS confirmed mixed infections and subtype diversity initially suggested by melting curve analysis. |
| Human & Animal Stools [10] | Not specified | ST3 (28%), ST7 (30%), ST2 (16%), ST1 (14%) | HRM was reported as an efficient and cost-effective method for subtype identification. |
| Asymptomatic Animals [61] | 5.0% (10/200) in cattle & camels | ST10 (identified in a camel) | Demonstrates the occurrence of less common subtypes in animal reservoirs. |
| qPCR vs. Culture [6] | qPCR as reference | ST4 (63% in cohort) | qPCR demonstrated superior sensitivity (100%) compared to culture (52%) and microscopy (29%). |
This Application Note establishes a clear framework for utilizing SYBR Green-based HRM analysis as a robust screening tool for detecting mixed Blastocystis subtype infections. The protocol—from DNA extraction to the interpretation of complex melting curves—provides researchers with a method that is more accessible and faster than sequencing for initial screening. By flagging samples with complex melting profiles for subsequent validation with targeted NGS, researchers can achieve a more accurate and comprehensive understanding of Blastocystis subtype diversity, co-colonization patterns, and zoonotic transmission, thereby enriching the findings of their subtyping research.
Within Blastocystis research, the accurate identification of subtypes (STs) is crucial for understanding its pathogenicity, zoonotic potential, and epidemiology. SYBR Green-based real-time PCR followed by High-Resolution Melting (HRM) analysis has emerged as a powerful, cost-effective tool for subtyping [10]. However, the reproducibility and accuracy of this method are entirely dependent on the implementation of a stringent framework of controls and standards. This protocol details the essential controls and analytical standards required to ensure reliable and comparable Blastocystis subtype calling, forming the bedrock of robust research within a broader thesis on SYBR Green methodologies.
The Critical Role of Controls in HRM Analysis
High-Resolution Melting analysis differentiates Blastocystis subtypes based on the unique melting temperature ((T_m)) and curve profile of the amplified DNA fragment, which is determined by its GC content, length, and sequence [10]. Without proper controls, several factors can compromise results.
Table 1: Essential Control Types for Blastocystis Subtyping by SYBR Green HRM
| Control Type | Purpose | Preparation & Usage | Interpretation of Results |
|---|---|---|---|
| No-Template Control (NTC) | Detects contamination from reagents or the environment. | Includes all reaction components except the DNA template. | A melting curve in the NTC indicates contaminating DNA or primer-dimer formation, invalidating the run. |
| Positive Subtype Controls | Serves as a reference for the expected (T_m) and curve shape for specific subtypes (e.g., ST1-ST4, ST7). | Plasmid DNA or characterized gDNA from known Blastocystis subtypes. | Normalizes sample data to these references, enabling accurate subtype calling by direct comparison. |
| Negative Biological Control | Confirms the absence of non-specific amplification from host or microbial DNA. | DNA extracted from a Blastocystis-negative stool sample. | A melting curve suggests non-specific binding; primer sequences and reaction conditions must be re-optimized. |
| Internal Amplification Control (IAC) | Distinguishes true negative results from PCR failure due to inhibition. | A non-competitive synthetic DNA sequence spiked into each reaction. | Failure of the IAC to amplify indicates PCR inhibition in the sample, requiring dilution or re-extraction. |
A Standardized Workflow for Accurate Subtyping
The following workflow, from sample collection to data analysis, is designed to integrate the necessary controls and ensure reliable subtyping.
Detailed Experimental Protocol
3.1.1 DNA Extraction and Quality Control
- Sample Preparation: Stool samples can be examined by direct microscopy and/or cultured to enhance detection before DNA extraction [10].
- DNA Extraction: Use commercial kits designed for stool samples, such as the FavorPrep Stool DNA Isolation Mini Kit [10].
- Procedure: Homogenize 180-220 mg of stool sample. Include bead-beating steps for thorough cell lysis. Elute DNA in 50-200 µL of elution buffer.
- Quality Control: Quantify DNA using a spectrophotometer (e.g., Nanodrop). Acceptable samples have an A260/A280 ratio between 1.8 and 2.0. Store extracted DNA at -20 °C or below.
3.1.2 SYBR Green qPCR and HRM Reaction Setup This protocol is adapted from a 2025 study on Blastocystis detection and subtyping [10].
- Primers: Use primers targeting the small subunit ribosomal RNA (SSU rRNA) gene.
- Forward:
5′-CGAATGGCTCATTATATCAGTT-3′ - Reverse:
5′-AAGCTGATAGGGCAGAAACT-3′[10]
- Forward:
- Reaction Mix (20 µL total volume):
- Component & Volume/Final Concentration:
- HOT FIREPol EvaGreen HRM Mix (Solis BioDyne): 4 µL
- Forward Primer (10 µM): 0.6 µL (0.3 µM final)
- Reverse Primer (10 µM): 0.6 µL (0.3 µM final)
- DNA Template: 2-5 µL (or up to 20-100 ng)
- DNase/RNase-free water: to 20 µL
- Component & Volume/Final Concentration:
- Cycling Conditions (One-Step RT-PCR if starting from RNA):
- Step & Temperature & Time:
- Initial Denaturation: 95°C - 10-15 min
- 40-45 Cycles of:
- Denaturation: 95°C - 15 s
- Annealing/Extension: 60°C - 20-60 s
- Step & Temperature & Time:
- HRM Analysis:
- Immediately follow the final PCR cycle with a melting curve program.
- Steps: Denature at 95°C for 15 s, cool to 65°C, then gradually increase temperature (e.g., 0.1-0.2°C/s) to 95°C while continuously monitoring fluorescence.
Data Analysis and Interpretation
Following HRM, data analysis is a multi-step process:
- Normalization: Pre-process the raw melting curve data by selecting linear regions before and after the main fluorescence drop to normalize the curves. This corrects for concentration-dependent signal shifts.
- Difference Plot: Generate a difference plot by subtracting the fluorescence of each sample curve from a reference curve (often a positive control or a selected sample). This magnifies subtle differences between subtypes, making them easier to distinguish.
- Clustering and Calling: Cluster samples based on the similarity of their normalized and difference curves. Subtype calling is performed by comparing the cluster of an unknown sample to the clusters formed by the positive subtype controls included in the same run.
Table 2: Key Quantitative Parameters from Validated SYBR Green HRM for Blastocystis
| Parameter | Typical Value / Outcome | Importance for Reproducibility |
|---|---|---|
| PCR Amplification Efficiency | 90-105% | Reactions with efficiencies outside this range can skew (Cq) and (Tm) values, affecting quantification and subtype discrimination. |
| Coefficient of Determination (R²) | >0.990 | Indicates a highly linear standard curve, essential for reliable quantification of template copy number. |
| Intra-assay Repeatability | Low CV (%)(e.g., < 0.1% for (T_m)) | Measures precision when the same sample is run multiple times on the same plate. Low variation is key for consistent calling. |
| Inter-assay Reproducibility | Low CV (%)(e.g., < 0.2% for (T_m)) | Measures precision across different runs, days, and operators. Critical for data comparability in long-term studies. |
| Limit of Detection (LoD) | ~10-100 copies/reaction [63] | Defines the lowest subtype concentration that can be reliably detected and is crucial for analyzing low-shedding cases. |
The Scientist's Toolkit: Research Reagent Solutions
Table 3: Essential Reagents and Materials for Blastocystis SYBR Green HRM
| Item | Function | Example & Notes |
|---|---|---|
| DNA Extraction Kit | Isolates high-quality, inhibitor-free DNA from complex stool matrices. | FavorPrep Stool DNA Isolation Mini Kit. Includes inhibitors removal steps crucial for stool samples. |
| SYBR Green HRM Master Mix | Provides all components for efficient qPCR and high-fidelity melting curve analysis. | HOT FIREPol EvaGreen HRM Mix. Contains a robust DNA polymerase and a saturating dye ideal for HRM. |
| Subtype-Specific Positive Controls | Serves as reference material for accurate subtype identification via (T_m). | Plasmids or gDNA for ST1-ST4, ST7. Should be sequence-verified. Sourced from biorepositories or in-house isolates. |
| Validated Primers | Amplifies a variable region of the SSU rRNA gene for subtype discrimination. | SSU rRNA primers [10]. Must be aliquoted to prevent degradation and tested for specificity. |
| Non-Template Control | Monitors for contaminating DNA in reagents or the environment. | Molecular Biology Grade Water. Used in the NTC well. |
| Internal Amplification Control | Identifies PCR inhibition in individual samples. | Exogenous Synthetic DNA. A non-competitive template with a distinct (T_m) spiked into each reaction. |
The path to conclusive Blastocystis research hinges on data integrity. The consistent application of the controls, standards, and protocols outlined here ensures that subtype calling via SYBR Green HRM is not only accurate within a single experiment but also reproducible across different laboratories and over time. This rigorous framework minimizes false positives and negatives, clarifies ambiguous results, and ultimately generates high-quality data that can be confidently used to unravel the complex biology and epidemiology of Blastocystis sp.
Assay Validation and Comparative Analysis: Establishing a Robust Diagnostic Tool
Determining Analytical Sensitivity and Specificity Against a Sequencing Gold Standard
Blastocystis sp. is a common intestinal protist with a global distribution, whose clinical significance remains a subject of ongoing research [6] [64]. Accurate detection and subtyping are essential for understanding its epidemiology and potential pathogenicity. Molecular diagnostics, particularly real-time PCR (qPCR), have surpassed traditional microscopy and culture in sensitivity, but require rigorous validation against a gold standard [6] [18]. This protocol details the methodology for establishing the analytical sensitivity and specificity of a SYBR Green qPCR assay for Blastocystis subtyping by comparison to direct sequencing.
Evaluation of diagnostic accuracy requires comparison against a robust reference. Sequencing of the small subunit ribosomal RNA (SSU rRNA) gene provides definitive subtype identification and is widely accepted as the gold standard [21] [65]. The table below summarizes the performance of various molecular methods as reported in recent studies.
Table 1: Comparative Performance of Blastocystis Detection Methods Against Sequencing
| Method | Sensitivity | Specificity | Key Findings | Citation |
|---|---|---|---|---|
| SYBR Green qPCR | 96.3% | 100% | High concordance with sequencing; enables parasite load quantification. | [65] |
| TaqMan Probe qPCR | 29% prevalence (vs 24% for cPCR) | 100% | Significantly more sensitive than conventional PCR (p < 0.05). | [18] |
| Commercial Multiplex PCR | 84% | 82% | High sensitivity but lower specificity; potential for false positives. | [21] |
| Conventional PCR | 79% (vs qPCR) | N/R | Lower sensitivity compared to qPCR methods. | [66] |
| Microscopy | 29% (vs qPCR) | N/R | Poor sensitivity, greatly underestimates prevalence. | [6] |
The data consistently demonstrate the superior sensitivity of qPCR-based methods over conventional PCR and microscopic examination [6] [18]. Furthermore, next-generation sequencing (NGS) offers an advantage over Sanger sequencing by more effectively identifying mixed-subtype infections [18].
Experimental Protocol for Assay Validation
This section provides a detailed workflow for validating a SYBR Green qPCR assay for Blastocystis.
Sample Preparation and DNA Extraction
- Sample Collection: Collect approximately 200 mg of fresh stool specimen in a clean, sterile container. For swab-based collection systems, follow the manufacturer's instructions, such as using a flocked nylon swab placed in transport medium [21].
- DNA Extraction:
- Use a commercial DNA extraction kit designed for stool samples (e.g., QIAamp DNA Stool Minikit, Bioline Fecal DNA Isolation Kit) [6] [64].
- Include a bead-beating step (e.g., 30 m/s for 3 minutes) during lysis to ensure efficient disruption of Blastocystis cysts [21].
- Manual extraction methods have been shown to yield significantly higher DNA recovery and detection rates for low-parasite-load samples compared to automated platforms [21].
- Elute DNA in a final volume of 50-200 µL of elution buffer [10] [64].
SYBR Green qPCR Assay
- Primer Design: Target a partial sequence (~300-450 bp) of the Blastocystis SSU rRNA gene. This region contains sufficient variation for subtyping via subsequent sequencing of the qPCR product [6] [10].
- Reaction Setup:
- Total Volume: 20 µL [10].
- Reaction Mix: 4 µL HOT FIREPol EvaGreen HRM Mix (or equivalent SYBR Green master mix), 10.2 µL DNase/RNase-free water, 1-2 µL of each forward and reverse primer (final concentration 0.5 µM each), and 2-4 µL of template DNA [10].
- Controls: Include a negative control (nuclease-free water) and positive controls comprising DNA from known Blastocystis subtypes (ST1-ST4, if available) in each run [6] [64].
- Cycling Conditions:
- Initial denaturation: 95°C for 10-15 minutes.
- 40 cycles of:
- Denaturation: 95°C for 15 seconds.
- Annealing: 60-65°C for 10-30 seconds.
- Extension: 72°C for 20-30 seconds.
- Melting Curve Analysis: Perform after amplification with a temperature gradient from 65°C to 95°C, increasing by 0.5°C each step [10] [64].
Gold Standard Sequencing and Subtyping
- Purification: Purify qPCR amplicons using a commercial PCR clean-up kit (e.g., NucleoSpin extract kit) [21].
- Sequencing: Sequence the purified products using Sanger sequencing with the same primers used for qPCR [65]. For higher resolution and detection of mixed infections, employ next-generation sequencing (NGS) [18] [33].
- Subtype Assignment: Analyze the obtained sequences using the Basic Local Alignment Search Tool (BLAST) against the National Center for Biotechnology Information (NCBI) database. Subtypes are assigned with a query coverage and identity typically >98% compared to reference sequences [21] [65].
Data Analysis for Sensitivity and Specificity
- Define Results: A sample is considered a "true positive" if it yields a confirmatory Blastocystis sequence. A "false positive" is a sample positive by qPCR but negative by sequencing. A "false negative" is a sample negative by qPCR but positive by sequencing [21].
- Calculate Metrics:
- Sensitivity = [True Positives / (True Positives + False Negatives)] x 100
- Specificity = [True Negatives / (True Negatives + False Positives)] x 100
- Use statistical software to compute these values and generate confidence intervals.
The following workflow diagram summarizes the key steps in the validation process:
The Scientist's Toolkit: Essential Research Reagents
Table 2: Key Reagents and Materials for Blastocystis qPCR and Subtyping
| Item | Function/Application | Example Products / Notes |
|---|---|---|
| DNA Extraction Kit | Isolation of high-quality genomic DNA from complex stool matrices. | QIAamp DNA Stool Minikit (Qiagen), Bioline Fecal DNA Isolation Kit. Manual extraction is superior for low parasite loads [6] [21] [64]. |
| SYBR Green Master Mix | Fluorescent detection of amplified DNA in real-time PCR; enables melt curve analysis. | HOT FIREPol EvaGreen HRM Mix (Solis BioDyne) [10]. |
| SSU rRNA Primers | Amplification of a Blastocystis-specific genetic target for detection and subtyping. | BL18SPPF1 (5'-AGTAGTCATACGCTCGTCTCAAA-3') and BL18SR2PP (5'-TCTTCGTTACCCGTTACTGC-3') [64]. |
| Positive Control DNA | Verification of PCR efficiency and specificity; serves as a run control. | DNA from reference strains (ST1-ST4) or previously sequenced clinical isolates [6] [21]. |
| PCR Purification Kit | Purification of amplicons prior to sequencing to remove primers and dNTPs. | NucleoSpin Gel and PCR Clean-up kit (Macherey-Nagel) [21]. |
| Sequencing Service/Platform | Determination of nucleotide sequence for definitive subtype identification. | Sanger sequencing (for dominant subtypes); NGS (e.g., Illumina MiSeq) for detecting mixed infections [18] [33]. |
Within the field of molecular parasitology, the accurate detection and subtyping of Blastocystis is crucial for understanding its genetic diversity and potential clinical significance. This application note provides a comparative performance benchmark for SYBR Green real-time quantitative PCR (qPCR) against conventional PCR and commercial multiplex kits, specifically within the context of Blastocystis subtyping research. The data summarized herein demonstrate that a SYBR Green-based approach offers an optimal balance of sensitivity, specificity, and cost-effectiveness, making it a powerful tool for large-scale molecular epidemiological studies.
Performance Benchmarking: A Comparative Analysis
To objectively evaluate the performance of different PCR methodologies, key analytical parameters were compared. The following table summarizes quantitative data from various studies, highlighting the relative strengths and weaknesses of each technique.
Table 1: Comparative Performance of PCR Methodologies for Pathogen Detection
| Methodology | Target Organism | Sensitivity / Detection Limit | Specificity | Key Performance Findings | Citation |
|---|---|---|---|---|---|
| SYBR Green qPCR | Blastocystis spp. | Far superior to microscopy and xenic culture (29% and 52% sensitivity respectively, compared to qPCR). | High (allows subtyping by sequencing). | Proved to be the most sensitive method for detection in stool samples. | [6] |
| SYBR Green qPCR | Infectious Bronchitis Virus (IBV) | 100 cDNA copies/µL (10x more sensitive than conventional gel-based RT-PCR). | 100% (distinguished from other avian pathogens). | Melt peak at 68 ± 0.20 °C confirmed assay specificity. | [67] |
| SYBR Green qPCR | Aggregatibacter actinomycetemcomitans | 520 gene copies (10x more sensitive than conventional PCR). | High (no cross-reaction with negative control bacteria). | Tm of 78.02°C for hbpA gene amplicon. | [68] |
| SYBR Green qPCR | SARS-CoV-2 | Similar to commercial TaqMan, but with risk of missing very low viral load in pooled samples. | 97% (in a multiplex format with melt curve analysis). | A reliable, lower-cost alternative to commercial kits. | [69] [70] |
| TaqMan qPCR | Entamoeba histolytica | 50% positivity rate in liver abscess pus. | High (targets 18S rRNA). | Significantly higher detection rate than SYBR Green (38%) and nested multiplex PCR (34%). | [71] |
| Conventional PCR | Blastocystis spp. | Lower than SYBR Green qPCR (52% sensitivity for xenic culture vs. qPCR). | Requires post-PCR processing (gel electrophoresis), increasing contamination risk. | Less sensitive than molecular methods; time-consuming. | [6] |
| Conventional PCR | SARS-CoV-2 | 93% positivity vs. 98.42% for SYBR Green; detected until 10^7 dilution. | No cross-reactivity with other respiratory viruses. | Less sensitive than the gold standard but a viable low-cost option. | [72] |
A comparative analysis of key diagnostic parameters further clarifies the operational characteristics of each method, which is vital for selecting the appropriate assay for a research or diagnostic goal.
Table 2: Comparison of Key Diagnostic PCR Method Parameters
| Parameter | SYBR Green qPCR | TaqMan qPCR | Conventional PCR |
|---|---|---|---|
| Quantification | Yes | Yes | No (qualitative) |
| Throughput | High | High | Low |
| Speed | Fast (closed-tube) | Fast (closed-tube) | Slow (requires gel electrophoresis) |
| Cost | Low | High | Very Low |
| Ease of Use | Moderate (requires melt curve optimization) | Easy | Easy |
| Multiplexing Capability | Limited (with melt curve analysis) | Excellent | Possible, but complex |
| Risk of Contamination | Low (closed-tube) | Low (closed-tube) | High (post-PCR handling) |
Experimental Protocols for Blastocystis Subtyping
DNA Extraction from Stool Samples
- Sample Preparation: Homogenize 200 mg of stool sample.
- Extraction Method: Use a commercial DNA stool mini kit (e.g., Qiagen DNA Stool Minikit) according to the manufacturer's instructions.
- Elution: Elute the extracted DNA in a final volume of 200 µL.
- Storage: Store DNA extracts at -20°C until PCR analysis [6].
SYBR Green qPCR Assay for Detection and Subtyping
This protocol is adapted from methods validated for Blastocystis and other pathogens [6] [69].
- Primer Design: Target a ~600 bp region of the small subunit ribosomal RNA (SSU rRNA) gene. Use a forward primer of broad eukaryotic specificity (e.g., RD5) and a Blastocystis-specific reverse primer (e.g., BhRDr) for "barcoding" [11].
- Reaction Setup:
- Master Mix: 10 µL of 2x SYBR Green Master Mix (e.g., SensiFAST SYBR No-ROX).
- Primers: 0.6 µL of each primer (0.25 µM final concentration each).
- Template: 5 µL of extracted DNA.
- Nuclease-free Water: to a final volume of 20 µL.
- Thermal Cycling Conditions:
- Reverse Transcription: 45°C for 10 min (if using a one-step RT-PCR kit for RNA viruses).
- Initial Denaturation: 95°C for 2 min.
- Amplification (40 cycles):
- Denaturation: 95°C for 5 sec.
- Annealing/Extension: 60°C for 20 sec.
- Melt Curve Analysis: 65°C to 95°C, with incremental increases of 0.5°C.
- Post-Amplification Analysis:
- Check the melt curve for a single, specific peak to confirm amplification specificity.
- Sequence the PCR product directly and submit the sequence to the Blastocystis MLST database (pubmlst.org/blastocystis) for subtype and allele identification [11].
Performance Validation
- Specificity: Verify that the assay produces a single, sharp melt peak. Test against DNA from other common intestinal parasites (e.g., Giardia intestinalis, Entamoeba histolytica/dispar) to ensure no cross-reactivity [6].
- Sensitivity: Determine the limit of detection using serial dilutions of a known positive control or a standardized plasmid. The assay should detect down to a few gene copies per reaction [63].
The workflow for the detection and subtyping of Blastocystis using the SYBR Green qPCR method is summarized in the following diagram:
The Scientist's Toolkit: Essential Research Reagents
Table 3: Key Research Reagent Solutions for SYBR Green-based Blastocystis Subtyping
| Reagent / Material | Function / Application | Examples / Specifications |
|---|---|---|
| DNA Extraction Kit | Isolation of high-quality genomic DNA from complex stool samples. | Qiagen DNA Stool Minikit; guanidinium isothiocyanate phenol-based methods. |
| SYBR Green Master Mix | Core reagent for qPCR, containing enzyme, buffer, dNTPs, and dye. | SensiFAST SYBR No-ROX One-Step Kit; QuantiFast SYBR Green PCR Kit. |
| SSU rRNA Primers | Specific amplification of the Blastocystis "barcode" region for subtyping. | RD5 (forward: 5'-GGA AGT AAA AGT CGT AAC AAG G-3') and BhRDr (reverse). |
| Positive Control DNA | Assay validation and run-to-run quality control. | DNA from known Blastocystis subtypes (e.g., ST1-ST4) [6] [11]. |
| Thermal Cycler | Instrument for performing real-time PCR with melt curve analysis. | Instruments compatible with SYBR Green chemistry (e.g., ABI 7500, Bio-Rad CFX). |
| Sanger Sequencing Service | Determination of the nucleotide sequence of the qPCR amplicon. | External or in-house facility for Sanger sequencing. |
| Blastocystis MLST Database | Public repository for subtype and allele identification. | pubmlst.org/blastocystis [11]. |
The consolidated data from multiple studies indicate that SYBR Green qPCR presents a compelling alternative for Blastocystis subtyping research. Its primary advantage lies in its superior sensitivity compared to conventional methods like microscopy, culture, and conventional PCR [6]. While TaqMan assays may occasionally show marginally higher detection rates in some specific applications [71], the SYBR Green method provides a much more cost-effective solution without sacrificing robustness [69] [72]. The integration of melting curve analysis ensures amplicon specificity, mitigating the primary drawback of dye-based chemistry [69] [70]. Furthermore, the "barcoding" approach, which involves sequencing the SYBR Green qPCR product, enables high-resolution subtyping and allele identification, which is critical for advancing our understanding of Blastocystis epidemiology and pathogenesis [11]. For research laboratories, especially those conducting large-scale screening and subtyping studies, the SYBR Green qPCR protocol offers an optimal combination of performance, cost-efficiency, and detailed genetic characterization.
Molecular tools are indispensable for accurate epidemiological surveillance of Blastocystis sp., a common gut protist with undefined pathogenicity. SYBR Green real-time PCR followed by high-resolution melting (HRM) analysis or sequencing provides a powerful, cost-effective protocol for detecting this parasite and determining its subtype (ST) distribution in population studies [10]. This application note details integrated methodologies that leverage this protocol to elucidate true prevalence and transmission dynamics across human, animal, and environmental reservoirs, which is a core objective of the One Health approach [3] [73].
Key Epidemiological Findings from Recent Field Studies
Recent field studies employing molecular diagnostics have revealed a high prevalence and diverse subtype distribution of Blastocystis in various hosts and geographical regions, challenging the sensitivity of traditional microscopy.
Table 1: Summary of Recent Epidemiological Findings on Blastocystis Prevalence and Subtypes
| Study Population / Location | Sample Size (n) | Prevalence (Method) | Predominant Subtype(s) Identified | Key Epidemiological Insight |
|---|---|---|---|---|
| Shepherd Dogs / Portugal [22] [17] | 50 | 60.0% (qPCR+sequencing) | ST1-ST4, ST14 (Zoonotic mix) | High frequency of mixed infections, suggesting dogs as intermediaries in cross-species transmission. |
| Humans & Animals / Iran [10] | 730 (total) | Not specified (HRM) | ST3 (28%, most common in humans), ST7 (30%, most common in animals) | ST1-ST3 found in domesticated animals, indicating cross-species transmission. |
| Humans / Rural Panama [74] | 66 | 74.2% (PCR) | ST1 (42.2%), ST3 (31.8%) | Recent diarrhea was significantly associated with Blastocystis infection. |
| Humans / Egypt [45] | 54 (symptomatic) | Not specified (PCR/HRM) | ST3 (54.7%), ST4 (27.8%), ST1 (18.5%) | ST3 was discriminated into wild, mutant, and heterozygous intrasubtypes. |
| Rural Community / Türkiye [73] | 469 (total) | 76.6% in humans, 71-78% in livestock, 38% in environment (qPCR/sequencing) | ST3 (humans), ST10 (livestock) | Demonstrates a high circulation of Blastocystis in a One Health context. |
Detailed Experimental Protocol for Prevalence and Subtyping
This section provides a detailed workflow for conducting epidemiological studies on Blastocystis, from sample collection to data analysis.
Sample Collection and DNA Extraction
- Sample Collection: Collect fresh stool samples from human or animal subjects. For human studies, informed consent and ethical approval are mandatory [73] [74]. Store samples immediately at -20°C or in DNA/RNA stabilization buffers [73].
- DNA Extraction: Use commercial kits designed for stool DNA isolation, such as the QIAamp DNA Stool Mini Kit (Qiagen) or the FavorPrep Stool DNA Isolation Mini Kit [22] [74]. Automated extraction systems like QIAcube can enhance reproducibility [22]. Extract DNA from 140-200 mg of stool material [22] [6].
SYBR Green qPCR and HRM Analysis for Detection and Subtyping
This core protocol allows for sensitive detection and preliminary subtyping in a single, closed-tube assay.
- Primer Selection: Use primers targeting a ~300 bp fragment of the small subunit ribosomal RNA (SSU rRNA) gene. The primer pair BL18SPPF1 (5′-AGTAGTCATACGCTCGTCTCAAA-3′) and BL18SR2PP (5′-TCTTCGTTACCCGTTACTGC-3′) is well-established [22] [74].
- qPCR Reaction Setup:
- Thermocycling Conditions:
- Initial Denaturation: 95°C for 15 min (for hot-start polymerase activation).
- Amplification: 40 cycles of:
- Denaturation: 95°C for 15 seconds.
- Annealing: 60°C for 30 seconds.
- Extension: 72°C for 30 seconds.
- High-Resolution Melting (HRM): Immediately after amplification, run the HRM curve analysis. The protocol should include:
- Data Interpretation: The distinct melting temperatures (Tm) of the amplicons generated from different subtypes allow for discrimination. Samples are grouped based on their HRM curve profiles and compared to known reference controls (ST1-ST4, etc.) [10].
Confirmatory Sequencing and Subtype Identification
For definitive subtype identification, especially with mixed infections, sequencing is required.
- Amplicon Purification: Purify qPCR products using a commercial PCR purification kit [22].
- Sequencing: Perform Sanger sequencing or next-generation sequencing (NGS). Targeted-amplicon NGS, using platforms like Oxford Nanopore Technologies (ONT), is highly effective for resolving mixed infections [22].
- Subtype Assignment:
- Sanger Sequences: Edit and align sequences using software like BioEdit. Compare consensus sequences to the NCBI GenBank database using BLASTn [22].
- Standardized Typing: For higher resolution, submit sequences to the Blastocystis ST (18S) and MLST database (pubmlst.org/blastocystis) for subtype and allele identification [11].
The following workflow diagram illustrates the complete protocol from sample to result:
The Scientist's Toolkit: Essential Research Reagents and Materials
Table 2: Key Research Reagent Solutions for SYBR Green-based Blastocystis Research
| Item | Function / Application | Example Products / Specifications |
|---|---|---|
| DNA Extraction Kit | Isolation of high-quality genomic DNA from complex stool matrices. | QIAamp DNA Stool Mini Kit (Qiagen), FavorPrep Stool DNA Isolation Mini Kit [10] [74]. |
| SYBR Green Master Mix | Core reagent for real-time PCR amplification and fluorescence detection. | Xpert Fast SYBR (Uni) Blue mix (GRiSP), HOT FIREPol EvaGreen HRM Mix (Solis BioDyne) [22] [10]. |
| SSU rRNA Primers | Specific amplification of the Blastocystis target gene for detection and subtyping. | BL18SPPF1 / BL18SR2PP (targeting ~300 bp) [22] [74]. |
| Reference Controls | Positive controls for qPCR/HRM and subtype validation. | DNA from known Blastocystis subtypes (ST1-ST4); available from research institutes or culture collections [6]. |
| Next-Generation Sequencer | High-resolution identification of subtypes and mixed infections. | Oxford Nanopore Technologies (ONT) PromethION for targeted-amplicon sequencing [22]. |
| Bioinformatics Software | Sequence analysis, alignment, and phylogenetic assignment. | BioEdit Sequence Alignment Editor, BLASTn, PubMLST database submission portal [22] [11]. |
The integration of SYBR Green qPCR/HRM with sequencing provides a robust and scalable framework for epidemiological studies on Blastocystis. This combined protocol enables researchers to accurately uncover the true prevalence and complex distribution of subtypes in populations, which is critical for advancing our understanding of its transmission dynamics and public health significance within a One Health paradigm.
The correlation between parasite load and clinical outcomes represents a critical frontier in the study of parasitic diseases, enabling more accurate diagnosis, prognosis, and treatment monitoring. Quantitative molecular techniques, particularly SYBR Green-based real-time PCR (qPCR), have revolutionized this field by providing sensitive, specific, and reproducible methods for quantifying pathogen burden directly from clinical samples [6] [75]. For intracellular parasites like Blastocystis spp., understanding the relationship between parasite burden and disease manifestation is complicated by factors including genetic diversity among subtypes, host immune status, and the presence of co-infections [6] [76] [45]. The integration of parasite quantification with subtyping methodologies provides a powerful tool for elucidating the clinical relevance of different parasitic strains and their potential associations with symptomatic disease.
Research has demonstrated that quantitative approaches offer significant advantages over traditional diagnostic methods. For instance, in the detection of Blastocystis, qPCR has shown markedly superior sensitivity (97.8%) compared to direct-light microscopy (29%) and xenic in vitro culture (52%) [6]. This enhanced detection capability is crucial for establishing accurate correlations between parasite burden and clinical presentations, particularly for parasites like Blastocystis that can present with both symptomatic and asymptomatic infections [17] [45]. The following sections explore the quantitative evidence linking parasite load to clinical outcomes, detailed protocols for implementation, and analytical frameworks for data interpretation within the context of Blastocystis research.
Quantitative Evidence: Linking Parasite Burden to Clinical Manifestations
Evidence from Clinical and Experimental Studies
Accumulating evidence from clinical studies and experimental models strongly supports the correlation between parasite load and clinical outcomes across various parasitic diseases. In equine piroplasmosis, caused by Theileria equi and Babesia caballi, clinically infected horses demonstrated significantly higher parasite loads alongside lower mean packed cell volume (PCV) compared to subclinically infected animals [77]. This inverse relationship between parasite burden and hematological parameters enabled researchers to establish specific quantitative cut-off values to distinguish clinical from subclinical infections, providing a diagnostic tool for veterinarians [77].
In human intestinal parasites, similar trends have been observed. Studies on Blastocystis have revealed that certain genetic subtypes (STs) and intrasubtype variants demonstrate varying associations with clinical presentation and pathogenicity [45]. For example, experiments in rat models demonstrated that rats infected with Blastocystis ST1 and wild ST3 developed precancerous colonic polyps in 40.5% of cases, with specific immune perturbations including decreased goblet cell numbers, weakened MUC2 mucin expression, and elevated intraepithelial lymphocytes [45]. These findings suggest that quantification of both parasite load and subtype can provide valuable insights into disease risk and progression.
The table below summarizes key findings from recent studies investigating parasite load and clinical correlations:
Table 1: Correlation Between Parasite Load and Clinical Outcomes Across Studies
| Parasite Species | Clinical Correlation | Key Findings | Reference |
|---|---|---|---|
| Blastocystis spp. | Digestive symptoms | No direct correlation found with immune status or parasite load alone, but specific subtypes (ST4) showed high prevalence (63%) in symptomatic cases. | [6] |
| Theileria equi | Equine piroplasmosis | Clinical cases showed significantly higher parasite loads and lower PCV; genotype A associated with clinical disease. | [77] |
| Blastocystis ST1, ST3 | Precancerous polyps (rat model) | 40.5% of infected rats developed polyps, with ST1 (14.7%) and wild ST3 (12.9%) showing strongest associations. | [45] |
| Leishmania spp. | Cutaneous leishmaniasis | Higher parasite burden in early lesions, decreasing with lesion size; no correlation with IgG response. | [78] |
| Plasmodium spp. + STH coinfection | Malaria severity & anemia | Coinfected patients had higher mean parasitemia (40,093.54 parasites/μL) vs. monoinfected; associated with worse anemia. | [76] |
The Impact of Co-infections and Genetic Variation
The relationship between parasite load and clinical outcome is further complicated by the presence of co-infections and genetic variation among parasite strains. Research on malaria and soil-transmitted helminth (STH) co-infections revealed that patients with concurrent infections exhibited dramatically higher mean parasitemia (40,093.54 parasites/μL) compared to those with malaria monoinfection [76]. This parasite burden exacerbation was particularly associated with hookworm and Trichuris trichiura infections, highlighting how parasite interactions can influence clinical severity [76].
Genetic diversity among Blastocystis subtypes introduces another layer of complexity in correlating parasite load with clinical outcomes. Molecular studies have identified at least 17 subtypes in humans, with ST1-ST4 comprising the majority of infections [17] [45]. However, the distribution of these subtypes varies geographically and by host species, with shepherd dogs in Portugal, for example, showing high occurrence (60%) of zoonotic subtypes ST1-ST4 and ST14, suggesting their potential role in cross-species transmission [17]. Beyond subtype-level differences, intra-subtype genetic variations identified through high-resolution melting (HRM) curve analysis have revealed differing pathogenic potentials, with wild and mutant variants of ST3 showing distinct associations with precancerous polyp formation in experimental models [45].
Table 2: Blastocystis Subtypes and Their Clinical Associations
| Subtype | Prevalence in Humans | Clinical Associations | Zoonotic Potential |
|---|---|---|---|
| ST1 | Common (~18.5% of symptomatic cases) | Associated with precancerous polyps in rat models; weak MUC2 immunostaining. | High (found in humans, dogs, sheep) |
| ST2 | Common | Frequently detected in humans and animals. | High |
| ST3 | Most prevalent (~54.7% of symptomatic cases) | Wild and mutant intrasubtypes associated with polyps in rats; triggers specific mucosal immune changes. | Moderate |
| ST4 | Common (~27.8% of symptomatic cases), mainly in Europe | High prevalence (63%) in symptomatic immunocompromised patients; less associated with polyps. | High (found in humans and shepherd dogs) |
| ST5-ST9 | Rare in humans | ST6, ST7 considered avian subtypes, rarely found in Western human populations. | Variable |
SYBR Green qPCR Protocol for Parasite Quantification and Subtyping
DNA Extraction and Quality Control
Proper nucleic acid extraction is fundamental for accurate parasite quantification. For Blastocystis detection in stool samples, begin with 200 mg of stool specimen processed using a commercial DNA extraction kit such as the QIAamp DNA Stool Mini Kit (Qiagen) [6]. Mechanical disruption through bead beating or vigorous vortexing is recommended to ensure complete lysis of cyst forms. For other sample types like whole blood (for hemoparasites) or tissue biopsies, adjust the starting material to 200 μL or 25 mg, respectively [79] [78]. After extraction, DNA should be eluted in a final volume of 200 μL of elution buffer or RNase-free water [6] [17]. DNA quality and concentration should be verified using spectrophotometry (A260/A280 ratio of ~1.8-2.0 is optimal), and extracts should be stored at -20°C until qPCR analysis.
To control for potential PCR inhibition, include an internal process control (IPC) in each reaction [75]. This can be constructed by adding a known quantity of phage lambda DNA to the master mix, which is co-amplified with the target using separate primers and detected with a differently labeled probe [75]. For a cost-effective alternative without multiplexing capability, perform a spike-in experiment by adding a known amount of target DNA to a subset of samples and comparing Cq values to expected results. Consistent delays in Cq (≥2 cycles) indicate potential inhibition that may require DNA dilution or additional purification.
Primer Design and Validation
Primer design is a critical factor in the success of SYBR Green qPCR assays. For Blastocystis detection and subtyping, primers should target the small subunit ribosomal RNA (SSU rRNA) gene, which contains both conserved regions for genus-level detection and variable regions for subtype discrimination [6] [75]. The amplicon size should be optimized for qPCR efficiency, ideally between 80-250 bp [42]. A commonly used primer pair is BL18SPPF1 (5'-GGTCCGGTGAACACTTTGGATTT-3') and BL18SR2PP (5'-CCTACGGAAACCTTGTTACGACTTCA-3'), which produces an approximately 300 bp fragment suitable for both quantification and subsequent melting curve analysis [17].
Before implementing a new primer set, validate its performance using DNA from reference strains representing all known subtypes (ST1-ST9 for Blastocystis) to ensure broad detection capability [6] [75]. Specificity should be confirmed against DNA from other common intestinal parasites (e.g., Giardia intestinalis, Entamoeba histolytica, Entamoeba dispar) and human genomic DNA to exclude cross-reactivity [6]. Determine the optimal primer concentration through titration (typically 100-500 nM final concentration), selecting the lowest concentration that yields the lowest Cq value without promoting primer-dimer formation [42].
qPCR Reaction Setup and Thermal Cycling
The following protocol is optimized for SYBR Green-based detection of Blastocystis on most real-time PCR instruments, with specific notes for platform-specific modifications:
Table 3: qPCR Reaction Setup for SYBR Green-Based Detection
| Component | Volume per 50 μL Reaction | Final Concentration |
|---|---|---|
| 2X SYBR GreenER qPCR SuperMix Universal | 25 μL | 1X |
| Forward Primer (10 μM) | 1 μL | 200 nM |
| Reverse Primer (10 μM) | 1 μL | 200 nM |
| ROX Reference Dye (if required by instrument) | 0.1-1 μL (see instrument guidelines) | 50-500 nM |
| Template DNA | 5-10 μL | Up to 100 ng genomic DNA equivalent |
| Nuclease-free Water | To 50 μL | - |
For platforms requiring normalization, ROX reference dye should be included according to manufacturer recommendations: 1.0 μL for ABI 7000/7300/7700/7900HT instruments (500 nM final) or 0.1 μL (50 nM final) for ABI 7500 and Stratagene Mx3000P/Mx3005P/Mx4000 systems [42]. For the Bio-Rad iCycler, use fluorescein as a reference dye instead of ROX, with a final concentration of 50 nM [42].
After assembling reactions, use the following thermal cycling conditions:
- UDG Incubation: 50°C for 2 minutes (activates uracil-DNA glycosylase to prevent carryover contamination)
- Polymerase Activation: 95°C for 10 minutes (also inactivates UDG)
- Amplification (40 cycles):
- Denaturation: 95°C for 15 seconds
- Annealing/Extension: 60°C for 60 seconds (with fluorescence acquisition)
- Melting Curve Analysis:
- 95°C for 15 seconds
- 60°C for 60 seconds
- Gradual increase to 95°C (with continuous fluorescence acquisition) [42]
Melting Curve Analysis for Subtype Identification
Following amplification, melting curve analysis provides a powerful method for preliminary subtype identification without the need for sequencing. Slowly ramp the temperature from 60°C to 95°C while continuously monitoring fluorescence, generating a dissociation curve for each sample [17] [45]. Plot the negative derivative of fluorescence (-dF/dT) against temperature to identify characteristic melting temperatures (Tm) for different Blastocystis subtypes. Include reference strains with known subtypes in each run to establish Tm values for subtype calling. For samples showing multiple melting peaks, consider the possibility of mixed-subtype infections, which can be further investigated using targeted-amplicon next-generation sequencing (NGS) [17].
Figure 1: Workflow for SYBR Green qPCR-Based Parasite Quantification and Subtyping
Data Analysis and Interpretation
Calculating Parasite Load and Efficiency Correction
The quantification cycle (Cq) value obtained from qPCR analysis must be properly interpreted to derive meaningful biological information about parasite load. The basic relationship between Cq and starting template concentration is described by the equation:
N = Nq × E^(-Cq)
Where N is the starting quantity of target DNA, Nq is the quantification threshold, E is the amplification efficiency, and Cq is the quantification cycle [80]. This relationship demonstrates that Cq values are highly dependent on PCR efficiency, which must be determined for each assay using a standard curve with known template concentrations. Amplification efficiency is calculated from the slope of the standard curve using the formula:
E = 10^(-1/slope)
An ideal efficiency of 2.0 (100% amplification per cycle) corresponds to a slope of -3.32 [80]. Efficiency values between 1.8 and 2.1 (90-105%) are generally acceptable. For absolute quantification of parasite load, include a standard curve with known concentrations of a reference plasmid containing the target sequence in each run. For relative quantification (e.g., comparing parasite load between samples), the ΔΔCq method can be used with a reference gene for normalization, though this is less common for parasite quantification where absolute numbers are typically more clinically relevant.
Quality Control and Validation Parameters
Robust quality control measures are essential for generating reliable parasite load data. Include the following controls in each qPCR run:
- No-template controls (NTC): To detect contamination or primer-dimer formation
- Positive controls: DNA from reference strains to monitor assay performance
- Inhibition controls: Sample spikes to identify PCR inhibitors
- Inter-plate calibrators: For normalizing results across multiple runs
After amplification, carefully analyze melting curves to verify reaction specificity. Single, sharp peaks indicate specific amplification, while multiple peaks or broad peaks may suggest primer-dimer formation or non-specific amplification [80] [42]. Reactions with abnormal melting profiles should be repeated or excluded from analysis. The sensitivity (limit of detection) and linear range of the assay should be established during validation using serial dilutions of positive control material. For clinical applications, establish the clinical cut-off values that differentiate between subclinical and clinically significant parasite loads, as demonstrated in piroplasmosis research where specific quantification thresholds effectively distinguished clinical from subclinical infections [77].
Figure 2: Factors Influencing Cq Values and Accurate Parasite Quantification
Essential Reagents and Research Solutions
Successful implementation of parasite quantification protocols requires specific reagents and materials optimized for SYBR Green-based qPCR applications. The following table details key components and their functions in the experimental workflow:
Table 4: Essential Research Reagents for SYBR Green qPCR Parasite Quantification
| Reagent/Material | Function | Examples/Specifications |
|---|---|---|
| SYBR GreenER qPCR SuperMix Universal | Ready-to-use master mix containing hot-start Taq polymerase, SYBR GreenER dye, dNTPs (with dUTP), UDG, and optimized buffers. | Thermo Fisher Scientific catalog #; includes ROX reference dye for instrument normalization. |
| DNA Extraction Kit | Purification of high-quality, inhibitor-free DNA from complex clinical samples. | QIAamp DNA Stool Mini Kit (Qiagen), suitable for stool samples; other kits optimized for blood or tissue. |
| Reference Strain DNA | Positive controls for assay validation and quantification standards. | DNA from Blastocystis subtypes ST1-ST9; ensures broad detection capability. |
| Primer Sets | Specific amplification of target sequences in SSU rRNA gene. | BL18SPPF1/BL18SR2PP (300 bp amplicon); validated for detection and melting curve analysis. |
| ROX Reference Dye | Normalization of fluorescent signal between reactions on compatible instruments. | Included with SYBR GreenER SuperMix; used at 50-500 nM final concentration depending on instrument. |
| Microtiter Plates and Seals | Reaction vessels compatible with real-time PCR instruments. | Clear optical plates and seals; ensure proper optical clarity for fluorescence detection. |
The integration of SYBR Green qPCR methodologies for parasite quantification with subtyping approaches represents a significant advancement in parasitology research. The correlation between parasite load and clinical outcomes, modulated by factors such as parasite genetics and host immune status, provides valuable insights for understanding disease mechanisms, improving diagnostic accuracy, and guiding therapeutic interventions. The protocols and analytical frameworks presented here offer researchers comprehensive tools for implementing these powerful techniques in their investigation of Blastocystis and other parasitic organisms. As quantification technologies continue to evolve, together with growing understanding of genetic diversity among parasite populations, these approaches will undoubtedly yield increasingly refined correlations between parasitic infection and clinical disease.
This application note details a streamlined workflow that integrates SYBR Green-based quantitative PCR (qPCR) for the initial detection of Blastocystis sp. with subsequent targeted-amplicon Next-Generation Sequencing (NGS) for comprehensive subtyping. This combined approach efficiently identifies positive samples and characterizes complex subtype compositions, including mixed infections, which are often missed by conventional methods. The protocol is designed for researchers investigating the epidemiology and zoonotic transmission of this common gut protist.
Recent studies demonstrate the power of this integrated method. Research on Portuguese shepherd dogs, which are potential intermediaries in zoonotic transmission, used this pipeline to reveal a high 60% occurrence of Blastocystis and to identify multiple zoonotic subtypes (ST1, ST2, ST3, ST4, and ST14) within the population [22]. The use of NGS following qPCR screening was critical for detecting mixed infections and understanding the full diversity of subtypes present in individual hosts [22].
Blastocystis sp. is a widespread anaerobic protist found in the gastrointestinal tracts of humans and a vast range of animals [6]. Its pathogenic role remains debated, though it is associated with non-specific gastrointestinal symptoms in some hosts [22]. Molecular characterization has revealed significant genetic diversity, with at least 44 subtypes (STs) identified based on the small subunit ribosomal RNA (SSU rRNA) gene [81]. Subtypes ST1-ST4 are responsible for over 90% of human infections, but many other subtypes found in animals have zoonotic potential [22] [82].
Traditional parasitological diagnostic methods, such as direct-light microscopy (DLM) and xenic in vitro culture (XIVC), lack sensitivity and are time-consuming [6]. A tiered molecular approach overcomes these limitations:
- qPCR as a Screening Tool: SYBR Green qPCR provides a rapid, sensitive, and quantitative high-throughput screen to identify Blastocystis-positive samples from a large collection.
- NGS for Deep Subtyping: Targeted-amplicon NGS on qPCR-positive samples delivers high-resolution subtyping, capable of discerning mixed-strain infections that Sanger sequencing often cannot resolve [22] [82].
The following diagram illustrates the integrated qPCR and NGS workflow for Blastocystis detection and subtyping.
Key Experimental Data from Integrated Workflows
The implementation of this qPCR-to-NGS pipeline in field and clinical studies has generated robust epidemiological data, as summarized in the table below.
Table 1: Findings from Selected Studies Using a qPCR and NGS Workflow for Blastocystis Detection
| Study Population | Sample Size (n) | qPCR Prevalence | Predominant Subtypes Identified via NGS | Key Finding |
|---|---|---|---|---|
| Portuguese Shepherd Dogs [22] | 50 | 60% (30/50) | ST1, ST2, ST3, ST4, ST14 | Frequent mixed infections; potential role in cross-species transmission. |
| Honduran Rural Children [7] | 95 | 71.6% (68/95) | Not Specified (Assay detects ST1-10) | Strong positive correlation between Blastocystis DNA load and age. |
| Czech Zoo NPHs & Caregivers [82] | 179 (Total) | 54.7% (98/179) | ST1-ST5, ST7, ST8, ST47, ST48 | Identification of two novel subtypes (ST47, ST48); evidence of zoonotic transmission. |
Detailed Experimental Protocols
SYBR Green-Based qPCR for Screening
This protocol is adapted from established methods for sensitive detection of Blastocystis directly from stool samples [22] [6].
Reagents and Equipment
- Primers: BL18SPPF1 (5'-AGTAGTCATACGCTCGTCTCAAA-3') and BL18SR2PP (5'-TCTTCGTTACCCGTTACTGC-3'), targeting a ~300 bp fragment of the SSU rRNA gene [22] [7].
- qPCR Master Mix: Commercial SYBR Green master mix (e.g., Xpert Fast SYBR (Uni) Blue mix).
- Template DNA: Extracted from 140-200 mg of stool using a commercial DNA extraction kit (e.g., QIAamp DNA Mini Kit on QIAcube platform) [22] [6].
- Equipment: Real-time PCR thermocycler with melting curve analysis capability (e.g., Bio-Rad T100 or Applied Biosystems ViiA 7) [22] [7].
Step-by-Step Procedure
Reaction Setup:
- Prepare reactions in a total volume of 20 µL, containing 1x SYBR Green master mix, a predetermined optimal concentration of forward and reverse primers (e.g., 0.5 µM each), and 2-5 µL of template DNA.
- Include no-template controls (NTC) and positive controls (e.g., DNA from a known Blastocystis culture) in each run.
Thermocycling Conditions:
- Initial Denaturation: 95°C for 3-5 minutes.
- 40-45 cycles of:
- Denaturation: 95°C for 15-30 seconds.
- Annealing/Extension: 60°C for 30-60 seconds (acquire fluorescence signal at the end of this step).
- Melting Curve Analysis:
- After amplification, heat from 60°C to 95°C with a continuous fluorescence measurement.
Data Analysis:
- Determine the cycle threshold (Ct) values for samples. A sample with a Ct value below a predetermined cutoff (established with positive controls) is considered positive.
- Analyze the melting curve to ensure specificity of the amplicon. A single, sharp peak indicates a specific product.
Targeted-Amplicon NGS for Subtyping
This protocol uses the same qPCR amplicons for library preparation, streamlining the transition from screening to subtyping [22].
Reagents and Equipment
- Libraries: Prepared directly from qPCR amplicons that showed the expected melting temperature.
- Library Prep Kit: A kit suitable for the chosen NGS platform (e.g., Oxford Nanopore Technologies (ONT) native barcoding kit).
- Sequencing Platform: High-throughput sequencer (e.g., ONT PromethION 24 or PacBio Sequel) [22] [82].
- Purification Kits: Solid-phase reversible immobilization (SPRI) beads for clean-up.
Step-by-Step Procedure
Amplicon Purification and Normalization:
- Purify the remaining qPCR amplicons using a commercial PCR purification kit (e.g., GRS PCR and Gel Band Purification Kit).
- Quantify the DNA concentration using a fluorometric method and normalize samples to an equimolar concentration.
Library Preparation:
- Following the manufacturer's instructions for your NGS platform, fragment (if necessary), end-repair, and A-tail the amplicons.
- Ligate platform-specific sequencing adapters and unique barcodes to each sample to enable multiplexing.
- Perform a final library clean-up and quality assessment.
Sequencing and Bioinformatics:
- Pool the barcoded libraries and load onto the sequencer for a run sufficient to achieve high coverage per amplicon.
- Bioinformatic Analysis:
- Demultiplex reads by barcode.
- Perform quality filtering and trimming.
- Cluster high-quality reads into operational taxonomic units (OTUs) or map them to a reference database of known Blastocystis SSU rRNA sequences.
- Assign subtypes based on ≥ 97-99% sequence identity to reference subtypes. The presence of multiple subtypes in a single sample indicates a mixed infection [22] [82].
The Scientist's Toolkit: Research Reagent Solutions
Table 2: Essential Reagents and Kits for the qPCR-NGS Workflow
| Item | Function in the Workflow | Example Product / Specification |
|---|---|---|
| DNA Extraction Kit | Purifies high-quality, inhibitor-free genomic DNA from complex stool matrices. | QIAamp DNA Mini Kit (Qiagen) [22] |
| SYBR Green Master Mix | Provides all components (polymerase, dNTPs, buffer, dye) for sensitive, real-time PCR detection. | Xpert Fast SYBR (Uni) Blue mix (GRiSP) [22] |
| SSU rRNA Primers | Amplifies a variable region of the SSU rRNA gene for both detection and subtyping. | BL18SPPF1 / BL18SR2PP [22] [7] |
| NGS Library Prep Kit | Prepares amplicons for sequencing by adding platform-specific adapters and sample barcodes. | ONT Native Barcoding Kit [22] |
| Blastocystis Culture Medium | Provides a source for positive control DNA and enables strain isolation. | Modified Jones' medium, IMDM [6] [81] |
Conclusion
The optimized SYBR Green qPCR protocol presented herein establishes a sensitive, specific, and cost-effective method for the detection and subtyping of Blastocystis. It successfully addresses the critical need for standardized molecular diagnostics, overcoming the limitations of conventional techniques. By enabling accurate parasite quantification and high-resolution subtyping, this approach is pivotal for clarifying the clinical significance of different Blastocystis subtypes, investigating their potential pathogenicity, and understanding transmission dynamics within a One Health framework. Future directions should focus on the development of international standard materials, the creation of comprehensive subtype databases, and the application of these tools in large-scale molecular epidemiological studies to unravel the complex interactions between Blastocystis subtypes, the gut microbiome, and host health, ultimately informing new therapeutic strategies.
References
- 1. Single-celled organisms set for greater role in gut health [https://www.nature.com/articles/d41586-025-01916-0]
- 2. Advancing research on Blastocystis through a One ... [https://pmc.ncbi.nlm.nih.gov/articles/PMC11294803/]
- 3. A protocol for mapping Blastocystis epidemiology and ... [https://pmc.ncbi.nlm.nih.gov/articles/PMC12171710/]
- 4. Blastocystis One Health Approach in a Rural Community of ... [https://www.frontiersin.org/journals/microbiology/articles/10.3389/fmicb.2021.746340/full]
- 5. Blastocystis in the faeces of children from six distant countries [https://parasitesandvectors.biomedcentral.com/articles/10.1186/s13071-021-04859-3]
- 6. Development and Evaluation of a Real-Time PCR Assay ... [https://pmc.ncbi.nlm.nih.gov/articles/PMC3067686/]
- 7. Use of Multi-Parallel Real-Time Quantitative PCR to ... [https://pmc.ncbi.nlm.nih.gov/articles/PMC7253141/]
- 8. Development of a SYBR Green qPCR Intralaboratory ... [https://www.mdpi.com/2813-0464/3/3/22]
- 9. Detection and quantification of Blastocystis sp. using real- ... [https://bio-protocol.org/exchange/minidetail?id=10433207&type=30]
- 10. Detection and subtyping of Blastocystis sp. in human and ... [https://bmcinfectdis.biomedcentral.com/articles/10.1186/s12879-024-10423-y]
- 11. Blastocystis: Genetic diversity and molecular methods for ... [https://pmc.ncbi.nlm.nih.gov/articles/PMC3745667/]
- 12. Molecular prevalence and subtype characteristics of ... [https://www.sciencedirect.com/science/article/pii/S0001706X24002353]
- 13. a systematic review and meta-analysis - Parasites & Vectors [https://parasitesandvectors.biomedcentral.com/articles/10.1186/s13071-022-05351-2]
- 14. Identification and validation of novel Blastocystis subtype ... [https://pubmed.ncbi.nlm.nih.gov/37195413/]
- 15. Identification and Molecular Characterization of Four New ... [https://www.mdpi.com/2076-2607/11/1/46]
- 16. Subtype Identification of Blastocystis sp. Among Humans ... [https://pmc.ncbi.nlm.nih.gov/articles/PMC12477797/]
- 17. Targeted-Amplicon NGS for Blastocystis sp. in Shepherd ... [https://www.mdpi.com/2306-7381/12/4/325]
- 18. Comparison of molecular diagnostic approaches for the ... [https://pmc.ncbi.nlm.nih.gov/articles/PMC9153396/]
- 19. Comparison of molecular diagnostic approaches for the ... [https://pubmed.ncbi.nlm.nih.gov/35638752/]
- 20. Comparison of DNA Extraction Methods and Real-Time ... [https://pmc.ncbi.nlm.nih.gov/articles/PMC7696706/]
- 21. Comparison of DNA Extraction Methods and Real-Time ... [https://www.mdpi.com/2076-2607/8/11/1768]
- 22. Targeted-Amplicon NGS for Blastocystis sp. in Shepherd Dogs ... [https://pmc.ncbi.nlm.nih.gov/articles/PMC12030863/]
- 23. A novel 5-Plex qPCR-HRM assay detecting human ... [https://pmc.ncbi.nlm.nih.gov/articles/PMC7257150/]
- 24. Development and Validation of a SYBR Green Real Time ... [https://www.mdpi.com/2076-2615/11/4/1100]
- 25. Assessing Zoonotic Risks of Blastocystis Infection in ... [https://www.mdpi.com/2076-0817/14/8/773]
- 26. Universal SYBR Green qPCR Protocol [https://www.sigmaaldrich.com/US/en/technical-documents/protocol/genomics/qpcr/sybr-green-qpcr?srsltid=AfmBOopxk5OtIFMJ-qMM4DM_kO4WDGW5nKOXNQtZULO0pMUPcnZPFFik]
- 27. Comparative Study of DNA Extraction Methods for the PCR ... [https://www.mdpi.com/2075-4418/12/11/2588]
- 28. A Comparison of Three Automated Nucleic Acid Extraction ... [https://www.mdpi.com/2076-2607/12/12/2417]
- 29. An alternative DNA extraction method for detection of ... [https://www.sciencedirect.com/science/article/abs/pii/S0014489417303739]
- 30. Comparison of Automated and Manual DNA Isolation ... [https://www.sciencedirect.com/science/article/pii/S2472630322015059]
- 31. Molecular Phylogenies of Blastocystis Isolates from ... [https://pmc.ncbi.nlm.nih.gov/articles/PMC540115/]
- 32. Use of Oxford Nanopore MinION to generate full-length ... [https://parasitesandvectors.biomedcentral.com/articles/10.1186/s13071-020-04484-6]
- 33. Identification of Multiple Blastocystis Subtypes in Domestic ... [https://www.frontiersin.org/journals/veterinary-science/articles/10.3389/fvets.2021.732129/full]
- 34. Molecular Detection and Characterization of Blastocystis ... [https://www.mdpi.com/2306-7381/8/9/191]
- 35. Universal SYBR Green qPCR Protocol [https://www.sigmaaldrich.com/US/en/technical-documents/protocol/genomics/qpcr/sybr-green-qpcr?srsltid=AfmBOoq3P4qhJHopuaJ_zbgAsEJWVADuuse2TeFyAW0E0P7I2P9Ypob1]
- 36. Real-time PCR based on SYBR-Green I fluorescence [https://bmcbiotechnol.biomedcentral.com/articles/10.1186/1472-6750-3-18]
- 37. A Simple Genotyping Method for Rapid Differentiation of ... [https://www.mdpi.com/2076-0817/8/1/38]
- 38. A new SYBR Green real-time PCR to detect SARS-CoV-2 [https://www.nature.com/articles/s41598-021-81245-0]
- 39. Development of a SYBR Green-Based Real-Time PCR ... [https://www.mdpi.com/2414-6366/10/5/140]
- 40. Comparison of SYBR I real-time RT- green with conventional... PCR [https://bmcresnotes.biomedcentral.com/articles/10.1186/s13104-016-2037-z]
- 41. Optimization of the real-time PCR platform method using ... [https://www.nature.com/articles/s41598-025-16972-9]
- 42. qPCR SuperMix... | Thermo Fisher Scientific - US SYBR GreenER [https://www.thermofisher.com/us/en/home/references/protocols/nucleic-acid-amplification-and-expression-profiling/pcr-protocol/sybr-greener-qpcr-supermix-universal.html]
- 43. Detection and subtyping of Blastocystis sp. in human and ... [https://pubmed.ncbi.nlm.nih.gov/39910463/]
- 44. Development and evaluation of high-resolution melting ... [https://link.springer.com/article/10.1007/s00436-019-06486-5]
- 45. Levels of Genetic Variants Among Symptomatic ... [https://link.springer.com/article/10.1007/s11686-022-00628-z]
- 46. concern for emerging zoonotic infections | Scientific Reports [https://www.nature.com/articles/s41598-021-96960-x]
- 47. Evaluation of Inhibitor-Resistant Real-Time PCR Methods for ... [https://journals.plos.org/plosone/article?id=10.1371/journal.pone.0073845]
- 48. A SYBR Green RT-PCR assay in single tube to detect human ... [https://pmc.ncbi.nlm.nih.gov/articles/PMC2546391/]
- 49. A SYBR® Green-based real-time PCR method for ... [https://www.sciencedirect.com/science/article/abs/pii/S2213716517300437]
- 50. Optimization of cDNA microarrays procedures using criteria ... [https://pmc.ncbi.nlm.nih.gov/articles/PMC2147032/]
- 51. Interactions between Blastocystis subtype ST4 and gut ... [https://pmc.ncbi.nlm.nih.gov/articles/PMC8902775/]
- 52. Distribution of Blastocystis subtypes isolated from humans ... [https://parasitesandvectors.biomedcentral.com/articles/10.1186/s13071-017-2458-0]
- 53. Development and Application of a Blastocystis Subtype ... [https://pmc.ncbi.nlm.nih.gov/articles/PMC4524157/]
- 54. Experimental colonization with Blastocystis ST4 is ... [https://link.springer.com/article/10.1007/s00018-022-04271-9]
- 55. Universal SYBR Green qPCR Protocol [https://www.sigmaaldrich.com/US/en/technical-documents/protocol/genomics/qpcr/sybr-green-qpcr?srsltid=AfmBOorByCz1BfQDogFyn_Mv_DT3WR2vjuu_7L6EsnbJAP8aEfGYqvql]
- 56. Real-Time PCR: Understanding Ct [https://www.thermofisher.com/us/en/home/life-science/pcr/real-time-pcr/real-time-pcr-learning-center/real-time-pcr-basics/real-time-pcr-understanding-ct.html]
- 57. Trust your SYBR Green qPCR Data [https://www.thermofisher.com/blog/behindthebench/trust-your-sybr-green-qpcr-data/]
- 58. Understanding melt curves for improved SYBR Green ... [https://www.idtdna.com/pages/education/videos/detail/understanding-melt-curves-for-improved-sybr-green-assay-analysis-and-troubleshooting]
- 59. Optimize qPCR Using SYBR Green Assays - Ask TaqMan ... [https://www.thermofisher.com/blog/behindthebench/optimize-qpcr-using-sybr-green-assays-ask-taqman-38/]
- 60. Microbial Typing by Machine Learned DNA Melt Signatures [https://www.nature.com/articles/srep42097]
- 61. Detection and molecular characterization of Blastocystis sp ... [https://www.nature.com/articles/s41598-025-90608-w]
- 62. Detection of Blastocystis in clinical stool specimens using ... [https://pmc.ncbi.nlm.nih.gov/articles/PMC5991034/]
- 63. Development and Validation of a SYBR Green Real Time ... [https://pmc.ncbi.nlm.nih.gov/articles/PMC8069436/]
- 64. Molecular diagnosis and subtyping of Blastocystis sp. [https://pmc.ncbi.nlm.nih.gov/articles/PMC10321588/]
- 65. Diagnosis and subtype analysis of Blastocystis sp.in 442 ... [https://bmcinfectdis.biomedcentral.com/articles/10.1186/1471-2334-13-389]
- 66. Development and evaluation of a genus-specific, probe ... [https://pubmed.ncbi.nlm.nih.gov/22422846/]
- 67. Comparison of SYBR green I real-time RT-PCR with ... [https://pmc.ncbi.nlm.nih.gov/articles/PMC4841946/]
- 68. Development and Comparison of Conventional PCR ... [https://brieflands.com/journals/jjm/articles/18546]
- 69. Development and validation of cost-effective SYBR Green ... [https://www.nature.com/articles/s41598-024-52250-w]
- 70. Development and validation of cost-effective one-step ... [https://www.nature.com/articles/s41598-022-10413-7]
- 71. Comparison of nested-multiplex, Taqman & SYBR Green real ... [https://pmc.ncbi.nlm.nih.gov/articles/PMC4822369/]
- 72. Lower cost alternatives for molecular diagnosis of COVID-19 [https://link.springer.com/article/10.1007/s42770-020-00347-5]
- 73. Blastocystis across humans, animals and the environment ... [https://www.frontiersin.org/journals/microbiology/articles/10.3389/fmicb.2025.1665966/full]
- 74. Prevalence and subtype distribution of Blastocystis sp ... [https://pmc.ncbi.nlm.nih.gov/articles/PMC6997612/]
- 75. Development and Evaluation of a Genus- Specific , Probe-Based... [https://pmc.ncbi.nlm.nih.gov/articles/PMC3372105/]
- 76. Integrated assessment of malaria parasite load, anemia, and ... [https://pmc.ncbi.nlm.nih.gov/articles/PMC12512879/]
- 77. Parasite load and genotype are associated with clinical ... [https://parasitesandvectors.biomedcentral.com/articles/10.1186/s13071-020-04133-y]
- 78. A real-time PCR for quantification of parasite burden and ... [https://www.sciencedirect.com/science/article/abs/pii/S1383576924000163]
- 79. Blood Parasite Load as an Early Marker to Predict ... [https://pmc.ncbi.nlm.nih.gov/articles/PMC8423463/]
- 80. Use and Misuse of Cq in qPCR Data Analysis and Reporting [https://pmc.ncbi.nlm.nih.gov/articles/PMC8229287/]
- 81. Comprehensive Tools for Culturing Blastocystis [https://pmc.ncbi.nlm.nih.gov/articles/PMC12352375/]
- 82. A cross-sectional survey of Blastocystis sp. and ... [https://www.sciencedirect.com/science/article/pii/S2352771424001885]